Phenomenological Modeling of Critical Condensate ...pangea.stanford.edu/~kewenli/spe56014.pdf1...
29
1 Phenomenological Modeling of Critical Condensate Saturation and Relative Permeabilities in Gas Condensate Systems Kewen Li and Abbas Firoozabadi Reservoir Engineering Research Institute (RERI) Abstract The effects of gravity, viscous forces, interfacial tension, and wettability on the critical condensate saturation and relative permeability of gas condensate systems are studied using a phenomenological simple network model. The results from the simple model show that wettability significantly affects both critical condensate saturation and gas phase relative permeability. Gas phase relative permeability at some saturations may increase ten times as contact angle is altered from 0 o (strongly liquid-wet) to 85 o (intermediately gas- wet). The results suggest that gas well deliverability in condensate reservoirs can be enhanced by wettability alteration near the wellbore. Introduction Much attention has been paid to the study of in-situ liquid formation and fluid flow mechanisms in gas condensate systems in recent years. When gas condensate reservoirs are developed by pressure depletion, gas well deliverability is affected by the amount and the distribution of the condensate formed around the wellbore. The understanding of the parameters that affect the distribution and the amount of condensate saturation (S c ) in the wellbore and the effect of these parameters on gas and liquid flow are important in the development of the methods for increased gas deliverability. There are numerous field examples of gas condensate reservoirs that experience a sharp drop in gas well deliverability at high pressures due to condensation near the wellbore. 1-3 There are examples that show that the condensation may even kill gas production. 2 The sharp reduction in gas deliverability may be due to the shape of gas phase relative permeability (k rg ); the mechanisms of gas productivity impairment are not yet clear. Two main parameters affect condensate recovery and gas well deliverability. These two parameters are critical condensate saturation (S cc , which affects liquid recovery) and gas phase relative permeability (k rg , which affects well deliverability). Various authors 4-9 have measured S cc and a wide range of observations has been reported. The measured values of S cc are generally in the range of 10 to 50%. Gravier et al. 4 (1986) measured S cc in low-permeability carbonate cores with permeability in the range of 0.5 to 40 md and interfacial tension (σ) variations from 0.5 to 1.5 dynes/cm. S cc varied from 24.5 to 50.5% with an average of 35.0%. These measurements were conducted in the presence of connate water. Morel et al. 9 (1992) reported a critical condensate saturation of less than 1% for σ = 0.05 dynes/cm and connate water saturation of 20%. The critical condensate saturation was measured in a vertical dolomite core. The measured S cc is apparently related to various effects including gravity and interfacial tension. Some authors have accounted for the effect of gravity by conducting flow experiments both in horizontal and vertical directions. Danesh et al. 10 (1991) studied the effect of gravity on S cc in water-wet micromodels and sandstone cores. They found that S cc in a
Transcript of Phenomenological Modeling of Critical Condensate ...pangea.stanford.edu/~kewenli/spe56014.pdf1...
1
Phenomenological Modeling of Critical Condensate Saturation andRelative Permeabilities in Gas Condensate Systems
Kewen Li and Abbas FiroozabadiReservoir Engineering Research Institute (RERI)
AbstractThe effects of gravity, viscous forces, interfacial tension, and wettability on the criticalcondensate saturation and relative permeability of gas condensate systems are studiedusing a phenomenological simple network model. The results from the simple model showthat wettability significantly affects both critical condensate saturation and gas phaserelative permeability. Gas phase relative permeability at some saturations may increase tentimes as contact angle is altered from 0o (strongly liquid-wet) to 85o (intermediately gas-wet). The results suggest that gas well deliverability in condensate reservoirs can beenhanced by wettability alteration near the wellbore.
IntroductionMuch attention has been paid to the study of in-situ liquid formation and fluid flowmechanisms in gas condensate systems in recent years. When gas condensate reservoirsare developed by pressure depletion, gas well deliverability is affected by the amount andthe distribution of the condensate formed around the wellbore. The understanding of theparameters that affect the distribution and the amount of condensate saturation (Sc) in thewellbore and the effect of these parameters on gas and liquid flow are important in thedevelopment of the methods for increased gas deliverability. There are numerous field examples of gas condensate reservoirs that experience a sharpdrop in gas well deliverability at high pressures due to condensation near the wellbore.1-3
There are examples that show that the condensation may even kill gas production.2 Thesharp reduction in gas deliverability may be due to the shape of gas phase relativepermeability (krg); the mechanisms of gas productivity impairment are not yet clear. Twomain parameters affect condensate recovery and gas well deliverability. These twoparameters are critical condensate saturation (Scc, which affects liquid recovery) and gasphase relative permeability (krg, which affects well deliverability). Various authors4-9 have measured Scc and a wide range of observations has beenreported. The measured values of Scc are generally in the range of 10 to 50%. Gravier etal.4 (1986) measured Scc in low-permeability carbonate cores with permeability in therange of 0.5 to 40 md and interfacial tension (σ) variations from 0.5 to 1.5 dynes/cm. Scc
varied from 24.5 to 50.5% with an average of 35.0%. These measurements wereconducted in the presence of connate water. Morel et al.9 (1992) reported a criticalcondensate saturation of less than 1% for σ = 0.05 dynes/cm and connate water saturationof 20%. The critical condensate saturation was measured in a vertical dolomite core. Themeasured Scc is apparently related to various effects including gravity and interfacialtension. Some authors have accounted for the effect of gravity by conducting flow experimentsboth in horizontal and vertical directions. Danesh et al.10 (1991) studied the effect ofgravity on Scc in water-wet micromodels and sandstone cores. They found that Scc in a

2
vertical core was lower than that in a horizontal core; their tests showed that gravityreduced the critical condensate saturation. These authors also examined the dependence ofcritical condensate saturation on σ. As expected, Scc increases with an increase in σ. Ali etal.11 (1993) observed an improved condensate recovery of 17.2% in a vertical gas injectioncompared with that in a horizontal injection. Their experiments were conducted with ahigh interfacial tension for gas condensates (σ = 0.92 dynes/cm). Sandstone cores and asynthetic six-component fluid were used by these authors. When σ was decreased to 0.04dynes/cm, condensate recovery improved to 27.5% with vertical injection. Henderson etal.12 (1993) also reported a significant reduction of the critical condensate saturation inlong vertical core samples in comparison with those in horizontal cores. Munkerud6
(1989), however, did not find significant difference in condensate recovery and saturationbetween horizontal and vertical pressure depletion. He used Berea cores and a syntheticsix-component fluid. A number of authors have studied gas phase relative permeability (krg) of gascondensate systems. Gravier et al.4 (1986) found an abrupt decrease in krg at the saturationclose to Scc. Chen et al.5 (1995) measured krg at reservoir pressures with reservoir rock andreservoir fluids from two North Sea gas condensate reservoirs. The interfacial tension σvaried from 0.01 to 0.42 dynes/cm. The results showed that krg reduced about ten-fold dueto condensation when Sc reached 20% for the core and fluid from Reservoir A. Reductionof krg with the increase of Sc for the core and fluid from Reservoir B is less pronouncedbut an abrupt decrease of krg at the saturation close to Scc was also observed. Chen et al.5
(1995) showed that krg is rate dependent; it increases with the increase of flow rate.Henderson et al.13 measured gas-condensate relative permeabilities using a long Bereacore and a 5-component synthetic gas condensate fluid; σ varied from 0.05 to 0.40dynes/cm. They found that the relative permeabilities of both gas and liquid phasesdecreased with the increase of σ and increased with the increase of flow rate. Gas relativepermeability was more sensitive to σ and flow rate than liquid relative permeability. Theresults from the work of Munkerud6 (1989) and Haniff et al.14 (1990) differ from the otherauthors. They did not observe the abrupt decrease of krg. The brief review above points out that there are many unresolved issues in the study ofcritical condensate saturation and gas-condensate relative permeability. The sharpdecrease in gas relative permeability at saturation close to Scc that was observedexperimentally has not yet been studied theoretically. The dependence of Scc, krg, and krc
on interfacial tension, viscous force, and gravity are not clear from the experimental data.The question remains how to measure Scc, krg, and krc in the laboratory and how to scalethem to field conditions. The conclusions drawn from the experimental results aresometimes not consistent. A theoretical understanding of the effect of σ, gravity, viscousforce, and wettability on Scc, krg, and krc provides insight into the recovery of liquidcondensate from rich gas condensate reservoirs, and gas well deliverability from both richand lean gas condensate reservoirs. Theoretical work on the critical condensate saturation and relative permeabilities of gascondensate systems is very limited. Mohammadi et al.15 found that the relativepermeabilities in gas condensate systems follow the conventional displacement process.These authors used percolation theory in their work for horizontal porous media. The

3
effect of interfacial tension, viscous force, gravity, and wettability on critical condensatesaturation and gas-condensate relative permeability was not included in the work ofMohammadi et al.15. Fang et al.16 (1996) developed a phenomenological network modelfor critical condensate saturation. The main conclusion from this model is that criticalcondensate saturation is a function of interfacial tension and contact angle in gas-oil-rocksystems. The model of Fang et al.16 is based on the assumption of negligible viscous forcesand large tube length. In this work, we first modify the Scc model of Fang et al.16 for predicting criticalcondensate saturation to include the effect of viscous forces and to relax the assumption oflarge tube length. We then develop a relative permeability model (kr model) for gascondensate systems from a renormalization technique. Using the model, the effects ofinterfacial tension, flow rate, and contact angle hysteresis on the critical condensatesaturation and gas and condensate relative permeabilities are investigated. The results fromthe modified Scc model and the kr model show that Scc and kr are significantly affected byinterfacial tension, gravity, flow rate, and wettability. Wettability may have the mostpronounced effect on both Scc and krg.
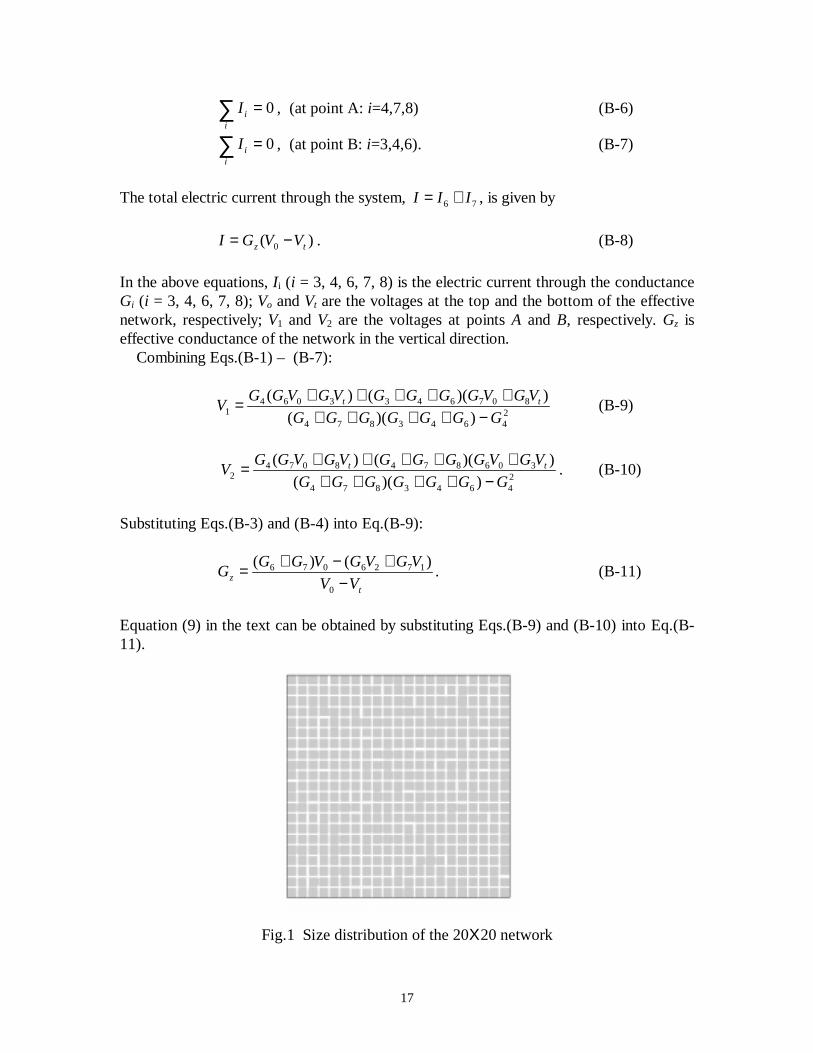
Network Model for Condensation in Porous MediaThe porous medium used in this study is represented by a simple 2D pore network withcircular capillary tubes of length L and cubic intersections of side width b; we assume b tobe equal to the maximum diameter of the capillary tube in the network. There are fourtubes connected to each intersection; therefore, the coordination number is four. A log-normal size distribution is assumed with a standard deviation of 5.74 and an averageradius of 23 µm for the capillary tubes. The size distribution of the network with 20×20intersections is sketched in Fig. 1. In this sketch, the tube diameter is proportional to thethickness. The total pore volume of the network with a tube length of 6000 µm is about8.93 mm3; the total volume of the intersections with a side width of around 38.23 µm inthe network is about 0.03 mm3 and the estimated permeability of the network is about 1darcy. The value of threshold radius rp used in this study is 20 µm (from condensation,liquid will first form in tubes with prr ≤ ). Note that the simple network described is
selected for some sensitivity studies.
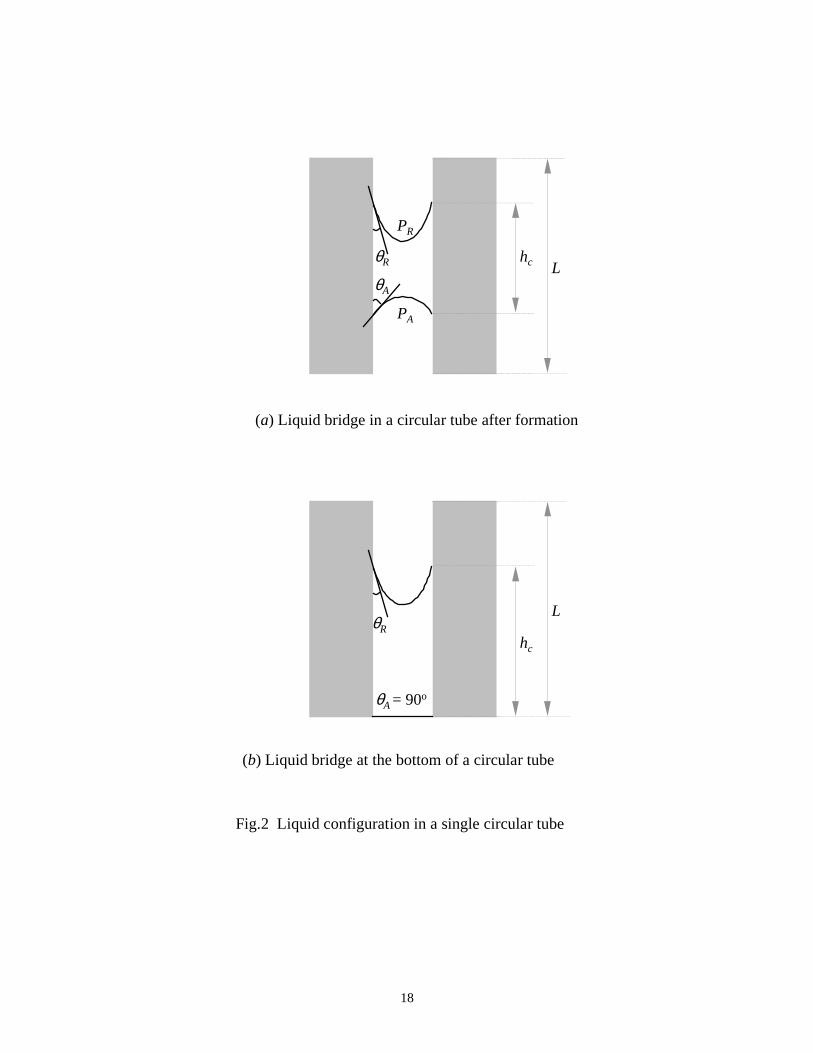
Critical Liquid Length and Critical Condensate Saturation in a SingleCapillary TubeFang et al.16 developed a phenomenological model for the critical condensate saturation ina porous medium represented by a network. Their model is based on two assumptions:viscous forces are negligible and the critical height (hcc) of liquid formed in-situ in thevertical capillary tubes is less than the tube length. The critical height of liquid in a verticalcapillary tube is the maximum length of the liquid column before it becomes mobile. In thiswork, we extend the model of Fang et al.16 to include the effect of viscous forces, andprovide the option for hcc > L. When a liquid is first formed in a capillary tube, we assumethat it appears in its middle in the form of a liquid bridge. During growth, interfacialtension, gravity, contact angle hysteresis, viscous force and the size of capillary tubes arethe main factors that affect the stability of the new liquid phase.

4
The critical height hcc of liquid formed in-situ in a vertical circular tube of radius r isexpressed as (see Fig. 2a):16
g
pp
grh AR
ARcc ρθθ
ρσ
∆−−−
∆= )cos(cos
2, (1a)
where Rp is the pressure at the top (or the receding side) and Ap the pressure at the bottom
(or the advancing side) of the liquid column; θR is the receding contact angle and θA theadvancing contact angle; ∆ρ is the density difference between gas and liquid phase. Theequation above is derived from the balance between capillary pressure, viscous force andgravity in a vertical capillary tube. In this study, for simplicity it is assumed that the gasdensity ρg is equal to zero (that is, ∆ρ = ρc) and σ does not change with the pressure. Theeffect of pressure on σ can be readily considered in our model. In a horizontal capillarytube, the critical length of liquid is indirectly calculated from
)cos(cos2)( ARAR rpp θθσ −=− . (1b)
The above equation implies that without viscous forces (that is, when AR pp − =0) liquid
cannot be moved, unless AR θθ = . In a vertical tube, liquid will flow downward to thebottom of the tube when the height of the liquid column exceeds hcc. The advancingcontact angle will then change to 90o. At this time, the critical height of the liquid columnwill increase and can be calculated from Eq.1a. Once hcc is determined, the criticalcondensate saturation in a single vertical capillary tube is calculated as hcc/L. Thecalculation of Scc in a horizontal capillary tube is relatively simple. Scc is equal to zerowhen the viscous force )( AR ppr − is greater than the interfacial force
)cos(cos2 AR θθσ − . Otherwise, Scc is equal to one or less, according to Eq. 1b. Scc in asingle horizontal capillary tube may be less than one because of limited condensation.
Process of Condensate Formation, Growth and Flow for hcc>LLiquid condensation may take place in capillary tubes of smaller diameters based on thethermodynamics of curved interfaces.17 The condensation process in a network isrepresented by discrete steps.16 When pressure decreases below dewpoint pressure, thegas in those tubes with radius r ≤ rp is allowed to condense. The amount of condensationper step in a liquid bridge is assumed to be 200 µm3. There is no initial condensation inpores with r > rp. Presented in Fig. 3 is the process of in-situ condensate formation,growth and flow when hcc > L in vertical tubes and the viscous force is greater than theinterfacial force in horizontal tubes. It is known from our modeling results that criticalcondensate saturation and relative permeabilities are affected by the choice of rp – thelarger the value of rp, the greater the critical condensate saturation. But, the trend of theeffects of gravity, wettability, and viscous forces on critical condensate saturation andrelative permeabilities at various values of rp is similar. Therefore, only the results forrp=20 µm are presented in this paper. For the study of viscous effect, it is assumed thatgas is injected at the top of the network.
5
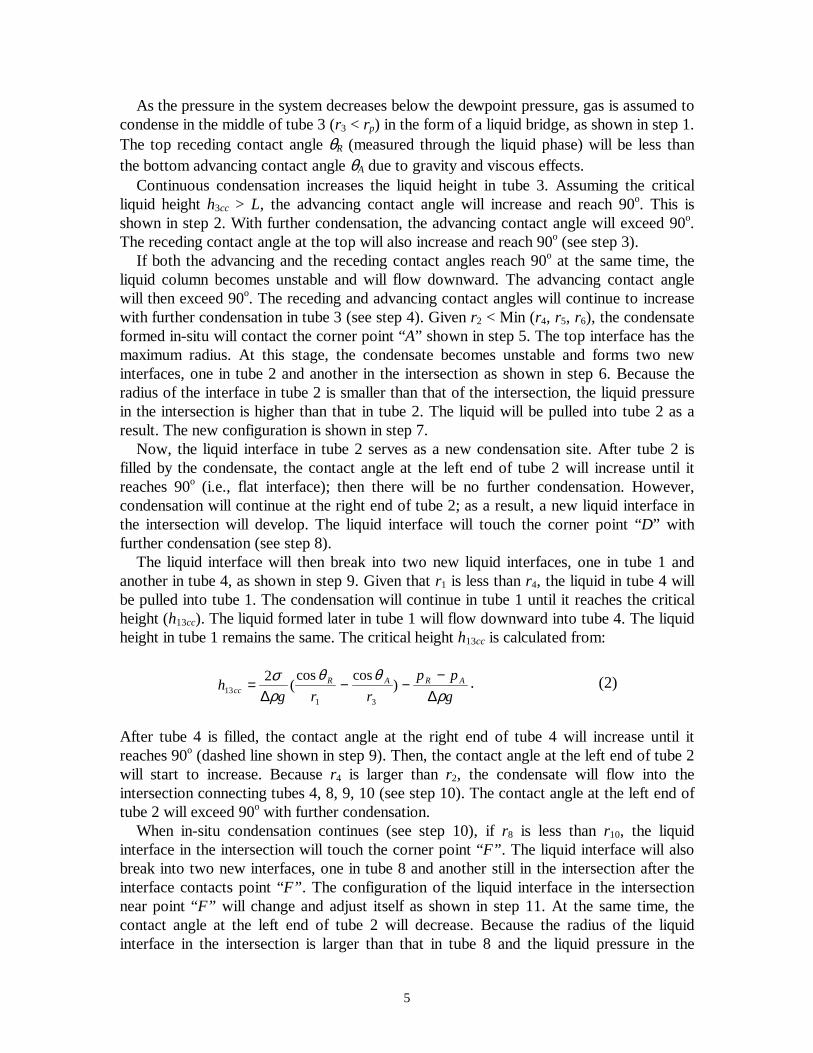
As the pressure in the system decreases below the dewpoint pressure, gas is assumed tocondense in the middle of tube 3 (r3 < rp) in the form of a liquid bridge, as shown in step 1.The top receding contact angle θR (measured through the liquid phase) will be less thanthe bottom advancing contact angle θA due to gravity and viscous effects. Continuous condensation increases the liquid height in tube 3. Assuming the criticalliquid height h3cc > L, the advancing contact angle will increase and reach 90o. This isshown in step 2. With further condensation, the advancing contact angle will exceed 90o.The receding contact angle at the top will also increase and reach 90o (see step 3). If both the advancing and the receding contact angles reach 90o at the same time, theliquid column becomes unstable and will flow downward. The advancing contact anglewill then exceed 90o. The receding and advancing contact angles will continue to increasewith further condensation in tube 3 (see step 4). Given r2 < Min (r4, r5, r6), the condensateformed in-situ will contact the corner point “A” shown in step 5. The top interface has themaximum radius. At this stage, the condensate becomes unstable and forms two newinterfaces, one in tube 2 and another in the intersection as shown in step 6. Because theradius of the interface in tube 2 is smaller than that of the intersection, the liquid pressurein the intersection is higher than that in tube 2. The liquid will be pulled into tube 2 as aresult. The new configuration is shown in step 7. Now, the liquid interface in tube 2 serves as a new condensation site. After tube 2 isfilled by the condensate, the contact angle at the left end of tube 2 will increase until itreaches 90o (i.e., flat interface); then there will be no further condensation. However,condensation will continue at the right end of tube 2; as a result, a new liquid interface inthe intersection will develop. The liquid interface will touch the corner point “D” withfurther condensation (see step 8). The liquid interface will then break into two new liquid interfaces, one in tube 1 andanother in tube 4, as shown in step 9. Given that r1 is less than r4, the liquid in tube 4 willbe pulled into tube 1. The condensation will continue in tube 1 until it reaches the criticalheight (h13cc). The liquid formed later in tube 1 will flow downward into tube 4. The liquidheight in tube 1 remains the same. The critical height h13cc is calculated from:
g
pp
rrgh ARAR
cc ρθθ
ρσ
∆−
−−∆
= )coscos
(2
3113
. (2)
After tube 4 is filled, the contact angle at the right end of tube 4 will increase until itreaches 90o (dashed line shown in step 9). Then, the contact angle at the left end of tube 2will start to increase. Because r4 is larger than r2, the condensate will flow into theintersection connecting tubes 4, 8, 9, 10 (see step 10). The contact angle at the left end oftube 2 will exceed 90o with further condensation. When in-situ condensation continues (see step 10), if r8 is less than r10, the liquidinterface in the intersection will touch the corner point “F” . The liquid interface will alsobreak into two new interfaces, one in tube 8 and another still in the intersection after theinterface contacts point “F” . The configuration of the liquid interface in the intersectionnear point “F” will change and adjust itself as shown in step 11. At the same time, thecontact angle at the left end of tube 2 will decrease. Because the radius of the liquidinterface in the intersection is larger than that in tube 8 and the liquid pressure in the

6
intersection is higher than that in tube 8, the liquid will be pulled into it. After the forcebalance is established between the capillary force and the gravity in the liquid column intube 8, the liquid in this tube will reach the critical height. With further condensation, theliquid formed in tubes 1 and 8 will flow downward and the liquid in the intersection willtouch the corner point “G” . The liquid interface in the intersection will break after it contacts the corner point “G” .If r9 < r10, the liquid formed in tubes 1 and 8 will be pulled into tube 9 until it is filled (seestep 12). With further condensation, the liquid formed in tubes 1 and 8 will flowdownward into tube 10. Assuming the critical liquid height h10cc in tube 10 is less than thetube length, the liquid will flow downward when the liquid height > h10cc. At the sametime, the liquid in tube 8 will also flow downward into tube 10. The configurationdeveloped is shown in step 13. With further condensation, the liquid formed in tube 1 willflow downward through tube 4 to tube 10 and then to the next element. When the liquidinterface in the intersection touches point “G,” the liquid will first enter tube 10 instead oftube 9, if r9 > r10. When the liquid height in tube 10 is equal to or larger than h10cc, theliquid in tube 10 flows downward (see step 14). If r8 > r10, the liquid interface will form two new interfaces after contacting the cornerpoint “G” , one in tube 10 and another in the intersection. Because the radius of the liquidinterface in the intersection is larger than in tube 10, the liquid will be pulled into tube 10.The liquid formed later will also enter tube 10 instead of tube 8. Assuming h10cc < L, theconfiguration shown in step 15 is established after the liquid height in tube 10 reachescritical height. With further condensation in this element, liquid will flow downwardthrough tube 4 to tube 10 and then to the next element. As stated previously, the process of in-situ condensate formation, growth and flowwhen hcc < L is described in Ref. 17.
Calculation of Scc
The first step for the estimation of Scc is to determine the differential pressure in each tube.The pressure distribution in the entire network is calculated as follows. At everyintersection one can write:
04
1=∑
=i iq , (3)
where qi is the flow rate of fluid in tube i. The flow rate in a circular capillary tube can becalculated from
)(8
4
gL
prq ii
i ρµ
π+
∆= , (4)
provided that the fluid is incompressible. In the above equation, µ is fluid viscosity, ρ isfluid density, and ∆pi and ri are differential pressure (inlet-outlet) and radius of tube i,respectively. Once pressures at inlet and outlet ends of the network are provided, Eqs.3 and 4 can beused to obtain the pressure distribution in the network. The Gauss iteration method can
7
be used to solve the set of linear equations. Note that for every tube i with hc < hcc, qi =0,as we will discuss later. Scc in each tube can be calculated with the known pressuredistribution according to Eqs.1a, 1b and 2. Then the value of the total Scc in the network isreadily calculated.
Calculation of Fluid ConductanceConsider single-phase flow in a capillary tube of radius ri and length L. According toDarcy’s law, the flow rate across the tube is qi = (ki/µL)πri
2(∆pi + ρgL), where ki is thepermeability of tube i. An alternative form of the Darcy equation is qi = Gi (∆pi + ρgL),where Gi is the conductance of tube i. Comparison of the Darcy equation with Eq. 4provides the expression for the absolute fluid conductance of tube i:
L
rG
j
iij µ
π8
4
= , ( Sj =1), (5)
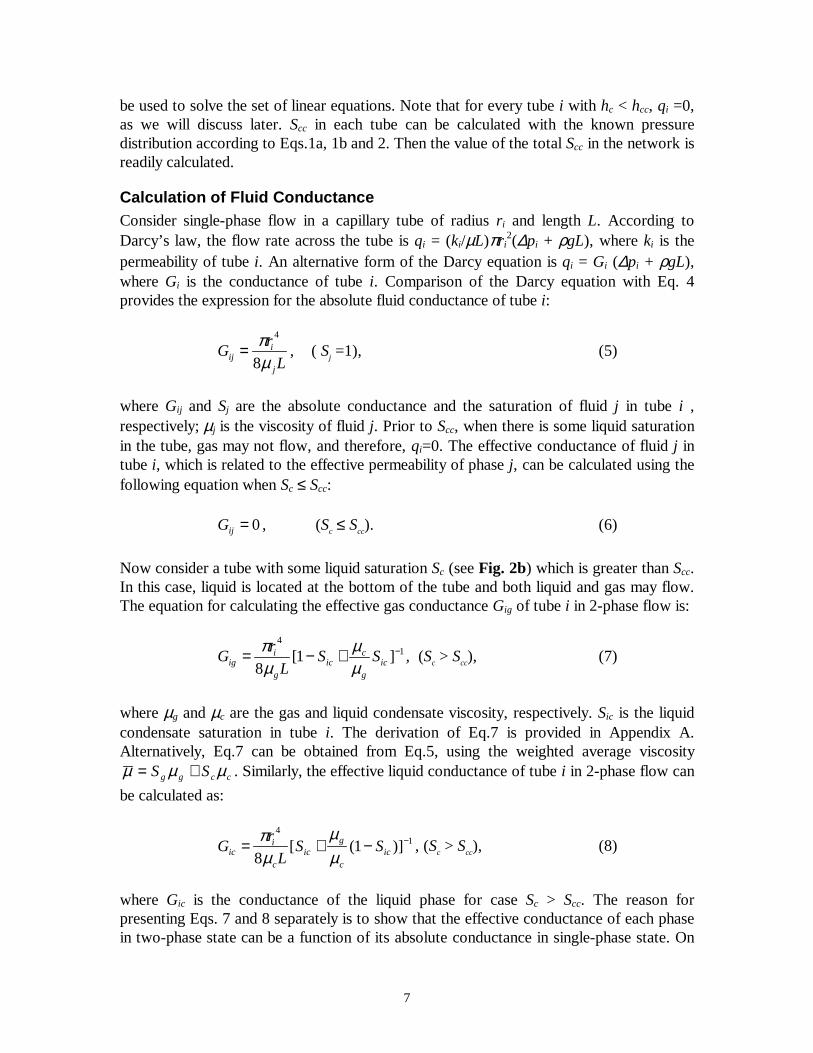
where Gij and Sj are the absolute conductance and the saturation of fluid j in tube i ,respectively; µj is the viscosity of fluid j. Prior to Scc, when there is some liquid saturationin the tube, gas may not flow, and therefore, qi=0. The effective conductance of fluid j intube i, which is related to the effective permeability of phase j, can be calculated using thefollowing equation when Sc ≤ Scc:
0=ijG , (Sc ≤ Scc). (6)
Now consider a tube with some liquid saturation Sc (see Fig. 2b) which is greater than Scc.In this case, liquid is located at the bottom of the tube and both liquid and gas may flow.The equation for calculating the effective gas conductance Gig of tube i in 2-phase flow is:
14
]1[8
−+−= icg
cic
g
iig SS
L
rG
µµ
µπ
, (Sc > Scc), (7)
where µg and µc are the gas and liquid condensate viscosity, respectively. Sic is the liquidcondensate saturation in tube i. The derivation of Eq.7 is provided in Appendix A.Alternatively, Eq.7 can be obtained from Eq.5, using the weighted average viscosity
ccgg SS µµµ += . Similarly, the effective liquid conductance of tube i in 2-phase flow can
be calculated as:
14
)]1([8
−−+= icc
gic
c
iic SS
L
rG
µµ
µπ
, (Sc > Scc), (8)
where Gic is the conductance of the liquid phase for case Sc > Scc. The reason forpresenting Eqs. 7 and 8 separately is to show that the effective conductance of each phasein two-phase state can be a function of its absolute conductance in single-phase state. On
8
the other hand, effective gas and liquid conductance may not be identical for tube shapesother than circular. The next step is to calculate the effective conductance of both gas and liquid phases inthe entire network based on conductances of individual tubes. Once the effectiveconductance of both gas and liquid phases in the network is calculated, gas andcondensate relative permeabilities can be readily calculated. In the following, we will usethe renormalization method18 to calculate the effective conductance of the network fromconductances of individual tubes.
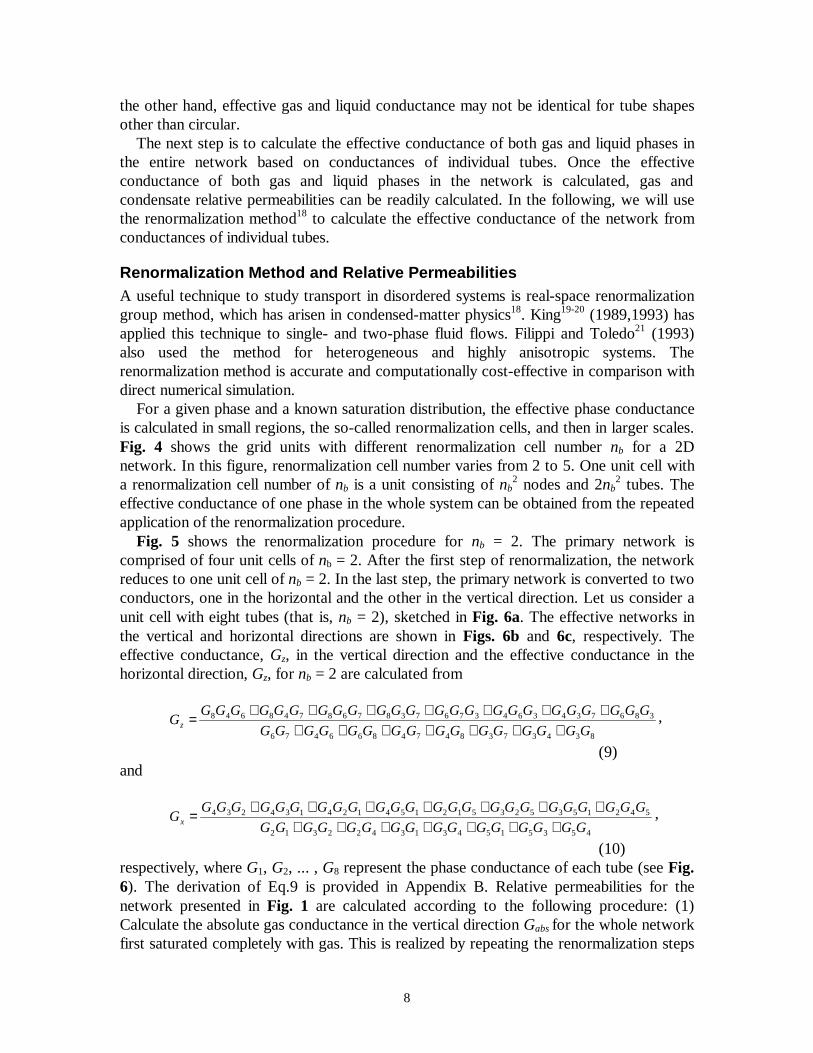
Renormalization Method and Relative PermeabilitiesA useful technique to study transport in disordered systems is real-space renormalizationgroup method, which has arisen in condensed-matter physics18. King19-20 (1989,1993) hasapplied this technique to single- and two-phase fluid flows. Filippi and Toledo21 (1993)also used the method for heterogeneous and highly anisotropic systems. Therenormalization method is accurate and computationally cost-effective in comparison withdirect numerical simulation. For a given phase and a known saturation distribution, the effective phase conductanceis calculated in small regions, the so-called renormalization cells, and then in larger scales.Fig. 4 shows the grid units with different renormalization cell number nb for a 2Dnetwork. In this figure, renormalization cell number varies from 2 to 5. One unit cell witha renormalization cell number of nb is a unit consisting of nb
2 nodes and 2nb2 tubes. The
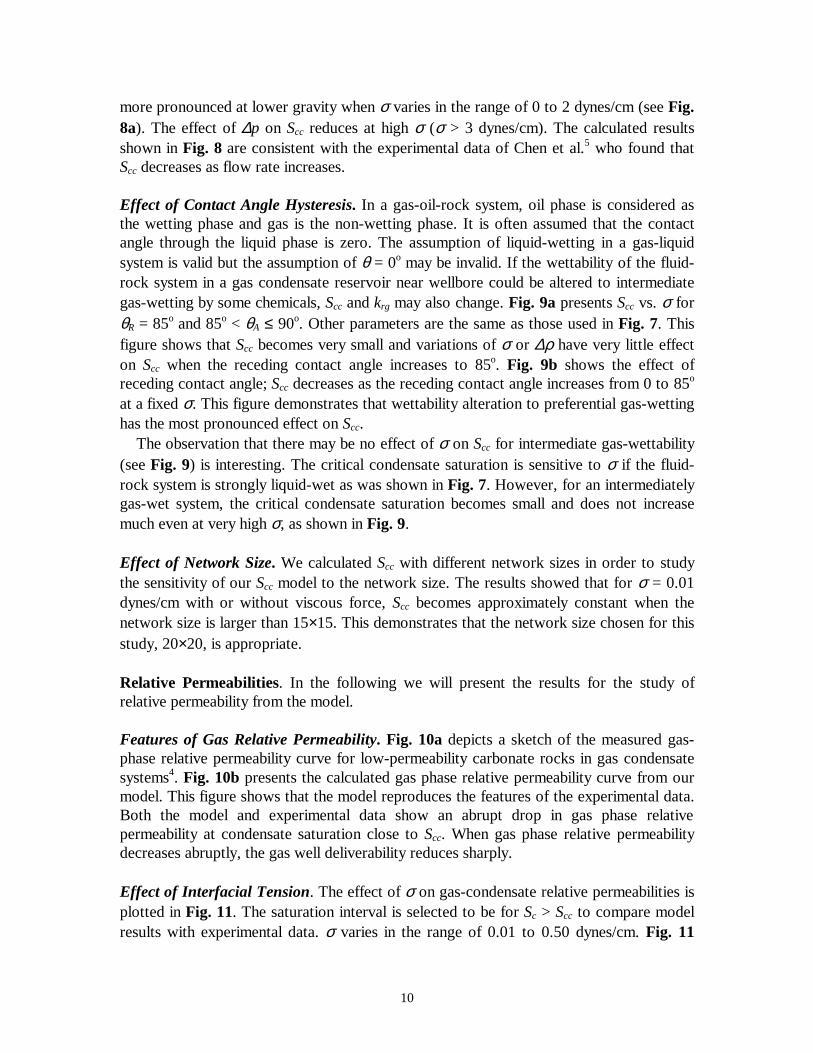
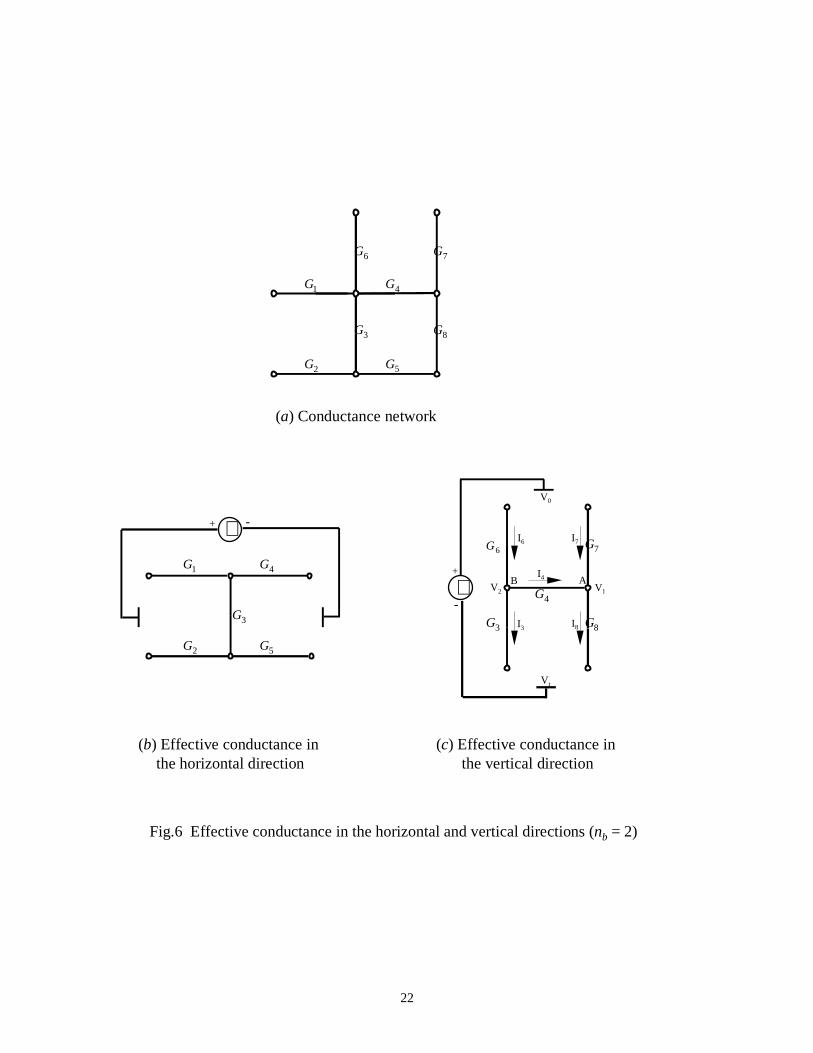
effective conductance of one phase in the whole system can be obtained from the repeatedapplication of the renormalization procedure. Fig. 5 shows the renormalization procedure for nb = 2. The primary network iscomprised of four unit cells of nb = 2. After the first step of renormalization, the networkreduces to one unit cell of nb = 2. In the last step, the primary network is converted to twoconductors, one in the horizontal and the other in the vertical direction. Let us consider aunit cell with eight tubes (that is, nb = 2), sketched in Fig. 6a. The effective networks inthe vertical and horizontal directions are shown in Figs. 6b and 6c, respectively. Theeffective conductance, Gz, in the vertical direction and the effective conductance in thehorizontal direction, Gz, for nb = 2 are calculated from
8343738474866476
386734364376738768748648
GGGGGGGGGGGGGGGG
GGGGGGGGGGGGGGGGGGGGGGGGGz +++++++
+++++++= ,
(9)and
4535154313422312
542153523512154124134234
GGGGGGGGGGGGGGGG
GGGGGGGGGGGGGGGGGGGGGGGGGx +++++++
+++++++= ,
(10)respectively, where G1, G2, ... , G8 represent the phase conductance of each tube (see Fig.6). The derivation of Eq.9 is provided in Appendix B. Relative permeabilities for thenetwork presented in Fig. 1 are calculated according to the following procedure: (1)Calculate the absolute gas conductance in the vertical direction Gabs for the whole networkfirst saturated completely with gas. This is realized by repeating the renormalization steps

9
at different scales as shown in Fig. 5; (2) Calculate the effective conductance of gas Gzg orliquid phase Gzc at a given condensate saturation Sc in the vertical direction when liquid isformed in the network due to the pressure decrease below the dewpoint pressure; (3)Calculate gas relative permeability krg from Gzg / Gabs and liquid relative permeability krc
from (µc Gzc )/(µg Gabs). Calculations at different values of Sc provide relativepermeabilities.
ResultsThe model described above is used to calculate Scc, krg, and krc. The results and thesensitivity of the calculation to various parameters are described in the following.
Critical Condensate Saturation. Critical condensate saturation is calculated using themodified Scc model in which viscous forces are considered and the critical height (hcc) ofliquid formed in-situ in vertical capillary tubes can be less than the tube length. The resultsshow that critical condensate saturation is a function of interfacial tension, flow rate,gravity, and contact angle hysteresis.
Effect of Interfacial Tension and Gravity. The effect of σ and gravity on Scc is shown inFig. 7 for two different values of the viscous force ∆p across the network. The results arebased on a tube length of 6000 µm, θR = 0 o and 0 o < θA ≤ 90 o. Fig. 7 shows that Scc
increases as σ increases (0 < σ < 4.0 dynes/cm). Fang et al.16 (1996) made a similarobservation for σ in the range of 0 to 0.45 dynes/cm. The figure shows that Scc decreaseswith an increase of ∆ρ. When σ is large enough, Scc reaches the same maximum value fordifferent ∆ρ values, which implies that the effect of gravity on Scc becomes negligible athigh values of σ. The results in Fig. 7 are consistent with the experimental data by Daneshet al.10 (1991), Chen et al.5 (1995), Ali et al.11 (1993) and Henderson et al.12 (1993). Theseauthors observed that Scc increases as σ increases and the increase in gravity lowers Scc.Various calculations from the model show that as long as θA is not zero (θA > 0), thecritical condensate saturation is not affected by the magnitude of θA. A comparison of Figs. 7a and 7b reveals that Scc decreases when ∆p increases. Theeffect of gravity on Scc becomes negligible at high ∆p when σ varies in the range of 0 to 2dynes/cm (see Fig. 7b). The results presented in Fig. 7 demonstrate that gravity may ormay not affect Scc. When ∆p is small (that is, at low flow rates), Scc is affected by gravity,whereas for high ∆p, the effect of gravity is less pronounced. The results in Fig. 7 explainthe effect of gravity on Scc and reveal that there may be no inconsistency in theexperimental data reported by various authors. The effect of viscous forces is discussed inmore detail next.
Effect of Flow Rate. The effect of viscous force (that is, flow rate) on Scc is shown in Fig.8 for ∆ρ = 0.1 and 0.5 g/ml. Other parameters are the same as those used previously. ∆pvaries in the range of 0.05 to 0.4 psi in Fig. 8. This figure shows that the criticalcondensate saturation decreases with the increase of the viscous force (that is, increase inpressure drop). A comparison of Figs. 8a and 8b reveals that the effect of ∆p on Scc is
10
more pronounced at lower gravity when σ varies in the range of 0 to 2 dynes/cm (see Fig.8a). The effect of ∆p on Scc reduces at high σ (σ > 3 dynes/cm). The calculated resultsshown in Fig. 8 are consistent with the experimental data of Chen et al.5 who found thatScc decreases as flow rate increases.
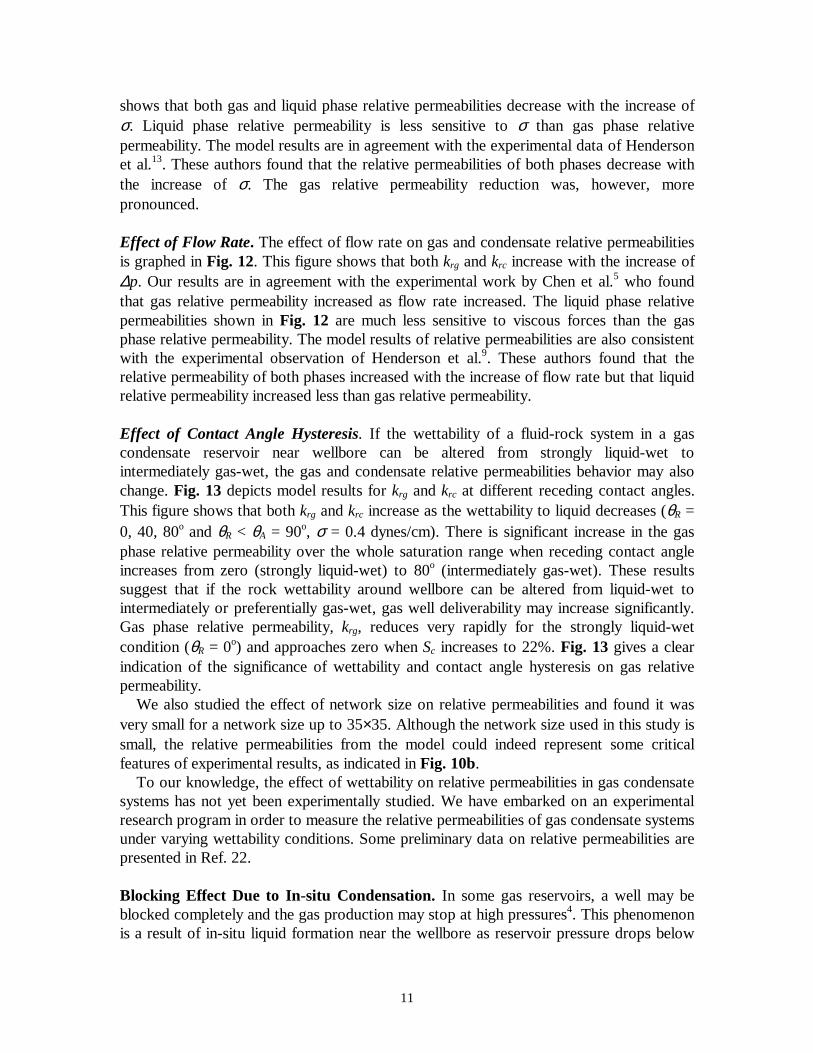
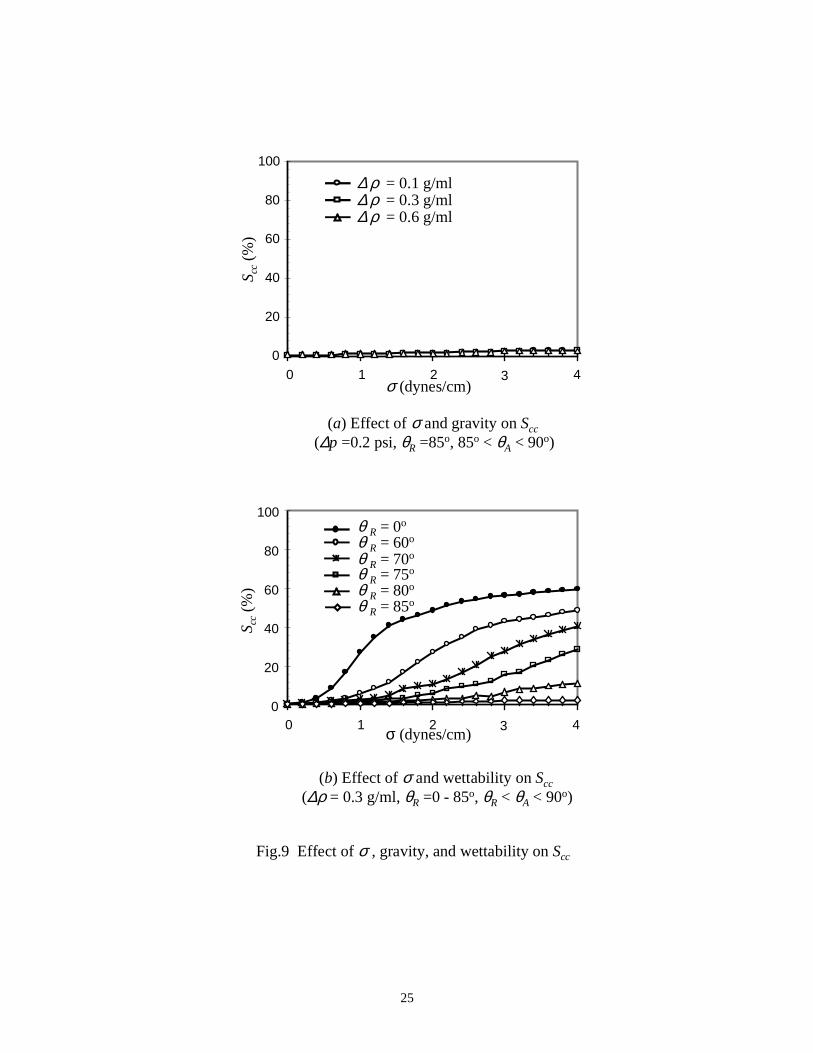
Effect of Contact Angle Hysteresis. In a gas-oil-rock system, oil phase is considered asthe wetting phase and gas is the non-wetting phase. It is often assumed that the contactangle through the liquid phase is zero. The assumption of liquid-wetting in a gas-liquidsystem is valid but the assumption of θ = 0o may be invalid. If the wettability of the fluid-rock system in a gas condensate reservoir near wellbore could be altered to intermediategas-wetting by some chemicals, Scc and krg may also change. Fig. 9a presents Scc vs. σ forθR = 85o and 85o < θA ≤ 90o. Other parameters are the same as those used in Fig. 7. Thisfigure shows that Scc becomes very small and variations of σ or ∆ρ have very little effecton Scc when the receding contact angle increases to 85o. Fig. 9b shows the effect ofreceding contact angle; Scc decreases as the receding contact angle increases from 0 to 85o
at a fixed σ. This figure demonstrates that wettability alteration to preferential gas-wettinghas the most pronounced effect on Scc. The observation that there may be no effect of σ on Scc for intermediate gas-wettability(see Fig. 9) is interesting. The critical condensate saturation is sensitive to σ if the fluid-rock system is strongly liquid-wet as was shown in Fig. 7. However, for an intermediatelygas-wet system, the critical condensate saturation becomes small and does not increasemuch even at very high σ, as shown in Fig. 9.
Effect of Network Size. We calculated Scc with different network sizes in order to studythe sensitivity of our Scc model to the network size. The results showed that for σ = 0.01dynes/cm with or without viscous force, Scc becomes approximately constant when thenetwork size is larger than 15×15. This demonstrates that the network size chosen for thisstudy, 20×20, is appropriate.
Relative Permeabilities. In the following we will present the results for the study ofrelative permeability from the model.
Features of Gas Relative Permeability. Fig. 10a depicts a sketch of the measured gas-phase relative permeability curve for low-permeability carbonate rocks in gas condensatesystems4. Fig. 10b presents the calculated gas phase relative permeability curve from ourmodel. This figure shows that the model reproduces the features of the experimental data.Both the model and experimental data show an abrupt drop in gas phase relativepermeability at condensate saturation close to Scc. When gas phase relative permeabilitydecreases abruptly, the gas well deliverability reduces sharply.
Effect of Interfacial Tension. The effect of σ on gas-condensate relative permeabilities isplotted in Fig. 11. The saturation interval is selected to be for Sc > Scc to compare modelresults with experimental data. σ varies in the range of 0.01 to 0.50 dynes/cm. Fig. 11
11
shows that both gas and liquid phase relative permeabilities decrease with the increase ofσ. Liquid phase relative permeability is less sensitive to σ than gas phase relativepermeability. The model results are in agreement with the experimental data of Hendersonet al.13. These authors found that the relative permeabilities of both phases decrease withthe increase of σ. The gas relative permeability reduction was, however, morepronounced.
Effect of Flow Rate. The effect of flow rate on gas and condensate relative permeabilitiesis graphed in Fig. 12. This figure shows that both krg and krc increase with the increase of∆p. Our results are in agreement with the experimental work by Chen et al.5 who foundthat gas relative permeability increased as flow rate increased. The liquid phase relativepermeabilities shown in Fig. 12 are much less sensitive to viscous forces than the gasphase relative permeability. The model results of relative permeabilities are also consistentwith the experimental observation of Henderson et al.9. These authors found that therelative permeability of both phases increased with the increase of flow rate but that liquidrelative permeability increased less than gas relative permeability.
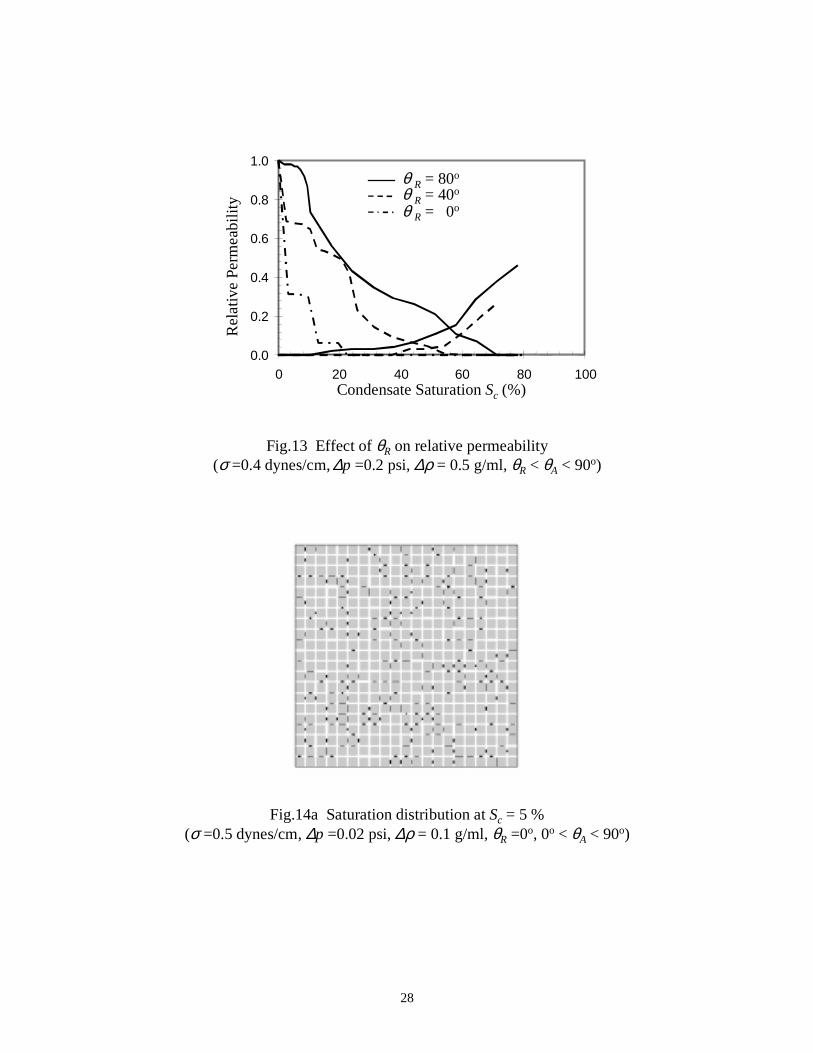
Effect of Contact Angle Hysteresis. If the wettability of a fluid-rock system in a gascondensate reservoir near wellbore can be altered from strongly liquid-wet tointermediately gas-wet, the gas and condensate relative permeabilities behavior may alsochange. Fig. 13 depicts model results for krg and krc at different receding contact angles.This figure shows that both krg and krc increase as the wettability to liquid decreases (θR =0, 40, 80o and θR < θA = 90o, σ = 0.4 dynes/cm). There is significant increase in the gasphase relative permeability over the whole saturation range when receding contact angleincreases from zero (strongly liquid-wet) to 80o (intermediately gas-wet). These resultssuggest that if the rock wettability around wellbore can be altered from liquid-wet tointermediately or preferentially gas-wet, gas well deliverability may increase significantly.Gas phase relative permeability, krg, reduces very rapidly for the strongly liquid-wetcondition (θR = 0o) and approaches zero when Sc increases to 22%. Fig. 13 gives a clearindication of the significance of wettability and contact angle hysteresis on gas relativepermeability. We also studied the effect of network size on relative permeabilities and found it wasvery small for a network size up to 35×35. Although the network size used in this study issmall, the relative permeabilities from the model could indeed represent some criticalfeatures of experimental results, as indicated in Fig. 10b. To our knowledge, the effect of wettability on relative permeabilities in gas condensatesystems has not yet been experimentally studied. We have embarked on an experimentalresearch program in order to measure the relative permeabilities of gas condensate systemsunder varying wettability conditions. Some preliminary data on relative permeabilities arepresented in Ref. 22.
Blocking Effect Due to In-situ Condensation. In some gas reservoirs, a well may beblocked completely and the gas production may stop at high pressures4. This phenomenonis a result of in-situ liquid formation near the wellbore as reservoir pressure drops below

12
the dewpoint. The liquid formed newly in the porous medium blocks both small and largepores and reduces the effective permeability of gas phase significantly. The distribution of the liquid condensate formed in-situ at different stages ofcondensation in the pore network is presented in Fig. 14. Fig. 14a shows the condensatedistribution at Sc = 5.0%. The black represents the liquid condensate and the white the gasphase. The condensate is first formed in the middle of smaller tubes in the form of liquidbridges. The capillary tubes that contain liquid bridges may be blocked for gas-phase flow.As a result, the number of tubes for gas flow is reduced and the effective gas permeabilitythrough the whole network is decreased. The gas production will, therefore, reduce whenpressure drops below the dewpoint. With further pressure decrease, more liquid drops outand condensate saturation Sc increases. Fig. 14b shows the liquid distribution at Sc = 15.0%. The liquid occupies some large capillary tubes. The number of capillary tubes availablefor gas flow is further reduced. Fig. 14c shows the liquid distribution at the criticalcondensate saturation, Scc = 58.0 %; there are almost no continuous paths available for gasflow. The effective gas permeability is zero; when this occurs, gas production may stopcompletely.
Discussion
There are a number of simplifying assumptions that we have made in the simple networkmodel for critical condensate saturation and relative permeabilities in gas condensatesystems. These include 1) keeping ρ∆ and σ constant with pressure decline, 2)neglecting the effect of water-film, and connate water, 3) simultaneous formation of liquidbridges in all the tubes with prr ≤ , and 4) two-dimensional model representation of
porous media. Assumptions 1 and 3 could be relaxed without much difficulty, but theextension of the model from two to three dimensions complicates the bookkeeping.Extension of the model to include the effect of initial water may not be straightforward.The model may also be extended to include tube shapes other than circular. The maingoal of the study was to find out the most sensitive parameter that can influence ccS and
rgk . The results presented above have clearly shown that wettability alteration from
strongly liquid condensate-wetting to weak liquid condensate-wetting is the keyparameter. The experimental work presented in Ref. 22 and work in progress are in linewith the model results. Interestingly, both with and without initial water saturation, thealteration of wettability to preferential gas wetting affects ccS and rgk the most.
ConclusionsThe major conclusions drawn from the work are:1. The predictions from our simple model show that gravity generally reduces critical
condensate saturation; but as interfacial tension increases, the gravity effect becomesless pronounced. The effect of gravity is pronounced when viscous forces are small.These results are in agreement with experimental data.
2. Viscous forces may have a pronounced effect on Scc, especially at low interfacialtension. However, the most important parameter is wettability expressed in terms ofthe receding contact angle; wettability alteration to intermediate gas-wetting reduces
13
critical condensate saturation dramatically, irrespective of gravity and interfacialtension.
3. The model predicts a significant effect of interfacial tension and viscous forces on gasphase relative permeability. These predictions are in line with experimental data.
4. The model results show that there is a very significant effect of gas-wetting on gasrelative permeability; gas phase relative permeability may increase orders of magnitudeas the receding contact angle increases from 0 to 80o. The results imply that the mosteffective method for increasing gas well deliverability may be the alteration ofwettability around the wellbore.
NomenclatureGabs = absolute gas conductance of the network at single-phase state Gic = effective conductance of liquid condensate in tube i at two-phase state Gij = absolute conductance of the fluid j in tube i at single-phase state Gig = effective conductance of gas in tube i at two-phase state Gzg = effective gas conductance of the network at two-phase state Gzc = effective liquid conductance of the network at two-phase state hc = height of liquid column hcc = critical height of liquid column I = total electrical current through the network in the vertical direction Ii = electric current through the conductance Gi (i = 3, 4, 6, 7, 8) krg = gas-phase relative permeability krc = liquid-phase relative permeability L = capillary tube length pA = pressure at the bottom pR = pressure at the top Pc = capillary pressure between gas and condensate ∆p = total pressure differential ∆pc = pressure differential across condensate phase∆pg = pressure differential across gas phase ∆pi = pressure differential between two ends of the capillary tube i qg = flow rate of gas qi = flow rate of fluid through the capillary tube i qc = flow rate of condensate r = radius of a capillary tube ri = radius of the capillary tube i rp = threshold radius Sc = condensate saturation Scc = critical condensate saturation Vo = the voltage at the top of the effective network V1 = voltage at point A V2 = voltage at point B Vt = voltage at the bottom of the effective network θA = advancing contact angle
14
θR = receding contact angle ρc = condensate density ρg = gas density ∆ρ = density difference between condensate and gas σ = interfacial tension µ = fluid viscosity µg = gas viscosity µc = condensate viscosity
AcknowledgementDr. P.G. Toledo initiated work on renormalization calculation of gas phase relativepermeability at the Reservoir Engineering Research Institute (RERI). We have benefitedfrom his work considerably. This work was supported by the Technology Research Centerof the Japan National Oil Corporation (JNOC), the US DOE grant DE-FG22-96BC14850and member companies of RERI. Their support is greatly appreciated.
References1. Allen, F. H. and Roe, R.P.: “Performance Characteristics of a Volumetric Condensate Reservoir,”
Trans, AIME (1950), 189, 83.2. Engineer, R.: “Cal Canal Field California: Case History of a Tight and Abnormally Pressure Gas
Condensate Reservoir,” paper SPE 13650 presented at the 1985 California Regional Meeting,Bakersfield, California, 27-29 March.
3. Barnum, R.S., Brinkman, F.P., Richardson, T.W., and Spillette, A.G.: “Gas Condensate ReservoirBehavior: Productivity and Recovery Reduction Due to Condensation,” paper SPE 30767 presented atthe 1995 Annual Technical Conference and Exhibition, Dallas, TX, 22-25 October.
4. Gravier, J. F., Lemouzy, P., Barroux, C., and Abed, A. F.: “Determination of Gas condensate RelativePermeability on Whole Cores Under Reservoir Conditions,” SPEFE (February 1986) 9.
5. Chen, H. L., Wilson, S. D., and Monger-McClure, T. G.: “Determination of Relative Permeabilityand Recovery for North Sea Gas Condensate Reservoirs,” paper SPE 30769 presented at the 1995SPE Annual Technical Conference & Exhibition, Dallas, TX, 22-25 October.
6. Munkerud, P. K.: “Measurement of Relative Permeability and Flow Properties of a Gas CondensateSystem During Pressure Depletion and Pressure Maintenance,” paper SPE 19071 presented at the1989 SPE Gas Technology Symposium, Dallas, Texas, 7-9 June.
7. Saeidi, A., and Handy, L. L.: “Flow and Phase Behavior of Gas Condensate Volatile Oils in PorousMedia,” paper SPE 4891 presented at the 1974 Annual California Regional Meeting, San Francisco,California, 4-5 April.
8. Munkerud, P. K., and Torsaeter, O.: “The Effects of Interfacial Tension and Spreading on RelativePermeability in Gas Condensate Systems,” presented at the 1995 Eighth European Symposium onImproved Oil Recovery, Vienna, Austria, 15-17 May.
9. Morel, D. C., Lomer, J-F. , Morineau, Y.M., and Putz, A. G.: “Mobility of Hydrocarbon Liquids inGas Condensate Reservoirs: Interpretation of Depletion Laboratory Experiments,” paper SPE 24939presented at the 1992 Annual Technical Conference and Exhibition, Washington, DC, 4-7 October.
10. Danesh, A., Henderson, G. D., and Peden, J. M.: “Experimental Investigation of Critical CondensateSaturation and its Dependence on Interstitial Water Saturation in Water-Wet Rocks,” SPERE (August1991) 336.
11. Ali, J. K., Butler, S., Allen, L., and Wardle, P.: “The Influence of Interfacial Tension on LiquidMobility in Gas Condensate Systems,” paper SPE 26783 presented at the 1993 Offshore EuropeanConference, Aberdeen, 7-10 September.

15
12. Henderson, G. D., Danesh, A., Tehrani, D. H., and Peden, J. M.: “An Investigation into the ProcessGoverning Flow and Recovery in Different Flow Regimes Present in Gas Condensate Reservoirs,”paper SPE 26661 presented at the 1993 Annual Technical Conference and Exhibition, Houston,Texas, 3-6 October.
13. Henderson, G.D., Danesh, A., Tehrani, D.H., Al-Shaidi, S., and Peden, J.M.: “Measurement andCorrelation of Gas Condensate Relative Permeability by the Steady-State Method,” paper SPE 30770presented at the 1995 Annual Technical Conference and Exhibition, Dallas, Texas, 22-25 October.
14. Haniff, M.S. and Ali, J.K.: “Relative Permeability and Low Tension Fluid Flow in Gas CondensateSystems,” paper SPE 20917 presented at the Europec 1990, The Hague, Netherlands, 22-24 October.
15. Mohammadi, S., Sorbie, K.S., Danesh, A., and Peden, J.M.: “Pore-Level Modelling of Gas-Condensate Flow Through Horizontal Porous Media,” paper SPE 20479 presented at the 1990Annual Technical Conference and Exhibition, New Orleans, LA, 23-26 September.
16. Fang, F., and Firoozabadi, A., Abbaszadeh, M, and Radke, C.: “A Phenomenological Network Modelof Critical Condensate Saturation,” paper SPE 36716 presented at the 1996 Annual TechnicalConference and Exhibition, Denver, Colorado, 6-9 October.
17. Firoozabadi, A.: Thermodynamics of Hydrocarbon Reservoirs, Chapter II, McGraw-Hill, 1999.18. Stinchcombe, B. and Watson, B.P.: “Renormalization Group Approach for Percolation Conductivity,”
Phys. Rev. C (1976), 9, 3221.19. King, P.R.: “The Use of Renormalization for Calculating Effective Permeability,” Transport in
Porous Media (1989) 4, 237.20. King, P.R.: “Renormalization Calculations of Immiscible Flow,” Transport in Porous Media (1993)
12, 237.21. Filippi, G., and Toledo, P.G.: “Prediction of Effective Permeability from Local Distributions of
Conductances,” Reservoirs (1993), PDVSA, Caracas.22. Li, K. and Firoozabadi, A.: “Experimental Study of Wettability Alteration to Preferential Gas-
Wetness in Porous Media and its Effect,” to be published in SPE Reservoir Eval. and Eng. (2000).
Appendix A: Gas Conductance in a Single Circular TubeWhen both gas and liquid phases flow in a circular tube (see Fig. 2b), the gas flow ratecan be calculated from the Poiseuille equation:
)(8
4
cg
gg hL
prq
−∆
=µπ
, (A-1)
where ∆pg is the differential pressure across gas phase, and hc is the liquid height (orlength). The effect of gravity and compressibility are both neglected. The expression forthe liquid condensate flow rate is:
)(8
4
gh
prq c
c
c
cc ρ
µπ +
∆= , (A-2)
where µc is the condensate viscosity and ∆pc the differential pressure across thecondensate phase. The differential pressure ∆p between the two ends of a tube is given by:
ccg Pppp +∆+∆=∆ , (A-3)
16
where Pc is the capillary pressure between gas and condensate liquid phase. The gas flowrate is equal to the liquid flow rate when the fluid compressibility is neglected. That is:
cg qq = . (A-4)
Combining the above equations (Eqs.A-1 to A-4), the gas phase differential pressure canbe obtained:
)(1
1ccc
c
c
g
cg ghPp
hL
hp ρ
µµ +−∆
−+
=∆ . (A-5)
Substituting Eq. (A-5) into Eq. (A-1):
)(1
1
)(8
4
ccc
c
c
g
ccgg ghPp
hL
hhL
rq ρ
µµµ
π +−∆
−+−
= . (A-6)
The gas conductance is then determined as:
c
c
g
ccggas
hL
hhL
rG
−+−
=
µµµ
π
1
1
)(8
4
. (A-7)
For tube i in the network, the condensate saturation is given by:Sic= hc / L. (A-8)
Equation (7) in the text can be obtained by substituting Eq. (A-8) into Eq. (A-7).
Appendix B: Effective Conductance in Vertical Direction for nb=2The effective network in vertical direction for nb=2 is shown in Fig. 6c. One can write thefollowing equations based on the theory of electric circuits:
)( 233 tVVGI −= , (B-1)
)( 1244 VVGI −= , (B-2)
)( 2066 VVGI −= , (B-3)
)( 1077 VVGI −= , (B-4)
)( 188 tVVGI −= . (B-5)
At points A and B
17
∑ =i
iI 0 , (at point A: i=4,7,8) (B-6)
∑ =i
iI 0 , (at point B: i=3,4,6). (B-7)
The total electric current through the system, 76 III += , is given by
)( 0 tz VVGI −= . (B-8)
In the above equations, Ii (i = 3, 4, 6, 7, 8) is the electric current through the conductanceGi (i = 3, 4, 6, 7, 8); Vo and Vt are the voltages at the top and the bottom of the effectivenetwork, respectively; V1 and V2 are the voltages at points A and B, respectively. Gz iseffective conductance of the network in the vertical direction. Combining Eqs.(B-1) – (B-7):
24643874
80764330641 ))((
))(()(
GGGGGGG
VGVGGGGVGVGGV tt
−+++++++++= (B-9)
24643874
30687480742 ))((
))(()(
GGGGGGG
VGVGGGGVGVGGV tt
−+++++++++= . (B-10)
Substituting Eqs.(B-3) and (B-4) into Eq.(B-9):
tz VV
VGVGVGGG
−+−+=
0
1726076 )()(. (B-11)
Equation (9) in the text can be obtained by substituting Eqs.(B-9) and (B-10) into Eq.(B-11).
Fig.1 Size distribution of the 20Χ20 network
18
hc
(a) Liquid bridge in a circular tube after formation
θR
θA
hc
(b) Liquid bridge at the bottom of a circular tube
θR
θA = 90o
PR
PA
Fig.2 Liquid configuration in a single circular tube
L
L

19
Fig.3 Condensation in a network, hcc > L
Step 1 Step 2 Step 3
Step 4 Step 5 Step 6
Step 7 Step 8 Step 9
1
2 4
5 6
7
8
9
103
θR
θA
θA
1
2 4
5 6
7
8
9
103
1
2 4
5 6
7
8
9
103
θR
θA
A
1
2 4
5 6
7
8
9
103
A
θA
θR
1
2 4
5 6
7
8
9
103
θR
θA
1
2 4
5 6
7
8
9
103
θR
θA
θR
1
2 4
5 6
7
8
9
103
1
2 4
5 6
7
8
9
103
θA
D2
θA
1
2 4
5 6
7
8
9
103
θR
h13cc
D2

20
Step 10 Step 11
Step 12 Step 13
Step 14 Step 15
Fig.3 Condensation in a network, hcc > L (Continued)
1
24
5 6
7
8
9
103
θR
θA
FD
1
2
5 6
7
8
9
103
D F
G
θR
θA
1
2
5 6
7
103
θR
θA
FD 9
8
G
1
2
5 6
7
8
3
D F
G
θR
θA
9
10
1
2
5 6
7
3
D F
G
θR
θA
9
10
8
1
2
5 6
7
3
D
θR
θA
9
10
8
4 4
4 4
4 4
G
F
G

21
Fig.5 Schematic of the renormalization procedures (nb=2)
1 Primary conductance network
Conductance network after one renormalization step 2
3 Conductance network at the last step
3
xGG =31
zGG =36
2
22G
21G
23G
25G
24G
26G2
7G
28G
112G
11G
13G
14G
15G
16G1
7G
18G
Fig.4 Schematic of renormalization for different cell numbers
nb = 2
nb = 3
nb = 4
nb = 5
22
Fig.6 Effective conductance in the horizontal and vertical directions (nb = 2)
(b) Effective conductance in the horizontal direction
(c) Effective conductance in the vertical direction
(a) Conductance network
2G
1G
3G
4G
5G
6G 7G
8G
∼+ -
2G
1G
3G
4G
5G
V0
Vt
V1V2
AB
I6 I7
I4
I3 I8
∼+
-
6G 7G
8G3G
4G

23
Fig.7 Effect of σ and gravity on Scc (θR =0o, 0o < θA < 90o)
(a) ∆p = 0.05 psi
(b) ∆p = 0.40 psi
σ (dynes/cm)
Scc
(%
)
0
20
40
60
80
100
0 1 2 3 4
∆ ρ = 0.1 g/ml ∆ ρ = 0.5 g/ml ∆ ρ = 0.9 g/ml
0
20
40
60
80
100
0 1 2 3 4
Scc
(%
)
∆ ρ = 0.1 g/ml ∆ ρ = 0.5 g/ml ∆ ρ = 0.9 g/ml
σ (dynes/cm)

24
(a) ∆ρ = 0.1 g/ml
(b) ∆ρ = 0.5 g/ml
Fig.8 Effect of σ and viscous force on Scc (θR =0o, 0o < θA < 90o)
0
20
40
60
80
100
0 1 2 3 4
∆p=0.05 psi ∆p=0.1 psi ∆p=0.2 psi ∆p=0.3 psi ∆p=0.4 psi
σ (dynes/cm)
Scc
(%
)
0
20
40
60
80
100
0 1 2 3 4
∆p = 0.05 psi ∆p = 0.1 psi ∆p = 0.2 psi ∆p = 0.3 psi ∆p = 0.4 psi
σ (dynes/cm)
Scc
(%
)
25
Fig.9 Effect of σ , gravity, and wettability on Scc
(b) Effect of σ and wettability on Scc
(∆ρ = 0.3 g/ml, θR =0 - 85o, θR < θA < 90o)
(a) Effect of σ and gravity on Scc
(∆p =0.2 psi, θR =85o, 85o < θA < 90o)
σ (dynes/cm)
θ R = 0o θ R = 60o θ R = 70o θ R = 75o θ R = 80o θ R = 85o
∆ ρ = 0.1 g/ml ∆ ρ = 0.3 g/ml ∆ ρ = 0.6 g/ml
0
20
40
60
80
100
0 1 2 3 4
Scc
(%
)
0
20
40
60
80
100
0 1 2 3 4
Scc
(%
)
σ (dynes/cm)

26
0.0
0.2
0.4
0.6
0.8
1.0
0 20 40 60 80 100
0.0
0.2
0.4
0.6
0.8
1.0
0 20 40 60 80 100
Fig.10 Gas-phase relative permeability in gas-condensate systems
(a) Sketch of experimental data (Gravier, et al.4)
(b) Model result(σ = 0.5 dynes/cm, ∆p =0.2 psi, ∆ρ = 0.5 g/ml, θR =0o, 0o < θA < 90o)
Condensate Saturation Sc (%)
Gas
Rel
ativ
e Pe
rmea
bili
ty
Scc
Condensate Saturation Sc (%)
Gas
Rel
ativ
e Pe
rmea
bili
tyScc

27
Fig.11 Effect of σ on relative permeability(∆p =0.3 psi, ∆ρ = 0.5 g/ml, θR =0o, 0o < θA < 90o)
Fig.12 Effect of viscous force on relative permeability(σ =0.5 dynes/cm, ∆ρ = 0.5 g/ml, θR =0o, 0o < θA < 90o)
0.0
0.2
0.4
0.6
0.8
1.0
0 20 40 60 80 100
σ = 0.01 dynes/cm σ = 0.10 dynes/cm σ = 0.30 dynes/cm σ = 0.50 dynes/cm
Condensate Saturation Sc (%)
Rel
ativ
e Pe
rmea
bili
ty
0.0
0.2
0.4
0.6
0.8
1.0
0 20 40 60 80 100
Condensate Saturation Sc (%)
Rel
ativ
e P
erm
eabi
lity
∆ p = 0.2 psi ∆ p = 0.3 psi ∆ p = 0.4 psi ∆ p = 0.6 psi
28
Fig.13 Effect of θR on relative permeability(σ =0.4 dynes/cm, ∆p =0.2 psi, ∆ρ = 0.5 g/ml, θR < θA < 90o)
0.0
0.2
0.4
0.6
0.8
1.0
0 20 40 60 80 100Condensate Saturation Sc (%)
Rel
ativ
e Pe
rmea
bili
ty
θ R = 80o
θ R = 40o
θ R = 0o
Fig.14a Saturation distribution at Sc = 5 %(σ =0.5 dynes/cm, ∆p =0.02 psi, ∆ρ = 0.1 g/ml, θR =0o, 0o < θA < 90o)

29
Fig.14b Saturation distribution at Sc = 15 %(σ =0.5 dynes/cm, ∆p =0.02 psi, ∆ρ = 0.1 g/ml, θR =0o, 0o < θA < 90o)
Fig.14c Saturation distribution at Sc = 58 %(σ =0.5 dynes/cm, ∆p =0.02 psi, ∆ρ = 0.1 g/ml, θR =0o, 0o < θA < 90o)