PhD Trial Lecture: Design guidelines for multi-display environments in command and control centers
31
Design guidelines for multi-display environments in command and control centers Simone Mora Kunz, Andreas, et al. "Tangible tabletops for emergency response: an exploratory study." Proceedings of the International Conference on Multimedia, Interaction, Design and Innovation. ACM, 2013. TRIAL LECTURE - JUNE 1ST 2015
-
Upload
simone-mora -
Category
Design
-
view
945 -
download
1
Transcript of PhD Trial Lecture: Design guidelines for multi-display environments in command and control centers

Design guidelines for multi-display environments in command and control centers
Simone Mora
Tangible Tabletops for Emergency Response: An Exploratory Study
Abstract Effective handling of location-based data is important to emergency response management (ERM). Expert team members co-located around maps typically discuss events while drawing freeform areas or while using physical placeholders representing incidents. Key ERM functions are filtering data, selecting information recipients, searching datasets, drawing time-dependent freeform areas, and zooming in on one region while leaving others unchanged. Under time pressure the mouse and keyboard could be insufficient; intuitive graspable solutions, such as tangible user interfaces (TUIs), may be better suited for ERM. We present CoTracker, a tangible tabletop system with expected potential for ERM teamwork. On an interactive map expert team members can discuss an operational picture using TUIs like bricks, frames, and pens. With the participation of domain experts for cognitive walk-through studies, we examined how generic and specialized TUIs can support ERM-related functions. We present some insights into the design of ERM-focused tangible tabletops.
Author Keywords Multiple TUI ERM; tabletop; tangible.
ACM Classification Keywords H.5.m. Information interfaces and presentation
.
. .
.. .
. .
Andreas Kunz ICVR, ETH Zurich
Ali Alavi t2i interaction lab, Chalmers ICVR, ETH Zurich
Jonas Landgren Dept. of Applied IT, Chalmers
Asim Evren Yantaç Yildiz Technical University, Istanbul t2i interaction lab, Chalmers
Paweł Woźniak t2i interaction lab, Chalmers
Zoltán Sárosi INSPIRE, ICVR, Zurich
Morten Fjeld INSPIRE, ICVR, Zurich t2i interaction lab, Chalmers
Figure 1. Collaboration in control rooms has changed over the decades, starting with early plotting rooms featuring physical models (top). During the 1990s, control rooms were equipped with vertical and spatially distributed screens (center). Now control rooms make use of larger vertical displays together with horizontal surfaces (bottom).
Kunz, Andreas, et al. "Tangible tabletops for emergency response: an exploratory study." Proceedings of the International Conference on Multimedia, Interaction, Design and Innovation. ACM, 2013.
TRIAL LECTURE - JUNE 1ST 2015

3
Picture: NASA, PHO-TR155: MCC Operational Configuration Picture: NASA/Aurich Lawson

4
SITUATIONAL AWARENESS & COMMAND

Outline• The Apollo mission control room • Role of Command and Control centers • Methodology • Design space
• Public - Personal • Static - Dynamic • Analog - Digital • Physical - Virtual • Mobile - Fixed
• Design guidelines • Conclusions
5

• Bader, Thomas, Andreas Meissner, and Rolf Tscherney. "Digital map table with Fovea-Tablett®: Smart furniture for emergency operation centers." Proc. of the 5th International Conference on Information Systems for Crisis Response and Management ISCRAM. 2008.
• Chokshi, Apoorve, et al. "ePlan Multi-Surface: A Multi-Surface Environment for Emergency Response Planning Exercises." Proceedings of the Ninth ACM International Conference on Interactive Tabletops and Surfaces. ACM, 2014.
• Heath, Christian, and Paul Luff. "Collaboration and control Crisis management and multimedia technology in London Underground Line Control Rooms." Computer Supported Cooperative Work (CSCW) 1.1-2 (1992): 69-94.
• Bowers, John, and David Martin. "Informing collaborative information visualisation through an ethnography of ambulance control." ECSCW’99. Springer Netherlands, 1999.
• MacKay, Wendy E. "Is paper safer? The role of paper flight strips in air traffic control." ACM Transactions on Computer-Human Interaction (TOCHI) 6.4 (1999): 311-340.
• Kunz, Andreas, et al. "Tangible tabletops for emergency response: an exploratory study." Proceedings of the International Conference on Multimedia, Interaction, Design and Innovation. ACM, 2013.
• Doeweling, Sebastian, et al. "Support for collaborative situation analysis and planning in crisis management teams using interactive tabletops." Proceedings of the international conference on Interactive tabletops and surfaces. ACM, 2013.
• Malcolm, S.; Harmon, D.L., "Advanced Control Room Design," Power and Energy Magazine, IEEE , vol.4, no.6, pp.43,48, 2006
• Per Lundmark. “Control room ergonomics with the operator in focus for an attractive collaborative environment.” ABB Technical document, 2014
• Müller, Jens, et al. "Back to tangibility: a post-WIMP perspective on control room design." Proceedings of the International Working Conference on Advanced Visual Interfaces. ACM, 2014.
• C. M. Mitchel et al., "Human factors aspects of control room design: guidelines and annotated bibliography" NASA Technical Memorandum 84942, 1982
• Fischer, J. E., Reeves, S., Rodden, T., Reece, S., Ramchurn, S. D., & Jones, D. Building a Birds Eye View: Collaborative Work in Disaster Response. Proceedings of the SIGCHI Conference on Human Factors in Computing Systems. 2015
• Nacenta, Miguel A., et al. "E-conic: a perspective-aware interface for multi-display environments." Proceedings of the symposium on User interface software and technology. ACM, 2007.
• Letondal, Catherine, et al. "Flights in my hands: coherence concerns in designing Strip'TIC, a tangible space for air traffic controllers." Proceedings of the SIGCHI Conference on Human Factors in Computing Systems. ACM, 2013.
• Erica Härefors. Use of large screen displays in nuclear control room. Teknisk-naturvetenskaplig fakultet UTH-enheten. 2008
• Chokshi, Apoorve, et al. "ePlan Multi-Surface: A Multi-Surface Environment for Emergency Response Planning Exercises." Proceedings of the International Conference on Interactive Tabletops and Surfaces. ACM, 2014.
6
Bibliography

7
Public displays
Personal displays
PUBLIC
PERSONAL
Group displays
DISPLAY

8
DYNAMIC STATIC
DYNAMIC
STATIC
SEMI-DYNAMIC
STATIC
STATIC
DISPLAY

9
Photo: nationalgrid75.com
UK Nuclear power plant CR (1950s) Massachusetts Bay Transportation Authority CR (2010s)
Photo: MBTA
ANALOG PHYSICAL
DIGITAL VIRTUALDISPLAY
10
FIXEDMOBILEDISPLAY

11
Design dimensions for displays in control rooms
PUBLIC - PRIVATE
MOBILE - FIXED
STATIC - DYNAMIC
ANALOG - DIGITAL
PHYSICAL - VIRTUAL

Outline• The Apollo mission control room • Role of Command and Control centers • Design space • Design guidelines
• Balance information on multiple displays • Design for ecologies • Leverage the constraints • Avoid information overload • Design for tangible displays • Augment static displays • Introduce incremental changes
• Conclusions
12

13
Balance information on public, private and group displays
Photo: forbes.com
Figure 1. The coMAP system running on a Samsung SUR40 with Microsoft Pixelsense tabletop
Support for Collaborative Situation Analysis and Planning in Crisis Management Teams using Interactive Tabletops
Sebastian Döweling¹
Tarik Tahiri¹
Philipp Sowinski¹
Benedikt Schmidt²
Mohammadreza Khalilbeigi²
¹SAP AG, HCI Research Darmstadt, Germany
{firstname.lastname}@sap.com
²Technische Universität Darmstadt, Telecooperation Group Darmstadt, Germany
{schmidt,khalilbeigi}@tk.informatik.tu-darmstadt.de ABSTRACT Crisis management requires the collaboration of a variety of people with different roles, often across organizational boundaries. It has been shown that geographic information systems can improve the efficiency of disaster management operations. However, workstation-based solutions fail to offer the same ease of collaboration as the large analog maps currently in use. Recent research prototypes, which use interactive tabletops for this purpose, often do not consider individual roles and the need for accountability of actions. In this paper, we present coMAP, a system built for interactive tabletops that facilitates collaborative situation analysis and planning in crisis management teams. Users can interact with coMAP using multi-touch as well as pen input. The latter is realized by new methods for the use of Anoto digital pens without the Anoto microdot pattern. A pen-optimized pie menu provides access to role-specific information and system functions. A combination of role-based access control and indoor tracking via Bluetooth is used to support accountability of actions while still allow-ing collaboration and information sharing. Initial user feedback on our system, collected in two focus group sessions, shows promising trends.
Author Keywords Disaster Management; Collaboration; Interactive Tabletops
ACM Classification Keywords H.5.3 Group and Organization Interfaces: Computer-supported cooperative work
INTRODUCTION In the past decade, multiple large scale events – both natural and man-made – have raised the public attention for effective crisis and disaster management. Response to such events is commonly carried out by multiple representatives from public safety organizations (e.g. fire brigade, police,
Red Cross). When a crisis situation occurs, experienced members of these organizations gather in one place and form a crisis management team (CMT), typically in a specific command and control room. These people collabo-rate as required for situation assessment and planning of the necessary measures to address the crisis.
As geospatial information plays a crucial role in crises response scenarios, one of the central artifacts for collabo-ration in the CMT is a large (analog) map with pins and paper-symbols representing the current understanding of the situation in the field. While easy to use and effective for collaboration, these maps require a significant maintenance effort. It has been shown that geographical information systems (GIS) can simplify map maintenance and make crisis response more effective [12]. However, prior studies (e.g. [10]) indicate that the use of individual workstations can also have detrimental effects on communication and collaboration. As a result, researchers have started investi-gating map-based prototypes on interactive tabletops (e.g. [16]), which facilitate a level of collaboration similar to analog maps. However, these systems typically assume teams of equals. CMTs, in contrast, are hierarchically structured and build on well-established and formalized roles with specific responsibilities. These characteristics should be considered in a support solution for CMTs.
We address this by contributing coMAP (cf. Figure 1), a prototype to support collaborative map-based analysis and
Permission to make digital or hard copies of all or part of this work for personal orclassroom use is granted without fee provided that copies are not made or distributed forprofit or commercial advantage and that copies bear this notice and the full citation onthe first page. Copyrights for components of this work owned by others than ACM mustbe honored. Abstracting with credit is permitted. To copy otherwise, or republish, topost on servers or to redistribute to lists, requires prior specific permission and/or a fee.Request permissions from [email protected] ITS’13, October 6–9, 2013, St. Andrews, United Kingdom. Copyright © 2013 ACM 978-1-4503-2271-3/13/10...$15.00. http://dx.doi.org/10.1145/2512349.2512823
Latency and Occlusion + CSCW ITS'13, October 6–9, 2013, St. Andrews, UK
273
Photo: ACM
PUBLIC GROUP PERSONAL

14
284 J. Geisler et al.
While tracking server and application server are connected by a wired LAN, the FTs and the application server communicate wirelessly, actually via Bluetooth. Bluetooth has been selected, because we decided for the current experimental system to run the application software not only on the server but also on the FTs (see, chapter 2.3). Therefore only position and orientation have to be transmitted for which a small bandwidth is sufficient. In the future the communication will move to wireless LAN.
application server tracking server
tracking camera
camera signal
FT ID, position
and rotation
application data
FToverview
table
Fig. 7. System architecture of the digital map table
For reference calculation between work table and FTs the MC-MXT tracker must be calibrated. During the calibration process the coordinate transformation between the tracking camera images, which are the input for the MC-MXT tracker, and the viewer of the work table is calculated. In a first step, that has to be carried out only once for the whole table arrangement, the camera image gets referenced to the overview table. Therefore an calibration image with four defined cross points is projected onto the table. Each cross point is identified by its own colour. Four special MC-MXT calibration markers, only used within the calibration process, are marked with the same colors and laid on the projected cross points. So the camera »knows« the size of the overview table and the size of the markers. The second step has to be carried out for every Fovea-Tablett separately. For an FT calibration two images of the FT with the fixed identity marker are taken, whereby the FT has to be positioned on two defined regions of the work table. These regions are also indicated by the calibration image.
2.3 Interaction
At our experimental system, the digital map table, a GIS system as application software is running on the application server as well as on the FTs. So every tablet offers the full functionality of the application software at the user's hand. Various
Bader et al. Digital Map Table with Fovea-Tablett®
overview of the situation for a group of people within an EOC, information which is only relevant to certain members should be displayed separately (e.g. on personal media). However, in order to avoid loss of context when switching from group to personal displays or vice versa, gaps between the two modes should be kept small. By sensing location, context and intention of a person representing a certain role within an EOC, e.g. information which is relevant in the current situation could be routed automatically to the appropriate display, or an interactive tool could be made available at the right location within the team workspace.
• Bundle information and communication channels according to roles and bring them up to the end-user. Information, communication and interaction requirements mostly are linked with certain roles within the organizational structure of an EOC. Instead of having an expert in the middle who hides complexity of various communication channels and is available to all roles (Figure 3 (b)), interfaces of different communication media should be unified in personal interaction/communication tools providing direct access to functions relevant to a certain role. Smart room technology could be used to make this access intuitive, non-intrusive and fast.
• Make interaction and communication attributable and recordable. Each communication step which led to a certain decision or response should be attributable to the persons who were involved, and it should be recorded to be usable in court. This also includes for example confirmation if a piece of information was perceived by the recipient. Smart room technology could be used to record perceived information implicitly, e.g. by tracking human position and gaze.
These guidelines are in harmony with system guidelines for co-located, collaborative work on a tabletop display identified in (Scott, Grant and Mandryk, 2003). However, they are more general in the way, that they are not defined for a certain user interface type but for a certain application domain. Nevertheless, the large overlap of requirements of both sets of guidelines motivates a system design as described in next section, which incorporates a tabletop display and fulfills both requirements which were formulated for the application domain and for the user interface type.
SMART FURNITURE: DIGITAL MAP TABLE WITH FOVEA-TABLETT®
In this section we present smart furniture for future EOCs providing a user interface platform which supports relevant communication and interaction patterns as described and discussed in previous sections. Earlier versions of the so-called Digital Map Table with Fovea-Tablett®, which features different visualization and sensing technologies, were introduced in (Peinsipp-Byma, Eck, Rehfeld and Geisler, 2007; Geisler, Eck, Rehfeld, Peinsipp-Byma, Schütz and Geggus, 2007). Now, going beyond these previous publications, we have included gesture based interaction techniques and a flexible software infrastructure which enables easy integration of various heterogeneous information sources and interaction devices.
Figure 4: Team working on Digital Map Table with Fovea-Tabletts
Proceedings of the 5th
International ISCRAM Conference – Washington, DC, USA, May 2008
F. Fiedrich and B. Van de Walle, eds. 683
Bader, Thomas, Andreas Meissner, and Rolf Tscherney. "Digital map table with Fovea-Tablett®: Smart furniture
for emergency operation centers." Proc. of the 5th International Conference on Information Systems for Crisis
Response and Management ISCRAM. 2008.
Design for ecologies of displays and “layers of seeing”

15
Figure 3 - An overview of ePlan MultiSurface. (a) Highlighting the ePlan Multi-Surface environment, with different roles
collaborating in an emergency scenario (green represents EMS, red represents fire, blue represents police and orange represents HAZMAT). (b) The wall display application and it’s different components. (c) The tabletop application. (d) An iPad running in
the EMS mode.
A
B
C D
1
2
5
6
7
8 3 4
ITS 2014 • In the World November 16-19, 2014, Dresden, Germany
223
Chokshi, Apoorve, et al. "ePlan Multi-Surface: A Multi-Surface Environment for Emergency Response Planning Exercises." Proceedings of the Ninth ACM International Conference on Interactive Tabletops and Surfaces. ACM, 2014.
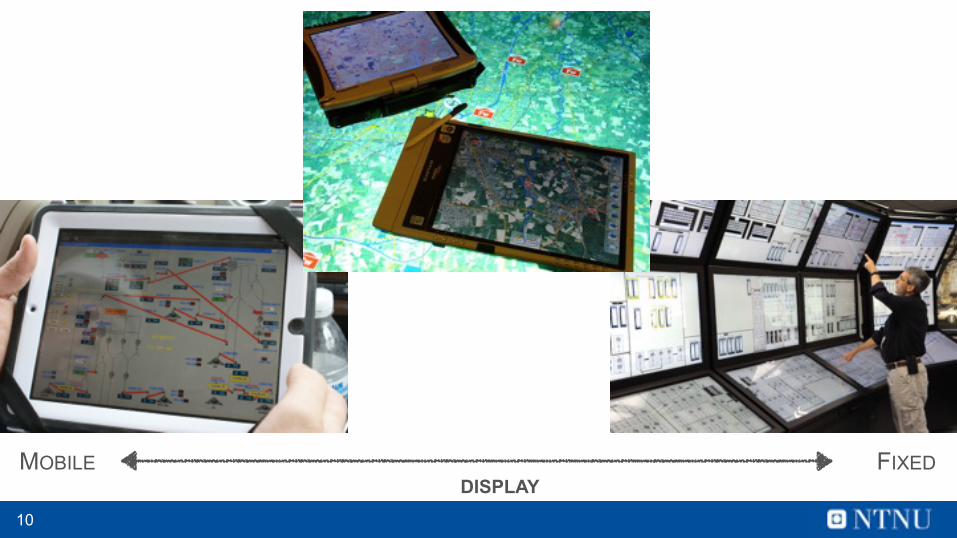
16
Leverage the constraints of displays

Photo: The Wall Street Journal
17

18
Each person is an implicit information display

19
The technology in the control room
The Bakerloo Line, London Underground is currently undergoing extensive modernisation. By 1991 signalling will be fully computerised and monitored from the Line Control Room at Baker Street. At the present time, the Bakerloo Line Control Room houses the Line Controller, who coordinates the day to day running of the railway and the Divisional Information Assistant (DIA) whose responsibilities include providing information to passengers through a public address (PA) system and communicating with station managers. Figure 1 shows the general layout of the Control Room.
I
Line Controller's position
\ Signalmens'desk '\ L l
not yet in use DIA's position .->
= -r1 "
Fixed Line Diagrarr
Fig. 1. The Bakerloo Line Control Room
The Controller and DIA sit together at a semicircular console which faces a tiled, real time, hard line display which runs nearly the entire length of the room and shows traffic movement along the Bakerloo Line (from the Elephant and Castle to Queens Park). The console includes touch screen telephones, a radio system for contact with drivers, the PA control keys, and close circuit television (CCTV) monitors and controls for viewing platforms (see Figure 2). Occasionally a trainee DIAs (tDIA) or a second controller will sit at this console. In the near future, two or three signal assistants will sit at a similar console next to the Controller and DIA (see Figure 1) and personnel will also have access to monitors showing real time
68 ECSCW'91
Heath, Christian, and Paul Luff. "Collaboration and control Crisis management and multimedia technology in London Underground Line Control Rooms." Computer Supported Cooperative Work (CSCW) 1.1-2 (1992): 69-94.
Photo: trainweb.org

20
Avoid information overload
21
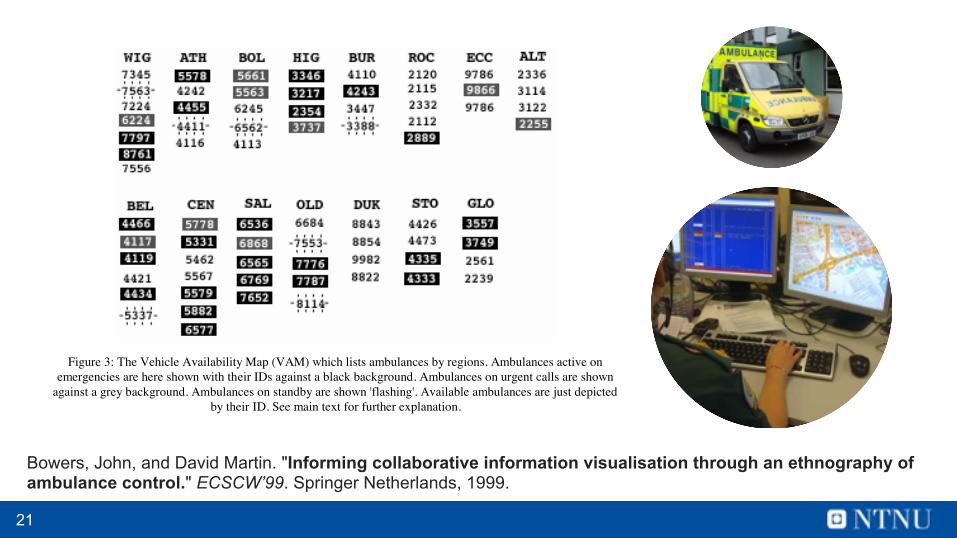
Bowers, John, and David Martin. "Informing collaborative information visualisation through an ethnography of ambulance control." ECSCW’99. Springer Netherlands, 1999.
The Vehicle Availability Map (VAM)
To ensure that cover is adequate or to manage the risk of leaving a station 'empty', Dispatchers must monitor the status of ambulances on the VAM. This is displayed on the wall in front of them on the large monitor shown at the top-centre of Figure 1 and in Figure 3, and can also be accessed from the Dispatchers' individual terminals. The VAM consists of a set of lists of ambulance IDs, each list depicting ambulances from 2 or 3 proximate stations. The lists are arranged on screen to give an approximate representation of the geographical relations between stations (e.g. stations in the same 'board' will be listed close to each other). Colour is used to signify the statuses which are most pertinent to dispatch decisions. If flagged in red the ambulance is active on an emergency, if in green active on an urgent call, and if unflagged the ambulance is available. If the number flashes this indicates that the ambulance is on standby, placed at a designated location between two or more stations to provide emergency cover for not only its home station but another nearby that is low or without cover. Thus, the Dispatchers and Supervisors can see at a glance what the general configuration for the region is and identify potential problems of cover. (The detail of the VAM is shown in Figure 3 with the colour highlighting given a greyscale approximation.)
Figure 3: The Vehicle Availability Map (VAM) which lists ambulances by regions. Ambulances active on emergencies are here shown with their IDs against a black background. Ambulances on urgent calls are shown
against a grey background. Ambulances on standby are shown 'flashing'. Available ambulances are just depicted by their ID. See main text for further explanation.
Contingencies
Although often the ambulance suggested on the Dispatch Selection screen (the nearest available one) is chosen, there are multiple varying contingencies that must be considered in the on-going flow of work. Each dispatch decision is in the context of various previous decisions and in turn will influence others. In addition to proximity and availability and a consideration of implications for cover, the kinds of contingencies which must be reckoned with from time to time include:
• Are the crew due a meal-break? • When does the crew's shift end? When will a new crew's shift begin? • Have the crew just dealt with one or more harrowing incidents? • Does the ambulance have the right equipment for the incident? • Is the nearest (as the crow flies) ambulance on the fastest route? • Are there road works, traffic problems etc. on a particular route? • Which side of the motorway is a particular accident on? • How serious is the incident?
PDF created with FinePrint pdfFactory trial version http://www.fineprint.com

22
Incoming Incidents
Ambulance control work commences on receipt of a call reporting an incident. Incoming incidents are logged by the Call Operators onto computer based forms containing fields for, for example 'name', 'address', 'incident type' and so forth. The minimum information the Call Operator requires from the caller to initiate response is an address and incident type. This is because, on making a 'fix' on the address, the computer system automatically assigns an A-Z (street atlas) grid reference and a zone number to that location, which are displayed on the Call Operator's screen. Once these details have been entered the form automatically passes over to a incident pending list ('Incident Stack') displayed for the Dispatchers and Supervisors, while the Call Operator attempts to gain the information to complete the rest of the form. This feature, whereby Dispatchers can start formulating their dispatch decisions while the call is still being taken, is considered by the service to be a time saving advantage of an electronically based system.
large monitor clocklarge monitor television
screen
automatic vehiclelocation system (AVLS)
whiteboardDISPATCHERS
SUPERVISORS
terafix screenextra COposition
tape recordermonitoring screen
databasescreen
cupboardtaperecorder
printerfigures screen
S T A I R S
extrasupervisorposition
extra CO position
CONTROL MANAGER
controlmanager's PC
windows are locatedall down this wall
CALL OPERATORS
clock
CORRIDOR
mainentrance
side entrance
see figure 2
Figure 1: Plan view of the ambulance control room (most of the technologies noted in the figure are discussed in the main text).
The control room also deals with another type of call, 'urgent incidents', which are received from doctors, and cover cases where a patient requires transportation to hospital from either home or surgery. These cases are logged on similar forms, however they can be completed between one and four hours after receipt rather than immediately, and even this deadline can be extended occasionally. Urgent incidents can create problems in the
PDF created with FinePrint pdfFactory trial version http://www.fineprint.com
The Vehicle Availability Map (VAM)
To ensure that cover is adequate or to manage the risk of leaving a station 'empty', Dispatchers must monitor the status of ambulances on the VAM. This is displayed on the wall in front of them on the large monitor shown at the top-centre of Figure 1 and in Figure 3, and can also be accessed from the Dispatchers' individual terminals. The VAM consists of a set of lists of ambulance IDs, each list depicting ambulances from 2 or 3 proximate stations. The lists are arranged on screen to give an approximate representation of the geographical relations between stations (e.g. stations in the same 'board' will be listed close to each other). Colour is used to signify the statuses which are most pertinent to dispatch decisions. If flagged in red the ambulance is active on an emergency, if in green active on an urgent call, and if unflagged the ambulance is available. If the number flashes this indicates that the ambulance is on standby, placed at a designated location between two or more stations to provide emergency cover for not only its home station but another nearby that is low or without cover. Thus, the Dispatchers and Supervisors can see at a glance what the general configuration for the region is and identify potential problems of cover. (The detail of the VAM is shown in Figure 3 with the colour highlighting given a greyscale approximation.)
Figure 3: The Vehicle Availability Map (VAM) which lists ambulances by regions. Ambulances active on emergencies are here shown with their IDs against a black background. Ambulances on urgent calls are shown
against a grey background. Ambulances on standby are shown 'flashing'. Available ambulances are just depicted by their ID. See main text for further explanation.
Contingencies
Although often the ambulance suggested on the Dispatch Selection screen (the nearest available one) is chosen, there are multiple varying contingencies that must be considered in the on-going flow of work. Each dispatch decision is in the context of various previous decisions and in turn will influence others. In addition to proximity and availability and a consideration of implications for cover, the kinds of contingencies which must be reckoned with from time to time include:
• Are the crew due a meal-break? • When does the crew's shift end? When will a new crew's shift begin? • Have the crew just dealt with one or more harrowing incidents? • Does the ambulance have the right equipment for the incident? • Is the nearest (as the crow flies) ambulance on the fastest route? • Are there road works, traffic problems etc. on a particular route? • Which side of the motorway is a particular accident on? • How serious is the incident?
PDF created with FinePrint pdfFactory trial version http://www.fineprint.comBowers, John, and David Martin. "Informing collaborative information visualisation through an ethnography of ambulance control." ECSCW’99. Springer Netherlands, 1999.

23
Design for tangible displays
Tangible Tabletops for Emergency Response: An Exploratory Study
Abstract Effective handling of location-based data is important to emergency response management (ERM). Expert team members co-located around maps typically discuss events while drawing freeform areas or while using physical placeholders representing incidents. Key ERM functions are filtering data, selecting information recipients, searching datasets, drawing time-dependent freeform areas, and zooming in on one region while leaving others unchanged. Under time pressure the mouse and keyboard could be insufficient; intuitive graspable solutions, such as tangible user interfaces (TUIs), may be better suited for ERM. We present CoTracker, a tangible tabletop system with expected potential for ERM teamwork. On an interactive map expert team members can discuss an operational picture using TUIs like bricks, frames, and pens. With the participation of domain experts for cognitive walk-through studies, we examined how generic and specialized TUIs can support ERM-related functions. We present some insights into the design of ERM-focused tangible tabletops.
Author Keywords Multiple TUI ERM; tabletop; tangible.
ACM Classification Keywords H.5.m. Information interfaces and presentation
.
. .
.. .
. .
Andreas Kunz ICVR, ETH Zurich
Ali Alavi t2i interaction lab, Chalmers ICVR, ETH Zurich
Jonas Landgren Dept. of Applied IT, Chalmers
Asim Evren Yantaç Yildiz Technical University, Istanbul t2i interaction lab, Chalmers
Paweł Woźniak t2i interaction lab, Chalmers
Zoltán Sárosi INSPIRE, ICVR, Zurich
Morten Fjeld INSPIRE, ICVR, Zurich t2i interaction lab, Chalmers
Figure 1. Collaboration in control rooms has changed over the decades, starting with early plotting rooms featuring physical models (top). During the 1990s, control rooms were equipped with vertical and spatially distributed screens (center). Now control rooms make use of larger vertical displays together with horizontal surfaces (bottom).
Kunz, Andreas, et al. "Tangible tabletops for emergency response: an exploratory study." Proceedings of the International Conference on Multimedia, Interaction, Design and Innovation. ACM, 2013.
24Figure 1. The coMAP system running on a Samsung SUR40
with Microsoft Pixelsense tabletop
Support for Collaborative Situation Analysis and Planning in Crisis Management Teams using Interactive Tabletops
Sebastian Döweling¹
Tarik Tahiri¹
Philipp Sowinski¹
Benedikt Schmidt²
Mohammadreza Khalilbeigi²
¹SAP AG, HCI Research Darmstadt, Germany
{firstname.lastname}@sap.com
²Technische Universität Darmstadt, Telecooperation Group Darmstadt, Germany
{schmidt,khalilbeigi}@tk.informatik.tu-darmstadt.de ABSTRACT Crisis management requires the collaboration of a variety of people with different roles, often across organizational boundaries. It has been shown that geographic information systems can improve the efficiency of disaster management operations. However, workstation-based solutions fail to offer the same ease of collaboration as the large analog maps currently in use. Recent research prototypes, which use interactive tabletops for this purpose, often do not consider individual roles and the need for accountability of actions. In this paper, we present coMAP, a system built for interactive tabletops that facilitates collaborative situation analysis and planning in crisis management teams. Users can interact with coMAP using multi-touch as well as pen input. The latter is realized by new methods for the use of Anoto digital pens without the Anoto microdot pattern. A pen-optimized pie menu provides access to role-specific information and system functions. A combination of role-based access control and indoor tracking via Bluetooth is used to support accountability of actions while still allow-ing collaboration and information sharing. Initial user feedback on our system, collected in two focus group sessions, shows promising trends.
Author Keywords Disaster Management; Collaboration; Interactive Tabletops
ACM Classification Keywords H.5.3 Group and Organization Interfaces: Computer-supported cooperative work
INTRODUCTION In the past decade, multiple large scale events – both natural and man-made – have raised the public attention for effective crisis and disaster management. Response to such events is commonly carried out by multiple representatives from public safety organizations (e.g. fire brigade, police,
Red Cross). When a crisis situation occurs, experienced members of these organizations gather in one place and form a crisis management team (CMT), typically in a specific command and control room. These people collabo-rate as required for situation assessment and planning of the necessary measures to address the crisis.
As geospatial information plays a crucial role in crises response scenarios, one of the central artifacts for collabo-ration in the CMT is a large (analog) map with pins and paper-symbols representing the current understanding of the situation in the field. While easy to use and effective for collaboration, these maps require a significant maintenance effort. It has been shown that geographical information systems (GIS) can simplify map maintenance and make crisis response more effective [12]. However, prior studies (e.g. [10]) indicate that the use of individual workstations can also have detrimental effects on communication and collaboration. As a result, researchers have started investi-gating map-based prototypes on interactive tabletops (e.g. [16]), which facilitate a level of collaboration similar to analog maps. However, these systems typically assume teams of equals. CMTs, in contrast, are hierarchically structured and build on well-established and formalized roles with specific responsibilities. These characteristics should be considered in a support solution for CMTs.
We address this by contributing coMAP (cf. Figure 1), a prototype to support collaborative map-based analysis and
Permission to make digital or hard copies of all or part of this work for personal orclassroom use is granted without fee provided that copies are not made or distributed forprofit or commercial advantage and that copies bear this notice and the full citation onthe first page. Copyrights for components of this work owned by others than ACM mustbe honored. Abstracting with credit is permitted. To copy otherwise, or republish, topost on servers or to redistribute to lists, requires prior specific permission and/or a fee.Request permissions from [email protected] ITS’13, October 6–9, 2013, St. Andrews, United Kingdom. Copyright © 2013 ACM 978-1-4503-2271-3/13/10...$15.00. http://dx.doi.org/10.1145/2512349.2512823
Latency and Occlusion + CSCW ITS'13, October 6–9, 2013, St. Andrews, UK
273
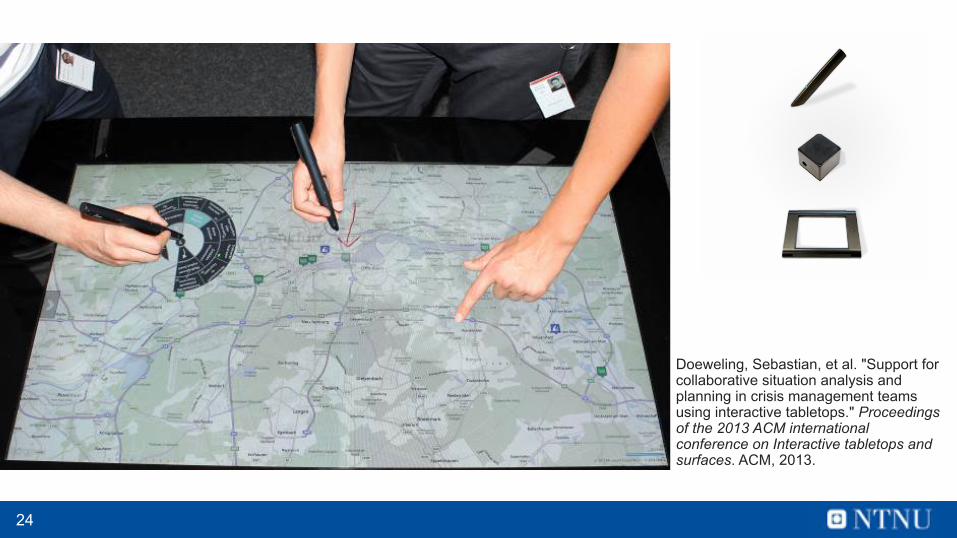
Doeweling, Sebastian, et al. "Support for collaborative situation analysis and planning in crisis management teams using interactive tabletops." Proceedings of the 2013 ACM international conference on Interactive tabletops and surfaces. ACM, 2013.
environment. CoTracker aims at using distinct tangible artifacts for alternative functions; an early version was presented together with a tracking concept [1,2]. This was followed by uEmergency [16], a tabletop system developed for ERM that utilized both tangibles and multitouch. In CoTracker, we focus on the exploration and evaluation of tangibles in an ERM setting with an aim of supporting different levels of communication.
As a standard for integrated ERM simulation, a set of major data elements was suggested: areas, building-structures, chronology, demographics, and hazard-effects [10]. Typical applications in ERM are navigating through the map (e.g. specific zoom in a certain region while the rest of the map remains unchanged), filtering data (e.g. only information from a certain field unit), searching specific information (e.g. gas/oil pipelines, communication lines, etc.), and assigning tasks (e.g. only to fire-fighters). Users involved in time-critical planning of data with maps sometimes use physical tools like rulers, dials, and pens to share knowledge and to collaborate in creating a common operational picture (as shown by Ley et al. in [12]). However, the complex tasks of ERM cannot be handled using existing passive TUIs. These tasks require not only a simultaneous multi-device positional input but also the capacity for designated devices to precisely stream large quantities of information [1,2].
TUIs for Horizontal Surfaces A potential exists for using tools different than conventional mice and keyboards for working on interactive surfaces under time pressure. User control of interactive surfaces can take different forms, such as touch-based, device-based, or in-air gestural input. Studies by Tuddenham et al. [19] hint that for some
time- and precision-critical uses, touch might not be sufficient. Here, we focus on device-based alternatives, such as graspable TUIs, sometimes called phicons [13]. TUIs are easily identifiable by their shape and are thus suitable for collaborative work around interactive tables. From our previous experience, we have learned that a majority of users expect TUIs to be more than simple point and click devices [15]. To meet this expectation, some researchers have tried to augment and ease the interaction between the user and tangible surfaces by employing malleable sand [9], clay [9], paper [18], or even magnetism [10] augmented by computer projections. These malleable or constructive objects from everyday life are easy to use due to their generic look and feel. In contrast, most TUIs have recognizable shapes, such as pen, brick, frame, palette, ruler, or caliper (Fig. 2). While we usually assign generic functions to these devices and use them in many different cases, we seldom create specialized case-specific devices such as a frame for multilayered data access or a palette for sketching. Ullmer and Ishii [20] proposed that specialized TUIs could offer richer interaction capabilities but at the cost of reduced flexibility. The degree of cognitive support offered by a TUI has been shown to be a function of the TUIs degree of specialization [4]. While malleable solutions have a lower degree of specialization, tools like frame, palette, ruler, and caliper are more specialized [19]. We believe that the inherently complex structure of an ERM case requires rather specialized TUIs. This is why CoTracker employs tailor-made tangibles
System Design The design process The design was informed by three primary perspectives; 1) The review of prior research in the
Figure 2. Tangible tools examined here (top to bottom): pen, block, and frame

25
Figure 4: Tangible-object manipulation: the rotatory control (top) and the slider control (bottom) element. Level indicators are in passive mode (left) until the tangible is detected (right).
: : (top) and the slider control (bottom) element.
Additional affordances are provided through an extra control knob in the shape of fingertip-sized handles (left). The user can perform unnatural yet powerful actions by freely moving this
An example of tangible control elements on interactive tabletop
systems is presented by Weiss et al. [13] who introduce “Silicon
Illuminated Purpose” (SLAP) Widgets. The widget set consists of
multipurpose tangibles including a slider element. In an empirical
study the physical widgets were tested against respective direct-
touch concepts. Physical control elements outperformed the
virtual control elements regarding accuracy and overall
interaction time. “Madgets” [14], a continuation of the passive
SLAP widget set, can actively synchronize with the system’s state
and thereby avoid inconsistencies.
Hennecke et al. [2] investigated several adhesion techniques
and materials to place tangibles on vertical displays. The
techniques were considered under design criteria typical to
interactive displays, such as the support of several tracking
technologies or reusability of the tangible. As a result, applying
vacuum-based adhesion turned out to be the best solution.
3. OPERATING CONCEPTSThe presented post-WIMP concepts for the manipulation of
process variables were designed under the tradeoff consideration
as suggested by Jacob et al. [5]. In order to investigate the effects
of the tradeoff decisions, operating concepts were designed for
two input modalities with different power and reality proportions:
a tangible-object and a direct-touch concept. As common actuator
types we chose one rotatory control element and one slider
control element as defined in DIN EN 894-3. Rotatory control
actuators are operated via a rotatory handle with continuous
actuation. The element allows operations without visual contact,
however it does not support visual control because the handle
does not provide information about its internal (rotatory) state.
Setting the control to its minimum and maximum state is
perceivable by a stop. The element is used for flow variables. The
slider control enables operation without direct visual contact due
to the physical constraints of the guide slot. Setting the maximum
and minimum value is accompanied with a perceivable resistance
caused by the lower and upper constraints of the guide slot.
All concepts are embedded in a dialog window (Figure 4 and
5), which includes the actual value of the process variable as a
numerical value (top left) and a button to confirm the actual value
(center, bottom). The visualization of each concept has a passive
state (gray, no contact is detected) and an active state (magenta,
contact detected). For all concepts of the rotatory element, the
min and max value is placed at 12 o’clock position.
3.1! Tangible-Object Operating Concepts Both element types of the tangible-object concepts (Figure 4
and 5) inherit the handling qualities of the respective model
actuators that are described in the DIN document. For both
element types an adhesion layer (as suggested in [2]) prevents the
tangibles from accidental movement on the surface and preserves
the original physical constraints. For both element types level
indicator appear seamlessly on the display as soon as the physical
element is detected by the tabletop (Figure 4). In terms of design
trade-offs (as understood in RBI) the concepts are characterized
by a high degree of realism as they inherit the essential operation
styles of their model. This also includes the physical constraints at
the respective minimum and maximum position of the operation
amplitudes. While this limits quick operation (in particular for the
rotatory control), it preserves the haptic feedback at the rotation
ends (rotatory control) and the translation ends (slider control),
making the adjustment of extreme values literally “tangible”.
For the rotatory control concept (Figure 4, top) the digital level
indicator appears in a concentric circle around the contact area.
The shape of the level indicator corresponds to a bent triangle,
which emphasizes the direction code. In the sense of readability
the level is aligned to the outside of a white ring, seamless to the
numerical value scale. The visualization adjusts to the internal
rotation state of the element when placed on the tabletop. For the
slider control concept (Figure 4, bottom) the digital level indicator
appears alongside on the left of the handle. The state of the
variable is emphasized through the shape of a wedge profile.
3.2! Direct-Touch Operating Concepts The direct-touch concepts mimic the conceptual model
regarding their operation mode and their photorealistic rendering.
In order to intensify their logic affordances a fingertip-sized, non-
photorealistic control knob is placed on the rotation wheel and on
the sliding knob image (Figure 5, left). The knob controls the
visualization and the current value is adjusted accordingly. Due to
the pixel representation interaction in the direct-touch concepts is
not limited by the laws of physics. This creates opportunities for
less natural, yet powerful operating features which have been
traded off for some degree of realism. For instance it is possible to
59
Müller, Jens, et al. "Back to tangibility: a post-WIMP perspective on control room design." Proceedings of the 2014 International Working Conference on Advanced Visual Interfaces. ACM, 2014.
field enabled us to extend our understanding of the requirements for interactive artifacts in an ERM environment. 2) Based on one of the authors’ (of this paper) extensive ethnographic research on IT use in the domain of crisis management, user needs and design considerations could be formulated and mapped to findings in previous field studies [3,11]. 3) In addition, an expert group was formed, consisting of crisis management specialists and fire fighters from the local municipality, to explore possibilities and insights related to the specific class of technological capabilities.
Furthermore, the exploratory nature of our work meant that we were to preliminarily evaluate ideas and eliminate potential culs-de-sac. Overall, we were guided by the need to provide the means for rapid coordination of multiple resources within a temporal dimension. We aimed to make the interaction intuitive enough to move the focus from the planning table to the actual units in the field and effectively utilizing the knowledge of the experts.
CoTracker enables following the course of actions in a crisis situation displayed on a map. The developments can be observed by manipulating the time axis. We anticipate that this functionality can be used both for reviewing past actions and assigning new resources based on predictions. Furthermore, users can outline areas on the map and place markers that indicate unit deployments or special events.
Our research has been guided by questions like the following: Is it better to have multiple tangible devices, each with a limited number of dedicated functions (that is: more space-multiplexing), or a limited number of devices where users of one device can choose among several functions (that is: more time-multiplexing)?
Should user interface designers employ generic or specialized tangible devices? What is a good balance between generic and specialized tangible devices? We also strive to investigate what the good balance between using touch and tangibles is in an ERM context.
Implementation The hardware chosen for our exploration was much like the InfrActables [5] or the MightyTrace [6]. The application software we created is the contribution presented here. The system was designed to handle ERM scenarios; it supports brainstorming about past events and training, as well as supporting real-time emergency response. Past work on ERM settings shows that it is safe to assume that 3 to 5 experts working at command centers would typically use our system. The prototype we present makes use of a navigable map-based interface (Fig. 3) with different layers of information (freeform areas, geo-information, streamed field video, and distance information). Most functions require procedural use of interactive devices (Fig. 2) and layers. The pen offers generic GUI control functions, such as layer selection and timeline editing (Fig. 3). Depending on the layer selected, the pen also offers specialized functions, such as drawing of freeform areas, regular writing, and sketching. The block (or: brick) is used as a multi-purpose tool to pan the map when pushed and dragged and to zoom in/out when turned clockwise/counter-clockwise. It has the additional function of task assignment if a related layer is visible. The frame is a more specialized device used to access information layers located within the framed area. For example, layers of pollution data may be shown as varying color shades within the frame. This enables accessing additional information while not
Image03
Figure 3 (top to bottom): The system offers interaction with five global layers (images, shapes, height map, videos, and measures); a specific layer is selected using the pen. Standard operations like placement of operational ERM units, such as a police car, a fire fighter, or a photographer, is activated using the “images” layer. The shape layer allows users to draw and modify time-dependent freeform areas. The video layer offers live streaming of video from an incident location.
Kunz, Andreas, et al. "Tangible tabletops for emergency response: an exploratory study." Proceedings of the International Conference on Multimedia, Interaction, Design and Innovation. ACM, 2013.

26
Augment static displays rather than virtualise

27
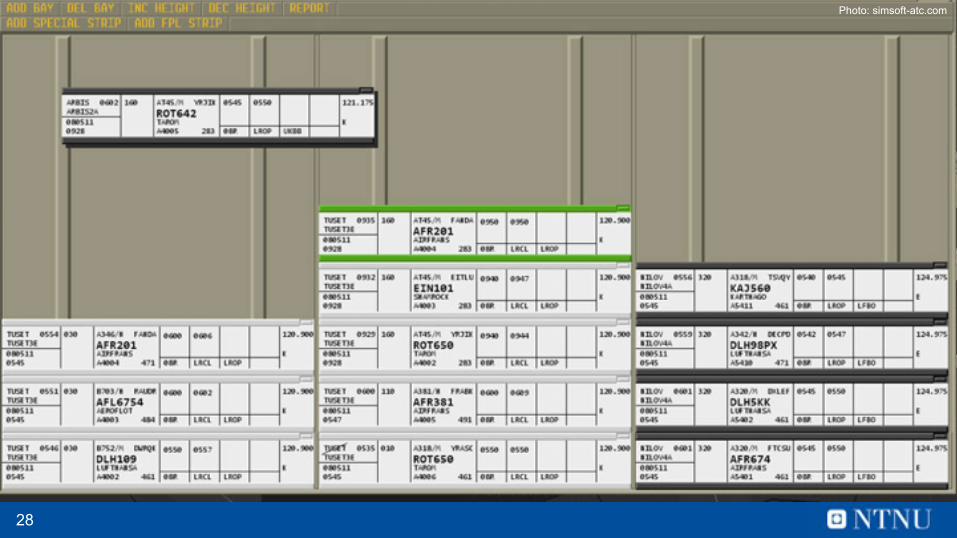
MacKay, Wendy E. "Is paper safer? The role of paper flight strips in air traffic control." ACM Transactions on Computer-Human Interaction (TOCHI) 6.4 (1999): 311-340.
Sociologists, a different group of social scientists, are more interested inthe social and historical context of the work. Harper et al. [1991] andHughes et al. [1992] emphasize how the context of the work is essential forunderstanding both the controllers’ activities and the role of paper flightstrips. For example, Bressolle et al. [1995] have demonstrated, that, whentraffic levels increase, controllers speak to each other less often and writemore on the strips. Poirot-Delpech [1995] argues that strips form anessential part of a controller’s identity and play a symbolic role as thephysical objects representing the otherwise-invisible aircraft in the air.Hopkin [1995] studied how flight strips have evolved over the past half-century, allowing the controllers to flexibly incorporate on-going changes inthe air traffic control system. We did not see evidence that these social andhistorical accounts were considered in the design of the new systems.
Each of these perspectives has limitations. Software engineers are prima-rily interested in the new benefits offered by the systems they design; it isdifficult for them to assess the importance of intangible safety featuresbuilt into the existing system. Cognitive ergonomists who seek to find andprevent errors may undervalue successful work practices and underesti-mate the risks involved in changing them. Sociologists may offer manyinteresting insights into the context and practice of air traffic control but,with a few exceptions, e.g., Hughes et al. [1992] rarely influence systemdesign. There is, of course, another important perspective: that of the airtraffic controllers themselves.
Air traffic controllers like paper flight strips. The interface is familiar,easy-to-use, helps controllers instantly understand the current state of thetraffic and lets them communicate without interrupting each other. For
Fig. 1. Three controllers working collaboratively at west sector UX in Athis Mons. Behindthem, two controllers are working at the adjacent sector.
Is Paper Safer? The Role of Paper Flight Strips in Air Traffic Control • 315
ACM Transactions on Computer-Human Interaction, Vol. 6, No. 4, December 1999.
currently controlled by that position; when the light flashes, it indicates notonly that a pilot is speaking, but also on which frequency and sector.Controllers glance at the quantity of strips and corresponding level ofannotations to get a sense of the traffic. For example, during a storm orwhen the military has closed a section of the air space, controllers mustreroute all aircraft, which results in an easily identifiable pattern ofannotations on the strips. These visual cues rely on the human visualsystem’s use of focused and peripheral views. New systems that try to placethe same quantity of visual information into a single, focused display arelikely to be more difficult to read and thus less safe.
Tactile cues are subtle. Running one’s hands along the strips helps tomentally count them, even when looking elsewhere. We watched studentcontrollers staring at the radar, trying and failing to insert a 14th strip intoa column that holds only 13. Senior and qualified controllers never makethis mistake.
Controllers share a small physical space, which helps them monitor eachothers’ activities. Figure 6 shows two controllers simultaneously annotat-ing two different strips. Each is aware of the others’ annotation and willcheck it at the next opportunity. At night, when all sectors are combinedinto two control positions, the east and west controllers always sit next toeach other. This is an important safety check, as they keep each othercompany and ensure that neither falls asleep.
Peripheral awareness helps explain a related phenomenon among teammembers. In light-to-moderate traffic conditions, members of the team whoare not assigned to a particular position chat with each other near theirteam’s working control positions. (In contrast, members of the team physi-cally leave the control room during official breaks, after ensuring that therelief team is fully operational.) To external eyes, they appear to be off-dutyand perhaps even annoying their “working” colleagues by generating extra-
Fig. 6. Two controllers simultaneously annotating two different flight strips (Athis Mons).
Is Paper Safer? The Role of Paper Flight Strips in Air Traffic Control • 327
ACM Transactions on Computer-Human Interaction, Vol. 6, No. 4, December 1999.
28
Photo: simsoft-atc.com

29
I N T E R A C T I O N S . A C M .O R G5 6 I N T E R A C T I O N S J U LY–A U G U S T 2 014
FORUM LE T'S GE T PH YSICA Lmust give an interception heading clearance to another aircraft to let it rejoin the landing pattern. As a physical reminder, she holds the EZY4262 strip in her left hand so she won’t forget to send it to the tower controller.
Augmented strips as a mix of virtual and physical media. The system provides a hybrid artifact, in which paper and digital media are identical and have equal importance. When one controller holds a paper strip, the other controllers can use the digital pen to interact with its virtual twin: They can write on it or move it by dragging on its border. When repositioning the paper strip on the board, the virtual strip is aligned under it. The then obscured handwritten notes of the virtual strip are projected onto the paper strip. The system lets the controller extend the physical strip virtually.
Thirty minutes later, the traffic gets quite intense, so Tessa’s sector needs to be split up. Two colleagues are on standby in the control room. Tessa initiates the degrouping mode in the system. She decides to hand off the area around the MOLEK beacon, picks up the strips of the flights that are in this area, and gives them to Patrick, the planner of this new sector. During this phase, the virtual twins of the removed strips remain displayed on her board. Until Patrick tells her that he is ready to control the corresponding aircraft, she continues to control them with their virtual strips, rearranging them on the stripboard and writing clearances as necessary. The entered information is simultaneously projected onto the corresponding physical strips on Patrick’s stripboard. Later, the crew of a recently departed aircraft calls to signal a sick passenger and report they must return to the airport. Tessa wants to note the problem on the corresponding strip, but it is already quite full. She chooses to enlarge the physical strip with a virtual
spatial arrangements of strips help manage their workload [2,5]. Some tacit guidance on the given clearance level may also have been provided through physical manipulations of the strip.
Tessa is right-handed and must hold the strip with her left hand to write on it. Therefore she knows instinctively that she has circled a high level, as its value is located at the bottom right of the strip.
By contrast, since virtual strips do not need to be held, they do not trigger this type of embodied memory.
Now the lowest aircraft in her sector, easyJet EZY4262, is five nautical miles from the runway. She needs to transfer control to the tower controllers, but more urgently, she
(Top) A controller collaboratively optimizes an arrival sequence, using a paper strip, numeric pen, and projected information. (Bottom) Free-hand writing and drawings convey key information.
The system provides a hybrid artifact, in which paper and digital media are identical and have equal importance.
strip. The system acknowledges this order and signals it as consistent by highlighting the drawn circle in green (the feedback would have been red in case of an inconsistent clearance, for instance a new level above 90).
Enabling input from paper through OCR. Tessa also asks THY1825 to turn to heading 340. She writes 340 on the strip.
The system recognizes the entered values and can use it to check that there is no risk of collision with other aircraft.
Fostering embodied cognition. With Strip’TIC, controllers can keep interacting in the physical space and rely on externalization to decrease their cognitive load [4]. For instance,
responsibility. At the same time, Strip’TIC provides a true tangible space, i.e. a space where manipulations in physical space trigger events in the virtual space: moving strips on the board moves the associated projected data. Therefore, we can identify the two relationships described by the MCPrd model [35]: the physical strip controls digital data projection, but stands for an internal representation. On one hand, the physical strip acts as a tangible “window” to control the output projected onto the paper (Figure 13b). On the other hand, the physical strip acts as a cognitive handle to project and build [19] a mental picture (Figure 13c). Through physical manipulations, each of the two dimensions builds an image: a projected image, and an internal image of the current state of the situation. It should be noted that the projected image comes at no cost: controllers are not aware of this “window management” activity.
Figure 13: tangible strips (b) acting as controls and as
containers for augmented data (a) and as representations and tokens for cognitive elements (c).
Implications for allocation of physical and virtual components This analysis sheds light on our choices of allocation. As we described in the previous section, physical objects and associated manipulations have their inner coherence. So, as long as physical objects are able to provide the controller with external representations of their concerns, there is no need to overload them with additional explicit information. As described in the previous section, physical and spatial tools provide a sufficient encoding of objective time, orders and internal clock. By contrast, augmented data (Figure 13a) are needed to provide real-time perception and dynamic information on the current state of flights. Our analysis also helps to understand potential complexity issues, where the physical manipulations, such as tangible computation of stack exit times, did not exactly correspond to current practices, i.e., at least for some controllers, to externalizations on which they rely today.
A seamless and understandable interactive space Complexity is also dealt with through the properties and the behavior of the components. Several of our observations highlight this aspect, both in terms of interaction devices and of human-system communication [3]. Controllers often commented on the homogeneous Anoto patterned
environment, providing a uniquely addressable system. They also reacted particularly well to the system showing a « mutual understanding » through constant attention to user input (strip moves, handwriting recognition) and continuous feedback. Continuous feedback notably addresses issues discussed by [26] and [13], such as user understanding and expectations about the system behavior. The system shows additional kinds of continuity: 1) in the strip itself, which can be described as an inherent mixed object, combining a physical nature (paper) with a virtual content (printed information which can be re-printed on demand). This provides a mixity that might blur the frontiers between physical and virtual, as advocated in [31]. When data are projected onto the strip surface, a fine-tuning of luminosity may produce the effect of a composite rendering of printed and projected data. 2) merged displays: projected data cannot occlude printed information and vice versa, which adds to this seamless combination of tangible and virtual dimensions. Finally, coherence in Strip’TIC does not assume a constant coupling between physical and virtual components: disrupting strip tracking by removing a strip from the board does not prevent continuous use of the system, and most importantly, disrupting Anoto does not break the system either, since handwriting still works.
CONCLUSION The Strip’TIC system provides us with the ability to explore mixed interaction in a context where physical interactions are effective and secure. Throughout our design reflections, we have seen that unlike usual TUI approaches, which rely on mapping and coupling of physical objects to virtual objects, coherence in Strip’TIC is based on other aspects. First, it relies on the mapping of virtual to physical objects that play a primary role as externalization of controllers internal concerns. Second, coherence consequently relies on a seamless connection of cognitive and tangible spaces that help the users to build a physical and virtual image of the situation. Third, the properties of the interactive space components and continuous feedback help users understand the mixed behavior of the system. Thus, compared to existing TUI models, our approach is complementary: we include the understanding and integration of artefact cognitive mechanisms as part of our design choices. Future work involves exploring issues about how augmented data may support externalization too, since this matter seems to be overlooked in current research. We also plan to investigate further about multitouch gestures combined with handwriting and pen-based interaction.
ACKNOWLEDGMENTS We thank the air traffic controllers for their participation to the workshops, M. Cordeil for his help on coding and C. Savery and R. Moreau for the work on the video.
REFERENCES 1. Aviation system block upgrade modules relating to
trajectory-based operations, Working paper, in 12th Air Navigation Conference, ICAO, Montreal, may 2012.
Letondal, Catherine, et al. "Flights in my hands: coherence concerns in designing Strip'TIC, a tangible space for air traffic controllers." Proceedings of the SIGCHI Conference on Human Factors in Computing Systems. ACM, 2013.

30
Aim at incremental changes in design

Conclusions
• Balance information on public, private and group displays
• Design for ecologies of displays and “layers of seeing”
• Leverage the constraints of displays
• Each person is an implicit information display
• Avoid information overload
• Design for tangible displays
• Augment static displays rather than virtualise
• Aim at incremental changes in design
31

Thanks!
Simone Mora