
PhD Dissertation - u-szeged.hudoktori.bibl.u-szeged.hu/10425/1/Amissah_G J_PhD_Dissertation.pdf ·...
135
UNIVERSITY OF SZEGED FACULTY OF SCIENCE AND INFORMATICS DOCTORAL SCHOOL OF GEOSCIENCES DEPARTMENT OF PHYSICAL GEOGRAPHY AND GEOINFORMATICS CHANNEL PROCESSES OF A LARGE ALLUVIAL RIVER UNDER HUMAN IMPACTS PhD Dissertation AMISSAH, Gabriel Jonathan Supervisors: Dr. KISS, Tímea Dr. SIPOS, György Szeged 2020
Transcript of PhD Dissertation - u-szeged.hudoktori.bibl.u-szeged.hu/10425/1/Amissah_G J_PhD_Dissertation.pdf ·...

UNIVERSITY OF SZEGED FACULTY OF SCIENCE AND INFORMATICS
DOCTORAL SCHOOL OF GEOSCIENCES DEPARTMENT OF PHYSICAL GEOGRAPHY AND GEOINFORMATICS
CHANNEL PROCESSES OF A LARGE
ALLUVIAL RIVER UNDER HUMAN IMPACTS
PhD Dissertation
AMISSAH, Gabriel Jonathan
Supervisors:
Dr. KISS, Tímea
Dr. SIPOS, György
Szeged
2020

2
TABLE OF CONTENTS
1. INTRODUCTION ................................................................................................................ 4
2. LITERATURE REVIEW .................................................................................................... 10
2.1 Channel Processes ......................................................................................................... 10
2.1.1 River Flow and Hydrodynamics ............................................................................. 11
2.1.2 Sediment transport in rivers .................................................................................... 13
2.1.3 Channel bed incision............................................................................................... 18
2.1.4 Bank processes ....................................................................................................... 20
2.1.5 Meanders and channel migration ............................................................................ 22
2.2 Human impacts on river systems ................................................................................... 23
2.2.1 Direct and indirect types of human interventions on river systems ........................ 23
2.2.2 Response of river systems to direct human interventions ....................................... 24
2.3 Modelling of river systems ............................................................................................ 25
3. THE STUDY AREA ........................................................................................................... 28
3.1 The Physical setting of the Tisza and Maros Rivers ...................................................... 28
3.2 The regulation works ..................................................................................................... 29
3.3 The Lower Tisza and the studied locations ................................................................... 31
3.3.1 Study sites for the centurial changes in channel morphology................................. 33
3.3.2 Study sites for detailed channel morphology and flow velocity ............................. 34
3.3.3 Study sites for changes point-bar evolution and bank erosion ............................... 35
3.3.4 Study site of sediment transport on the Maros ....................................................... 36
4. DATA AND METHODS .................................................................................................... 37
4.1 Centurial channel changes in the Lower Tisza River .................................................... 37
4.2 Detailed channel morphology and flow velocity of the Lower Tisza ............................ 38
4.3 Changes in point-bar evolution and bank erosion ......................................................... 38
4.4 Modelling the morphological changes of the Lower Tisza ........................................... 39
4.5 Bedload discharge measurement of the Maros .............................................................. 41
4.6 Estimation of the bedload transport of the Maros ......................................................... 43
5. RESULTS AND DISCUSSION .......................................................................................... 47
5.1 Centurial changes in the Lower Tisza Channel ............................................................. 47
5.1.1 General changes in vertical channel parameters ..................................................... 47
5.1.2 Effect of sinuosity on vertical channel parameters ................................................. 51
5.1.3 Effect of artificial cutoffs on vertical channel parameters ...................................... 54
5.1.4 Effects of revetments and groynes on vertical channel parameters ........................ 57
5.1.5 Discussion on the centurial evolution of the Lower Tisza channel ........................ 60
5.2 Detailed channel morphology and flow velocity of the Lower Tisza ............................ 64
5.2.1 Cross-sectional and longitudinal profiles of studied sites ...................................... 64
3
5.2.2 Flow conditions at the studied sites ........................................................................ 69
5.2.3 Influence of morphology and the revetment on velocity profiles ........................... 72
5.2.4 Discussion on detailed channel morphology and flow velocity ............................. 74
5.3 Changes in point-bar evolution and bank erosion ......................................................... 77
5.3.1 Hydrological changes of the studied period ........................................................... 77
5.3.2 Point-bar evolution at Csongrád and Ányás ........................................................... 78
5.3.3 Bank erosion at Csanytelek and Ányás................................................................... 83
5.3.4 Discussion on changes in point-bar evolution and bank erosion ............................ 84
5.4 Modelling of the Lower Tisza morphology ................................................................... 87
5.4.1 Results of the morphological modelling of the Lower Tisza .................................. 87
5.4.2 Discussion on the morphological modelling .......................................................... 88
5.5 Bedload transport on the Maros River ........................................................................... 89
5.5.1 Initial bedload measurements ................................................................................. 89
5.5.2 Effect of sampling time on bedload measurements/temporal variation .................. 90
5.5.3 Channel morphology and spatial variation of bedload yield .................................. 93
5.5.4 Effect of water depth and velocity .......................................................................... 95
5.5.5 Bedload transport rating curve at the Makó gauge station ..................................... 97
5.5.6 Discussion on bedload transport at Makó ............................................................... 97
5.6 Estimation of the bedload transport of the Maros River ................................................ 99
5.6.1 Comparison of estimates from applied formulae .................................................... 99
5.6.2 Discussion of bedload estimation ......................................................................... 100
6. CONCLUSIONS ............................................................................................................... 102
6.1 Centurial changes in the Lower Tisza channel ............................................................ 102
6.2 Morphology, in-channel processes and near-bank processes ...................................... 104
6.3 Measurement and estimation of sediment transport .................................................... 106
7. ACKNOWLEDGEMENT ................................................................................................. 107
8. REFERENCES .................................................................................................................. 108
9. ABSTRACT ...................................................................................................................... 128
10. APPENDIX ..................................................................................................................... 131

4
1. INTRODUCTION
Rivers as natural systems have been responsible for shaping the earth’s
landscapes through the adjustment of their channels in response to changes imposed by
both natural and human-induced conditions (Phillips, 1991; Benn and Erskine, 1994;
Snyder et al., 2003; Hickin, 2009; Nardi and Rinaldi, 2015). The patterns of their
channels reveal their history and behavior which are important not only to fluvial
geomorphologists (Schumm, 1985; Twidale, 2004; Joeckel et al., 2016), but also to
environmentalists, engineers, ecologists, and the society at large (Haque, 2000; Coratza
and De Waele, 2012). Throughout history and different civilizations, rivers have been
altered by humans for economic benefits (flood protection, improvement of shipping
routes, energy production, water withdrawal among others). Although the
consequences of these alterations may be undesirable, their detailed analysis have
helped in our understanding of adjustment of rivers to change, and provided hydro-
morphological and ecological information crucial to sustainable future river
engineering (Hooke, 1995).
Alluvial rivers with their erodible beds and banks respond to different flows as
their channels are susceptible to changes as a result of perturbations, in comparison to
rivers with fixed beds and banks (Engelund and Fredsoe, 1982). Changes in hydraulic
and sediment load conditions influence the temporal and spatial alteration in alluvial
rivers (Thorne and Tovey, 1981; Smith and Winkley, 1996; Simon et al., 2000;
Knighton, 2004). The sediment load and its characteristics also reflect the overlapped
effects of all environmental subsystems of the river’s catchment (Fryirs and Brierly,
2001; Fryirs et al., 2007, 2008). Therefore, any change in any subsystem of a river is
reflected in the sediment transport, and consequently, in the channel forms of the river
(Church, 2006; Anderson and Anderson, 2010; Hassanzadeh, 2012). Thus, alluvial
channel morphology is the result of the interactions between channel-bed topography,
flow field and sediment movement (van der Berg, 1995; Ferguson, 2010; Latapie et al.,
2014; Leigleiter, 2014; Powell, 2014; Pfeiffer et al., 2017). In their pristine state, large
alluvial rivers tend to have floodplains which are often expansive and characterized by
hyporheic flows through lattice-like substrata probably formed by glacial outwash or
lateral migration of the river channel over long periods of time (Stanford and Ward,
1993). They are also usually sinuous with various channel patterns (Schumm, 1963).
Although rivers in their natural states develop towards an equilibrium,
according to Schumm (1977), a river system without any external forcing still
undergoes a form of intrinsic evolution notwithstanding. This character has been
termed as dynamic equilibrium as the river counteracts any change by adapting its
channel processes resulting in changes in the dimensions and pattern of the river
channel (Leopold et al., 1964; Knighton, 2004; Phillips, 1999; Twidale and Campbell,
2005). This is an implicit assumption in fluvial geomorphology which supposes that a
fluvial system will reach a state of adjustment with a characteristic form, and a state of
dynamic equilibrium will be maintained if allowed sufficient time after a disturbance
or an environmental change. Tooth and Nanson (2000) traced the origins of the concept
of equilibrium in fluvial geomorphology from Gilbert’s (1877) observations of self-
5
adjusting and roughly balanced conditions between rates of sediment erosion, transport,
and deposition in streams in the semi-arid Henry Mountains of Utah. In describing the
equilibrium of river systems, the character and the response of river systems to changes
in geometric and hydraulic characteristics have been used: adjustment to changes in
load and discharge (Leopold et al., 1964); local rate of sediment transport equaling the
sediment supply (Chang, 1986); discharge being independent both temporally and
spatially in the flow direction (Chanson, 2004); balance between incoming and
outgoing discharge and sediment load (Julien, 2018); and small-scale adjustments
continuously made to maintain an approximate state of balance between processes and
forms (Knighton, 2004). Although the concept of equilibrium is difficult to define in
geomorphic systems due to its complexity as compared to other relatively simpler
systems in which equilibrium conditions are easily identified (Tooth and Nanson,
2000), there have been several attempts to standardize the term as applied in fluvial
geomorphology.
Rivers in equilibrium may be affected by external forcing such as climate
change or human interventions which distort evolution patterns (Hooke, 2004; Twidale,
2004; Wohl, 2004; Wang et al., 2007; Dai et al., 2013; Ye et al., 2013; Latapie et al.,
2014; Ma et al., 2014; Ashraf et al., 2016; Yu et al., 2016; Calle et al., 2017; Gautier et
al., 2018). The common effect of these external forcing, especially human
interventions, is disequilibrium in river systems. When a river system loses its
equilibrium, it tries to adapt its processes and form to the disequilibrium based on its
capacity for adjustment, ease of adjustment and the proximity to threshold conditions
(Fryirs and Brierley, 2013), as alluvial riverbeds are sensitive to modifications in the
discharge and the sediment supply within their catchments (Landon et al., 1998; Glas
et al., 2018). Climate change has implications for altered streamflow and, increasing
floods and droughts (Nijssen et al., 2001; Mirza et al., 2003; Thodsen, 2007).
According to Petts et al. (1989), the last 100-500 years have witnessed not only climate
change, but also intensifying human impacts on river systems. Human interventions in
river systems and their impacts vary: artificial meander cutoffs and channel
straightening cause increases in the stream gradient and the average bankfull width, as
well as upstream degradation, downstream aggradation and the loss of ability of the
channel to handle floods (Parker and Andres, 1976; Brookes, 1985; Simon, 1989; Smith
and Winkley, 1996; Weatherly and Jakob, 2014; Tiron Dutu et al., 2019); construction
of embankments and levees for flood protection result in minor channel widening and
increases in overbank sedimentation (Smith and Winkley, 1996; Li et al., 2007); bank
stabilization and protection generate high flow velocities and induce incision (Shields,
1991; Erskine, 1992, Gregory, 2006); in-channel mining and, dam/reservoir
construction for power generation and other purposes disrupt the natural continuity of
sediment transport which may deprive the river of the needed sediment; thus, making
the river channel susceptible to in-bed and bank erosion especially in channel bends,
channel incision, coarsening of bed material and destruction of various ecosystems, as
well as reduced sediments into the oceans resulting in coastal and deltaic erosion (Petts,
1979; Guillen and Palanques, 1992; Kondolf, 1994, 1997; Steiger et al., 1998; Yang et
al., 2005; Yang et al., 2008; Jia et al., 2016); diversion and/or extraction of water from
6
channels induce aggradation and disrupt ecosystems in especially low-flow rivers
(Gregory, 2006; King et al., 2015); urbanization increases the local run-off and flood
levels resulting in poor water quality and destruction of riparian ecosystems (Du et al.,
2012; Chu et al., 2013; Yu et al., 2016; Zope et al., 2016), deforestation/removal of
riparian vegetation increased erodibility of banks as well as destruction of ecosystems
(Palmer et al., 2004; Brierly and Fryirs, 2005; Osei et al. 2015); and, reforestation alters
the sediment inputs from the catchment (Keesstra et al., 2009; Ouyang et al., 2013).
The consequences of various human interventions on various rivers in the world have
been well described (e.g. Rinaldi and Simon, 1998; Surian, 1999; Liébault and Piegay,
2001; Kondolf et al., 2002; Rinaldi, 2003; Yates et al., 2003; Antonelli et al., 2004;
Harmar et al., 2005; Pinter and Heine, 2005; Chang, 2008; Kroes and Kraemer, 2013;
Kiss and Balogh, 2015; Morais et al., 2016; Nagy and Kiss, 2016). The patterns, forms
and flow characteristics of alluvial rivers in both their natural and human-induced states
have been widely-studied subjects of recent geomorphological researches, as their
morphological changes affect their use, risks and hazards (Knox and Latrubesse, 2016;
Wang and Xu, 2018).
In the 19th century, most European rivers flowed in wide braided or meandering
channels. However, as a result of the various forms of human interventions and the
attendant decrease in sediment supply to the channels in the 20th century, most of these
rivers have been subjected to various human impacts resulting in various changes
(Liébault and Piegay, 2001; Rinaldi, 2003; Surian and Rinaldi, 2003; Liébault et al.,
2005; Rinaldi et al., 2005; Houben et al., 2006; Klimek and Latocha, 2007; Wyżga,
2007; Gurnell et al., 2009; Rakonczai and Kozak, 2011). In the Carpathian Basin,
diverse human interventions altered the morphology of the Tisza River, which is the
second largest river of Hungary (Dunka et al., 1996; Szlávik, 2000; Schweitzer, 2009;
Pinke, 2014). In the last 50 years, rising flood water levels have been recorded on the
Tisza River (Kiss, 2014; Kiss et al., 2019). This may be explained by the catchment-
scale runoff increase due to forest clearance, rough grazing, land-use changes, and
probably increasing mining and quarrying activities on the catchment, as well as
engineering alteration of the channel itself (Schweitzer, 2009, Amissah et al., 2017).
Although the primary aim of the works was to protect towns and villages, infrastructure
and agricultural lands from floods and to support shipping, the superimposed effects of
these indirect and direct human impacts has changed the hydrology and fluvial
morphology of the Tisza resulting in a loss in equilibrium of the river (Kiss et al., 2008,
2019; Sàndor and Kiss, 2008; Amissah et al., 2018).
The Lower Tisza, just like the entire Tisza River, has been the subject of various
investigations to gain in-depth understanding of the effects of the regulations works on
its hydro-morphological evolution, and the implications for river management (Kiss
and Sipos, 2005; Kiss et al., 2005; Sipos et al., 2007; Sipos et al., 2008; Kiss et al.,
2008; Kiss et al., 2015). These were however limited to short sections of the river. To
have a comprehensive understanding of the effects of the regulation works on the
Lower Tisza River, an assessment of the spatial and temporal variations of longer river
reaches are needed to reveal the spatial connections of the parametric changes over
7
various temporal dimensions for the river since it is critical to effective and sustainable
river management.
The Maros River, a tributary of the Lower Tisza, has also been the subject of
various studies although their focus has been on its dynamic morphology due to the
availability of large sediment volumes (Kiss and Sipos, 2003; Sipos and Kiss, 2003,
2004; Kiss et al., 2011). To understand the sediment transport dynamics which forms
part of channel processes as drivers of morphological change, The Maros River was
selected since the Lower Tisza has a low bedload sediment transport making it difficult
for bedload to be effectively monitored and analyzed.
Aims and objectives
The main aim of my research is to assess the morphological changes of a large
alluvial river channel under various human impacts. It however has two parts: (1) to
understand the long-term morphological changes in a large alluvial river channel which
has been subjected to various form of human interventions, emphasizing the roles
played by the various interventions over the last century; and (2) to apply models to
replicate the morphological evolution of the river in the last century, and if successful,
use the model in predicting the evolution of the river.
To be able to achieve these aims of the study, the following were specifically
undertaken:
(1) Assessment of the long-term changes in river channel morphology of the
Lower Tisza:
Analysis of the horizontal and vertical channel parameters: mean depth,
thalweg (maximum) depth, bankfull (maximum) width, mean width and the
cross-sectional area.
(2) Assessment of the short-term channel processes as drivers of morphological
change:
Analysis of sediment transport in the Maros River; analyses of river bank
erosion, net point-bar accumulation and flow parameters (velocity, discharge
and stream power) of the Lower Tisza River.
(3) Application of models to replicate the sediment transport in the Maros River,
and the long-term evolution of the Lower Tisza River channel and to possibly
predict its future evolution.
Research Questions
To achieve the objectives, the following research questions were answered.
(1) Assessment of the long-term changes in the Tisza River channel morphology
a) What were the human interventions within the study area and when were
they applied within the river?
b) How did the cross-sectional area of the river channel vary spatially and
temporally in response to the various human interventions?
8
c) How did the channel shape: depth (mean depth and thalweg depth) and
width (mean width and full bank width) change spatially and temporal in
line with changing cross-sectional area?
d) How did the equilibrium condition of the river channel change over the
studied period considering the various spatial and temporal adjustments?
(2) Assessment of short-term channel processes of the Tisza River
a) How do the in-channel processes correlate with the near-bank processes
(bank erosion and accumulation)?
b) How did the regulation works affect the bank processes?
c) How well do near-bank process: bank erosion and point-bar development
influence the river’s evolution?
(3) Assessment of the sediment transport on the Maros River
a) What are the rates of total bedload transport?
b) How well do the temporal rates of bedload transport depend on the
morphology of the channel?
c) What are the connections between the temporal variation and spatial
variation of bedload along the studied cross-section?
(4) Application of models to the Lower Tisza and Maros Rivers
a) How well does the model correctly simulate the in-channel and flow
processes of the rivers using the imposed boundary conditions?
b) How well does the simulation of in-channel processes correlate the
changes in the morphology of the river?
c) Which equations are able to estimate the bedload transport rates?
Motivation
Various planned and unplanned human interventions in river systems especially
the unplanned ones have had unintended consequences on rivers all over the world.
While fluvial geomorphologists strive to understand how rivers develop, various
stakeholders in the fluvial environment, especially river and water engineers, must
regard fluvial geomorphology as integral and critical, thereby, appreciating the impacts
of their constructions on rivers, and vice versa. In this way, river and water engineers
must incorporate fluvial geomorphology during the planning, design, construction and
use of various engineering infrastructure which interfere with the functioning of rivers
and their landscapes.
Although rivers in Ghana have not been subjected to the interventions such as
artificial meander cutoffs, construction of levees, bank stabilization and protection,
three major hydropower dams have been constructed on the Volta River and its
tributaries: Akosombo Dam, Kpong Dam and Bui Dam. In addition, small dams/weirs
used to store and treat water for irrigation, human and industrial consumption are found
in all parts of the country. Alluvial mining has been part of the Ghanaian mining culture

9
since the 19th century. However, in recent times, unplanned and indiscriminate mining
which involves digging up whole sections of rivers and their floodplains have led to
catastrophic impacts on river systems. Most rivers have been diverted or totally
transformed both hydro-dynamically and morphologically. There is therefore an
attempt at river restoration which requires an in-depth appreciation of fluvial
geomorphology to be able to restore the rivers to their pre-modification states, as well
as any perceived impacts of the restoration.

10
2. LITERATURE REVIEW
The study of the morphological evolution of a river is dependent on the
processes within the river channel and its floodplains. However, these processes are
functions of how water and sediment interact due to both internal and external forces;
as well as the characteristics of the channel. This chapter therefore gives a background
to the study within existing scientific knowledge, and highlights the deficits in the
context of this study.
2.1 Channel Processes
A river originates as a result of surface runoff, and moves towards an ultimate
base level, which may be another river, lake or ocean (Leopold, 1994). Therefore, the
river system is an integration of the flowing water, the channel it flows in together with
its floodplain, and the processes that connect the physical characteristics of the system.
Thus, channel processes (or fluvial processes) could be defined as the consequence of
the interaction of the moving water with the landforms with which the water
encounters. Although rivers range from different sizes to different morphologies, there
are three basic channel processes (erosion, transportation and deposition) which are
reflected in a river’s morphology (Montgomery and Buffington, 1998; Matsuda, 2009).
Although these processes take place in all parts of a river, their dominance in various
sections give rise to three main zones, i.e. sediment source zone, transfer zone and
accumulation zone, which correspond to the dominant areas of erosion, transportation
and deposition respectively (Matsuda, 2009; Fryirs and Brierley, 2012). Thus, fluvial
landforms are therefore important indicators of various channel processes which
dominate and shape them.
Through these processes, the river functions in a three-dimensional form (with
longitudinal, transverse and vertical dimensions); involving changes in morphology,
and fluxes of water and sediment (Gilvear, 1999). Thus, hydrodynamics and hydraulic
action of water, sediment transport and the interaction of these with the various
landforms of the river system serve as the basis for the processes and related forms of
a river (Fig. 2.1).
Fig. 2.1: Fluvial process zones in a catchment: erosion zone in upland, transfer zone in the middle
reaches and accumulation zones in the lowland reaches (source: Church et al., 2009)

11
This is further highlighted by Thorne (1998), who indicated that channel
processes serve as a link between driving variables (water and sediment) and the
boundary characteristics of a river to form a channel.
2.1.1 River Flow and Hydrodynamics
Rivers are the mainly responsible in shaping the earth’s continental landscapes
as the moving water in river channels controls the erosion and transport processes
which mobilize sediments stored in floodplains, channel-bars and islands, which are
then deposited downstream (Ham and Church, 2000; Twidale, 2004; Vargas-Luna et
al., 2019). This has been established by various researches which relate how flow
together with sediments play significant roles in the alteration of river morphology both
spatially and temporally (Chang, 2008; Anderson and Anderson, 2010; Posner and
Duan, 2012; Nelson et al., 2013; Legleiter, 2014; Powell, 2014; Jaeger et al., 2017;
Fleischmann et al., 2018). As indicated by Dingman (2009), the water that flows in a
watershed originates from precipitation which flows through channels, and are
controlled by the physical attributes of the watershed giving the network of streams a
characteristic pattern. The variations in flow also create the necessary conditions for
the banks to be eroded, resulting in channel widening and incision (Dapporto et al.,
2003; Rinaldi et al., 2004, 2008; Vargas-Luna et al., 2019).
Flow is variable in natural rivers, and this variability is critical in how the river
changes its form. There are various parameters used in characterizing the flow in river
channels: discharge, velocity, cross sectional area of flow, roughness of channel bed
and the slope of the channel bed. The discharge (Q), velocity (v) and area (A) are related
by the continuity equation based on the law of conservation of mass (Chanson, 2004).
𝑄 = 𝑣 𝐴
This indicates that for the same discharge, different combinations of velocity
and cross sectional area are possible to produce different flow regimes (Hugget, 2011).
This is shown by the Froude Number (Fr), which is a dimensionless ratio of the inertial
force to the gravitational force; and usually computed as the ratio of the velocity (v) to
the velocity of gravity waves (√𝑔𝐷; where g is the gravitational acceleration and D is
the hydraulic depth). Therefore, for a given discharge, flow is described as subcritical
(Fr<1), deep and slow-moving; or supercritical (Fr>1), rapid and shallow. The flow in
a natural river rarely exceeds a Froude Number of 0.5 although supercritical flows
temporarily occur, and are associated with large energy losses which promote channel
erosion and enlargement (Hugget, 2011).
Flow in rivers can also be classified based on Reynold’s number (Re) which is
the ratio of the inertial forces to the viscous forces in the flow (Anderson and Anderson,
2010). For low Reynold’s numbers (Re< 500), the flow is termed as laminar, with
viscous forces being significant. In contrast, at high Reynold’s numbers (Re>2000), the
flow is termed turbulent, where inertia is the controlling factor; creating eddies, vortices
and flow instabilities ( Chanson, 2004; Anderson and Anderson, 2010; Fryirs and
Brierley, 2012). Flow in a natural river is turbulent and consists of the main longitudinal
12
flow and secondary/transverse flow with the direction of the secondary flow dependent
on the location of the transverse cross section within the channel (Fig. 2.2).
The flow in river channels has been closely linked with the study of fluid
mechanics. Thus, hydrodynamics of river flow can be explained by the application of
the theories of fluid mechanics through open channel hydraulics (Anderson and
Anderson, 2010; Wright and Crosato, 2011); hence, to understand hydrodynamics of a
river, the forces causing the flow and the forces the flowing water both within the flow
and on the boundaries are important. Through the flow from headwaters to its mouth,
a natural river represents a system in which potential energy provided by water volumes
at given elevations is converted to kinetic energy of the flowing water, and dissipated
through friction created at the boundaries (Leopold et al., 1964; Kondolf, 1997). These
interactions highlight the two external forces that act on flowing water in river channels:
the gravitational force (impelling force) which drives the water downslope; and the
frictional force (resisting force) which resists the download movement of the flow
(Leopold et al., 1964; Anderson and Anderson, 2010; Hugget, 2011). The impelling
force refers to the hydraulic force due to the flowing water which is dependent on the
slope of the flow; while the resisting force is the hydraulic resistance to the flow which
depends on the nature of the flowing fluid and its interaction with the channel bed and
bank, and the physical characteristics of the river which resist geomorphic change
(Leopold et al., 1964; Charlton, 2007; Fryirs and Brierley, 2012; Bierman and
Montgomery, 2014). As alluvial rivers are shaped by successive water flows which
scour the channel bed, the interaction of these impelling and resisting forces creates the
conditions for the river to shape its channel through eroding its bed and banks,
transporting sediments and depositing sediments (Leopold et al., 1964; Jia et al., 2016;
Wang et al., 2017).
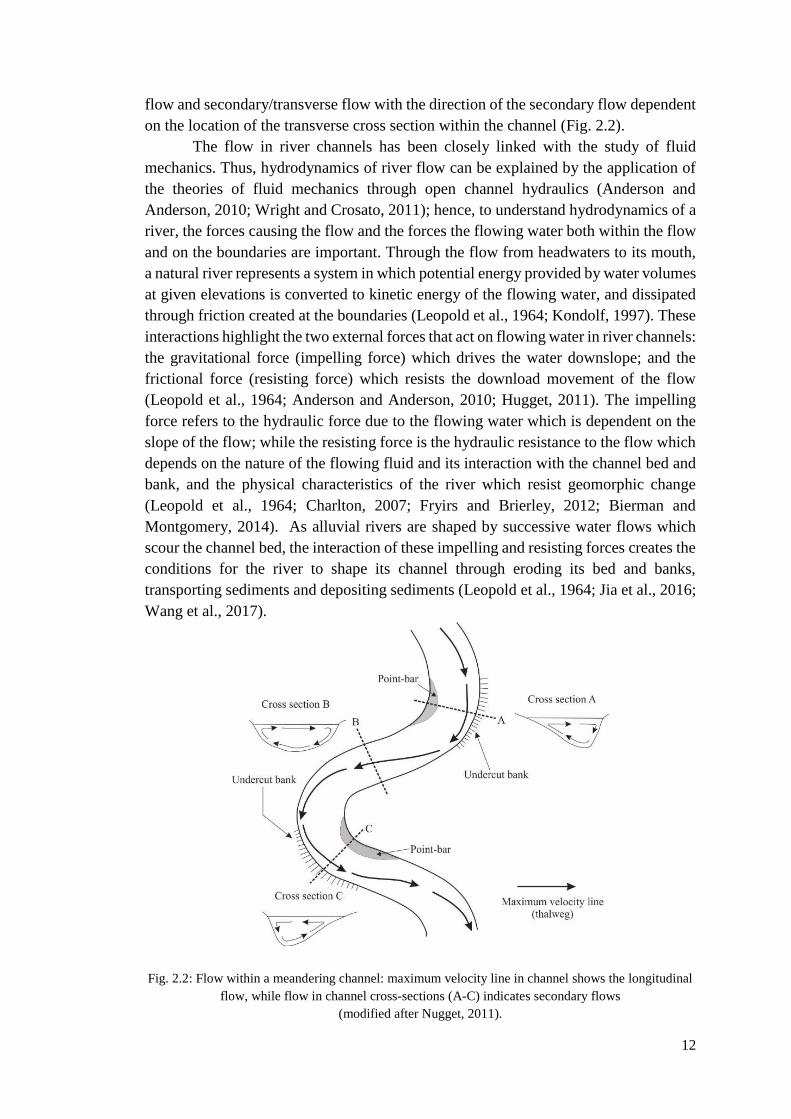
Fig. 2.2: Flow within a meandering channel: maximum velocity line in channel shows the longitudinal
flow, while flow in channel cross-sections (A-C) indicates secondary flows
(modified after Nugget, 2011).

13
The impelling force is reflected in the stream power and the boundary shear
stress. The stream power measures the rate of work done by the flow in overcoming the
bed resistance, internal flow resistance as well as transporting the sediment load of the
flow; hence, the total energy of the flow (Fryirs and Brierley, 2012). The stream power
(measured in W/m2) is defined by the expression (Huggett, 2011):
Ω = 𝛾 𝑄 𝑠
Where Ω is the stream power, 𝛾 refers to the specific weight of the flowing water (9800
N/m2), Q is discharge (m3/s) and s is bed-slope (m/m). From the equation, it is evident
that discharge and slope are the main influencing factors of stream power; thus, an
increase in discharge and/or slope increases stream power.
The boundary shear stress (τ) on the other hand, is a measure of the force of the
flow per unit area of channel bed and is defined as the drag force exerted the flow on
the channel bed (Huggett, 2011). This is expressed mathematically as:
τ = 𝛾 𝑅 𝑠
with 𝛾 referring to the specific weight of the flowing water (9800 N/m2), R is the
hydraulic radius (m) and s is the bed-slope (m/m).
The resisting force in a flow serves a means for the river to dissipate its energy,
thereby reducing the available energy for channel processes or adjustment. When the
resisting force is due to the physical properties of the fluid, or as a result of the
interaction of the fluid with the channel bed and banks, it is termed as hydraulic
resistance (Fryirs and Brierley, 2012)). When physical characteristics of the river
system such as bedrock, outcrops, bedforms or bend development which increase the
roughness and resist geomorphic change in a quest to maintain channel morphology, it
is termed as the physical resistance (Fryirs and Brierley, 2012).
Due to the forces generated by the flow in rivers, the flow rate influences the
sediment transport rate of a river. However, the sediment transport rate increases as a
power function of the rate of flow.; thus, the sediment transport will therefore increase
by more than a 100% in response to a 100% increase in flow rate, with most sediments
transported during floods ( Richards, 1982; Kondolf, 1997).
2.1.2 Sediment transport in rivers
On the scale of the channel, there is an intricate relationship between channel’s
morphology, flow and sediment transport processes that modify the channel (Legleiter,
2014; Boskidis et al., 2018). In alluvial channels, the flow induced forces on the mobile
bed causes the displacement of sediments from the bed (Chanson, 2004; Armanini and
Gregoretti, 2005). These forces on a sediment particle include the hydrodynamic forces
(lift and drag forces), seepage force, weight and buoyancy force (Armanini and
Gregoretti, 2005; Fig. 2.3).
14
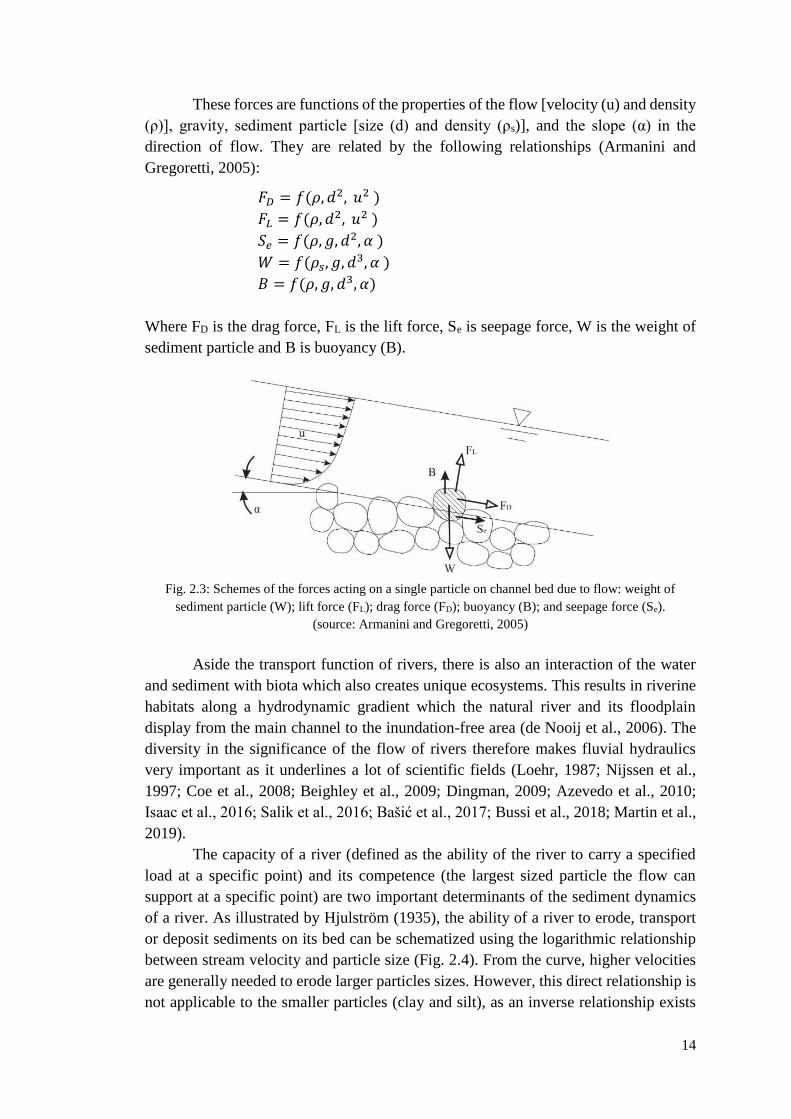
These forces are functions of the properties of the flow [velocity (u) and density
(ρ)], gravity, sediment particle [size (d) and density (ρs)], and the slope (α) in the
direction of flow. They are related by the following relationships (Armanini and
Gregoretti, 2005):
𝐹𝐷 = 𝑓(𝜌, 𝑑2, 𝑢2 )
𝐹𝐿 = 𝑓(𝜌, 𝑑2, 𝑢2 )
𝑆𝑒 = 𝑓(𝜌, 𝑔, 𝑑2, 𝛼 )
𝑊 = 𝑓(𝜌𝑠, 𝑔, 𝑑3, 𝛼 )
𝐵 = 𝑓(𝜌, 𝑔, 𝑑3, 𝛼)
Where FD is the drag force, FL is the lift force, Se is seepage force, W is the weight of
sediment particle and B is buoyancy (B).
Fig. 2.3: Schemes of the forces acting on a single particle on channel bed due to flow: weight of
sediment particle (W); lift force (FL); drag force (FD); buoyancy (B); and seepage force (Se).
(source: Armanini and Gregoretti, 2005)
Aside the transport function of rivers, there is also an interaction of the water
and sediment with biota which also creates unique ecosystems. This results in riverine
habitats along a hydrodynamic gradient which the natural river and its floodplain
display from the main channel to the inundation-free area (de Nooij et al., 2006). The
diversity in the significance of the flow of rivers therefore makes fluvial hydraulics
very important as it underlines a lot of scientific fields (Loehr, 1987; Nijssen et al.,
1997; Coe et al., 2008; Beighley et al., 2009; Dingman, 2009; Azevedo et al., 2010;
Isaac et al., 2016; Salik et al., 2016; Bašić et al., 2017; Bussi et al., 2018; Martin et al.,
2019).
The capacity of a river (defined as the ability of the river to carry a specified
load at a specific point) and its competence (the largest sized particle the flow can
support at a specific point) are two important determinants of the sediment dynamics
of a river. As illustrated by Hjulström (1935), the ability of a river to erode, transport
or deposit sediments on its bed can be schematized using the logarithmic relationship
between stream velocity and particle size (Fig. 2.4). From the curve, higher velocities
are generally needed to erode larger particles sizes. However, this direct relationship is
not applicable to the smaller particles (clay and silt), as an inverse relationship exists
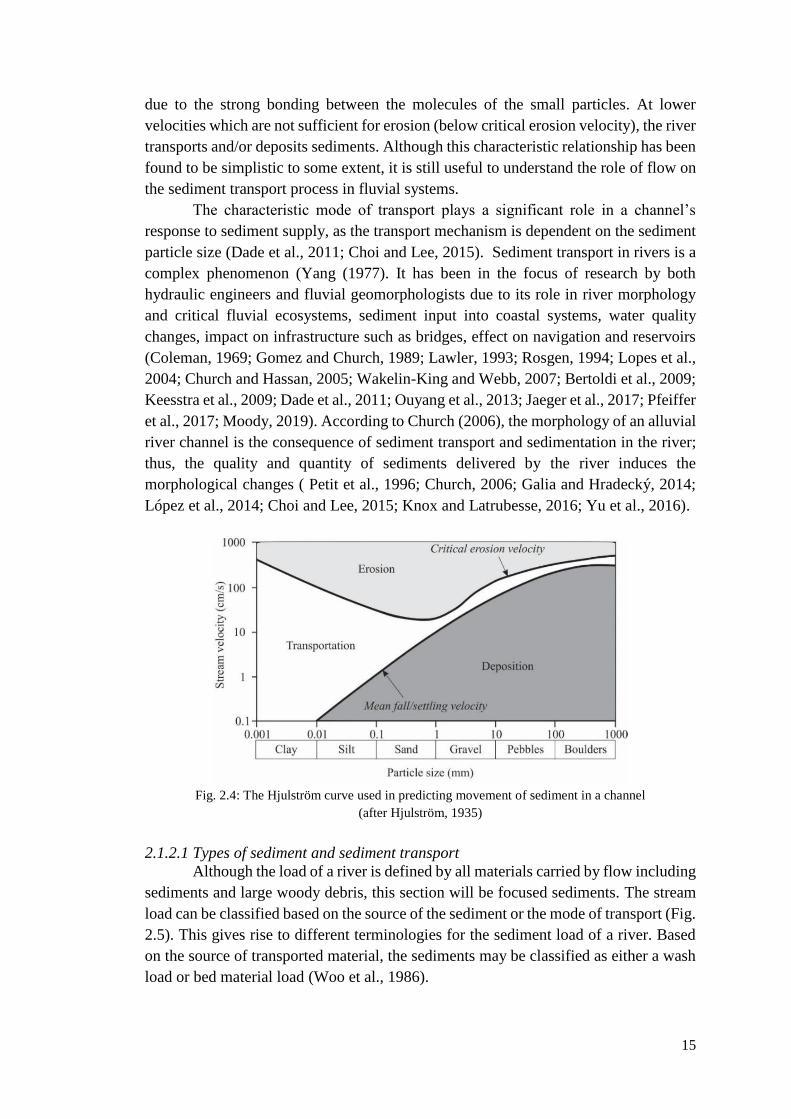
15
due to the strong bonding between the molecules of the small particles. At lower
velocities which are not sufficient for erosion (below critical erosion velocity), the river
transports and/or deposits sediments. Although this characteristic relationship has been
found to be simplistic to some extent, it is still useful to understand the role of flow on
the sediment transport process in fluvial systems.
The characteristic mode of transport plays a significant role in a channel’s
response to sediment supply, as the transport mechanism is dependent on the sediment
particle size (Dade et al., 2011; Choi and Lee, 2015). Sediment transport in rivers is a
complex phenomenon (Yang (1977). It has been in the focus of research by both
hydraulic engineers and fluvial geomorphologists due to its role in river morphology
and critical fluvial ecosystems, sediment input into coastal systems, water quality
changes, impact on infrastructure such as bridges, effect on navigation and reservoirs
(Coleman, 1969; Gomez and Church, 1989; Lawler, 1993; Rosgen, 1994; Lopes et al.,
2004; Church and Hassan, 2005; Wakelin-King and Webb, 2007; Bertoldi et al., 2009;
Keesstra et al., 2009; Dade et al., 2011; Ouyang et al., 2013; Jaeger et al., 2017; Pfeiffer
et al., 2017; Moody, 2019). According to Church (2006), the morphology of an alluvial
river channel is the consequence of sediment transport and sedimentation in the river;
thus, the quality and quantity of sediments delivered by the river induces the
morphological changes ( Petit et al., 1996; Church, 2006; Galia and Hradecký, 2014;
López et al., 2014; Choi and Lee, 2015; Knox and Latrubesse, 2016; Yu et al., 2016).
Fig. 2.4: The Hjulström curve used in predicting movement of sediment in a channel
(after Hjulström, 1935)
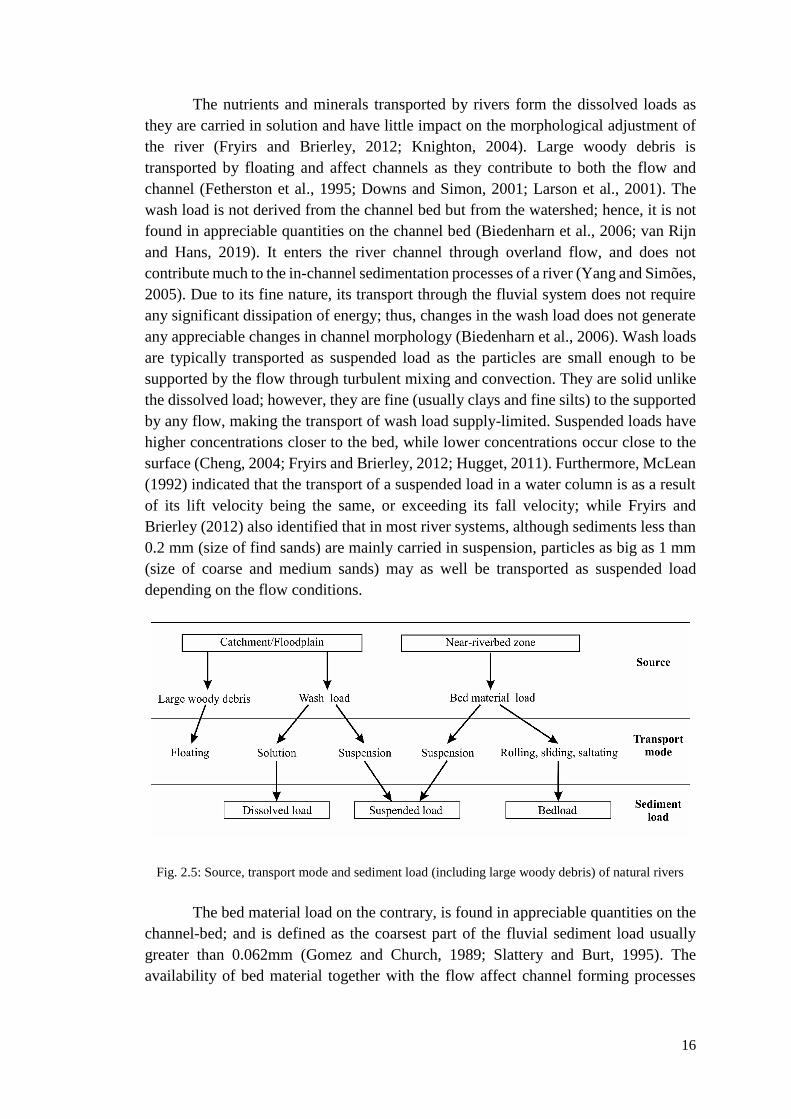
2.1.2.1 Types of sediment and sediment transport
Although the load of a river is defined by all materials carried by flow including
sediments and large woody debris, this section will be focused sediments. The stream
load can be classified based on the source of the sediment or the mode of transport (Fig.
2.5). This gives rise to different terminologies for the sediment load of a river. Based
on the source of transported material, the sediments may be classified as either a wash
load or bed material load (Woo et al., 1986).
16
The nutrients and minerals transported by rivers form the dissolved loads as
they are carried in solution and have little impact on the morphological adjustment of
the river (Fryirs and Brierley, 2012; Knighton, 2004). Large woody debris is
transported by floating and affect channels as they contribute to both the flow and
channel (Fetherston et al., 1995; Downs and Simon, 2001; Larson et al., 2001). The
wash load is not derived from the channel bed but from the watershed; hence, it is not
found in appreciable quantities on the channel bed (Biedenharn et al., 2006; van Rijn
and Hans, 2019). It enters the river channel through overland flow, and does not
contribute much to the in-channel sedimentation processes of a river (Yang and Simões,
2005). Due to its fine nature, its transport through the fluvial system does not require
any significant dissipation of energy; thus, changes in the wash load does not generate
any appreciable changes in channel morphology (Biedenharn et al., 2006). Wash loads
are typically transported as suspended load as the particles are small enough to be
supported by the flow through turbulent mixing and convection. They are solid unlike
the dissolved load; however, they are fine (usually clays and fine silts) to the supported
by any flow, making the transport of wash load supply-limited. Suspended loads have
higher concentrations closer to the bed, while lower concentrations occur close to the
surface (Cheng, 2004; Fryirs and Brierley, 2012; Hugget, 2011). Furthermore, McLean
(1992) indicated that the transport of a suspended load in a water column is as a result
of its lift velocity being the same, or exceeding its fall velocity; while Fryirs and
Brierley (2012) also identified that in most river systems, although sediments less than
0.2 mm (size of find sands) are mainly carried in suspension, particles as big as 1 mm
(size of coarse and medium sands) may as well be transported as suspended load
depending on the flow conditions.
Fig. 2.5: Source, transport mode and sediment load (including large woody debris) of natural rivers
The bed material load on the contrary, is found in appreciable quantities on the
channel-bed; and is defined as the coarsest part of the fluvial sediment load usually
greater than 0.062mm (Gomez and Church, 1989; Slattery and Burt, 1995). The
availability of bed material together with the flow affect channel forming processes

17
which result in different channel characteristics such as planform: straight, meandering
anastomosing and braiding (Hugget, 2011).
Bedload involves the transport of sediments which moves on or just above the
river bed (Gomez and Church, 1989; Hugget, 2011; Fryirs and Brierley, 2012). Unlike
the suspended load, in bedload transport, the sediments maintain contact with the
channel bed and may move through rolling, sliding or saltation (Fig. 2.6). Bedload
movement takes place when the shear stress exceeds the critical shear stress. Depending
on the shape of the sediment, it may move along the bed by pushing by horizontal drag;
or through rolling (usually in gravel-bed rivers). At higher flow velocities, the
turbulence conditions may allow for temporary lifting of sediments which fall back
shortly afterwards, a process referred to as saltation (Gomez and Church, 1989; Fryirs
and Brierley, 2012). This therefore makes the transport of bed-material load capacity-
limited.
Fig. 2.6: Modes of sediment transport, indicating the types of bed load movement
(adapted from Leeder, 1999; Dey and Ali, 2017)
2.1.2.2 Measurement of bedload transport in rivers
Bedload transport has significant effects on the function of rivers: an over-
supply of sediments may result in aggradation of the river bed; thus, it can raise the
flood level and may result in a decrease in the river function. Conversely, an under-
supply causes degradation of the river bed endangering the natural stream installation
such as the bank, as well as engineering constructions such as bridge piers which may
have their foundations undermined (Choi and Lee, 2015). This makes the knowledge
of the amounts and rates of sediment transport critical for fluvial geomorphologists,
engineers, river managers and land-use planners among others, as it governs the
morphological evolution and biological functioning of rivers (Einstein et al., 1940;
Gao, 2008; Claude et al., 2012).
Although various studies have measured bedload transport rates, there were
wide variations in the transport rates both spatially and temporally; while it was also
found to be difficult to measure in many locations (Ryan and Porth, 1999; Turowski et
al., 2010; Rickenmann et al., 2012). There are various methods available for measuring
bedload transport in rivers. According to Rickenmann et al. (2012), sediment
18
measurement may involve a direct method involving the collection or trapping of
moving sediment particles; or indirectly by relating the sediment transported to the
transport intensity or concentration. Indirect sampling of bedload include the use of
acoustics (Rennie and Millar, 2004; Kostaschuk et al., 2005; Latosinski et al., 2017);
sonar imaging (Nittrouer et al., 2008); and impact sensors (Rickenmann and McArdell,
2007; Raven et al., 2010; Beylich and Laute, 2014; Barrière et al., 2015; Koshiba et al.,
2018). Conversely, direct sampling includes the use of bedload traps (Bunte et al.,
2008; Vericat and Batalla, 2010; Habersack et al., 2017); tracer techniques (Kondolf
and Matthews, 1986; Miller and Warrick, 2012); and pressure-differential samplers
(Ryan and Porth, 1999). The bedload across a river section is however often measured
with pressure-differential samplers (Ryan and Porth, 1999). which include US BLH 84
(Ryan and Porth, 1999), Elhwa (Childers et al., 2000), BTMA Arnheim (McLean et al.,
1999) and the Helley-Smith (Martín-Vide et al., 2015; Sterling and Church, 2002;
Vericat and Batalla, 2006; Ziegler et al., 2014a). Although no single bedload sampler
has gained universal acceptance as the standard for use in all types of streams, the
Helley Smith sampler (Helley and Smith, 1971) has been applied in various stream
types under varying conditions (Ryan and Porth, 1999; Sterling and Church, 2002;
Bunte et al., 2008; Imaizumi et al., 2009; Vericat and Batalla, 2010; Claude et al., 2012;
Beylich and Laute, 2014; López et al., 2014; Martín-Vide et al., 2015; Lemma et al.,
2019).
2.1.3 Channel bed incision
In alluvial rivers, channel incision is initiated either by sediment transport
capacity increases or bedload deficit; thus, it is generally a product of the sediment
transport within a river when there is an the imbalance between the sediment transport
capacity of and the sediment supply (Galay, 1983; Harvey and Watson, 1986; Watson
et al., 2007; Wyżga, 2007). Channel bed incision takes place when the erosive forces
of a flow are strong enough to overcome the strength of the underlying bed material;
hence, an imbalance of forces on the bed material due to destabilizing forces (gravity
force and hydrodynamic forces in the flow direction) ensures that incision takes place
by overcoming the channel’s resistance (Armanini and Gregoretti, 2005). As indicated
by Oskin et al. (2014), the stream power (which represents the energy of the flow) is
directly proportional to the channel bed incision; hence, an increase the stream power
increases the incision, although the relationship is not necessarily linear (Sklar and
Dietrich, 2001, 2004; Aubert et al., 2016). Channel bed incision has also been found to
be aggravated by the presence of floods (Gibson and Shelley, 2019). It is a process
which lowers the elevation of a channel’s thalweg which takes place in variable time
spans (James, 1997).
When a river is channelized or straightened, the shortened river length increases
the slope; thus, the capacity of the river is increased (Parker and Andres, 1976; Simon,
1989; Rinaldi and Simon, 1998; Wyżga, 2007). In other cases, the capacity is increased
by increased runoff due to land cover changes or climate (Beechie et al., 2008).
Conversely, a decrease in the sediment supply may be due to urbanization (Booth,
1990; Whitney et al., 2015); afforestation (Lach and Wyżga, 2002; Downs and Piégay,
19
2019), in-channel sediment mining (Rinaldi et al., 2005; Wyżga, 2007; Martín-Vide et
al., 2010; Sanchis-Ibor et al., 2017); base-level decrease (Ben Moshe et al., 2008;
Bowman et al., 2010; Edwards et al., 2016); artificial cut-offs and channelization
(Parker and Andres, 1976; Simon, 1989; Rinaldi and Simon, 1998; Wyżga, 2007); dam
and reservoir construction ( Edwards et al., 2016; Zhou et al., 2018; Baena-Escudero et
al., 2019); bank stabilization (Petit et al., 1996; Thompson et al., 2016); and subduction
related uplifts (Righter et al., 2010). In the Wisloka, a montane river in Poland, land-
use changes caused up 2 m incision over a period of almost 60 years (Lach and Wyżga,
2002). In two principal alluvial reaches of the Arno River in Italy (Upper Valdarno and
Lower Valdarno), incision of up to 8 m have been reported since the start of the 20th
century due to artificial cutoffs and channelization (Rinaldi and Simon, 1998).
Similarly, the Russian River in the United States (a gravel-bed river) experienced bed
lowering of up to 6 m over due to sediment mining and dam construction over more
than 50 years (Kondolf, 1997).
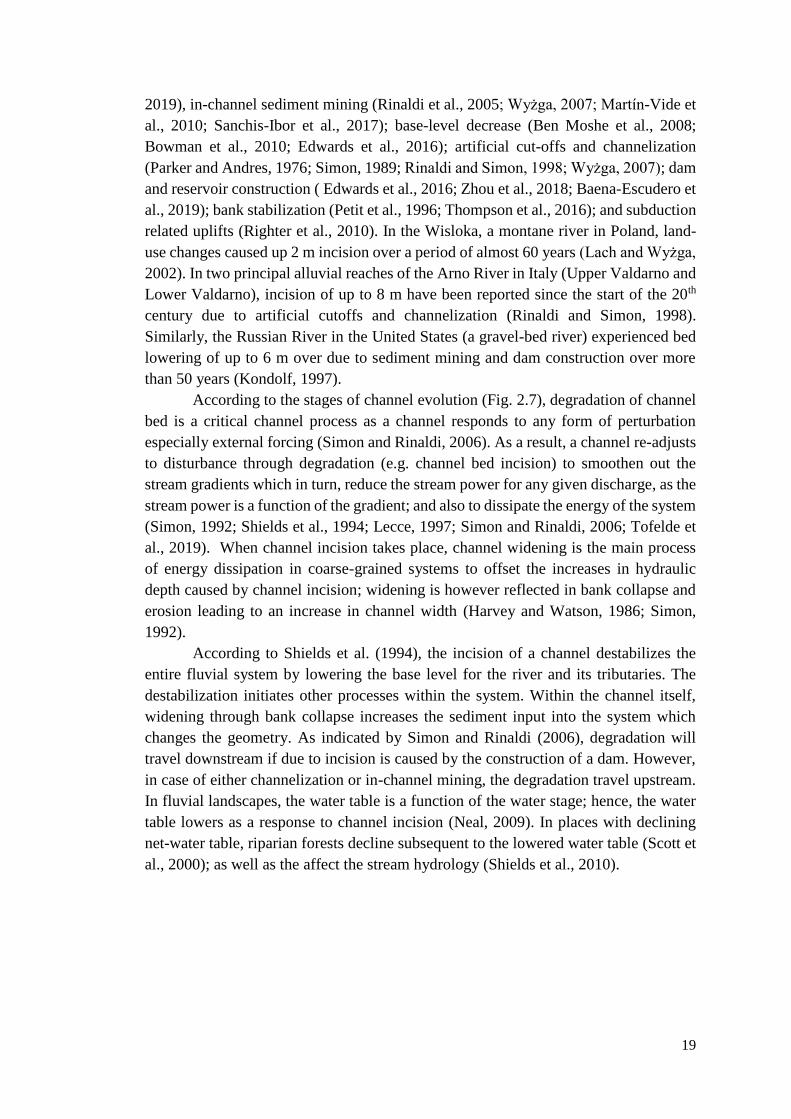
According to the stages of channel evolution (Fig. 2.7), degradation of channel
bed is a critical channel process as a channel responds to any form of perturbation
especially external forcing (Simon and Rinaldi, 2006). As a result, a channel re-adjusts
to disturbance through degradation (e.g. channel bed incision) to smoothen out the
stream gradients which in turn, reduce the stream power for any given discharge, as the
stream power is a function of the gradient; and also to dissipate the energy of the system
(Simon, 1992; Shields et al., 1994; Lecce, 1997; Simon and Rinaldi, 2006; Tofelde et
al., 2019). When channel incision takes place, channel widening is the main process
of energy dissipation in coarse-grained systems to offset the increases in hydraulic
depth caused by channel incision; widening is however reflected in bank collapse and
erosion leading to an increase in channel width (Harvey and Watson, 1986; Simon,
1992).
According to Shields et al. (1994), the incision of a channel destabilizes the
entire fluvial system by lowering the base level for the river and its tributaries. The
destabilization initiates other processes within the system. Within the channel itself,
widening through bank collapse increases the sediment input into the system which
changes the geometry. As indicated by Simon and Rinaldi (2006), degradation will
travel downstream if due to incision is caused by the construction of a dam. However,
in case of either channelization or in-channel mining, the degradation travel upstream.
In fluvial landscapes, the water table is a function of the water stage; hence, the water
table lowers as a response to channel incision (Neal, 2009). In places with declining
net-water table, riparian forests decline subsequent to the lowered water table (Scott et
al., 2000); as well as the affect the stream hydrology (Shields et al., 2010).
20
Fig. 2.7: Stages of channel evolution (source: Simon and Rinaldi, 2006)
2.1.4 Bank processes
As indicated previously, channel incision creates conditions for channel
widening which is a direct consequence of bank processes. Therefore, a destabilization
in a river system due to channel incision, will result in accelerated bank processes. Bank
and near-processes have been the focus of various research due to their importance in
the shaping of fluvial landscapes (Darby, 1998; Allan, 2004; Surian et al., 2009; Davis
and Harden, 2014; Xia et al., 2014). In alluvial rivers, they are the main processes of
channel development (Gilvear et al., 2000; Hickin, 1974; Hickin and Nanson, 1984;
Moody, 2019; Nanson, 1980; Nicoll and Hickin, 2010; Schuurman et al., 2016); hence,
they are translated into width variations, and general evolution of channels across
floodplains (Bertoldi et al., 2009; Darby, 1998; Edwards et al., 2016; Hagstrom et al.,
2018; Lewin and Manton, 1975; Thorne, 1991). Generally, floodplains may be as a
result of sediment deposition in convex sides of meanders in form of point-bar
development (Hickin, 1969). Conversely, bank erosion modifies floodplains through
corrasion and slumping of bank material (Hooke, 1979; Thorne, 1991). Therefore, in a
typical equilibrium channel, point-bar development and bank erosion complement each
other such that, changes in cross-sectional area and shape are negligible for a given set
of flow conditions (Chang, 2008; Church and Rice, 2009; Hickin, 1969; Schuurman et
al., 2016).
The rates of deposition and bank erosion in an alluvial channel have both wide
spatial and temporal variations (Eke et al., 2014; Lawler et al., 1997). Bank processes
are affected by various factors including flow/discharge (Blanckaert et al., 2012;
Downs and Simon, 2001; Rinaldi et al., 2004), sediment transport (Prosser et al., 2000;
Surian et al., 2009), channel geometry (De Marchis and Napoli, 2008; Millar, 2000)
and riparian vegetation (Abernethy and Rutherfurd, 2000; Simon et al., 2007; Vargas‐
Luna et al., 2019).

21
The significance of point-bars is reflected in several studies (Clarke and Bryson,
1959; Davies, 1966; Dietrich and Smith, 1983; Eke et al., 2014; Hodskinson and
Ferguson, 1998; Kasvi et al., 2013; Lawler, 1993; Pyrce and Ashmore, 2005; Singh,
1972; Wu et al., 2016). Their formation is as a result of the transportation of eroded
sediments by secondary currents to the zone of low shear stress and velocity, at the
convex bank where they are deposited (Dietrich and Smith, 1983; Hickin, 1974). The
measurement of the development of point-bars include the use of aerial photographs
(Srisunthon and Choowong, 2019), digital terrain models (Kasvi et al., 2013), satellite
images and laser surveys (Hagstrom et al., 2018; Kasvi et al., 2013; Srisunthon and
Choowong, 2019) and differential Global Position Systems (Cosma et al., 2019). The
complex interplay of flows, quality and quantity of sediments, as well the geometry of
rivers are significant in the deposition and erosion of a point-bar, just as in many other
fluvial processes (Galia and Hradecký, 2014; Hagstrom et al., 2018; Moody, 2019).
The relative location of the point-bar either in the upstream or downstream section also
affects its development (Ghinassi et al., 2016). River bank erosion remains the focus of
a lot of research cutting across various disciplines including geomorphology, geology,
hydrology, ecology and river engineering; although it was previously neglected
(Blanckaert et al., 2012; Hooke, 1980; Iwasaki et al., 2016; Kesel et al., 1974; Lai and
Greimann, 2008; Lawler et al., 1997; Luppi et al., 2009; Matsubara and Howard, 2014;
Murgatroyd and Ternan, 1983; Nagata et al., 2014; Rinaldi et al., 2008; Rusnák et al.,
2016; Simon et al., 2000; Wallick et al., 2006). In an alluvial river, it represents the
response of the channel to energy dissipation; and serves as the main mechanism
through which the channel offsets increases in hydraulic depth subsequent to channel
incision (Simon, 1992; Simon et al., 2000). It also has various effects on ecosystems,
infrastructure, water quality and agriculture (Davis and Harden, 2014; Mutton and
Haque, 2004; Nagata et al., 2000; Nakagawa et al., 2013; Piégay et al., 1997). River
bank erosion has an advantage of being a relatively rapid process compared with other
geomorphological processes, hence, making it crucial in understanding changes in the
river’s landscape; especially, the effects of human activities on channel processes,
which is important for river management (Hooke, 1980; Kis and Lóczy, 2018). Due to
its critical importance, various methods have been developed to measure it. This
includes erosion pins (Couper et al., 2002; Couper and Maddock, 2001; Lawler et al.,
1997), satellite images and historical maps (Khan and Islam, 2003; Micheli and
Kirchner, 2002), terrestrial laser scanning and photogrammetry (Lawler, 1992; Micheli
and Kirchner, 2002; Mitchell et al., 1999; O’Neal and Pizzuto, 2011), and models
(Darby et al., 2002, 2002; Matsubara and Howard, 2014; Mosselman, 1995).
Although bank erosion is described as either through corrasion or mass
movement (Hooke, 1979), it is controlled by subaerial processes that loosen the
sediments (Prosser et al., 2000). This is highlighted by (Couper and Maddock, 2001)
who indicated the three mechanisms of bank erosion as mass failure, fluvial
entrainment and sub-aerial weakening and weathering. This is reiterated by Fryirs and
Brierley (2012) who indicated that hydraulic action processes (fluid corrasion and sub-
aerial processes) and mass wasting processes (slab failure, rotational slip, fall, sliding

22
and slump) are responsible for bank erosion. However, they included these processes
in a pseudo-cyclic process which controls bank morphology (Fig. 2.8).
Fig. 2.8: The cycle of bank erosion cycle showing the influences of hydraulic action and mass wasting
at various stages of the cycle (source: Fryirs and Brierley, 2012)
2.1.5 Meanders and channel migration
River channel movement is a key process by which floodplains are formed,
developed or renewed (Hooke, 1980). Meandering is a feature of alluvial channels and
is a product of the interplay of deposition in convex banks and erosion on concave
banks, where the banks consist of material fine enough to be eroded and transported
but have enough cohesive strength to maintain firm banks (Hickin, 1969; Langbein and
Leopold, 1964; Leopold and Langbein, 1966). They are modified as banks fail through
erosion and mass wasting, while flow supports the deposition in the convex banks
(Lanzoni and Seminara, 2006; Motta et al., 2014). This is supported by various
literature which explained meandering to be the result of sediment, water and channel
interactions through sediment supply rate, bed sediment size, bank cohesion,
longitudinal slope and water flow (Bogoni et al., 2017; Gaurav et al., 2017; Güneralp
et al., 2012; Konsoer et al., 2016; Robert, 2003; Wang et al., 2019; Zen et al., 2016). A
meander generally forms due to the differences in the energy distribution of flow in the
concave and convex bends (Leopold and Wolman, 1960).
Meanders and meandering in rivers remains a well-researched field (Güneralp
and Rhoads, 2011; Hey, 1976; Hooke, 1984; Parker and Andres, 1976; Schwenk et al.,
2015; Tubino and Seminara, 1990; Wang et al., 2019; Weisscher et al., 2019; Williams,
1986; Zen et al., 2016; Zolezzi et al., 2012), cutting across various disciplines including
geomorphology, ecology, geology and river engineering (Blettler et al., 2012;

23
Camporeale and Ridolfi, 2010; Iwata et al., 2003; Langbein and Leopold, 1964; Yang,
1971). In a typical fluvial system, meander studies are significant in infrastructure
planning and disaster prevention since the movement of meanders across the floodplain
is associated with loss of land (Matsubara and Howard, 2014). While meandering
increases the length, thereby reducing the slope in a channel, the complex morphology
of meanders also affect flow in channels (De Marchis and Napoli, 2008; Lofthouse and
Robert, 2008). This creates complex flow profiles in meander bend (Engel and Rhoads,
2017; Posner and Duan, 2012). River flow in meanders are highly three dimensional;
with the primary flow in the flow direction, and the secondary flow in transverse and
vertical directions (Liu and Bai, 2014; Stoesser et al., 2010). Due to the morphology of
meanders, the main secondary current developed induces shear stresses and consequent
erosion on the outer bank, while another secondary current moves the eroded sediment
through convection to the convex banks (Chen and Tang, 2012; Engel and Rhoads,
2017; Sankalp et al., 2015; Stoesser et al., 2010).
The degree of meandering of a river may be measured with sinuosity which is
a ratio of the channel length to the valley length (Ferguson, 1977). Sinuosity is usually
measured between 1 and 4, and indicates the characteristic plan form of a river which
is dependent on the length and amplitude of a meander (Leopold et al., 1964).
2.2 Human impacts on river systems
Alluvial river systems, just like other river systems in their natural states are considered
to be in a state of equilibrium. Due to the various benefits of rivers in human
civilizations, they have been modified in several ways by humans. In a typical
equilibrium channel, although various bed and bank processes are present, the changes
in cross-sectional area and shape are negligible for the given set of flow conditions
(Hickin, 1969). This character of the river termed dynamic equilibrium is such that, the
river continuously makes adjustment to maintain an approximate state by balancing
processes and form; hence, it will change due to altered boundary conditions by
adjusting flow and sediment fluxes (Fryirs and Brierley, 2012; Knighton, 2004). A
river, like many geomorphic systems metamorphosizes into a disequilibrium when
subjected to modifications beyond a certain magnitude and frequency depending on the
sensitivity and resilience of the river system (Slaymaker et al., 2009). However, human
interventions do not change the fundamental hydraulic and geomorphic processes of
rivers, but rather affect the spatial distribution and rates of these processes which results
in changes in channel morphology (Fryirs and Brierley, 2012). Thus, they occur
through alterations in the flow fluxes and sediment fluxes; and also, the distribution of
resistance elements such as vegetation (Fryirs and Brierley, 2012; Wohl et al., 2015).
2.2.1 Direct and indirect types of human interventions on river systems
The human interventions on river systems can be termed as direct or indirect
human interventions. Direct human interventions refer to modifications that are
planned and directly modify the river form and/or affect the river’s behavior. They are
usually localized and influence a rapid response from the river (Fryirs and Brierley,
2012). Examples include the construction of dams/reservoirs (Nelson et al., 2013; Piqué

24
et al., 2016; Topping et al., 2018; Vericat and Batalla, 2006; Williams and Wolman,
1984; Xia et al., 2014; Yang et al., 2019; Zhou et al., 2018; Ziegler et al., 2014b),
sand/gravel mining (Martín-Vide et al., 2010; Petit et al., 1996; Picco et al., 2017;
Rinaldi et al., 2005; Sanchis-Ibor et al., 2017), water extraction or diversion (Petts and
Gurnell, 2013; Wang and Xu, 2016), removal of riparian vegetation (Domer et al.,
2019; Macfarlane et al., 2017), channelization, artificial cutoffs and channel
straightening (Baena-Escudero et al., 2019; Li and Gao, 2019; Roberge, 2002; Smith
and Winkley, 1996; Tiron Dutu et al., 2019), construction of bank stabilization
structures including revetment and groynes , in-channel infrastructure such as bridge
piers (Roberge, 2002; Trueheart et al., 2020; Wang et al., 2018), and construction of
embankments (Earchi et al., 1995; Lehotský et al., 2010; Provansal et al., 2014;
Vázquez-Tarrío and Menéndez-Duarte, 2014).
The indirect human interventions on the other hand, refer to activities, which
although not directly on the channel, alter boundary conditions of the river system
resulting in changes in the flow and sediment fluxes, which also influence the processes
and form of the river (Fryirs and Brierley, 2012; Goudie, 2013). They usually involve
catchment-scale land cover changes including afforestation (Huang et al., 2018; Meng
et al., 2019; Provansal et al., 2014; Wang et al., 2007), deforestation (Latrubesse et al.,
2009; Panday et al., 2015; Restrepo et al., 2015), changes in agricultural practices
(Dewan et al., 2017; Morais et al., 2016); urbanization and construction of
infrastructure (Morais et al., 2016; Yu et al., 2016).
2.2.2 Response of river systems to direct human interventions
As dynamic as river systems are, it is important to distinguish between human-
induced and natural changes in the processes and forms of rivers since it is important
in effective management of rivers due to the diverse range of management strategies
(Wohl et al., 2015). The beds of rivers are usually very sensitive to any modification of
discharge and sediment supply both in the catchment. Therefore, any human impact
which alters these effects changes in the channel. Due to the differences in direct and
indirect interventions on river systems, their impacts also differ in rate and extent. River
response to indirect human interventions are influenced usually by the type of
landscape (Fryirs and Brierley, 2012). These indirect interventions just like climate
change alter the hydrology of the catchment which affect the runoff. Certain
agricultural practices expose the land surface which increases the erosion form the
catchment; while deforestation increases the runoff and sediment yield through erosion
due to reduced infiltration while afforestation results in the reverse (Restrepo et al.,
2015). Urbanization generally results in land cover use changes with hard surfaces
reducing infiltration and increasing surface runoff.
As direct interventions alter the water flow and sediment transport, the hungry
river water (due to excess energy) generally incise and erode banks downstream
(Kondolf, 1997). Human interventions such as artificial cutoffs and straightening
increase the slope of the channel, thereby increasing flow. The increased flow reduces
or eliminates the interaction of the flow with groundwater flow and adjacent
floodplains. The straightening also destroys valuable ecosystems which were created

25
in the meander bends. It also affects riparian vegetation, as the straightened channel
reduces nutrient input. As indicated by Schumm (1963), sinuosity is positively
correlated with the weighted percent of silt/clay in the channel. The disconnection of
floodplains as a result of the construction of levees will therefore affect the sinuosity
as the needed silt/clay content are reduced. Although direct interventions have
implications downstream, artificial cutoffs have been found to have an upstream
incision migration with rates of up to 0.6 m/y, while aggradation rates of up 0.12 m/y
occurred downstream (Simon, 1989; Baena-Escudero et al., 2019). In the long-term
however, both upstream and downstream sections experienced aggradation.
Bank and bed stabilization measures also cut the channel off from its floodplain and
increase flow velocities due to the reduced friction. Riparian vegetation have
detrimental effects on rivers as they support vital ecosystems, influence floods by
increasing resistance to flow as well as contributing to bank stability (Croke et al., 2017;
Krzeminska et al., 2019; Yu et al., 2020). Dams and reservoir are one of the commonest
interventions in rivers, and they directly change the flow and sediment regime through
the barrier created by the dam (Fryirs and Brierley, 2012; Goudie, 2013). This creates
sedimentation upstream and incision downstream due to altered flow and sediment
regime with added implications for ecosystems (Costa et al., 2015; Kingsford and
Thomas, 2004; Kondolf, 1997; Petts and Gurnell, 2013). While the diversion and/or
extraction of water from the channel induce aggradation, bank stabilization
constructions increase flow velocity and induce scouring (Landon et al., 1998; Gregory,
2006; Huang et al., 2014, Vázquez-Tarrío et al., 2019).Instream mining creates an
imbalance between the sediment supply and the sediment transport capacity (Fryirs and
Brierley, 2012; Petit et al., 1996). The deficiency in the sediment supply allows the
river to use excess energy to incise its bed and erode its banks (Martín-Vide et al., 2010;
Petit et al., 1996; Picco et al., 2017). Aside this, instream mining also causes channels
to lose bed amouring which creates scouring on the channel beds (Arróspide et al.,
2018). In spite of these, the lowering of the channel bed allows for channel capacity,
increasing the channel’s ability to conduct floods; hence, lesser resulting in lesser
floods (Martín-Vide et al., 2010).
The evolution of river systems will ideally follow their natural patterns in the
absence of human interventions which serve as stressors. However, river systems like
most geomorphic systems can never be free of human interventions due to the
increasing interdependence between humans and the river systems (Slaymaker et al.,
2009). Although attempts to restore some rivers to their natural states may yield
positive results, certain thresholds serve as controls depending on the vulnerability of
the system (Fryirs and Brierley, 2012; Slaymaker et al., 2009).
2.3 Modelling of river systems
Fluvial morphometry encompasses various methods (Goudie, 2003). The
conventional methods of fluvial geomorphology have been observation-based
including laboratory analyses and field measurements (Coulthard and Van De Wiel,
2012). However, advances in fluvial geomorphology, some problems require solutions
beyond the available these conventional methods; requiring more advanced techniques
26
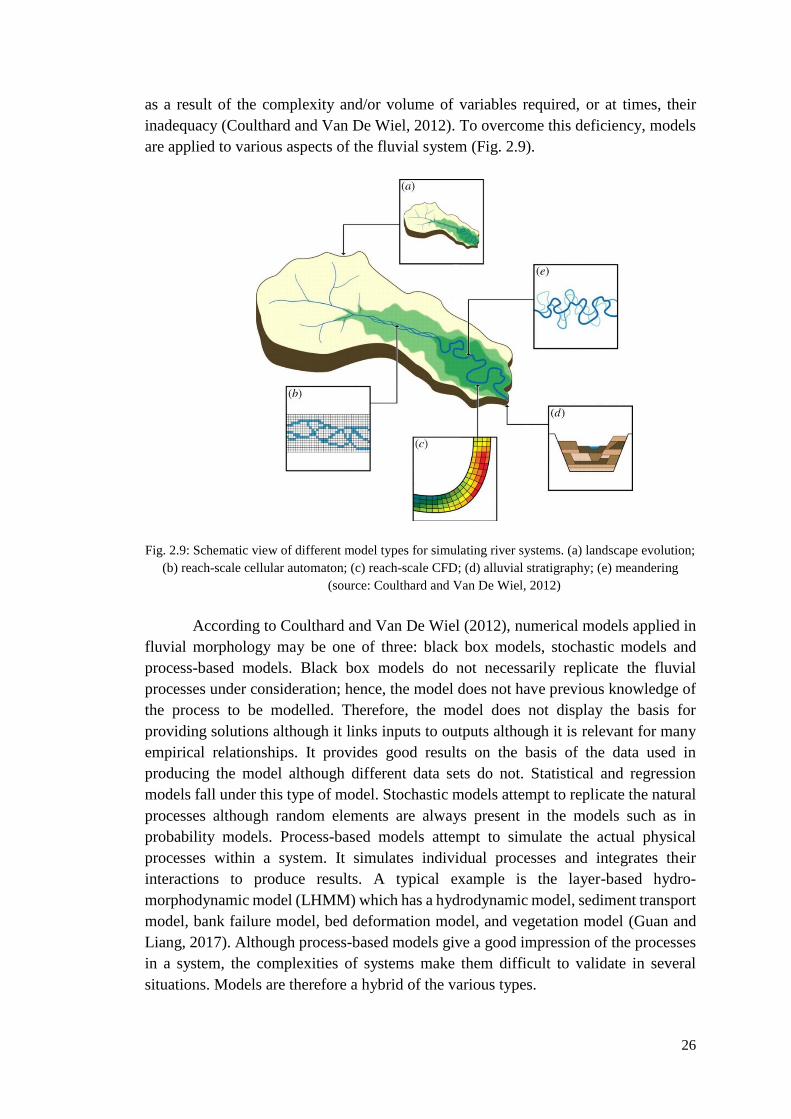
as a result of the complexity and/or volume of variables required, or at times, their
inadequacy (Coulthard and Van De Wiel, 2012). To overcome this deficiency, models
are applied to various aspects of the fluvial system (Fig. 2.9).
Fig. 2.9: Schematic view of different model types for simulating river systems. (a) landscape evolution;
(b) reach-scale cellular automaton; (c) reach-scale CFD; (d) alluvial stratigraphy; (e) meandering
(source: Coulthard and Van De Wiel, 2012)
According to Coulthard and Van De Wiel (2012), numerical models applied in
fluvial morphology may be one of three: black box models, stochastic models and
process-based models. Black box models do not necessarily replicate the fluvial
processes under consideration; hence, the model does not have previous knowledge of
the process to be modelled. Therefore, the model does not display the basis for
providing solutions although it links inputs to outputs although it is relevant for many
empirical relationships. It provides good results on the basis of the data used in
producing the model although different data sets do not. Statistical and regression
models fall under this type of model. Stochastic models attempt to replicate the natural
processes although random elements are always present in the models such as in
probability models. Process-based models attempt to simulate the actual physical
processes within a system. It simulates individual processes and integrates their
interactions to produce results. A typical example is the layer-based hydro-
morphodynamic model (LHMM) which has a hydrodynamic model, sediment transport
model, bank failure model, bed deformation model, and vegetation model (Guan and
Liang, 2017). Although process-based models give a good impression of the processes
in a system, the complexities of systems make them difficult to validate in several
situations. Models are therefore a hybrid of the various types.

27
To be able to predict the processes within a river, a process-based model must
be able to simulate reality through the simulated results (Coulthard and Van De Wiel,
2012; Guan and Liang, 2017). In certain cases, the boundary initial conditions of the
river not be complete or unavailable altogether. This implies simulated input values
based on stochastic models may as well be used in the process-based model. The advent
of more advanced computer technology has allowed simulations to be closer to reality.
Several problems in river morphology have been solved using models (Choi and Kang,
2006; Costabile and Macchione, 2015; Crosato and Saleh, 2011; De Vriend, 1977;
Meert et al., 2018; Schielen and Blom, 2018). However, quantitative analysis has to be
carried out with caution as some inputs and processes are still random, therefore not
reflective of the reality. Notable process-based models with wide applications include
the MIKE11 suite from Danish Hydraulics Institute (DHI), Denmark and the Delft3D
suite from Deltares (formerly, Delft Hydraulics) in The Netherlands.
In most process-based models such as the Delft3D and MIKE modelling suite,
bedload transport models are incorporated in the sediment transport modules of the
models. There are however other models used in various bedload studies (Aubert et al.,
2016; Pizzuto, 2016; Sun et al., 2001). Sediment transport models and upscaling in
modelling vary based on the underlying processes. They provide solutions to complex
problems which cannot be solved with conventional methods. However, disadvantages
include coarse results due to scales, varying levels of accuracy, the heterogeneity of
channels and catchments make representation in models more complicated, and the
need for data for calibration and validation are sometimes difficult to obtain (Anderson
et al., 2003; Coulthard and Van De Wiel, 2012).
28
3. THE STUDY AREA
The research covered study locations mainly on the Tisza River. However,
bedload sediment sampling was carried out on the Maros River which is a tributary of
the Tisza. Hence, although description of the characteristics of the sampling site on the
Maros is made, the focus of this chapter is generally on the Tisza River and its
catchment.
3.1 The Physical setting of the Tisza and Maros Rivers
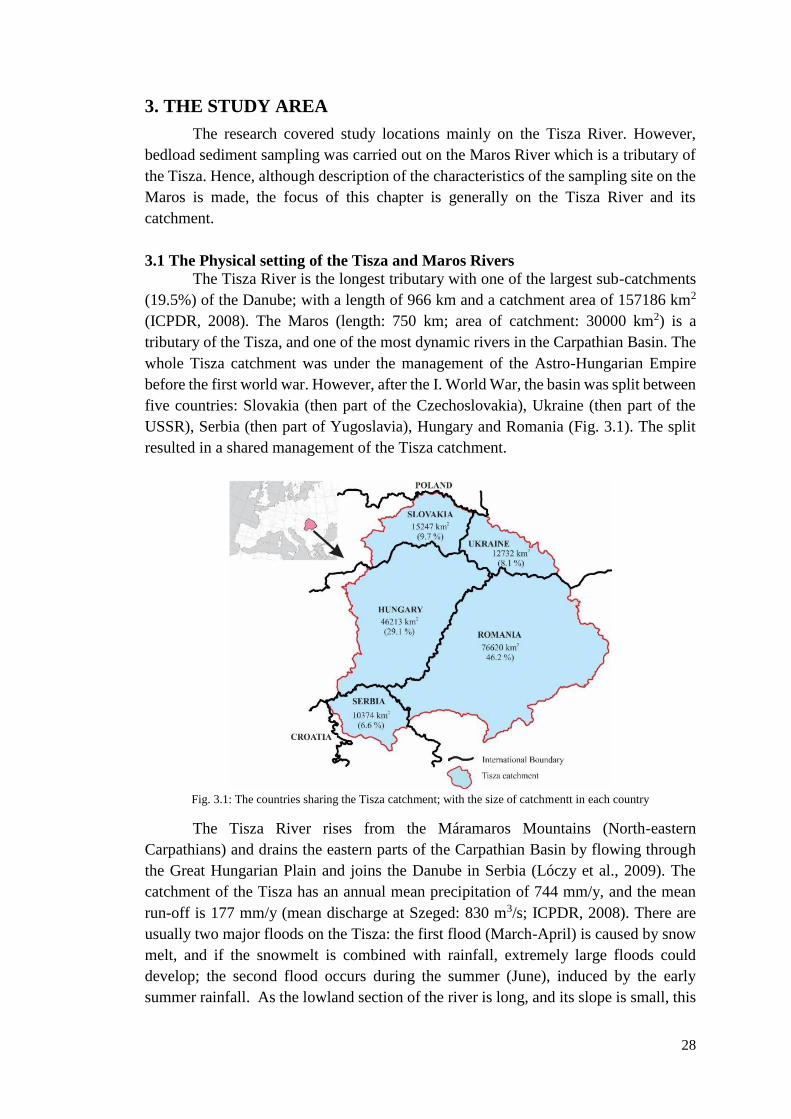
The Tisza River is the longest tributary with one of the largest sub-catchments
(19.5%) of the Danube; with a length of 966 km and a catchment area of 157186 km2
(ICPDR, 2008). The Maros (length: 750 km; area of catchment: 30000 km2) is a
tributary of the Tisza, and one of the most dynamic rivers in the Carpathian Basin. The
whole Tisza catchment was under the management of the Astro-Hungarian Empire
before the first world war. However, after the I. World War, the basin was split between
five countries: Slovakia (then part of the Czechoslovakia), Ukraine (then part of the
USSR), Serbia (then part of Yugoslavia), Hungary and Romania (Fig. 3.1). The split
resulted in a shared management of the Tisza catchment.
Fig. 3.1: The countries sharing the Tisza catchment; with the size of catchmentt in each country
The Tisza River rises from the Máramaros Mountains (North-eastern
Carpathians) and drains the eastern parts of the Carpathian Basin by flowing through
the Great Hungarian Plain and joins the Danube in Serbia (Lóczy et al., 2009). The
catchment of the Tisza has an annual mean precipitation of 744 mm/y, and the mean
run-off is 177 mm/y (mean discharge at Szeged: 830 m3/s; ICPDR, 2008). There are
usually two major floods on the Tisza: the first flood (March-April) is caused by snow
melt, and if the snowmelt is combined with rainfall, extremely large floods could
develop; the second flood occurs during the summer (June), induced by the early
summer rainfall. As the lowland section of the river is long, and its slope is small, this

29
summer flood sometimes superimposes on the preceding spring flood; thus, record high
floods can develop (Mezősi, 2009). Floods on the Maros occur as that on the Tisza;
although they rise relatively quickly and last for only a short time (2 days/year in
average). Very often, the floods of the Tisza and of its tributaries occur at the same
time; thus, extreme high impounded floods can develop. Along the Tisza River, the
mean river discharge is 208 m3/s at Tiszabecs on the Upper Tisza, 551 m3/s at Szolnok
in the Middle Tisza, and 830 m3/s at Szeged on the Lower Tisza (Lóczy et al., 2009).
The water stage within these gauge stations, increased by 181 cm, 228 cm and 349 cm
respectively from 1876 to 2006 (Szlávik, 2001). The mean slope of the Tisza before the
regulation works was 3.7 cm/km, although this almost doubled after the regulations
(Mezősi, 1986).
The Tisza displays the character of a typical lowland river by transporting large
amounts of fine grained sandy and silty suspended sediment, and has a clayey bed
material (Lászlóffy, 1982; Mezősi, 2017; Kasse et al., 2010). The mean suspended
sediment concentration in the upper, middle and lower Tisza measured between 1970-
2000 are 3187 g/m3, 1200 g/m3, and 1880 g/m3 respectively; with the increase in the
Lower Tisza due to the relatively higher sediment concentration of the Maros (10,000
g/m3) at its confluence with the Tisza (Lóczy et al., 2009).
3.2 The regulation works
The regulation works (catchment-scale engineering interventions) on the Tisza
River was conceived and begun when the Tisza basin was under common management
to rid the vast lowland sections of the Great Hungarian Plain of inundations; and to
make them suitable for agriculture and related development (Ihrig, 1973). Before the
regulation works, the large floodplains along the lowland sections were frequently
inundated; thus, there was a high flood risk as the river was highly sinuous (with up to
17.5 sinuosity), with extensive back swamps behind wide belts of natural levees of 4-5
m relative height stretching along meander loops and oxbows (Lóczy et al, 2009).
The regulation works began in the mid-19th century with the construction of
flood control levees (2940 km in length) close to the river to disconnect the Tisza from
its alluvial wetlands to prevent inundations (Szlávik, 2000; Pinke, 2014); and to provide
safe areas for agriculture
It also involved artificial meander cutoffs to decrease the duration of floods
(Table 3; Dunka et al., 1996; Schweitzer, 2009). In all, 114 artificial meander cutoffs
were made which shortened the length of the Tisza by 32% leading to an increase in
the average river slope (gradient) from 3.7 to 6.0 (Mezősi, 1986). On the lowland
section of the Maros, 33 cutoffs were made which reduced its length from 260 km to
170 km and also doubled its slope (Laczay, 1975; Török, 1977). The cutoffs were made
by creating smaller pilot channels, and allowing the increased stream power of the river
to reshape the channel. This increased the sediment discharge, and with the reduction
of the floodplain of up to 70-80% in some cases, there was accelerated deposition of
up to 1.3 cm/y (1838-1957) along the Tisza on these confined active floodplains; with
even higher values of up to 10 cm/y (1976-1983) on the natural levees and point-bars
of the Middle and Lower Tisza (Károlyi, 1960; Szlávik, 2001; Kiss et al., 2011; Nagy
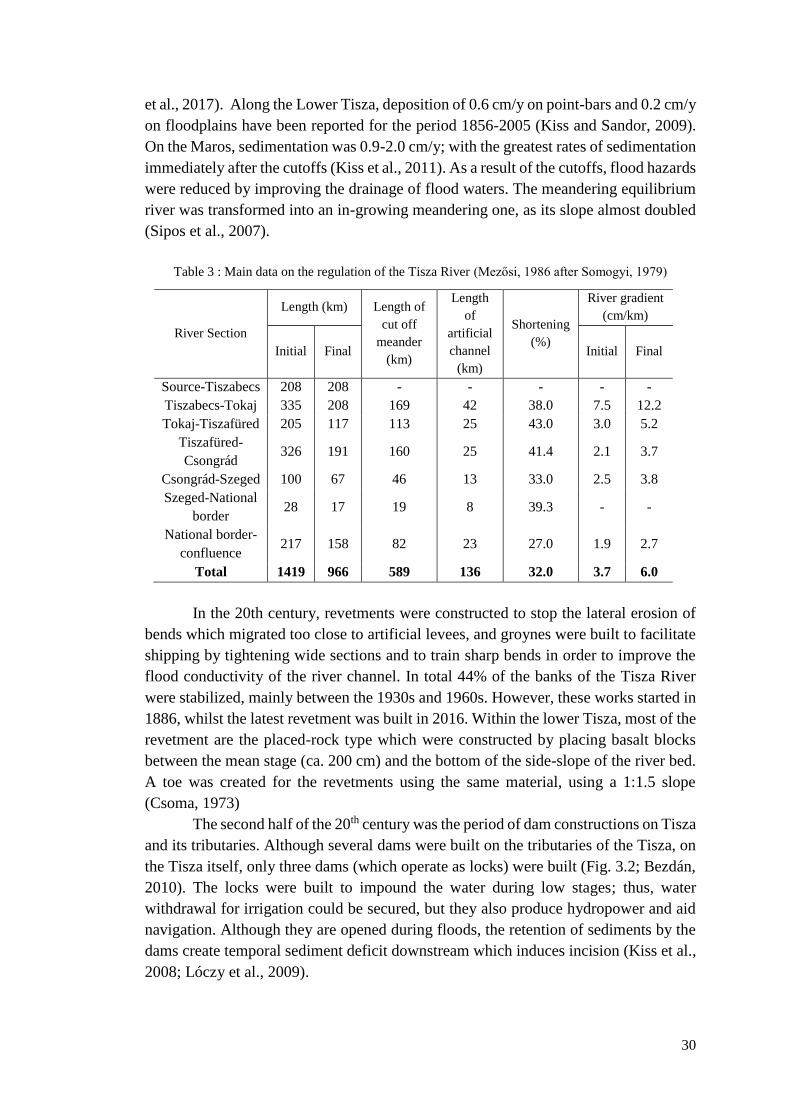
30
et al., 2017). Along the Lower Tisza, deposition of 0.6 cm/y on point-bars and 0.2 cm/y
on floodplains have been reported for the period 1856-2005 (Kiss and Sandor, 2009).
On the Maros, sedimentation was 0.9-2.0 cm/y; with the greatest rates of sedimentation
immediately after the cutoffs (Kiss et al., 2011). As a result of the cutoffs, flood hazards
were reduced by improving the drainage of flood waters. The meandering equilibrium
river was transformed into an in-growing meandering one, as its slope almost doubled
(Sipos et al., 2007).
Table 3 : Main data on the regulation of the Tisza River (Mezősi, 1986 after Somogyi, 1979)
River Section
Length (km) Length of
cut off
meander
(km)
Length
of
artificial
channel
(km)
Shortening
(%)
River gradient
(cm/km)
Initial Final Initial Final
Source-Tiszabecs 208 208 - - - - -
Tiszabecs-Tokaj 335 208 169 42 38.0 7.5 12.2
Tokaj-Tiszafüred 205 117 113 25 43.0 3.0 5.2
Tiszafüred-
Csongrád 326 191 160 25 41.4 2.1 3.7
Csongrád-Szeged 100 67 46 13 33.0 2.5 3.8
Szeged-National
border 28 17 19 8 39.3 - -
National border-
confluence 217 158 82 23 27.0 1.9 2.7
Total 1419 966 589 136 32.0 3.7 6.0
In the 20th century, revetments were constructed to stop the lateral erosion of
bends which migrated too close to artificial levees, and groynes were built to facilitate
shipping by tightening wide sections and to train sharp bends in order to improve the
flood conductivity of the river channel. In total 44% of the banks of the Tisza River
were stabilized, mainly between the 1930s and 1960s. However, these works started in
1886, whilst the latest revetment was built in 2016. Within the lower Tisza, most of the
revetment are the placed-rock type which were constructed by placing basalt blocks
between the mean stage (ca. 200 cm) and the bottom of the side-slope of the river bed.
A toe was created for the revetments using the same material, using a 1:1.5 slope
(Csoma, 1973)
The second half of the 20th century was the period of dam constructions on Tisza
and its tributaries. Although several dams were built on the tributaries of the Tisza, on
the Tisza itself, only three dams (which operate as locks) were built (Fig. 3.2; Bezdán,
2010). The locks were built to impound the water during low stages; thus, water
withdrawal for irrigation could be secured, but they also produce hydropower and aid
navigation. Although they are opened during floods, the retention of sediments by the
dams create temporal sediment deficit downstream which induces incision (Kiss et al.,
2008; Lóczy et al., 2009).
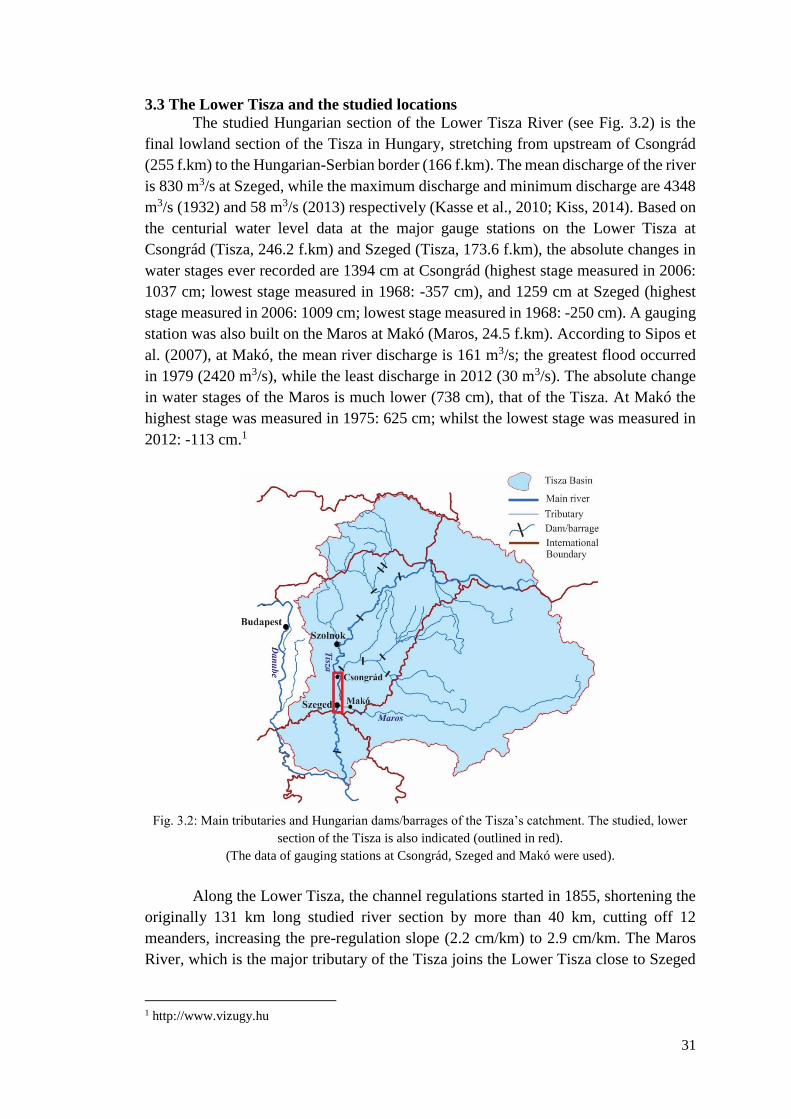
31
3.3 The Lower Tisza and the studied locations
The studied Hungarian section of the Lower Tisza River (see Fig. 3.2) is the
final lowland section of the Tisza in Hungary, stretching from upstream of Csongrád
(255 f.km) to the Hungarian-Serbian border (166 f.km). The mean discharge of the river
is 830 m3/s at Szeged, while the maximum discharge and minimum discharge are 4348
m3/s (1932) and 58 m3/s (2013) respectively (Kasse et al., 2010; Kiss, 2014). Based on
the centurial water level data at the major gauge stations on the Lower Tisza at
Csongrád (Tisza, 246.2 f.km) and Szeged (Tisza, 173.6 f.km), the absolute changes in
water stages ever recorded are 1394 cm at Csongrád (highest stage measured in 2006:
1037 cm; lowest stage measured in 1968: -357 cm), and 1259 cm at Szeged (highest
stage measured in 2006: 1009 cm; lowest stage measured in 1968: -250 cm). A gauging
station was also built on the Maros at Makó (Maros, 24.5 f.km). According to Sipos et
al. (2007), at Makó, the mean river discharge is 161 m3/s; the greatest flood occurred
in 1979 (2420 m3/s), while the least discharge in 2012 (30 m3/s). The absolute change
in water stages of the Maros is much lower (738 cm), that of the Tisza. At Makó the
highest stage was measured in 1975: 625 cm; whilst the lowest stage was measured in
2012: -113 cm.1
Fig. 3.2: Main tributaries and Hungarian dams/barrages of the Tisza’s catchment. The studied, lower
section of the Tisza is also indicated (outlined in red).
(The data of gauging stations at Csongrád, Szeged and Makó were used).
Along the Lower Tisza, the channel regulations started in 1855, shortening the
originally 131 km long studied river section by more than 40 km, cutting off 12
meanders, increasing the pre-regulation slope (2.2 cm/km) to 2.9 cm/km. The Maros
River, which is the major tributary of the Tisza joins the Lower Tisza close to Szeged
1 http://www.vizugy.hu

32
and has a higher slope (13 cm/km) in its lowland section; thus, downstream of their
confluence at Szeged the slope of the Tisza increases to 6 cm/km (Kiss et al., 2008;
Mezősi, 2009). The originally 6–8 km wide natural floodplain was reduced to 1 km
averagely as the result of artificial levee constructions. At Szeged however, the
floodplain is just 400 m wide; thus, the artificial levees constricted the floodplain at
some sections quite drastically, thereby reducing its flood conductivity and increasing
the flood risk. Therefore, the height of embanked levees was increased several times,
keeping up with the increasing height of floods. Thus, they were originally just 2.3–3.0
m high; but nowadays, their height is 7.0 m. They could therefore provide safety despite
of the increasing flood levels (Sipos et al., 2007; Kiss et al., 2008; Lóczy et al., 2009;
Schweitzer, 2009).
On the Lower Tisza, various studies have highlighted the changes of the river
channel as well as the hydrological conditions due to the alterations from the regulation
works. However, these have covered short sections of the river which are
discontinuous, making it difficult to assess connections between various morphological
units of the river which could be revealed by using longer sections of the river.
As indicated by Török (1977), the regulation of the lowland section of the
Maros (Lipova -Szeged) began with the construction of levees, followed by 33 artificial
meander cutoffs which shortened the river by 90 km and channel training. The effect
was a doubling of the river’s slope from 14 cm/km to 28 cm/km and incisions of up to
1 m (Laczay, 1975). With the increased energy of the river, there was bank erosion and
an increased sediment load which led to the development of large sand bars in some
sections of the river (Kiss et al., 2011). Accumulation within the floodplains ranges
between 0.2-0.6 cm/y (Kiss et al., 2011). In the latter part of the 19th century, parts of
the river banks were stabilized with stone revetments and in some cases, brushwood
groynes (Urdea et al., 2012). Due to the non-uniformity of the regulation works, some
freely developing sections have been used in studying the quasi-natural processes and
evolution of the river from human impacts (Sipos et al., 2012). Although a framework
for measurements and monitoring have been established for the river, the measurement
of the short-term sediment delivery, the overall sediment budget and the use of models
are important in the sustainable management of the river.
The sediment transport of the Tisza and Maros rivers differ due to the relative
differences in the geology of the catchment and slope. Although the Maros has a larger
sediment concentration (500 g/m3) compared to the Tisza (340 g/m3), due to the larger
mean water discharge of the Tisza (830 m3/s) compared with that of the Maros (161
m3/s), the Tisza has a larger suspended load (Kiss et al., 2011). However, the Maros
transports more than 3 times the bedload of the Tisza. The Maros transports a large
volume of bedload with movement in the form of bars and dunes playing a key role in
the stability and morphology of the river, as part of the river’s energy is expended in
the transportation and reallocation of these forms (Sipos et al., 2012). In the lowland
sections, while the bedload transport of the Maros is 28,000 t/y, the Tisza transports
9000 t/y (Bogárdi, 1974; Sipos et al., 2007).
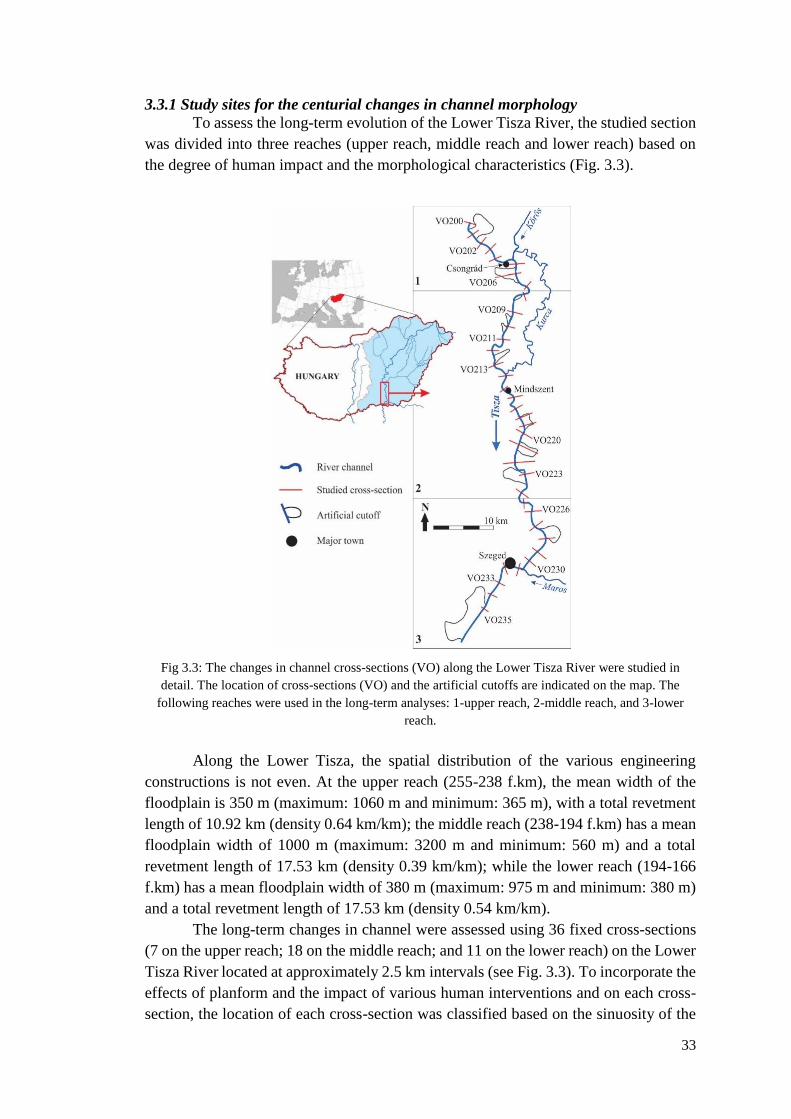
33
3.3.1 Study sites for the centurial changes in channel morphology
To assess the long-term evolution of the Lower Tisza River, the studied section
was divided into three reaches (upper reach, middle reach and lower reach) based on
the degree of human impact and the morphological characteristics (Fig. 3.3).
Fig 3.3: The changes in channel cross-sections (VO) along the Lower Tisza River were studied in
detail. The location of cross-sections (VO) and the artificial cutoffs are indicated on the map. The
following reaches were used in the long-term analyses: 1-upper reach, 2-middle reach, and 3-lower
reach.
Along the Lower Tisza, the spatial distribution of the various engineering
constructions is not even. At the upper reach (255-238 f.km), the mean width of the
floodplain is 350 m (maximum: 1060 m and minimum: 365 m), with a total revetment
length of 10.92 km (density 0.64 km/km); the middle reach (238-194 f.km) has a mean
floodplain width of 1000 m (maximum: 3200 m and minimum: 560 m) and a total
revetment length of 17.53 km (density 0.39 km/km); while the lower reach (194-166
f.km) has a mean floodplain width of 380 m (maximum: 975 m and minimum: 380 m)
and a total revetment length of 17.53 km (density 0.54 km/km).
The long-term changes in channel were assessed using 36 fixed cross-sections
(7 on the upper reach; 18 on the middle reach; and 11 on the lower reach) on the Lower
Tisza River located at approximately 2.5 km intervals (see Fig. 3.3). To incorporate the
effects of planform and the impact of various human interventions and on each cross-
section, the location of each cross-section was classified based on the sinuosity of the
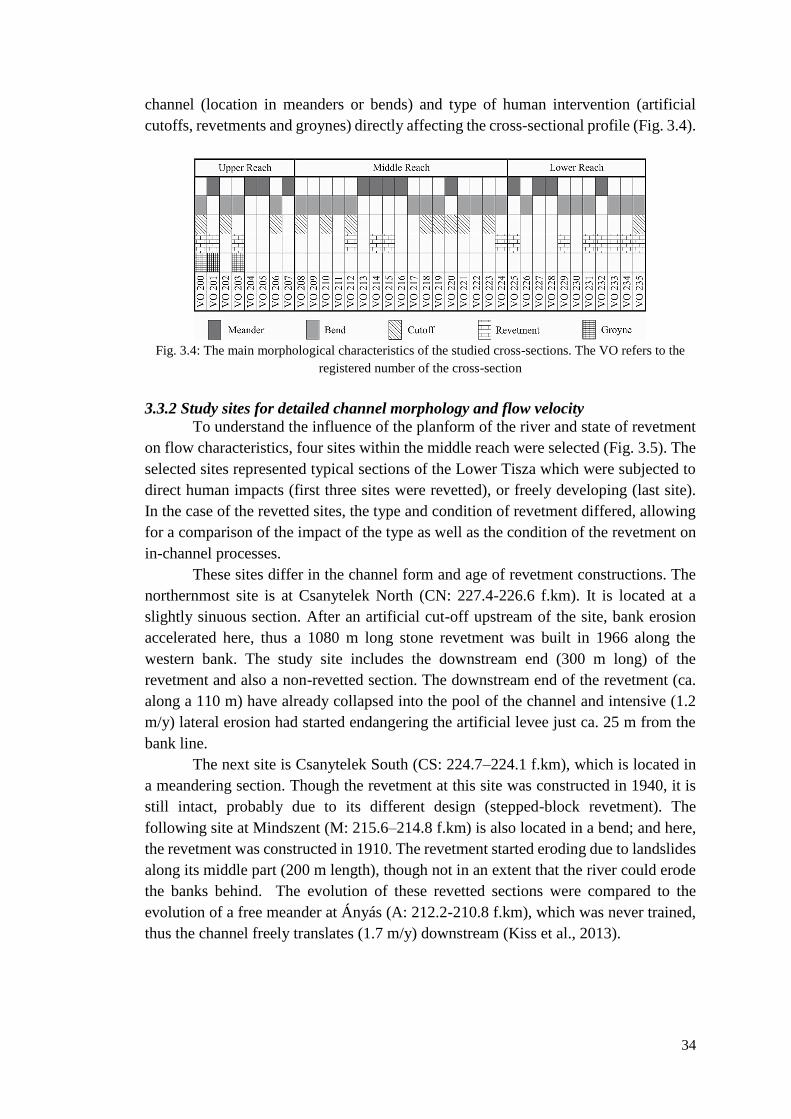
34
channel (location in meanders or bends) and type of human intervention (artificial
cutoffs, revetments and groynes) directly affecting the cross-sectional profile (Fig. 3.4).
Fig. 3.4: The main morphological characteristics of the studied cross-sections. The VO refers to the
registered number of the cross-section
3.3.2 Study sites for detailed channel morphology and flow velocity
To understand the influence of the planform of the river and state of revetment
on flow characteristics, four sites within the middle reach were selected (Fig. 3.5). The
selected sites represented typical sections of the Lower Tisza which were subjected to
direct human impacts (first three sites were revetted), or freely developing (last site).
In the case of the revetted sites, the type and condition of revetment differed, allowing
for a comparison of the impact of the type as well as the condition of the revetment on
in-channel processes.
These sites differ in the channel form and age of revetment constructions. The
northernmost site is at Csanytelek North (CN: 227.4-226.6 f.km). It is located at a
slightly sinuous section. After an artificial cut-off upstream of the site, bank erosion
accelerated here, thus a 1080 m long stone revetment was built in 1966 along the
western bank. The study site includes the downstream end (300 m long) of the
revetment and also a non-revetted section. The downstream end of the revetment (ca.
along a 110 m) have already collapsed into the pool of the channel and intensive (1.2
m/y) lateral erosion had started endangering the artificial levee just ca. 25 m from the
bank line.
The next site is Csanytelek South (CS: 224.7–224.1 f.km), which is located in
a meandering section. Though the revetment at this site was constructed in 1940, it is
still intact, probably due to its different design (stepped-block revetment). The
following site at Mindszent (M: 215.6–214.8 f.km) is also located in a bend; and here,
the revetment was constructed in 1910. The revetment started eroding due to landslides
along its middle part (200 m length), though not in an extent that the river could erode
the banks behind. The evolution of these revetted sections were compared to the
evolution of a free meander at Ányás (A: 212.2-210.8 f.km), which was never trained,
thus the channel freely translates (1.7 m/y) downstream (Kiss et al., 2013).

35
Fig 3.5: Four sites within middle reach were selected, where ADCP measurements were carried out
along transects. Study sites: A – Csanytelek North (CN); B - Csanytelek South (CS); C – Mindszent
(M); and D – Ányás (A). The state of revetment within every location is also indicated.
3.3.3 Study sites for changes point-bar evolution and bank erosion
The short-term channel evolution was analyzed based on measurements of
point-bar elevation changes and bank erosion at selected sites (Fig. 3.6). In its natural
state, before the regulations, the sinuosity of the channel was high (with up to 30
meander bends), point-bars appeared in every bend, and the channel was relatively
shallow (6-8 m; Kiss et al., 2019). Along the entire Lower Tisza in the late 19th, 47
point-bars existed (in 52.3 km length), but nowadays, their number (20) and total length
(4.7 km) is reduced considerably (Kiss et al., 2019). For this study, point-bars which
were not dredged, and develop in a quasi-natural way were selected. The upstream
point-bar (Csongrád: 244.1-243.6 f.km) developed at a confluence; thus, it could also
be considered as a confluence bar. Its opposite bank is revetted, thus, it might influence
the evolution of the point-bar. However, the studied downstream point-bar evolved in
a natural, but sharp meander without direct human impact (Ányás: 211.8-211.5 f.km).
Here, the bank erosion on the opposite bank was also measured.
To quantify and understand bank erosion of the Lower Tisza River, three
eroding sections along the western bank within the middle reach were selected (Fig.
3.5). The upstream 0.8 km and 0.6 km long sections represent banks with revetments
(Csanytelek North: 227.4–226.6 f.km, and Csanytelek South: 224.7–224.1 f.km), while
the 1.1 km long downstream study area is free of any direct human impacts at Ányás
(212.2–211.1 f.km). The locations of the studied eroding banks were selected to
represent erosion within revetted sections (Csanytelek), as well as a freely developing
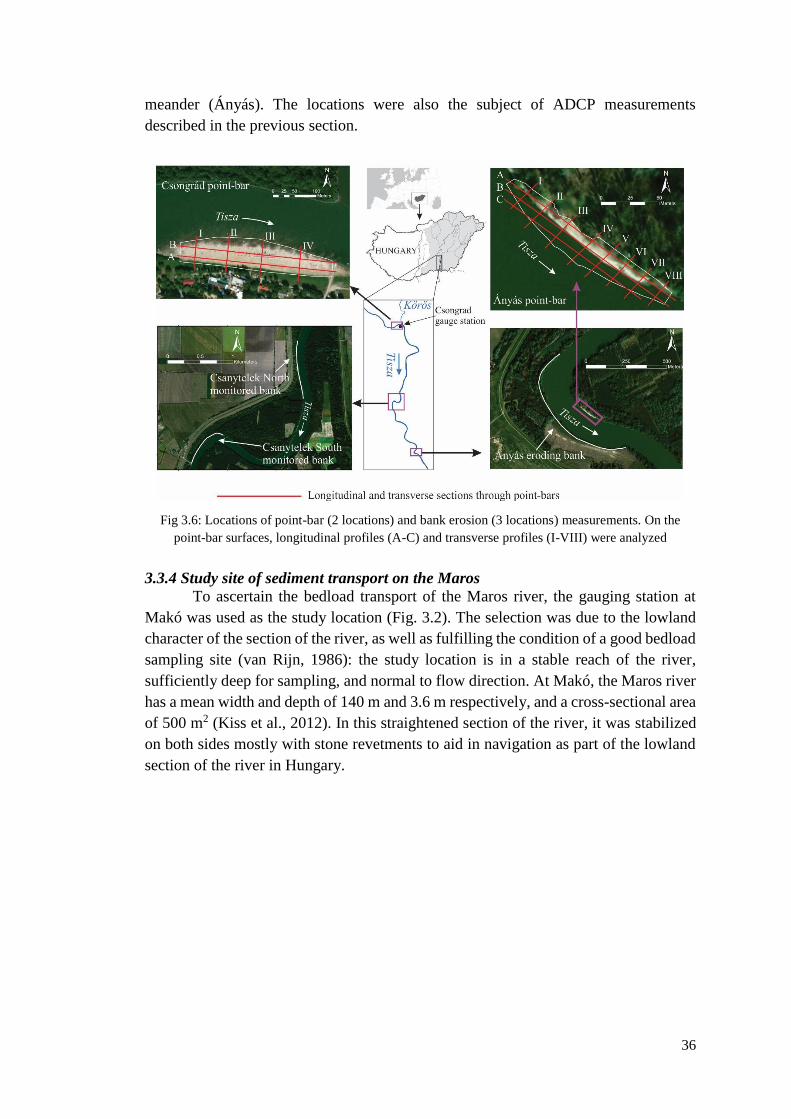
36
meander (Ányás). The locations were also the subject of ADCP measurements
described in the previous section.
Fig 3.6: Locations of point-bar (2 locations) and bank erosion (3 locations) measurements. On the
point-bar surfaces, longitudinal profiles (A-C) and transverse profiles (I-VIII) were analyzed
3.3.4 Study site of sediment transport on the Maros
To ascertain the bedload transport of the Maros river, the gauging station at
Makó was used as the study location (Fig. 3.2). The selection was due to the lowland
character of the section of the river, as well as fulfilling the condition of a good bedload
sampling site (van Rijn, 1986): the study location is in a stable reach of the river,
sufficiently deep for sampling, and normal to flow direction. At Makó, the Maros river
has a mean width and depth of 140 m and 3.6 m respectively, and a cross-sectional area
of 500 m2 (Kiss et al., 2012). In this straightened section of the river, it was stabilized
on both sides mostly with stone revetments to aid in navigation as part of the lowland
section of the river in Hungary.

37
4. DATA AND METHODS
4.1 Centurial channel changes in the Lower Tisza River
To analyze the centurial channel changes, I employed a dataset of hydrological
surveys including some data on revetments and cutoffs of the Lower Tisza, provided
by the Lower Tisza Hydrological Directorate (ATIVIZIG). The Hydrological Atlas of
the Lower Tisza (1976) provided the plan-form of the river showing the banklines in
1891, 1931 and 1976, the locations of cross-sections (VO), artificial cutoffs and
revetments. The cross-sectional data covered 1891, 1931, 1961, 1976, 1999 and 2017.
The cross-sections were surveyed using fixed geodetic points (referred to as VO points)
located at approximately 2.5 km intervals along the Tisza. For each cross-section, the
elevations (for the near-bank area) and depth measurements (for wetted channel) were
made at 5 m intervals. The cross-sections were repeatedly surveyed and were used in
assessing the centurial changes in the channel.
Based on the cross-sectional survey data, elements of a typical channel cross-
section measured from the bankfull level were used in analyzing the characteristics of
the channel development (Fig. 4.1).
Fig. 4.1: A typical channel cross-section showing the analyzed vertical channel parameters
The bankfull level was determined as lowest point of the bankline. The
following cross-sectional channel parameters were measured and calculated:
i. thalweg depth: deepest point measured from the bankfull level;
ii. mean depth: arithmetic mean of all measured depths of cross-section at
5 m intervals;
iii. cross-sectional area: area of cross-section up to the bankfull level
obtained by the total sum of the areas of segments derived from the
product of the intervals (5 m) and the measured depths;
iv. bankfull width: measured channel width at the bankfull level;
v. mean width: ratio of cross-sectional area to thalweg depth.
To assess the influence of planform, the entire length of the river was dissected
into bends and meanders (Chapter 3.3.1) based on Laczay’s classification (Laczay,
1982), for which the sinuosity of every segment was calculated between two inflection
points (midpoint of straight sections) as the ratio of the bend length of the segment to
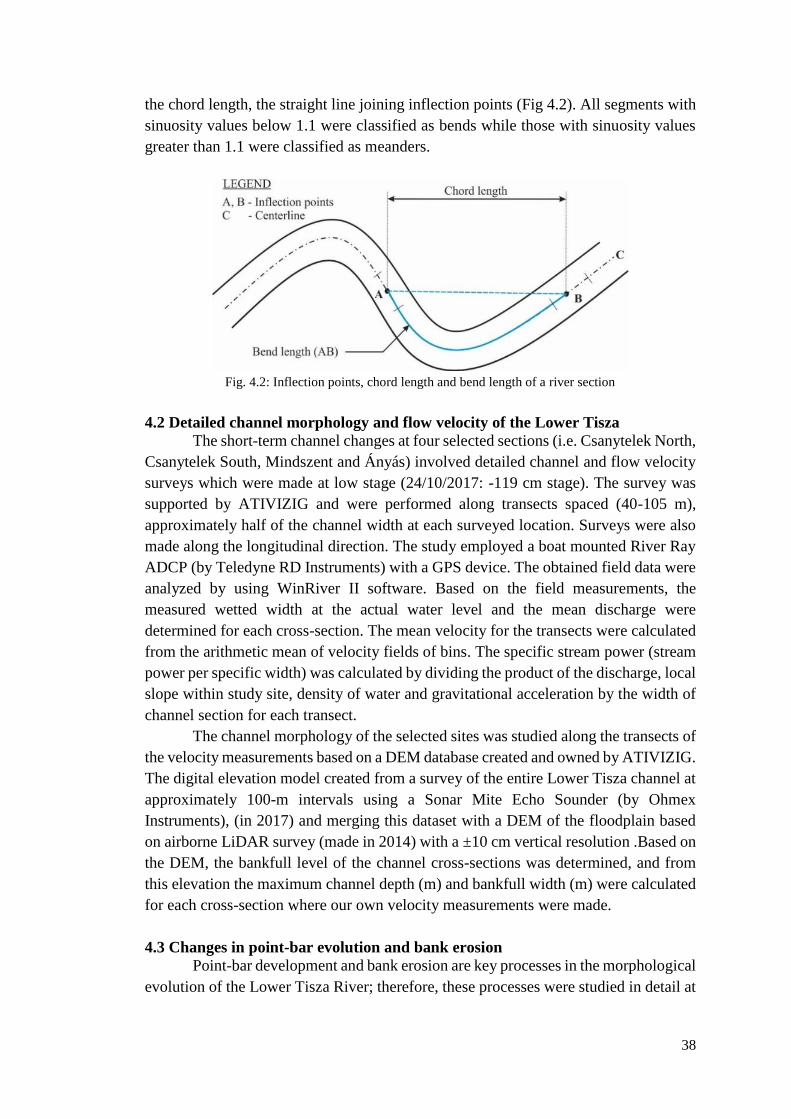
38
the chord length, the straight line joining inflection points (Fig 4.2). All segments with
sinuosity values below 1.1 were classified as bends while those with sinuosity values
greater than 1.1 were classified as meanders.
Fig. 4.2: Inflection points, chord length and bend length of a river section
4.2 Detailed channel morphology and flow velocity of the Lower Tisza
The short-term channel changes at four selected sections (i.e. Csanytelek North,
Csanytelek South, Mindszent and Ányás) involved detailed channel and flow velocity
surveys which were made at low stage (24/10/2017: -119 cm stage). The survey was
supported by ATIVIZIG and were performed along transects spaced (40-105 m),
approximately half of the channel width at each surveyed location. Surveys were also
made along the longitudinal direction. The study employed a boat mounted River Ray
ADCP (by Teledyne RD Instruments) with a GPS device. The obtained field data were
analyzed by using WinRiver II software. Based on the field measurements, the
measured wetted width at the actual water level and the mean discharge were
determined for each cross-section. The mean velocity for the transects were calculated
from the arithmetic mean of velocity fields of bins. The specific stream power (stream
power per specific width) was calculated by dividing the product of the discharge, local
slope within study site, density of water and gravitational acceleration by the width of
channel section for each transect.
The channel morphology of the selected sites was studied along the transects of
the velocity measurements based on a DEM database created and owned by ATIVIZIG.
The digital elevation model created from a survey of the entire Lower Tisza channel at
approximately 100-m intervals using a Sonar Mite Echo Sounder (by Ohmex
Instruments), (in 2017) and merging this dataset with a DEM of the floodplain based
on airborne LiDAR survey (made in 2014) with a ±10 cm vertical resolution .Based on
the DEM, the bankfull level of the channel cross-sections was determined, and from
this elevation the maximum channel depth (m) and bankfull width (m) were calculated
for each cross-section where our own velocity measurements were made.
4.3 Changes in point-bar evolution and bank erosion
Point-bar development and bank erosion are key processes in the morphological
evolution of the Lower Tisza River; therefore, these processes were studied in detail at
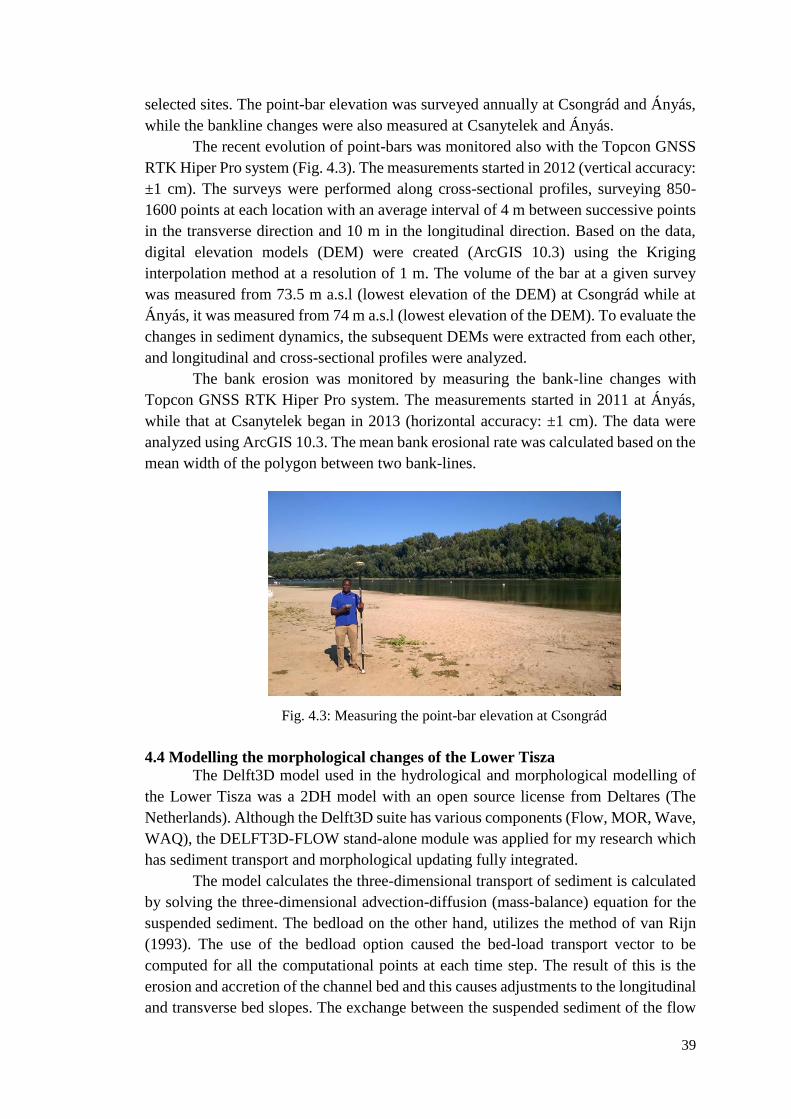
39
selected sites. The point-bar elevation was surveyed annually at Csongrád and Ányás,
while the bankline changes were also measured at Csanytelek and Ányás.
The recent evolution of point-bars was monitored also with the Topcon GNSS
RTK Hiper Pro system (Fig. 4.3). The measurements started in 2012 (vertical accuracy:
±1 cm). The surveys were performed along cross-sectional profiles, surveying 850-
1600 points at each location with an average interval of 4 m between successive points
in the transverse direction and 10 m in the longitudinal direction. Based on the data,
digital elevation models (DEM) were created (ArcGIS 10.3) using the Kriging
interpolation method at a resolution of 1 m. The volume of the bar at a given survey
was measured from 73.5 m a.s.l (lowest elevation of the DEM) at Csongrád while at
Ányás, it was measured from 74 m a.s.l (lowest elevation of the DEM). To evaluate the
changes in sediment dynamics, the subsequent DEMs were extracted from each other,
and longitudinal and cross-sectional profiles were analyzed.
The bank erosion was monitored by measuring the bank-line changes with
Topcon GNSS RTK Hiper Pro system. The measurements started in 2011 at Ányás,
while that at Csanytelek began in 2013 (horizontal accuracy: ±1 cm). The data were
analyzed using ArcGIS 10.3. The mean bank erosional rate was calculated based on the
mean width of the polygon between two bank-lines.
Fig. 4.3: Measuring the point-bar elevation at Csongrád
4.4 Modelling the morphological changes of the Lower Tisza
The Delft3D model used in the hydrological and morphological modelling of
the Lower Tisza was a 2DH model with an open source license from Deltares (The
Netherlands). Although the Delft3D suite has various components (Flow, MOR, Wave,
WAQ), the DELFT3D-FLOW stand-alone module was applied for my research which
has sediment transport and morphological updating fully integrated.
The model calculates the three-dimensional transport of sediment is calculated
by solving the three-dimensional advection-diffusion (mass-balance) equation for the
suspended sediment. The bedload on the other hand, utilizes the method of van Rijn
(1993). The use of the bedload option caused the bed-load transport vector to be
computed for all the computational points at each time step. The result of this is the
erosion and accretion of the channel bed and this causes adjustments to the longitudinal
and transverse bed slopes. The exchange between the suspended sediment of the flow
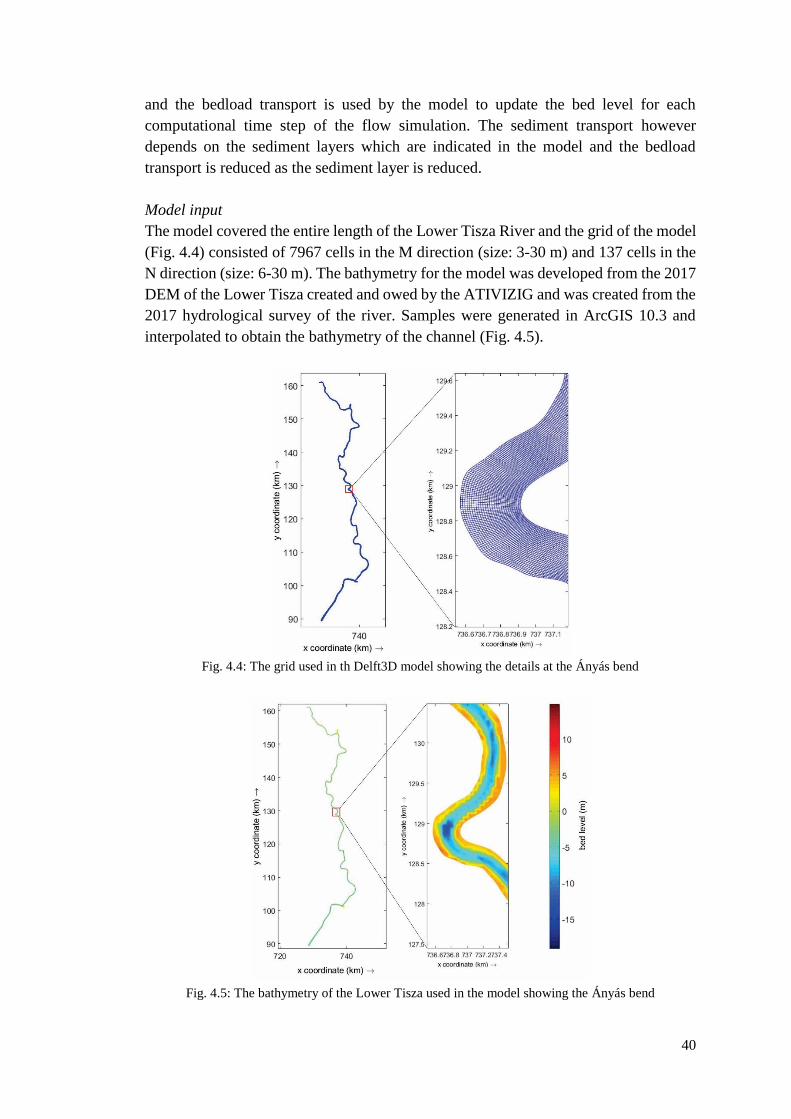
40
and the bedload transport is used by the model to update the bed level for each
computational time step of the flow simulation. The sediment transport however
depends on the sediment layers which are indicated in the model and the bedload
transport is reduced as the sediment layer is reduced.
Model input
The model covered the entire length of the Lower Tisza River and the grid of the model
(Fig. 4.4) consisted of 7967 cells in the M direction (size: 3-30 m) and 137 cells in the
N direction (size: 6-30 m). The bathymetry for the model was developed from the 2017
DEM of the Lower Tisza created and owed by the ATIVIZIG and was created from the
2017 hydrological survey of the river. Samples were generated in ArcGIS 10.3 and
interpolated to obtain the bathymetry of the channel (Fig. 4.5).
Fig. 4.4: The grid used in th Delft3D model showing the details at the Ányás bend
Fig. 4.5: The bathymetry of the Lower Tisza used in the model showing the Ányás bend
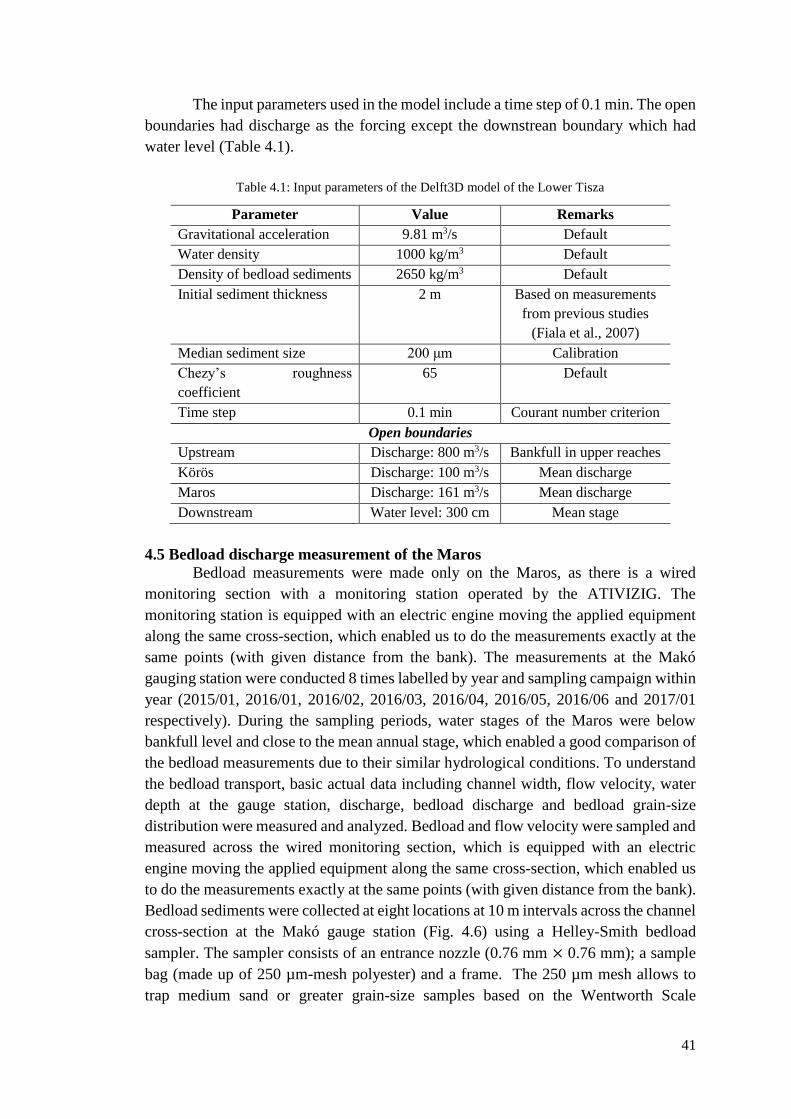
41
The input parameters used in the model include a time step of 0.1 min. The open
boundaries had discharge as the forcing except the downstrean boundary which had
water level (Table 4.1).
Table 4.1: Input parameters of the Delft3D model of the Lower Tisza
Parameter Value Remarks
Gravitational acceleration 9.81 m3/s Default
Water density 1000 kg/m3 Default
Density of bedload sediments 2650 kg/m3 Default
Initial sediment thickness 2 m Based on measurements
from previous studies
(Fiala et al., 2007)
Median sediment size 200 μm Calibration
Chezy’s roughness
coefficient
65 Default
Time step 0.1 min Courant number criterion
Open boundaries
Upstream Discharge: 800 m3/s Bankfull in upper reaches
Körös Discharge: 100 m3/s Mean discharge
Maros Discharge: 161 m3/s Mean discharge
Downstream Water level: 300 cm Mean stage
4.5 Bedload discharge measurement of the Maros
Bedload measurements were made only on the Maros, as there is a wired
monitoring section with a monitoring station operated by the ATIVIZIG. The
monitoring station is equipped with an electric engine moving the applied equipment
along the same cross-section, which enabled us to do the measurements exactly at the
same points (with given distance from the bank). The measurements at the Makó
gauging station were conducted 8 times labelled by year and sampling campaign within
year (2015/01, 2016/01, 2016/02, 2016/03, 2016/04, 2016/05, 2016/06 and 2017/01
respectively). During the sampling periods, water stages of the Maros were below
bankfull level and close to the mean annual stage, which enabled a good comparison of
the bedload measurements due to their similar hydrological conditions. To understand
the bedload transport, basic actual data including channel width, flow velocity, water
depth at the gauge station, discharge, bedload discharge and bedload grain-size
distribution were measured and analyzed. Bedload and flow velocity were sampled and
measured across the wired monitoring section, which is equipped with an electric
engine moving the applied equipment along the same cross-section, which enabled us
to do the measurements exactly at the same points (with given distance from the bank).
Bedload sediments were collected at eight locations at 10 m intervals across the channel
cross-section at the Makó gauge station (Fig. 4.6) using a Helley-Smith bedload
sampler. The sampler consists of an entrance nozzle (0.76 mm × 0.76 mm); a sample
bag (made up of 250 µm-mesh polyester) and a frame. The 250 µm mesh allows to
trap medium sand or greater grain-size samples based on the Wentworth Scale
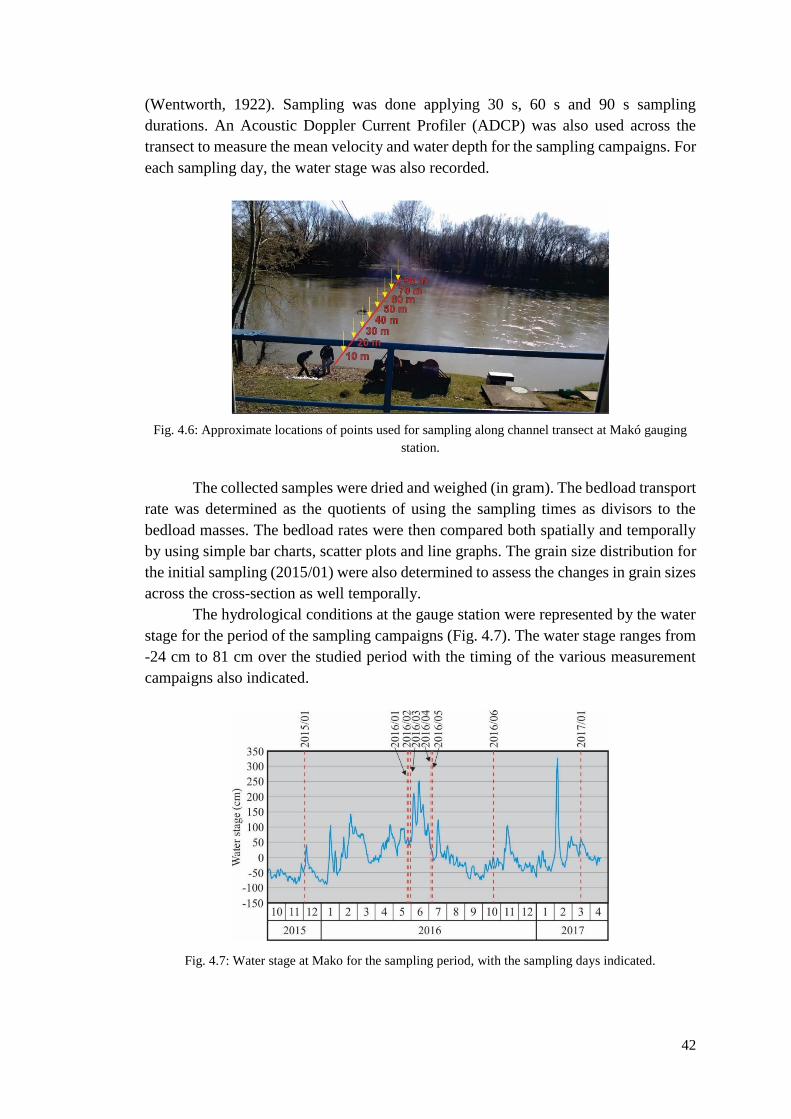
42
(Wentworth, 1922). Sampling was done applying 30 s, 60 s and 90 s sampling
durations. An Acoustic Doppler Current Profiler (ADCP) was also used across the
transect to measure the mean velocity and water depth for the sampling campaigns. For
each sampling day, the water stage was also recorded.
Fig. 4.6: Approximate locations of points used for sampling along channel transect at Makó gauging
station.
The collected samples were dried and weighed (in gram). The bedload transport
rate was determined as the quotients of using the sampling times as divisors to the
bedload masses. The bedload rates were then compared both spatially and temporally
by using simple bar charts, scatter plots and line graphs. The grain size distribution for
the initial sampling (2015/01) were also determined to assess the changes in grain sizes
across the cross-section as well temporally.
The hydrological conditions at the gauge station were represented by the water
stage for the period of the sampling campaigns (Fig. 4.7). The water stage ranges from
-24 cm to 81 cm over the studied period with the timing of the various measurement
campaigns also indicated.
Fig. 4.7: Water stage at Mako for the sampling period, with the sampling days indicated.
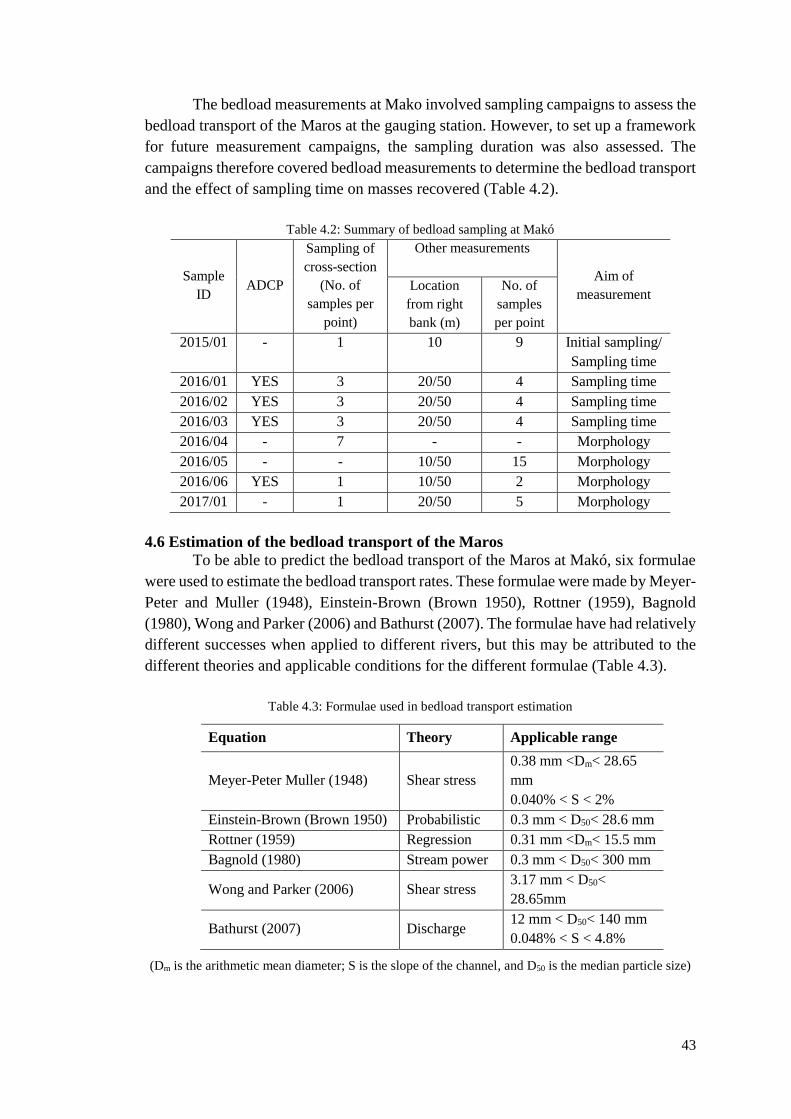
43
The bedload measurements at Mako involved sampling campaigns to assess the
bedload transport of the Maros at the gauging station. However, to set up a framework
for future measurement campaigns, the sampling duration was also assessed. The
campaigns therefore covered bedload measurements to determine the bedload transport
and the effect of sampling time on masses recovered (Table 4.2).
Table 4.2: Summary of bedload sampling at Makó
Sample
ID ADCP
Sampling of
cross-section
(No. of
samples per
point)
Other measurements
Aim of
measurement Location
from right
bank (m)
No. of
samples
per point
2015/01 - 1 10 9 Initial sampling/
Sampling time
2016/01 YES 3 20/50 4 Sampling time
2016/02 YES 3 20/50 4 Sampling time
2016/03 YES 3 20/50 4 Sampling time
2016/04 - 7 - - Morphology
2016/05 - - 10/50 15 Morphology
2016/06 YES 1 10/50 2 Morphology
2017/01 - 1 20/50 5 Morphology
4.6 Estimation of the bedload transport of the Maros
To be able to predict the bedload transport of the Maros at Makó, six formulae
were used to estimate the bedload transport rates. These formulae were made by Meyer-
Peter and Muller (1948), Einstein-Brown (Brown 1950), Rottner (1959), Bagnold
(1980), Wong and Parker (2006) and Bathurst (2007). The formulae have had relatively
different successes when applied to different rivers, but this may be attributed to the
different theories and applicable conditions for the different formulae (Table 4.3).
Table 4.3: Formulae used in bedload transport estimation
Equation Theory Applicable range
Meyer-Peter Muller (1948) Shear stress
0.38 mm <Dm< 28.65
mm
0.040% < S < 2%
Einstein-Brown (Brown 1950) Probabilistic 0.3 mm < D50< 28.6 mm
Rottner (1959) Regression 0.31 mm <Dm< 15.5 mm
Bagnold (1980) Stream power 0.3 mm < D50< 300 mm
Wong and Parker (2006) Shear stress 3.17 mm < D50<
28.65mm
Bathurst (2007) Discharge 12 mm < D50< 140 mm
0.048% < S < 4.8%
(Dm is the arithmetic mean diameter; S is the slope of the channel, and D50 is the median particle size)
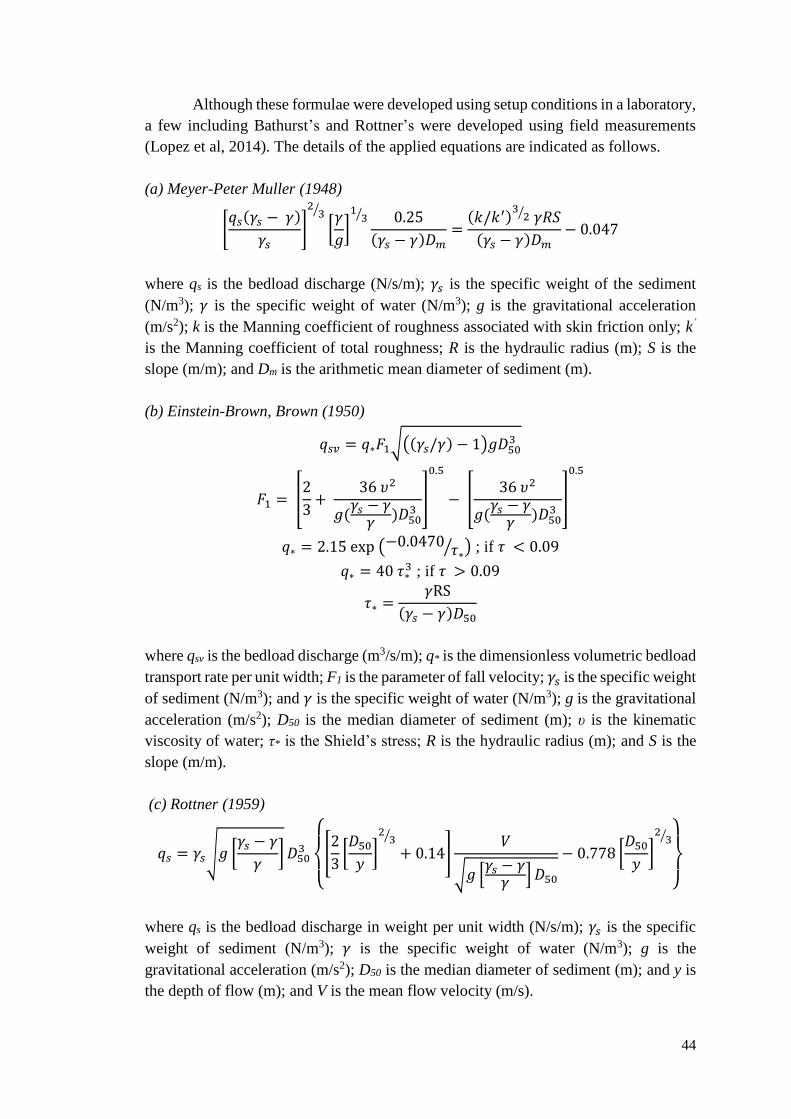
44
Although these formulae were developed using setup conditions in a laboratory,
a few including Bathurst’s and Rottner’s were developed using field measurements
(Lopez et al, 2014). The details of the applied equations are indicated as follows.
(a) Meyer-Peter Muller (1948)
[𝑞𝑠(𝛾𝑠 − 𝛾)
𝛾𝑠]
23⁄
[𝛾
𝑔]
13⁄ 0.25
(𝛾𝑠 − 𝛾)𝐷𝑚=(𝑘/𝑘′)
32⁄ 𝛾𝑅𝑆
(𝛾𝑠 − 𝛾)𝐷𝑚− 0.047
where qs is the bedload discharge (N/s/m); 𝛾𝑠 is the specific weight of the sediment
(N/m3); 𝛾 is the specific weight of water (N/m3); g is the gravitational acceleration
(m/s2); k is the Manning coefficient of roughness associated with skin friction only; k’
is the Manning coefficient of total roughness; R is the hydraulic radius (m); S is the
slope (m/m); and Dm is the arithmetic mean diameter of sediment (m).
(b) Einstein-Brown, Brown (1950)
𝑞𝑠𝑣 = 𝑞∗𝐹1√((𝛾𝑠/𝛾) − 1)𝑔𝐷503
𝐹1 = [2
3+
36 𝜐2
𝑔(𝛾𝑠 − 𝛾𝛾 )𝐷50
3]
0.5
− [36 𝜐2
𝑔(𝛾𝑠 − 𝛾𝛾 )𝐷50
3]
0.5
𝑞∗ = 2.15 exp (−0.0470 𝜏∗⁄ ) ; if 𝜏 < 0.09
𝑞∗ = 40 𝜏∗3 ; if 𝜏 > 0.09
𝜏∗ =𝛾RS
(𝛾𝑠 − 𝛾)𝐷50
where qsv is the bedload discharge (m3/s/m); q* is the dimensionless volumetric bedload
transport rate per unit width; F1 is the parameter of fall velocity; 𝛾𝑠 is the specific weight
of sediment (N/m3); and 𝛾 is the specific weight of water (N/m3); g is the gravitational
acceleration (m/s2); D50 is the median diameter of sediment (m); υ is the kinematic
viscosity of water; τ* is the Shield’s stress; R is the hydraulic radius (m); and S is the
slope (m/m).
(c) Rottner (1959)
𝑞𝑠 = 𝛾𝑠√𝑔 [𝛾𝑠 − 𝛾
𝛾]𝐷50
3
{
[2
3[𝐷50𝑦]
23⁄
+ 0.14]𝑉
√𝑔 [𝛾𝑠 − 𝛾𝛾 ]𝐷50
− 0.778 [𝐷50𝑦]
23⁄
}
where qs is the bedload discharge in weight per unit width (N/s/m); 𝛾𝑠 is the specific
weight of sediment (N/m3); 𝛾 is the specific weight of water (N/m3); g is the
gravitational acceleration (m/s2); D50 is the median diameter of sediment (m); and y is
the depth of flow (m); and V is the mean flow velocity (m/s).
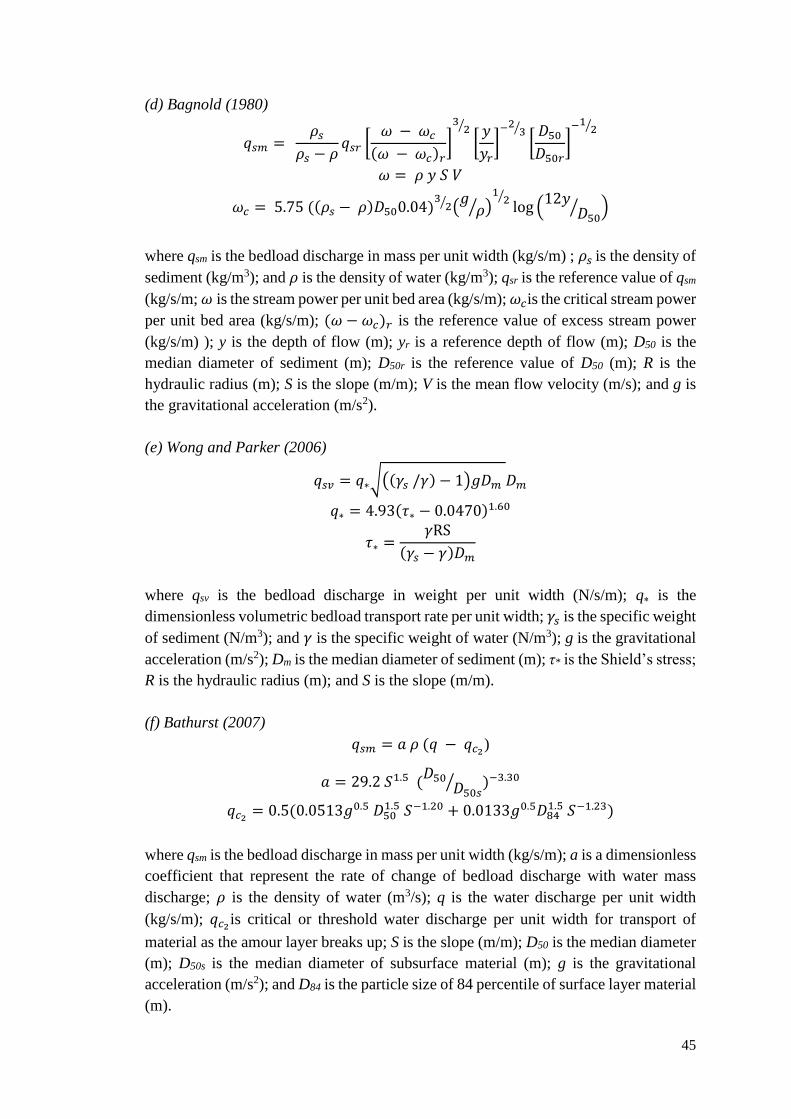
45
(d) Bagnold (1980)
𝑞𝑠𝑚 = 𝜌𝑠
𝜌𝑠 − 𝜌𝑞𝑠𝑟 [
𝜔 − 𝜔𝑐(𝜔 − 𝜔𝑐)𝑟
]
32⁄
[𝑦
𝑦𝑟]−2 3⁄
[𝐷50𝐷50𝑟
]−1 2⁄
𝜔 = 𝜌 𝑦 𝑆 𝑉
𝜔𝑐 = 5.75 ((𝜌𝑠 − 𝜌)𝐷500.04)32⁄ (𝑔𝜌⁄ )
12⁄log (
12𝑦𝐷50⁄ )
where qsm is the bedload discharge in mass per unit width (kg/s/m) ; 𝜌𝑠 is the density of
sediment (kg/m3); and 𝜌 is the density of water (kg/m3); qsr is the reference value of qsm
(kg/s/m; 𝜔 is the stream power per unit bed area (kg/s/m); 𝜔𝑐is the critical stream power
per unit bed area (kg/s/m); (𝜔 − 𝜔𝑐)𝑟 is the reference value of excess stream power
(kg/s/m) ); y is the depth of flow (m); yr is a reference depth of flow (m); D50 is the
median diameter of sediment (m); D50r is the reference value of D50 (m); R is the
hydraulic radius (m); S is the slope (m/m); V is the mean flow velocity (m/s); and g is
the gravitational acceleration (m/s2).
(e) Wong and Parker (2006)
𝑞𝑠𝑣 = 𝑞∗√((𝛾𝑠 /𝛾) − 1)𝑔𝐷𝑚 𝐷𝑚
𝑞∗ = 4.93(𝜏∗ − 0.0470)1.60
𝜏∗ =𝛾RS
(𝛾𝑠 − 𝛾)𝐷𝑚
where qsv is the bedload discharge in weight per unit width (N/s/m); q⁎ is the
dimensionless volumetric bedload transport rate per unit width; 𝛾𝑠 is the specific weight
of sediment (N/m3); and 𝛾 is the specific weight of water (N/m3); g is the gravitational
acceleration (m/s2); Dm is the median diameter of sediment (m); τ* is the Shield’s stress;
R is the hydraulic radius (m); and S is the slope (m/m).
(f) Bathurst (2007)
𝑞𝑠𝑚 = 𝑎 𝜌 (𝑞 − 𝑞𝑐2)
𝑎 = 29.2 𝑆1.5 (𝐷50
𝐷50𝑠⁄ )−3.30
𝑞𝑐2 = 0.5(0.0513𝑔0.5 𝐷50
1.5 𝑆−1.20 + 0.0133𝑔0.5𝐷841.5 𝑆−1.23)
where qsm is the bedload discharge in mass per unit width (kg/s/m); a is a dimensionless
coefficient that represent the rate of change of bedload discharge with water mass
discharge; 𝜌 is the density of water (m3/s); q is the water discharge per unit width
(kg/s/m); 𝑞𝑐2is critical or threshold water discharge per unit width for transport of
material as the amour layer breaks up; S is the slope (m/m); D50 is the median diameter
(m); D50s is the median diameter of subsurface material (m); g is the gravitational
acceleration (m/s2); and D84 is the particle size of 84 percentile of surface layer material
(m).
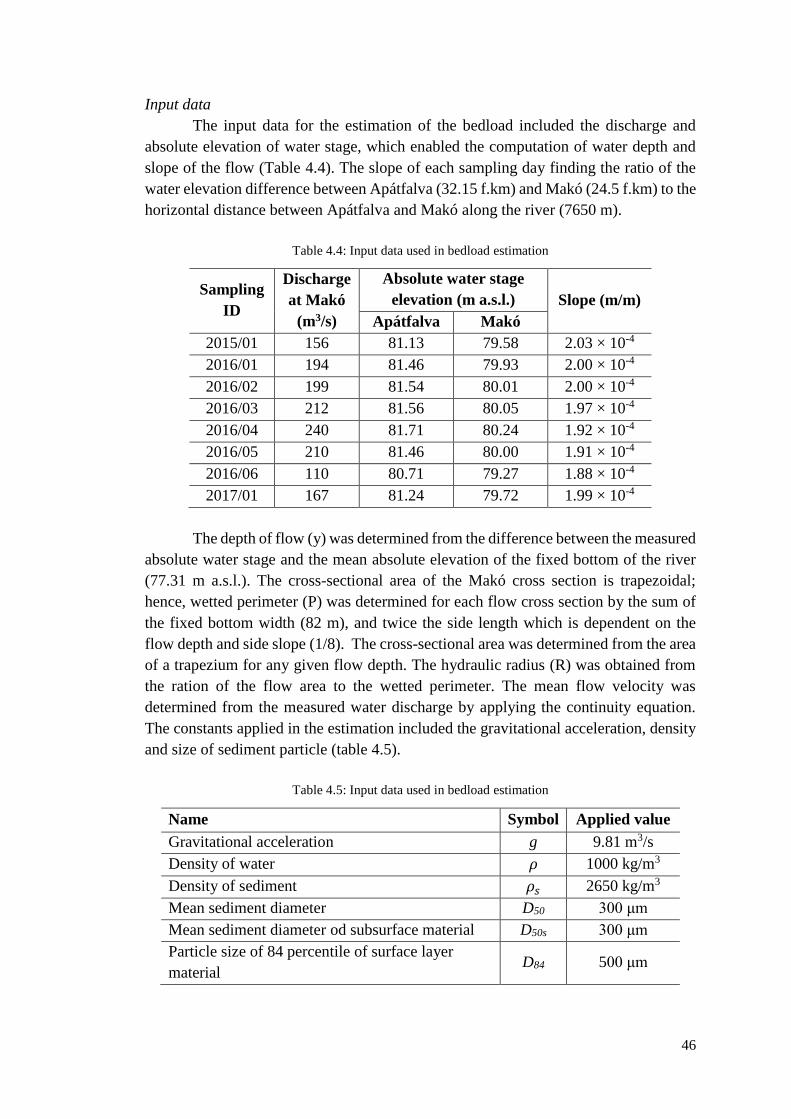
46
Input data
The input data for the estimation of the bedload included the discharge and
absolute elevation of water stage, which enabled the computation of water depth and
slope of the flow (Table 4.4). The slope of each sampling day finding the ratio of the
water elevation difference between Apátfalva (32.15 f.km) and Makó (24.5 f.km) to the
horizontal distance between Apátfalva and Makó along the river (7650 m).
Table 4.4: Input data used in bedload estimation
Sampling
ID
Discharge
at Makó
(m3/s)
Absolute water stage
elevation (m a.s.l.) Slope (m/m)
Apátfalva Makó
2015/01 156 81.13 79.58 2.03 × 10⁻⁴
2016/01 194 81.46 79.93 2.00 × 10⁻⁴
2016/02 199 81.54 80.01 2.00 × 10⁻⁴
2016/03 212 81.56 80.05 1.97 × 10⁻⁴
2016/04 240 81.71 80.24 1.92 × 10⁻⁴
2016/05 210 81.46 80.00 1.91 × 10⁻⁴
2016/06 110 80.71 79.27 1.88 × 10⁻⁴
2017/01 167 81.24 79.72 1.99 × 10⁻⁴
The depth of flow (y) was determined from the difference between the measured
absolute water stage and the mean absolute elevation of the fixed bottom of the river
(77.31 m a.s.l.). The cross-sectional area of the Makó cross section is trapezoidal;
hence, wetted perimeter (P) was determined for each flow cross section by the sum of
the fixed bottom width (82 m), and twice the side length which is dependent on the
flow depth and side slope (1/8). The cross-sectional area was determined from the area
of a trapezium for any given flow depth. The hydraulic radius (R) was obtained from
the ration of the flow area to the wetted perimeter. The mean flow velocity was
determined from the measured water discharge by applying the continuity equation.
The constants applied in the estimation included the gravitational acceleration, density
and size of sediment particle (table 4.5).
Table 4.5: Input data used in bedload estimation
Name Symbol Applied value
Gravitational acceleration g 9.81 m3/s
Density of water 𝜌 1000 kg/m3
Density of sediment 𝜌𝑠 2650 kg/m3
Mean sediment diameter D50 300 μm
Mean sediment diameter od subsurface material D50s 300 μm
Particle size of 84 percentile of surface layer
material D84 500 μm
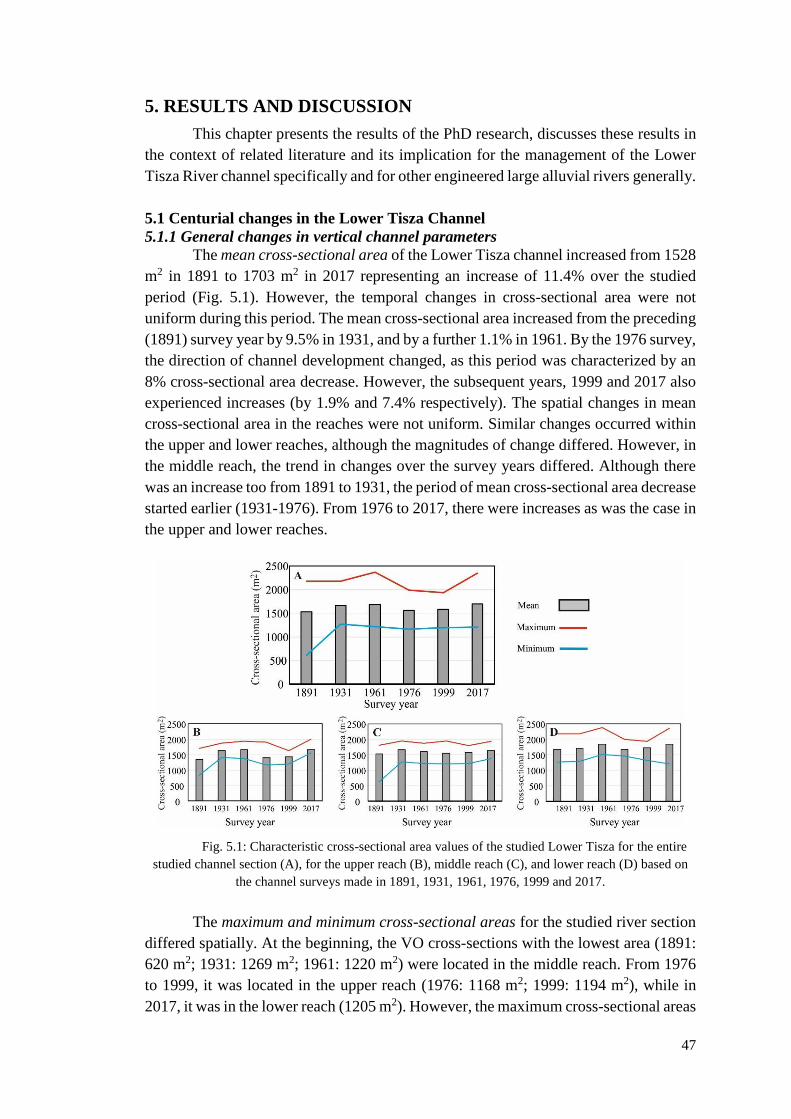
47
5. RESULTS AND DISCUSSION
This chapter presents the results of the PhD research, discusses these results in
the context of related literature and its implication for the management of the Lower
Tisza River channel specifically and for other engineered large alluvial rivers generally.
5.1 Centurial changes in the Lower Tisza Channel
5.1.1 General changes in vertical channel parameters
The mean cross-sectional area of the Lower Tisza channel increased from 1528
m2 in 1891 to 1703 m2 in 2017 representing an increase of 11.4% over the studied
period (Fig. 5.1). However, the temporal changes in cross-sectional area were not
uniform during this period. The mean cross-sectional area increased from the preceding
(1891) survey year by 9.5% in 1931, and by a further 1.1% in 1961. By the 1976 survey,
the direction of channel development changed, as this period was characterized by an
8% cross-sectional area decrease. However, the subsequent years, 1999 and 2017 also
experienced increases (by 1.9% and 7.4% respectively). The spatial changes in mean
cross-sectional area in the reaches were not uniform. Similar changes occurred within
the upper and lower reaches, although the magnitudes of change differed. However, in
the middle reach, the trend in changes over the survey years differed. Although there
was an increase too from 1891 to 1931, the period of mean cross-sectional area decrease
started earlier (1931-1976). From 1976 to 2017, there were increases as was the case in
the upper and lower reaches.
Fig. 5.1: Characteristic cross-sectional area values of the studied Lower Tisza for the entire
studied channel section (A), for the upper reach (B), middle reach (C), and lower reach (D) based on
the channel surveys made in 1891, 1931, 1961, 1976, 1999 and 2017.
The maximum and minimum cross-sectional areas for the studied river section
differed spatially. At the beginning, the VO cross-sections with the lowest area (1891:
620 m2; 1931: 1269 m2; 1961: 1220 m2) were located in the middle reach. From 1976
to 1999, it was located in the upper reach (1976: 1168 m2; 1999: 1194 m2), while in
2017, it was in the lower reach (1205 m2). However, the maximum cross-sectional areas
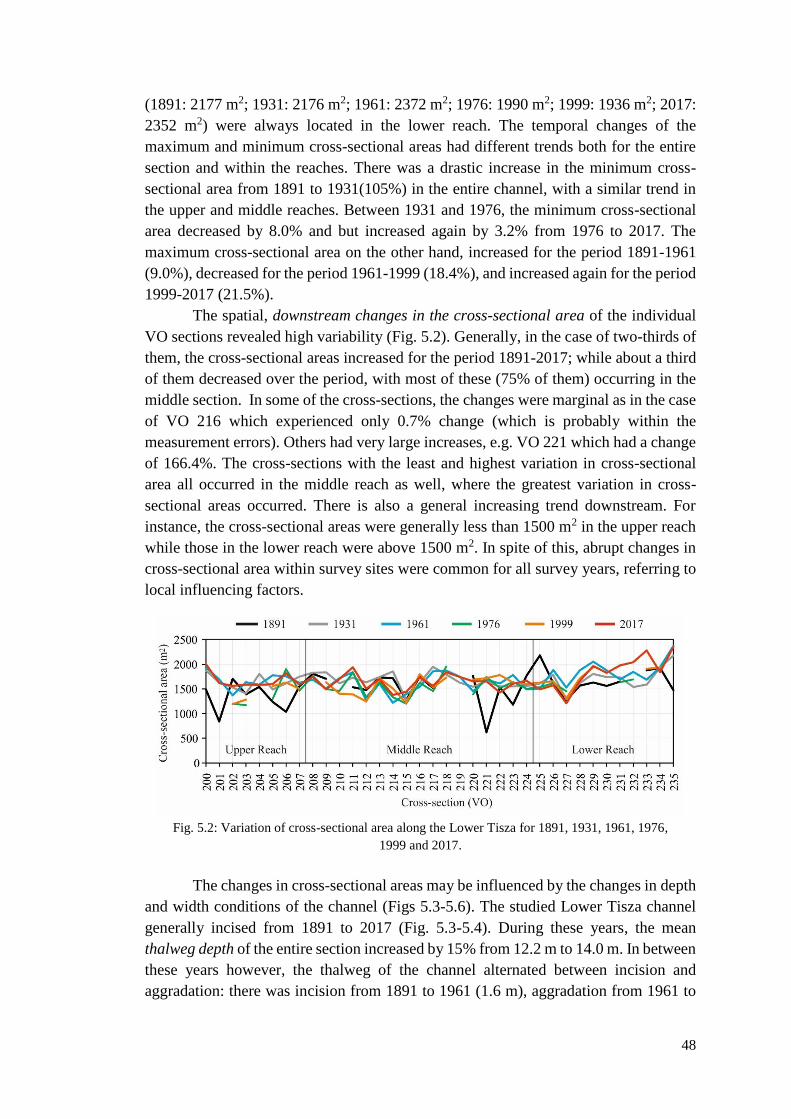
48
(1891: 2177 m2; 1931: 2176 m2; 1961: 2372 m2; 1976: 1990 m2; 1999: 1936 m2; 2017:
2352 m2) were always located in the lower reach. The temporal changes of the
maximum and minimum cross-sectional areas had different trends both for the entire
section and within the reaches. There was a drastic increase in the minimum cross-
sectional area from 1891 to 1931(105%) in the entire channel, with a similar trend in
the upper and middle reaches. Between 1931 and 1976, the minimum cross-sectional
area decreased by 8.0% and but increased again by 3.2% from 1976 to 2017. The
maximum cross-sectional area on the other hand, increased for the period 1891-1961
(9.0%), decreased for the period 1961-1999 (18.4%), and increased again for the period
1999-2017 (21.5%).
The spatial, downstream changes in the cross-sectional area of the individual
VO sections revealed high variability (Fig. 5.2). Generally, in the case of two-thirds of
them, the cross-sectional areas increased for the period 1891-2017; while about a third
of them decreased over the period, with most of these (75% of them) occurring in the
middle section. In some of the cross-sections, the changes were marginal as in the case
of VO 216 which experienced only 0.7% change (which is probably within the
measurement errors). Others had very large increases, e.g. VO 221 which had a change
of 166.4%. The cross-sections with the least and highest variation in cross-sectional
area all occurred in the middle reach as well, where the greatest variation in cross-
sectional areas occurred. There is also a general increasing trend downstream. For
instance, the cross-sectional areas were generally less than 1500 m2 in the upper reach
while those in the lower reach were above 1500 m2. In spite of this, abrupt changes in
cross-sectional area within survey sites were common for all survey years, referring to
local influencing factors.
Fig. 5.2: Variation of cross-sectional area along the Lower Tisza for 1891, 1931, 1961, 1976,
1999 and 2017.
The changes in cross-sectional areas may be influenced by the changes in depth
and width conditions of the channel (Figs 5.3-5.6). The studied Lower Tisza channel
generally incised from 1891 to 2017 (Fig. 5.3-5.4). During these years, the mean
thalweg depth of the entire section increased by 15% from 12.2 m to 14.0 m. In between
these years however, the thalweg of the channel alternated between incision and
aggradation: there was incision from 1891 to 1961 (1.6 m), aggradation from 1961 to
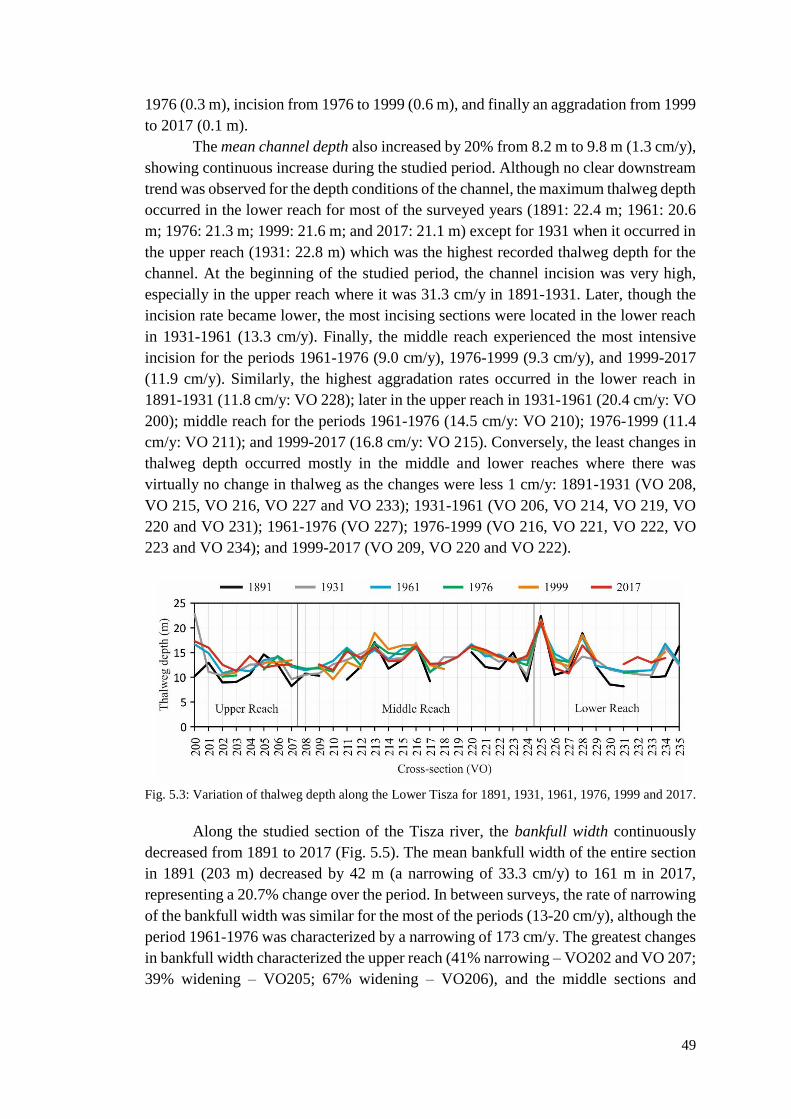
49
1976 (0.3 m), incision from 1976 to 1999 (0.6 m), and finally an aggradation from 1999
to 2017 (0.1 m).
The mean channel depth also increased by 20% from 8.2 m to 9.8 m (1.3 cm/y),
showing continuous increase during the studied period. Although no clear downstream
trend was observed for the depth conditions of the channel, the maximum thalweg depth
occurred in the lower reach for most of the surveyed years (1891: 22.4 m; 1961: 20.6
m; 1976: 21.3 m; 1999: 21.6 m; and 2017: 21.1 m) except for 1931 when it occurred in
the upper reach (1931: 22.8 m) which was the highest recorded thalweg depth for the
channel. At the beginning of the studied period, the channel incision was very high,
especially in the upper reach where it was 31.3 cm/y in 1891-1931. Later, though the
incision rate became lower, the most incising sections were located in the lower reach
in 1931-1961 (13.3 cm/y). Finally, the middle reach experienced the most intensive
incision for the periods 1961-1976 (9.0 cm/y), 1976-1999 (9.3 cm/y), and 1999-2017
(11.9 cm/y). Similarly, the highest aggradation rates occurred in the lower reach in
1891-1931 (11.8 cm/y: VO 228); later in the upper reach in 1931-1961 (20.4 cm/y: VO
200); middle reach for the periods 1961-1976 (14.5 cm/y: VO 210); 1976-1999 (11.4
cm/y: VO 211); and 1999-2017 (16.8 cm/y: VO 215). Conversely, the least changes in
thalweg depth occurred mostly in the middle and lower reaches where there was
virtually no change in thalweg as the changes were less 1 cm/y: 1891-1931 (VO 208,
VO 215, VO 216, VO 227 and VO 233); 1931-1961 (VO 206, VO 214, VO 219, VO
220 and VO 231); 1961-1976 (VO 227); 1976-1999 (VO 216, VO 221, VO 222, VO
223 and VO 234); and 1999-2017 (VO 209, VO 220 and VO 222).
Fig. 5.3: Variation of thalweg depth along the Lower Tisza for 1891, 1931, 1961, 1976, 1999 and 2017.
Along the studied section of the Tisza river, the bankfull width continuously
decreased from 1891 to 2017 (Fig. 5.5). The mean bankfull width of the entire section
in 1891 (203 m) decreased by 42 m (a narrowing of 33.3 cm/y) to 161 m in 2017,
representing a 20.7% change over the period. In between surveys, the rate of narrowing
of the bankfull width was similar for the most of the periods (13-20 cm/y), although the
period 1961-1976 was characterized by a narrowing of 173 cm/y. The greatest changes
in bankfull width characterized the upper reach (41% narrowing – VO202 and VO 207;
39% widening – VO205; 67% widening – VO206), and the middle sections and

50
downstream end of the middle reach (49% narrowing – VO214; 48% narrowing VO
215; 128% narrowing – VO221; 47% narrowing – VO223).
Fig. 5.4: Variation of mean depth along the Lower Tisza for 1891, 1931, 1961, 1976, 1999 and 2017.
Fig. 5.5: Variation of bankfull width along the Lower Tisza for 1891, 1931, 1961, 1976,
1999 and 2017.
Although there were wide variations in the bankfull width over the studied
period, the mean width did not display such pronounced changes (Fig. 5.6). From 1891
to 2017, the mean width decreased by 8% from 134 m to 126 m. The greatest change
was however from 1891 to 1999 (14.1%), while the period 1999-2017 was
characterized by widening (10%).
Fig. 5.6: Variation of mean width along the Lower Tisza for 1891, 1931, 1961, 1976, 1999 and 2017.

51
5.1.2 Effect of sinuosity on vertical channel parameters
The VO cross-sections were classified based on the sinuosity of the channel as
slightly sinuous bends or sinuous meanders (described in Chapter 4) to assess their role
in the morphological evolution of the Lower Tisza channel (Fig. 5.7). Although the
mean cross-sectional area of the bends (1524 m2) was slightly lesser than in the
meanders (1541 m2) in 1891, by 2017, it increased to 1767 m2 (by 15.9%) in case of
bends; while in the meanders, it increased to 1623 m2 (by 5.3%). In between surveys,
the cross-sectional areas within bends increased by 14.8% from 1891 to 1961, while
the change in the meanders was 6.4%. Later, the cross-sectional area decreased in the
bends from 1961 to 1999 (by 8.6%) and increased from 1999 to 2017 (by 10.5%). The
meandering sections also decreased but only from 1961 to 1976 (by 7.8%), and later
increased from 1976 to 2017 (by 7.4%).
Fig. 5.7: Variation in mean cross-sectional area of the entire studied section of the river within bends
and meanders for the surveyed years
In between surveys, the changes are well reflected in the yearly rate of change
in the cross-sectional area (Fig. 5.8). In the bends, the period 1891-1931 was
characterized by a high rate of increase (4.80 m2/y). The following period had a slower
rate of increase (1931-1961: 1.10 m2/y), about a quarter of the rate within the first
period. The next period was marked by reduction in the cross-sectional area of the
bends (1961-1976: 9.34 m2/y). There was a near termination in the evolution of the
cross-sectional area in the bends for the period 1976-1999. Although there was a
reduction, the rate of change was very low (0.46 m2/y). The final period (1999-2017)
was marked by the greatest rate of change (increase rate: 7.29 m2/y). In the meanders,
the channel had increasing rates for most of the periods (1891-1931: 1.49 m2/y; 1931-
1961: 1.27 m2/y; 1976-1999: 4.49 m2/y; and 1999-2017: 0.41 m2/y) except for 1961-
1976, which had a reducing rate, as well as the greatest rate of change (8.55 m2/y).
In the bends, although the mean cross-sectional area increased from 1891-2017
for all reaches, the rates of change for the reaches differed. The bends in the upper
reach had a similar trend as the entire section, although the magnitudes were generally
higher for all periods. The bends in the middle reach were characterized by a reducing
rate of change over longer periods; while in the lower reach, the rate was relatively
similar for the different periods (3.5-5.0 m2/y), although the period 1961-1976 was

52
different as was in the case for all other reaches. The least change in the reaches
occurred in the middle reach (13.5%), while the upper reach had the greatest change
(23.7%). The greatest rates of increase and decrease within the reaches all occurred in
the upper reach for the period 1999-2017 (16.14 m2/y) and 1961-1976 (-16.76 m2/y)
respectively. Likewise, in the meanders, the upper reach had a similar trend as the
section, as well as having the greatest rates of increase and decrease in 1891-1931 (9.38
m2/y) and 1961-1976 (-19.27 m2/y) respectively. Unlike in the bends, the mean cross-
sectional area of reaches increased only in the upper reach from 1891-2017 (23.5%);
with the middle and lower reaches being characterized by slight decreases (2.9% and
4.4% respectively).
Fig. 5.8: Yearly change in cross-sectional area within (A) bends and (B) meanders for the entire
studied river section and the three reaches
The changes in the cross-sectional area were further highlighted by the changes
in the thalweg depth and mean depth (Fig. 5.9), and the bankfull width and mean width
(Fig. 5.10). Within the bends and meanders, the pattern of thalweg depth increases was
similar to the cross-sectional area increases. The thalweg depth increased by 12.9% and
2.1% in the bends and meanders respectively over the studied period. The mean depth
also had a similar increase as the thalweg in the bends (24.9%) but a slightly more
pronounced increase in the meanders (8.4%). Within the reaches, the patterns of change
in thalweg depth were similar, although the greatest differences were generally between
1961-1999 where the evolution patterns differed.
The greatest rates of change in depth were however within the upper reach (for
bends) and lower reach (for meanders). The bankfull depth decreased over the studied
period by 15.3% in bends and 12.6% in meanders. The mean width of the channel also
decreased (8.1%) in the bends, but there was almost no change in the mean width of
the meandering sections (an increase of 0.4% over the 126-year period). In spite of
these, the meanders recorded the greatest differences in width in-between survey years,
with no defined trends in bankfull and mean width except the bankfull width of the
bends. The width variations in the reaches also had no clear trends especially in the
meanders. However, the greatest variations occurred from 1891 till 1999 where the
width generally decreased referring to channel narrowing in all reaches. Nevertheless,
the differences in the reaches became smaller by the end of the studied period, referring
to more uniform channel conditions.

53
Fig. 5.9: Yearly change in thalweg depth within (A) bends and (B) meanders; and yearly change in
mean depth within (C) bends and (D) meanders for the entire studied river section and the three
reaches.
Fig. 5.10: Yearly change in bankfull width within (A) bends and (B) meanders; and yearly change in
mean width within (C) bends and (D) meanders for the entire studied river section and the three
reaches.
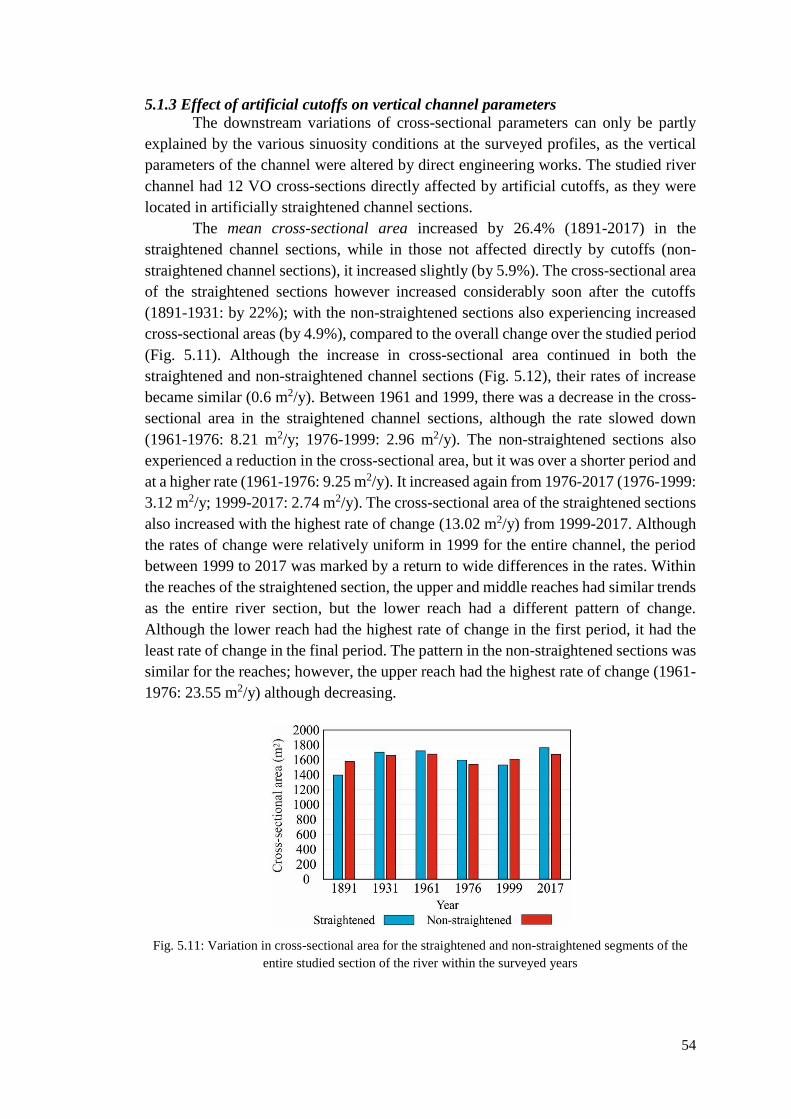
54
5.1.3 Effect of artificial cutoffs on vertical channel parameters
The downstream variations of cross-sectional parameters can only be partly
explained by the various sinuosity conditions at the surveyed profiles, as the vertical
parameters of the channel were altered by direct engineering works. The studied river
channel had 12 VO cross-sections directly affected by artificial cutoffs, as they were
located in artificially straightened channel sections.
The mean cross-sectional area increased by 26.4% (1891-2017) in the
straightened channel sections, while in those not affected directly by cutoffs (non-
straightened channel sections), it increased slightly (by 5.9%). The cross-sectional area
of the straightened sections however increased considerably soon after the cutoffs
(1891-1931: by 22%); with the non-straightened sections also experiencing increased
cross-sectional areas (by 4.9%), compared to the overall change over the studied period
(Fig. 5.11). Although the increase in cross-sectional area continued in both the
straightened and non-straightened channel sections (Fig. 5.12), their rates of increase
became similar (0.6 m2/y). Between 1961 and 1999, there was a decrease in the cross-
sectional area in the straightened channel sections, although the rate slowed down
(1961-1976: 8.21 m2/y; 1976-1999: 2.96 m2/y). The non-straightened sections also
experienced a reduction in the cross-sectional area, but it was over a shorter period and
at a higher rate (1961-1976: 9.25 m2/y). It increased again from 1976-2017 (1976-1999:
3.12 m2/y; 1999-2017: 2.74 m2/y). The cross-sectional area of the straightened sections
also increased with the highest rate of change (13.02 m2/y) from 1999-2017. Although
the rates of change were relatively uniform in 1999 for the entire channel, the period
between 1999 to 2017 was marked by a return to wide differences in the rates. Within
the reaches of the straightened section, the upper and middle reaches had similar trends
as the entire river section, but the lower reach had a different pattern of change.
Although the lower reach had the highest rate of change in the first period, it had the
least rate of change in the final period. The pattern in the non-straightened sections was
similar for the reaches; however, the upper reach had the highest rate of change (1961-
1976: 23.55 m2/y) although decreasing.
Fig. 5.11: Variation in cross-sectional area for the straightened and non-straightened segments of the
entire studied section of the river within the surveyed years

55
Fig. 5.12: Yearly change in cross-sectional area for (A) straightened segments and (B) non-
straightened segments for the entire studied river section and the three reaches.
The changes in the thalweg depth and mean depth indicated that the channel
incised rapidly from 1891 to 1931; characterized by aggradation from 1931-1999, but
degraded again from 1999 to 2017 (Fig. 5.13). Although the thalweg depth increased
by 1.4 m (11.2%) over the studied period in the straightened sections, and by 2.0 m
(16.6%) in the non-straightened sections; the greatest change (1.7 m; by 16.6%)
occurred in the period 1891-1931 in the straightened sections, and by 1.7 m (21.3%) in
the non-straightened sections between 1891 and 1999. In the straightened sections, the
thalweg depth decreased from 1931 to 1999 but increased again from 1999 to 2017. In
the non-straightened sections however, the increase covered the period 1891 to 1999
with the decrease from 1999 to 2017. The trends within the reaches were similar for
both straightened and non-straightened sections; although the lower reach was
characterized by different patterns in the initial period (1891-1931), and the final period
(1999-2017) within the straightened sections. The greatest changes within the reaches
occurred within the upper reach for both straightened and non-straightened sections.
The bankfull width and the mean width changes had similar patterns, although
there were sharp differences in the rate of change for both the straightened and non-
straightened sections (Fig. 5.14). The mean bankfull width in the straightened sections
was narrower than in the non-straightened sections in 1891 (175.3 m and 213.8 m
respectively); although by 2017, the straightened sections had a wider channel than the
non-straightened sections (168.0 m and 157.7 m respectively). The mean width did not
however display such wide variations in either case. In the straightened sections, the
bankfull width decreased by 7.3 m (4.2%) over the entire studied period, although not
temporally uniformly. It increased between 1891-1961 (by 4.1%), decreased between
1961 and 1999 (by 9.7%), and increased again for the period 1999-2017 (by 1.9%).
The greatest change was a narrowing of 15.7 m (1961-1976) characterized by
an annual decrease in bankfull width of 1.05 m/y. The change in the non-straightened
sections showed a greater change, as the channel narrowed by 26.2% during the 126-
year long period. Unlike in the straightened sections, the non-straightened sections
narrowed for each surveyed period although the greatest narrowing also occurred from
1961 to 1976 (2.07 m/y).
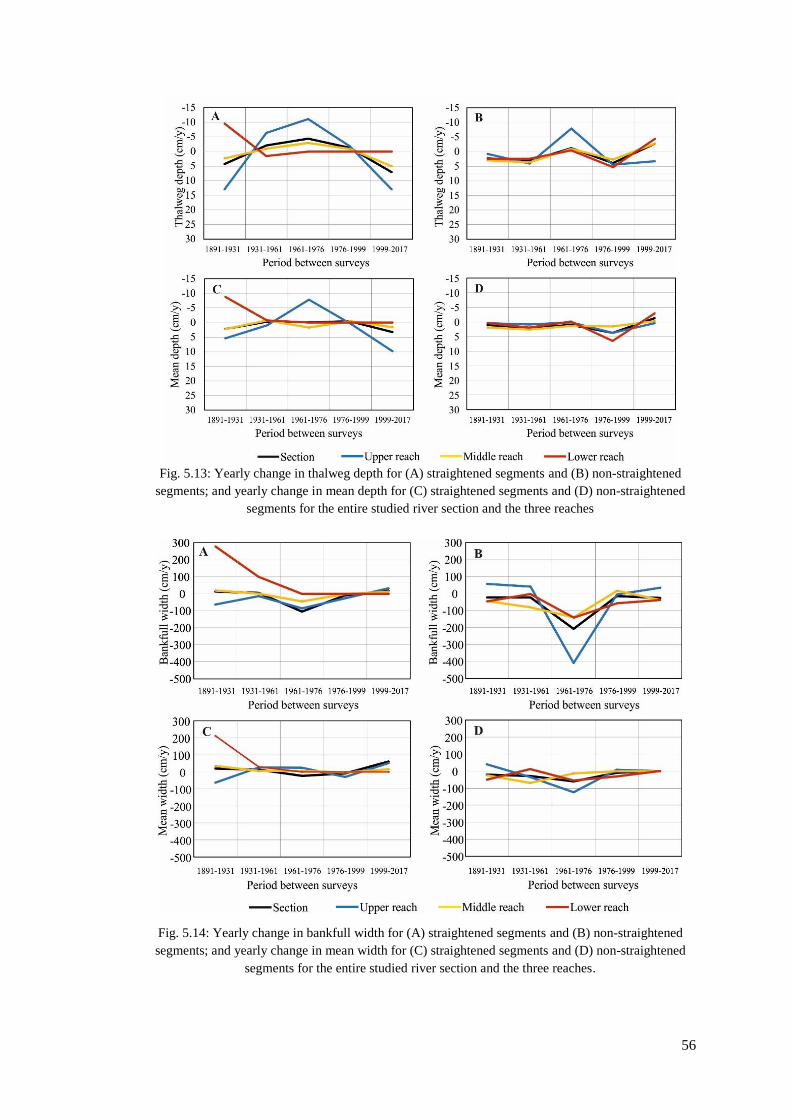
56
Fig. 5.13: Yearly change in thalweg depth for (A) straightened segments and (B) non-straightened
segments; and yearly change in mean depth for (C) straightened segments and (D) non-straightened
segments for the entire studied river section and the three reaches
Fig. 5.14: Yearly change in bankfull width for (A) straightened segments and (B) non-straightened
segments; and yearly change in mean width for (C) straightened segments and (D) non-straightened
segments for the entire studied river section and the three reaches.
57
In the final period, the channel width was more uniform. The patterns within
the reaches were similar to the entire channel section for both straightened and non-
straightened channel sections. The greatest change in the straightened sections was in
the lower reach (1891-1931: a decrease of 2.78 m/y), while that of the non-straightened
sections was in the upper reach (1961-1976: a decrease of 4.07 m/y).
5.1.4 Effects of revetments and groynes on vertical channel parameters
The effects of bank stabilization (revetment and groynes) on vertical channel
parameters were also evaluated. The construction of revetments and groynes were
mainly after 1931; thus, their effect on the channel vertical parameters were expected
after this period. Moreover, these direct constructions were localized and affected only
a low number of cross-sections (see Fig 3.4). Again, the groynes were located three
cross-sections in the upstream end of the upper reach which also had revetment;
therefore, the analyses were done mainly for the revetments.
The mean cross-sectional area for the revetted and non-revetted sections in
1891 (1591.2 m2 and 1484.7 m2 respectively) increased similarly (by 12.8% and by
10.8% respectively) over the 126-year period (Fig. 5.15). The period 1891-1961 (50
years) was characterized by an increase in the cross-sectional area for both the revetted
sections (by 6.5%) and the non-revetted sections (by 13.8%) with actual change in non-
revetted sections being almost double that in the revetted section (103.4 m in revetted
sections; and 204.3 m in non-revetted sections). Between 1961 and 1976, the cross-
sectional area of the channel decreased in both revetted and non-revetted sections
(10.5% and 6.5% respectively). Although the next period (1976-1999) was marked by
increases in cross-sectional areas, the change in the non-revetted sections was just 0.5%
while in the revetted section, it was 4.3%. This increasing trend continued for the last
period (1999-2017) for both revetted and non-revetted sections (13.4% and 3.6%
respectively).
The difference in the change in cross-sectional area for the revetted and non-
revetted was emphasized by the rate of change in in between survey years with the
revetted sections marked by wide variations, while the non-revetted sections were not
(Fig. 5.16). The reaches generally followed similar trends as the entire section in both
revetted and non-revetted sections. However, in the revetted sections, the initial period
of decrease was shorter in the middle reach (1891-1961), while the greatest change rate
was within the upper reach between 1976 and 2017. In the non-revetted sections, the
initial period and final period within the lower reach was different from the general
trend, with the greatest rate of change occurring in the lower reach between 1961 and
1976.
The depth had a positive correlation with the changes in the cross-sectional area
(Fig. 5.17). For both the entire section and within the reaches, the thalweg depth had
similar trends as the changes in the cross-sectional areas within both the revetted and
non-revetted sections. Although the thalweg was 12.2 m in both revetted and non-
revetted sections in 1891, they increased by 15.4% and 12.1% respectively over the
studied period. The rate of change in the channel was less than 5 cm/y in both the
revetted in non-revetted sections. Although the channel incised generally, there was

58
aggradation in both the revetted and non-revetted sections from 1961 to 1976 and again
from 1999 to 2017, indicated by the decreasing rates of change in both periods. While
the greatest rate of change occurred in the upper reach in the revetted sections (26.5
cm/y), in the non-revetted sections, it occurred in the lower reach (7.4 cm/y).
Fig. 5.15: Variation in cross-sectional area of the river within revetted segments and non-revetted
segments for the surveyed years
Fig. 5.16: Yearly change in cross-sectional area for (A) revetted segments and (B) non-revetted
segments for the entire studied river section and the three reaches.
The changes in cross-sectional area were further highlighted by the changes that
occurred in the bankfull width and mean width in the whole studied section, and within
the reaches (Fig. 5.18). Over the 126-year studied period, the bankfull width narrowed
by 18.7% and 14.7% in the revetted and non-revetted sections respectively. However,
not all surveyed periods were characterized by narrowing. In the revetted sections,
although narrowing occurred for most of the time (1891-1999), the last period (1999-
2017) had widening. In the non-revetted sections, a similar trend occurred; however,
1931-1961 was also marked by channel widening. The channel was generally
characterized by narrowing, with the greatest rate of narrowing between 1961 and 1976
(1.70 m/y for revetted sections; and 1.74 m/y for non-revetted sections). The reaches
had trends similar to the section although the changes in the middle reach was more
conspicuous. The greatest rate of change in the reaches also occurred for the period
1961-1976 within the upper reach for both revetted and non-revetted sections (2.85 m/y
and 2.96 m/y respectively).

59
Fig. 5.17: Yearly change in thalweg depth for (A) revetted segments and (B) non-revetted segments;
and yearly change in mean depth for (C) revetted segments and (D) non-revetted segments for the
entire studied river sections and the three reaches.
Fig. 5.18: Yearly change in bankfull width for (A) revetted segments and (B) non-revetted segments;
and yearly change in mean width for (C) revetted segments and (D) non-revetted segments for the
entire studied river section and the three reaches.

60
5.1.5 Discussion on the centurial evolution of the Lower Tisza channel
Based on the results, it became clear, that the changes in vertical channel
parameters (indicated by the cross-sectional area, channel depth and width) were
influenced by channel planform and engineering constructions. The centurial data
covering the studied Lower Tisza allowed for a chronological analysis of the changes
in the channel. The changes in the cross-sectional area were due mainly to a general
incision of the channel, which partly compensated the channel narrowing. The incision
can be related to the increased stream power as a result of the shortened channel length
and increased channel gradient due to the artificial cutoffs (Laczay, 1977; Mezősi,
1986). The incision of river channels due to this type of human intervention is widely
reported on rivers all over the world (Chang, 1986; Simon, 1989; Hooke, 1995; Smith
and Winkley, 1996; Rinaldi and Simon, 1998; Surian and Rinaldi, 2003; Kiss et al.,
2008; Czerkész-Nagy et al.,2010; Baena-Esudero et al., 2019).
The correlation between the cross-sectional area with the depth and width (Fig.
5.19) explains the variations that existed in the vertical channel parameters for the
various surveyed years. As indicated, the channel had very wide variations in the
vertical channel parameters at the initial survey (1891). The subsequent surveys showed
that the changes in the cross-sections were towards a more uniform channel although
the channel started to exhibit wide variations by 1961. The period between 1961 and
2017 was again characterized by an evolution towards a uniform channel morphology.
However, the channel again showed wide variations in vertical channel parameters by
2017.
Fig. 5.19: Correlation of the cross-sectional area with the thalweg depth (A); mean depth (B);
bankfull width (C); and mean width (D) for the Lower Tisza over all surveyed years
Generally, the channel developed according to the channel evolution model of
Simon and Rinaldi (2006); with an increase in cross-sectional area over the studied
period, and a decreasing downstream trend. As indicated by a conceptual model of the
morphological evolution of the Lower Tisza channel (Fig. 5.20), the cross-sectional
area increased over two distinct periods, 1891-1961 and 1976-2017. The depth and
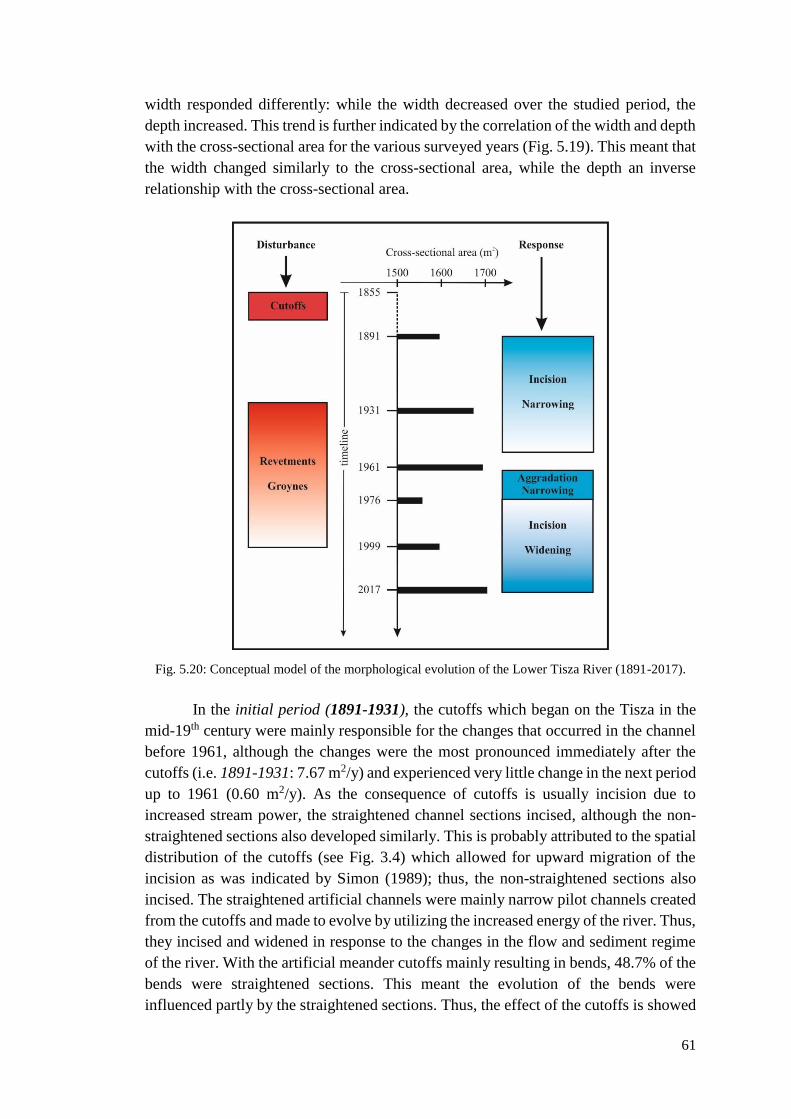
61
width responded differently: while the width decreased over the studied period, the
depth increased. This trend is further indicated by the correlation of the width and depth
with the cross-sectional area for the various surveyed years (Fig. 5.19). This meant that
the width changed similarly to the cross-sectional area, while the depth an inverse
relationship with the cross-sectional area.
Fig. 5.20: Conceptual model of the morphological evolution of the Lower Tisza River (1891-2017).
In the initial period (1891-1931), the cutoffs which began on the Tisza in the
mid-19th century were mainly responsible for the changes that occurred in the channel
before 1961, although the changes were the most pronounced immediately after the
cutoffs (i.e. 1891-1931: 7.67 m2/y) and experienced very little change in the next period
up to 1961 (0.60 m2/y). As the consequence of cutoffs is usually incision due to
increased stream power, the straightened channel sections incised, although the non-
straightened sections also developed similarly. This is probably attributed to the spatial
distribution of the cutoffs (see Fig. 3.4) which allowed for upward migration of the
incision as was indicated by Simon (1989); thus, the non-straightened sections also
incised. The straightened artificial channels were mainly narrow pilot channels created
from the cutoffs and made to evolve by utilizing the increased energy of the river. Thus,
they incised and widened in response to the changes in the flow and sediment regime
of the river. With the artificial meander cutoffs mainly resulting in bends, 48.7% of the
bends were straightened sections. This meant the evolution of the bends were
influenced partly by the straightened sections. Thus, the effect of the cutoffs is showed

62
in the evolution of the bends and meanders. With similar cross-sectional areas in 1891
(1524 m2 for bends; and 1541 m2 for meanders); the bends increased by 193 m2 (12.6%)
by 1931 while the increase in meanders was only 60 m2 (3.9%.). Although the widths
were similar, the smaller width in the bends were as a result of the pilot channels which
were created due to the artificial meander cutoffs to create the bends. Generally, the
entire Lower Tisza channel was narrowing after cutoffs between 1891 and 1931 (by ca.
3.2% for both bankfull width and mean width); However, some sections of the channel
underwent rapid widening as indicated by the bankfull width: VO 206 (50.6%), VO
223 (26.8%) and VO 228 (23.8%), VO 235 (93.1%), while some sections (VO 201, VO
221) experienced widening of more than 100%. The widening sections were generally
located within or close to straightened sections of the channel; which suggests they
were either pilot channels, or their proximity to the pilot channels influenced their
development. This is however expected in the evolution of a channel undergoing
incision, as bank failure will be initiated when the critical height and angle of the bank
material reaches a certain threshold (Simon, 1989). Therefore, the temporal and spatial
changes in the cross-sectional area of the channel within the period suggest that the
channel generally increased its cross-section and depth to adjust to the change from the
original larger meandering sections to the new smaller straightened sections although
the width decreased. Thus, the cutoffs initiated a channel development towards an
equilibrium with increases in cross-sectional area in all morphological settings: both at
straightened and non-straightened sections, and at bend and meanders.
Between 1931 and 1961, although the channel generally continued to increase
its vertical cross-sectional parameters, the change in cross-sectional area for the
straightened and non-straightened sections, as well as the annual rate of increase
became similar (by 1.2%; 0.61 m2/y). The increase in the cross-sectional area was
mainly due to an increase in the depth as the width of the channel continued to reduce
generally. In the bends and meanders, an annual increase in cross-sectional area of 1.10-
1.30 m2/y translated into increases of 1.1% and 2.4% respectively. This indicates that,
the artificial cutoffs were no longer dominant in controlling the morphological
evolution of the channel, although the channel continued its adjustment to a new
equilibrium. However, this adjustment could not be completed when the next set of
engineering interventions started in the Lower Tisza with the construction of groynes
and revetment, which impeded the morphological evolution and began another phase
of disequilibrium. The localized widening of the channel continued in some sections of
the river with 20-40 m changes in width (VO 200, VO 205, VO 206, VO 223 and VO
229). This localized widening was enough reason for the construction of groynes and
revetments, as they threatened the artificial levee system meant to offer flood
protection.
In the next period (1961-1976), the river gave a clear fluvial response to the
construction of revetments, as there was a drastic reduction in the cross-sectional area
of the channel. The impact is better understood when compared to the response of the
channel in the initial (1891-1931) period due to the cutoffs. While the entire channel
increased its cross-sectional area by 145 m2 over a 40-year due to the cutoffs, it reduced
it by 134 m2 in just 15 years as a result of the revetments. This relative change is even

63
more dramatic in the revetted sections: cross-sectional area reduction by 103 m2 (1891-
1931) and 177 m2 (1961-1976), thus it decreased below the pre-1891 value (1891:
1591.2 m2; 1976: 1517.1 m2). By 1976, the entire Lower Tisza channel had started to
respond to the construction of the revetment. Thus, the Lower Tisza channel began
another phase of evolution towards a new equilibrium as most revetments in the studied
river section were constructed before the 1976 survey. The response of the channel to
the revetment construction transformed the channel from a widening channel to a deep
and narrower channel as the thalweg depth increased while the bankfull width reduced
relatively due to the bank stabilization. Generally, within the reaches, there was
intensive bank aggradation and reduction of bankfull width within the upper reach
compared to the other reaches. This may be attributed to the groynes which are located
mostly within the upper reach and induced aggradation along the banks resulting in
narrowing. The cross-sectional area in the upper reach therefore experienced very
significant reductions. Within the lower reach, the ponding effect of the Danube on the
Tisza (Vágás, 1982) coupled with the stabilization of the channel resulted in a relatively
stable reach.
By the period 1976-1999, the channel began to establish a new equilibrium as
the cross-sectional area of Lower Tisza channel began to increase. However, in the
bends, the increase was delayed as the period was still marked by decreasing cross-
sectional area mainly because the there was no further incision in the bends as in the
case of the rest of the channel.
Within the last period (1999-2017), the new equilibrium path was further
entrenched when the cross-sectional area increased to 1961 values generally by 2017;
although in the non-straightened sections, the cross-sectional areas were still lower.
Within the period, the channel incision stopped as the mean depth recorded no change
although there was an aggradation of 0.1 m for the mean thalweg depth. The entire
channel began to widen, with the rate of change being lower than only for the 1961-
1976 narrowing. Based on the changes in the channel, a conceptual model was
developed to represent the morphological evolution of the entire Lower Tisza River
channel (Fig. 5.20).
The changes in the channel due to the bends and meanders are related to the
artificial meander cutoffs as the cutoffs resulted in bends although not all bends were
as a result of cutoffs. This meant the changes in the straightened sections directly
affected the bends. While the channel generally increased its cross-section through
incision with narrowing, the changes in the bends and meanders were similar. However,
while the bends had incision rates similar to the entire channel, the meanders had
relatively lower changes with aggradation even in the last period. The revetted and
non-revetted sections of the channel followed different patterns of change; although
over the 126-year period, they all increased their cross-section, incised and experienced
a channel narrowing. While the changes in the cross-sectional area for the revetted
sections and non-revetted sections were similar over the entire studied period, the
influence of the revetment is shown in the different patterns of their evolution.
Although the non-revetted sections had a mean cross-sectional area which was 7.1%
less than the revetted sections in 1891, the development of the channel after the cutoffs

64
towards an equilibrium meant the difference had reduced to 0.3% by 1961 which is
insignificant due to the possible errors in the measurements. However, between 1961
and 1976, although the whole channel had a similar mean cross-sectional area, the
revetted section reduced by 10.5% while the non-revetted section reduced by a smaller
margin (6.5%). The channel after this experienced an increase in cross-sectional area
although the change in the revetted sections was more than four times that of the non-
revetted sections (277.6 m2 and 64.5 m2 respectively). The relative changes in the
revetted and non-revetted sections can be seen from the evolution of their thalweg depth
and bankfull width. The bankfull width were uniform in 1961 due to the quasi-
equilibrium development of the channel, and the initial response (1961-1976) was also
similar as the entire channel narrowed. However, the period 1976-2017 was
characterized by a further narrowing of the non-revetted sections, although marginal
(1.4 m). In the revetted sections however, there was a widening of the channel (9 m)
suggesting a collapse of revetments in some sections which is studied in detail in
Chapter 5. 2.
The construction of the revetments was such that similar proportions of the
bends and meanders were revetted (ca. 39%). However, the bends and meanders had
different responses to the construction of the revetments. While the greatest incision in
the bends occurred between 1891-1931 (2.3 m) due to the influence of the cutoffs, the
incision in the bends after the construction of the revetments (1961-1976) was only 0.5
m. In the meanders however, there was aggradation (0.8 m) after the cutoffs, while the
channel responded to the construction of the revetment by an initial termination of the
aggradation. In the next period (1978-1999), the meanders experienced an incision of
1.5 m. This suggests the relative higher influence of the artificial meander cutoffs to
the development of the bends as compared to the construction of the revetment.
5.2 Detailed channel morphology and flow velocity of the Lower Tisza
As described in the previous section (Chapter 5.1), the revetments
fundamentally influence the active channel evolution (contemporarily). Therefore, to
have a detailed assessment of their effects on the channel, four sites located within the
middle reach of the Lower Tisza which are characterized by revetted sections in
different states were selected. The revetted sections were compared with a freely
developing meander which is free from any human intervention.
5.2.1 Cross-sectional and longitudinal profiles of studied sites
a) Csanytelek North (CN)
The 0.8 km long channel at the Csanytelek North study site (Fig. 5.21) was
stabilized by a revetment on its western bank along 0.3 km (at cross sections CN1-6)
in 1966. Based on our recent survey (made in 2018), the downstream end of the
revetment had already collapsed (along 110 m at CN5-6). The downstream cross-
sections (CN7-12) represented the channel without revetment, but with intensive bank
erosion along its western bank.
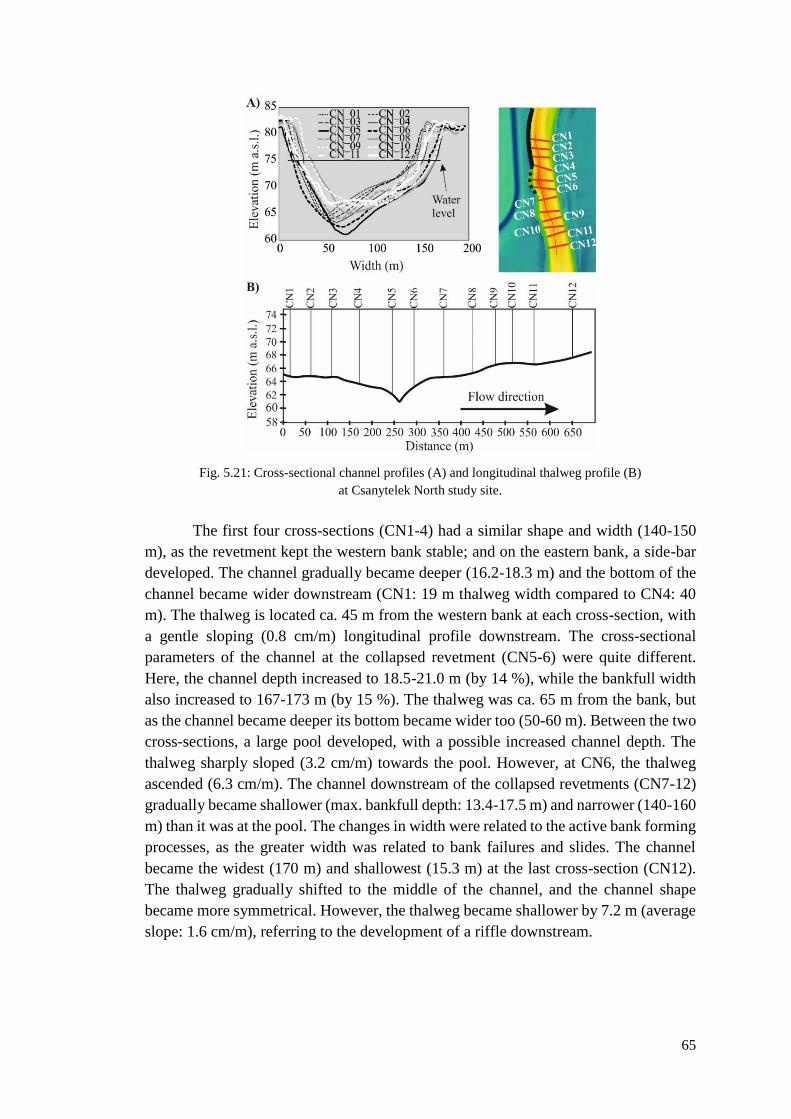
65
Fig. 5.21: Cross-sectional channel profiles (A) and longitudinal thalweg profile (B)
at Csanytelek North study site.
The first four cross-sections (CN1-4) had a similar shape and width (140-150
m), as the revetment kept the western bank stable; and on the eastern bank, a side-bar
developed. The channel gradually became deeper (16.2-18.3 m) and the bottom of the
channel became wider downstream (CN1: 19 m thalweg width compared to CN4: 40
m). The thalweg is located ca. 45 m from the western bank at each cross-section, with
a gentle sloping (0.8 cm/m) longitudinal profile downstream. The cross-sectional
parameters of the channel at the collapsed revetment (CN5-6) were quite different.
Here, the channel depth increased to 18.5-21.0 m (by 14 %), while the bankfull width
also increased to 167-173 m (by 15 %). The thalweg was ca. 65 m from the bank, but
as the channel became deeper its bottom became wider too (50-60 m). Between the two
cross-sections, a large pool developed, with a possible increased channel depth. The
thalweg sharply sloped (3.2 cm/m) towards the pool. However, at CN6, the thalweg
ascended (6.3 cm/m). The channel downstream of the collapsed revetments (CN7-12)
gradually became shallower (max. bankfull depth: 13.4-17.5 m) and narrower (140-160
m) than it was at the pool. The changes in width were related to the active bank forming
processes, as the greater width was related to bank failures and slides. The channel
became the widest (170 m) and shallowest (15.3 m) at the last cross-section (CN12).
The thalweg gradually shifted to the middle of the channel, and the channel shape
became more symmetrical. However, the thalweg became shallower by 7.2 m (average
slope: 1.6 cm/m), referring to the development of a riffle downstream.
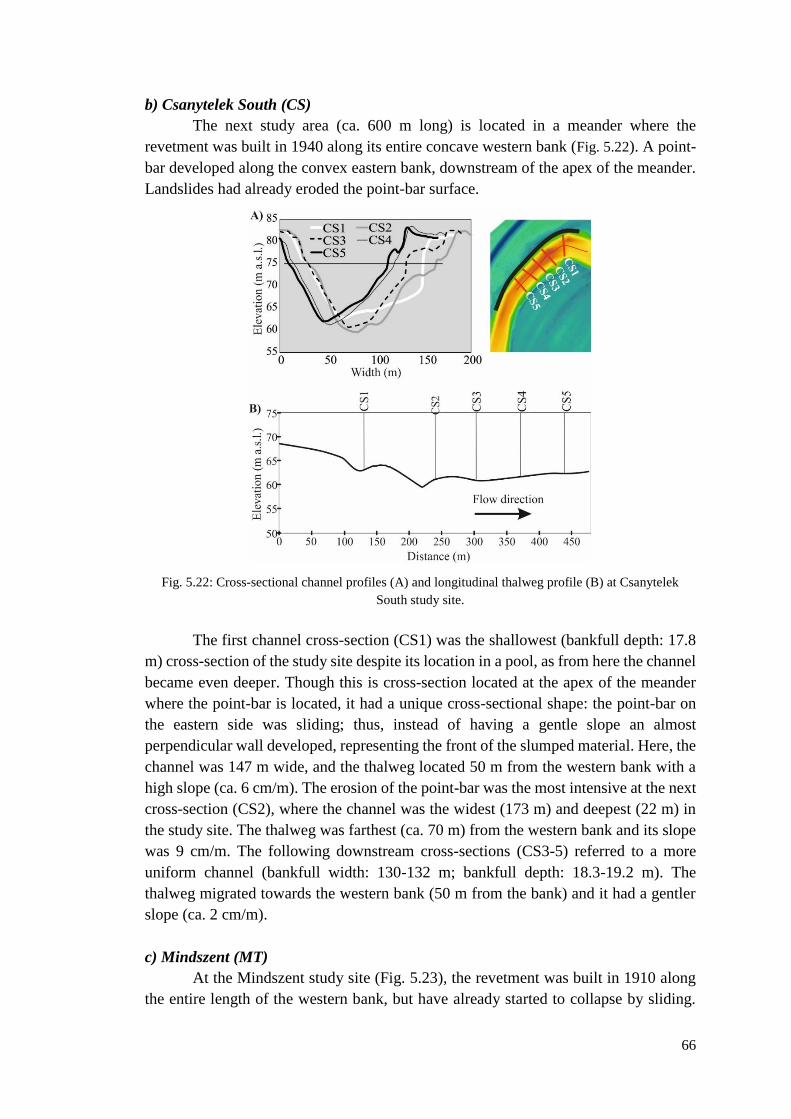
66
b) Csanytelek South (CS)
The next study area (ca. 600 m long) is located in a meander where the
revetment was built in 1940 along its entire concave western bank (Fig. 5.22). A point-
bar developed along the convex eastern bank, downstream of the apex of the meander.
Landslides had already eroded the point-bar surface.
Fig. 5.22: Cross-sectional channel profiles (A) and longitudinal thalweg profile (B) at Csanytelek
South study site.
The first channel cross-section (CS1) was the shallowest (bankfull depth: 17.8
m) cross-section of the study site despite its location in a pool, as from here the channel
became even deeper. Though this is cross-section located at the apex of the meander
where the point-bar is located, it had a unique cross-sectional shape: the point-bar on
the eastern side was sliding; thus, instead of having a gentle slope an almost
perpendicular wall developed, representing the front of the slumped material. Here, the
channel was 147 m wide, and the thalweg located 50 m from the western bank with a
high slope (ca. 6 cm/m). The erosion of the point-bar was the most intensive at the next
cross-section (CS2), where the channel was the widest (173 m) and deepest (22 m) in
the study site. The thalweg was farthest (ca. 70 m) from the western bank and its slope
was 9 cm/m. The following downstream cross-sections (CS3-5) referred to a more
uniform channel (bankfull width: 130-132 m; bankfull depth: 18.3-19.2 m). The
thalweg migrated towards the western bank (50 m from the bank) and it had a gentler
slope (ca. 2 cm/m).
c) Mindszent (MT)
At the Mindszent study site (Fig. 5.23), the revetment was built in 1910 along
the entire length of the western bank, but have already started to collapse by sliding.

67
On the opposite, convex bank a point-bar exists. Here, the cross-sections are very
similar to each other: the thalweg is skewed towards the revetted western bank (ca. 50
m). The first two cross-sections (MT1-2), upstream of the point-bar were the narrowest
although their bankfull width increased downstream (139 m and 155 m respectively).
Likewise, the bankfull depth increased downstream (15.2 m and 16.0 m, respectively).
The middle cross-sections (MT3-6) crossing the point-bar along the eastern bank, had
similar parameters (bankfull width: 174-181 m, and bankfull depth: 15.2-16.5 m). The
point-bar on the eastern bank had similar a brink-line height (above 81 m a.s.l) as the
opposite bank; but, while the concave bank had a high slope (ca. 45º), the point-bar had
a considerably lower slope (14º). Downstream of the point-bar, the channel (MT7-8)
became narrower (165 m and 175 m respectively) and shallower (14.8 m and 14.3 m
respectively) than all other transects within the study site.
Fig. 5.23 Cross-sectional channel profiles (A) and longitudinal thalweg profile (B) at Mindszent study
site.
d) Ányás (AY)
The Ányás study site is located in a 1.4 km long freely translating meander
without any direct human intervention. Thus, all cross-sections (AY1-15) showed the
natural channel morphology representing a complex pattern of lateral erosion and
active accumulation (Fig. 5.24).
The first four cross-sections (AY1-4) represented a riffle located at the
inflection zone between two meanders. Along this section on the western bank, the
formation of a side-bar indicates that aggradation dominates, while on the eastern bank,
active erosion by slides took place. The channel had relatively symmetrical cross-
sections, though the bankfull width (153-203 m) and bankfull depth (10.3-11.8 m)
varied. Within this section, the thalweg was located in the middle of the channel; and

68
the shallowest of the entire study site due to the development of a riffle. The slope of
the thalweg here was 0.3 cm/m.
Fig. 5.24: Cross-sectional channel profiles (A) and longitudinal thalweg profile (B) at Ányás study site.
Downstream of the riffle a sharp transition into to a pool was observed. Within
this pool, the cross-sections (AY5-7) remained symmetrical; but, their bankfull width
(200-240 m) and bankfull depth (12-15 m) increased. Here, the thalweg was slightly
skewed to the western bank (ca. 80 m from the bank), although the bottom of the
channel remained quite uniform. The slope of the thalweg in this pool increased (3
cm/m) having a knick-point upstream of cross-section AY5 (ca. 85 m). The slope
conditions on the upstream and downstream sides of the pool were however similar.
Downstream of the pool, another riffle developed (AY8-11). Here, the channel
gradually became narrower (bankfull width: 187-170 m) and shallower (bankfull depth:
13.5-11.0 m). The cross-section AY8 represented a transitional character between the
pool and the next 400 m long riffle (bankfull width: 188 m; and bankfull depth: 13.5
m). On the western (concave) bank of this pool, the previous surveys (see chapter 5.3;
Kiss et al., 2013) indicated the highest rate of bank erosion (ca. 1.2 m/y) at the study
site with increasing intensity downstream as the land-slides were replaced by total bank
collapse. The point-bar on the opposite eastern bank actively accumulated
compensating for the erosion along the concave bank; thus, keeping the channel size
relatively unchanged. There was a gradual thalweg shift towards the eastern bank in
this riffle section, while at the same time the thalweg elevation increased by 1.2 m
(average slope: 0.4 cm/m).
Downstream of this riffle, another pool developed (AY12-15) with a relatively
narrow bankfull width (135-175 m) and deeper channel (bankfull depth: 13.7-15.2 m).
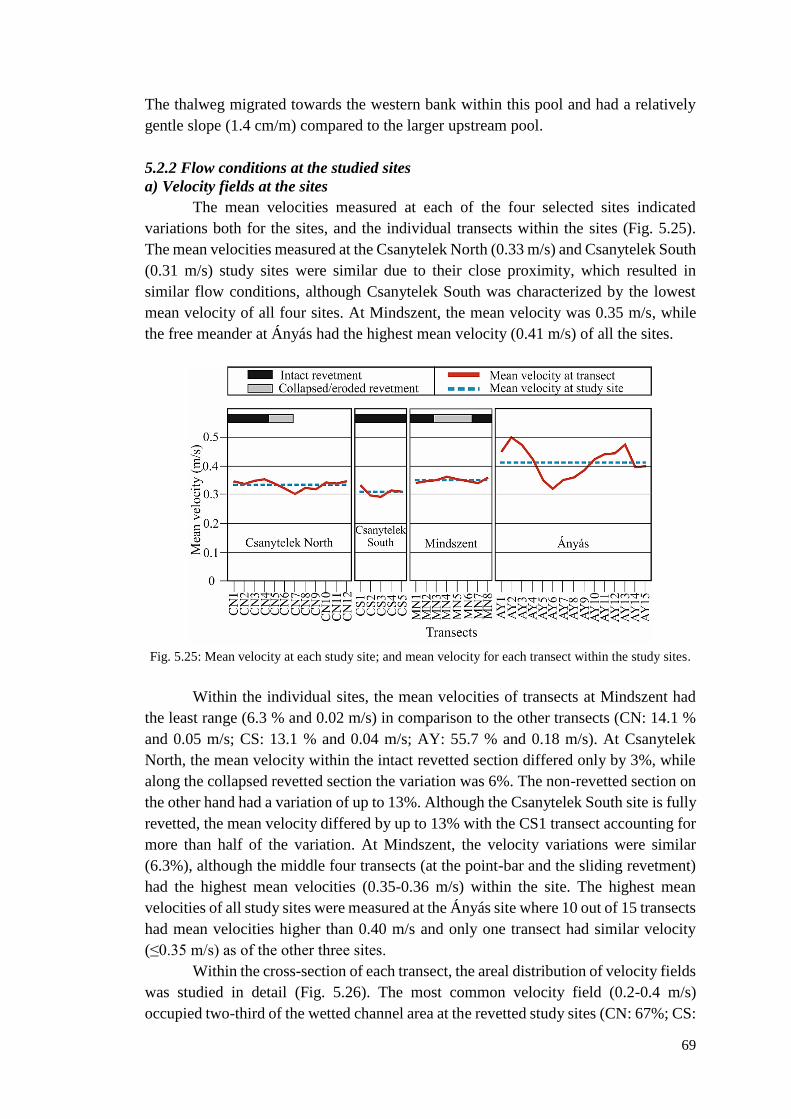
69
The thalweg migrated towards the western bank within this pool and had a relatively
gentle slope (1.4 cm/m) compared to the larger upstream pool.
5.2.2 Flow conditions at the studied sites
a) Velocity fields at the sites
The mean velocities measured at each of the four selected sites indicated
variations both for the sites, and the individual transects within the sites (Fig. 5.25).
The mean velocities measured at the Csanytelek North (0.33 m/s) and Csanytelek South
(0.31 m/s) study sites were similar due to their close proximity, which resulted in
similar flow conditions, although Csanytelek South was characterized by the lowest
mean velocity of all four sites. At Mindszent, the mean velocity was 0.35 m/s, while
the free meander at Ányás had the highest mean velocity (0.41 m/s) of all the sites.
Fig. 5.25: Mean velocity at each study site; and mean velocity for each transect within the study sites.
Within the individual sites, the mean velocities of transects at Mindszent had
the least range (6.3 % and 0.02 m/s) in comparison to the other transects (CN: 14.1 %
and 0.05 m/s; CS: 13.1 % and 0.04 m/s; AY: 55.7 % and 0.18 m/s). At Csanytelek
North, the mean velocity within the intact revetted section differed only by 3%, while
along the collapsed revetted section the variation was 6%. The non-revetted section on
the other hand had a variation of up to 13%. Although the Csanytelek South site is fully
revetted, the mean velocity differed by up to 13% with the CS1 transect accounting for
more than half of the variation. At Mindszent, the velocity variations were similar
(6.3%), although the middle four transects (at the point-bar and the sliding revetment)
had the highest mean velocities (0.35-0.36 m/s) within the site. The highest mean
velocities of all study sites were measured at the Ányás site where 10 out of 15 transects
had mean velocities higher than 0.40 m/s and only one transect had similar velocity
(≤0.35 m/s) as of the other three sites.
Within the cross-section of each transect, the areal distribution of velocity fields
was studied in detail (Fig. 5.26). The most common velocity field (0.2-0.4 m/s)
occupied two-third of the wetted channel area at the revetted study sites (CN: 67%; CS:
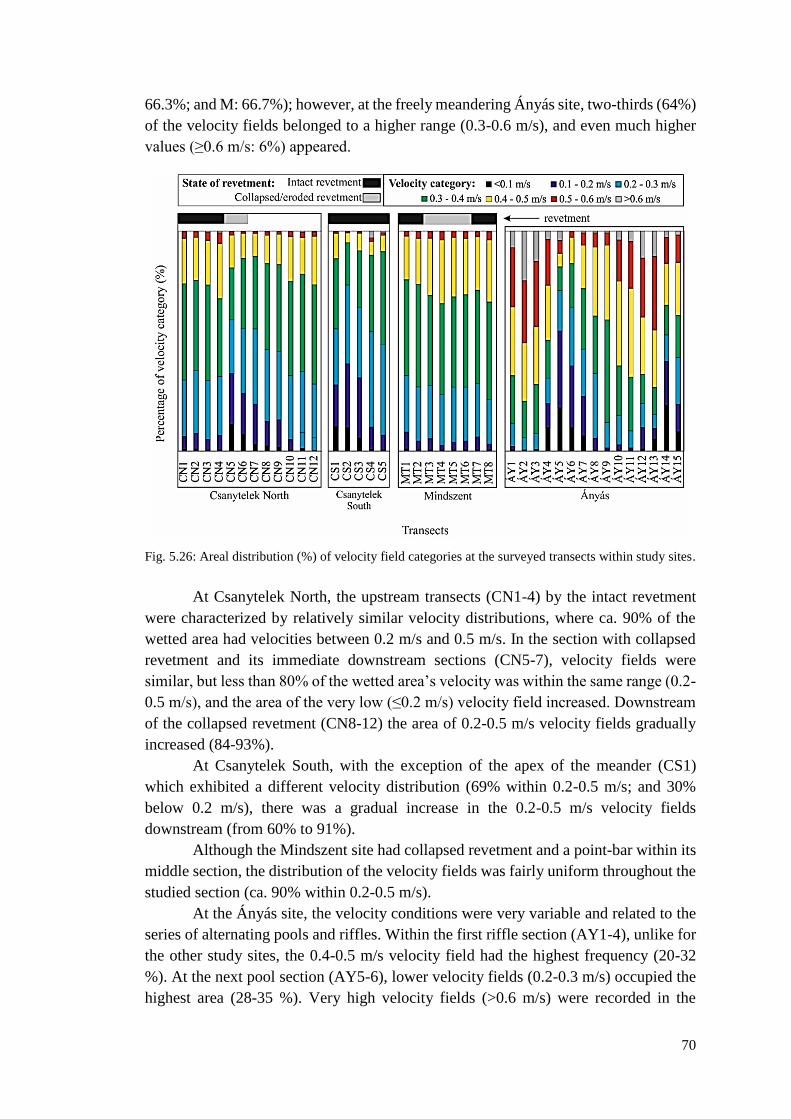
70
66.3%; and M: 66.7%); however, at the freely meandering Ányás site, two-thirds (64%)
of the velocity fields belonged to a higher range (0.3-0.6 m/s), and even much higher
values (≥0.6 m/s: 6%) appeared.
Fig. 5.26: Areal distribution (%) of velocity field categories at the surveyed transects within study sites.
At Csanytelek North, the upstream transects (CN1-4) by the intact revetment
were characterized by relatively similar velocity distributions, where ca. 90% of the
wetted area had velocities between 0.2 m/s and 0.5 m/s. In the section with collapsed
revetment and its immediate downstream sections (CN5-7), velocity fields were
similar, but less than 80% of the wetted area’s velocity was within the same range (0.2-
0.5 m/s), and the area of the very low (≤0.2 m/s) velocity field increased. Downstream
of the collapsed revetment (CN8-12) the area of 0.2-0.5 m/s velocity fields gradually
increased (84-93%).
At Csanytelek South, with the exception of the apex of the meander (CS1)
which exhibited a different velocity distribution (69% within 0.2-0.5 m/s; and 30%
below 0.2 m/s), there was a gradual increase in the 0.2-0.5 m/s velocity fields
downstream (from 60% to 91%).
Although the Mindszent site had collapsed revetment and a point-bar within its
middle section, the distribution of the velocity fields was fairly uniform throughout the
studied section (ca. 90% within 0.2-0.5 m/s).
At the Ányás site, the velocity conditions were very variable and related to the
series of alternating pools and riffles. Within the first riffle section (AY1-4), unlike for
the other study sites, the 0.4-0.5 m/s velocity field had the highest frequency (20-32
%). At the next pool section (AY5-6), lower velocity fields (0.2-0.3 m/s) occupied the
highest area (28-35 %). Very high velocity fields (>0.6 m/s) were recorded in the

71
second riffle section (4-23%) and these high velocity fields remained even in the last
pool section (2-12%).
b) Discharge conditions
The study sites exhibited varying wetted width, discharge and stream power
conditions (Fig. 5.27). The Csanytelek North and Csanytelek South sites are located
close to each other (ca. 2 km apart), therefore they had similar discharge conditions
(184.5-216.0 m3/s), although their wetted widths differed (CN: 82.2-125.1 m; CS: 87.4-
98.6 m). At Csanytelek North, the data of the transects at the revetted section showed
an increase in discharge with increased wetted width. The highest value was recorded
at the end of the collapsed revetment (CN5).
Fig. 5.27: Correlation between measured discharge and wetted channel width of transects at the at the
various study sites: A) Csanytelek North B) Csanytelek South C) Mindszent and, D) Ányás
At Csanytelek South, the wetted widths were similar due to the existence of a
revetment, but the discharge values varied relating to the morphological conditions.
While CS3 which is at the end of the point-bar recorded the minimum discharge (185.2
m3/s), CS5 recorded the highest discharge (215 m3/s) within the study site. At
Mindszent, although part of the revetment along the western bank collapsed, the wetted
width differences were independent of the state of the revetment (95.8-120.2 m). The
discharge characteristics of the transects were very similar (204.7-214.3 m3/s), having
the lowest range for all studied sites. The Ányás site had the most variable parameters,
characterized by high ranges in both wetted width (89.5-154.6 m) and discharge (192.8-
230.2 m3/s).
Although the measurements were carried out at low stage and discharge values
were generally similar, the specific stream power were generally higher in the non-
meandering study sites (Csanytelek north and Mindszent), while the revetted sections
were also generally higher than non-revetted sections (Fig. 5.28).
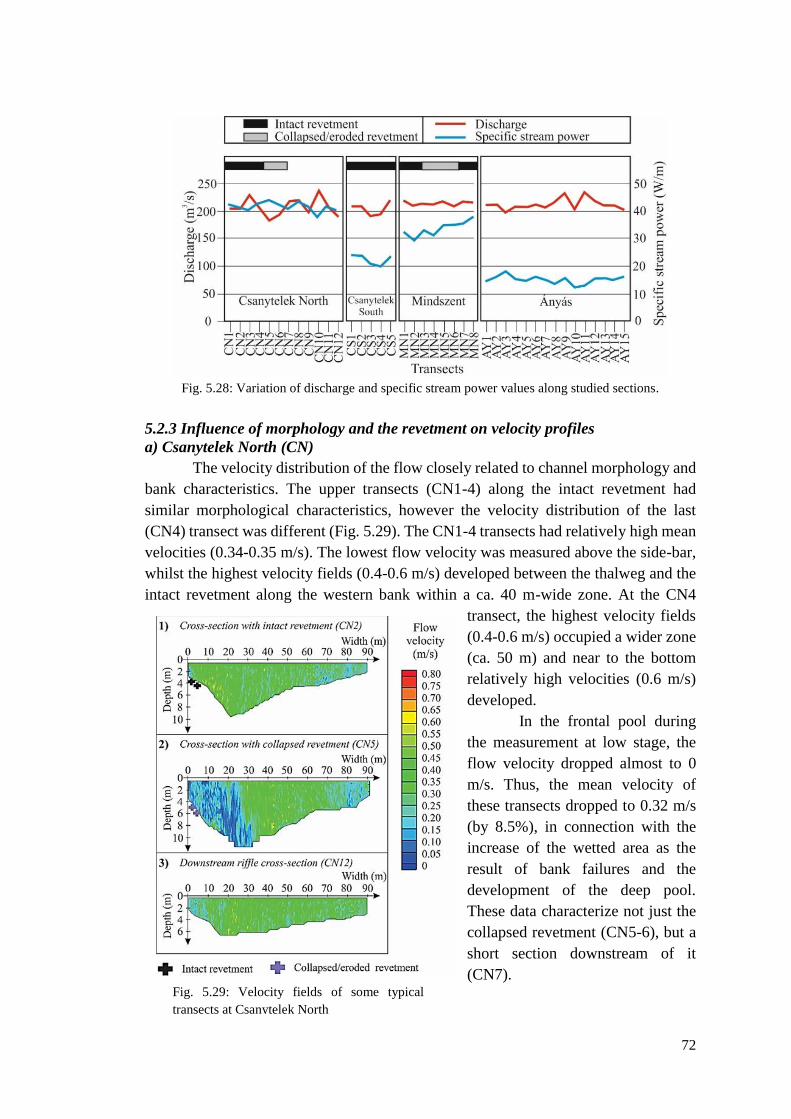
72
Fig. 5.28: Variation of discharge and specific stream power values along studied sections.
5.2.3 Influence of morphology and the revetment on velocity profiles
a) Csanytelek North (CN)
The velocity distribution of the flow closely related to channel morphology and
bank characteristics. The upper transects (CN1-4) along the intact revetment had
similar morphological characteristics, however the velocity distribution of the last
(CN4) transect was different (Fig. 5.29). The CN1-4 transects had relatively high mean
velocities (0.34-0.35 m/s). The lowest flow velocity was measured above the side-bar,
whilst the highest velocity fields (0.4-0.6 m/s) developed between the thalweg and the
intact revetment along the western bank within a ca. 40 m-wide zone. At the CN4
transect, the highest velocity fields
(0.4-0.6 m/s) occupied a wider zone
(ca. 50 m) and near to the bottom
relatively high velocities (0.6 m/s)
developed.
In the frontal pool during
the measurement at low stage, the
flow velocity dropped almost to 0
m/s. Thus, the mean velocity of
these transects dropped to 0.32 m/s
(by 8.5%), in connection with the
increase of the wetted area as the
result of bank failures and the
development of the deep pool.
These data characterize not just the
collapsed revetment (CN5-6), but a
short section downstream of it
(CN7). Fig. 5.29: Velocity fields of some typical
transects at Csanytelek North
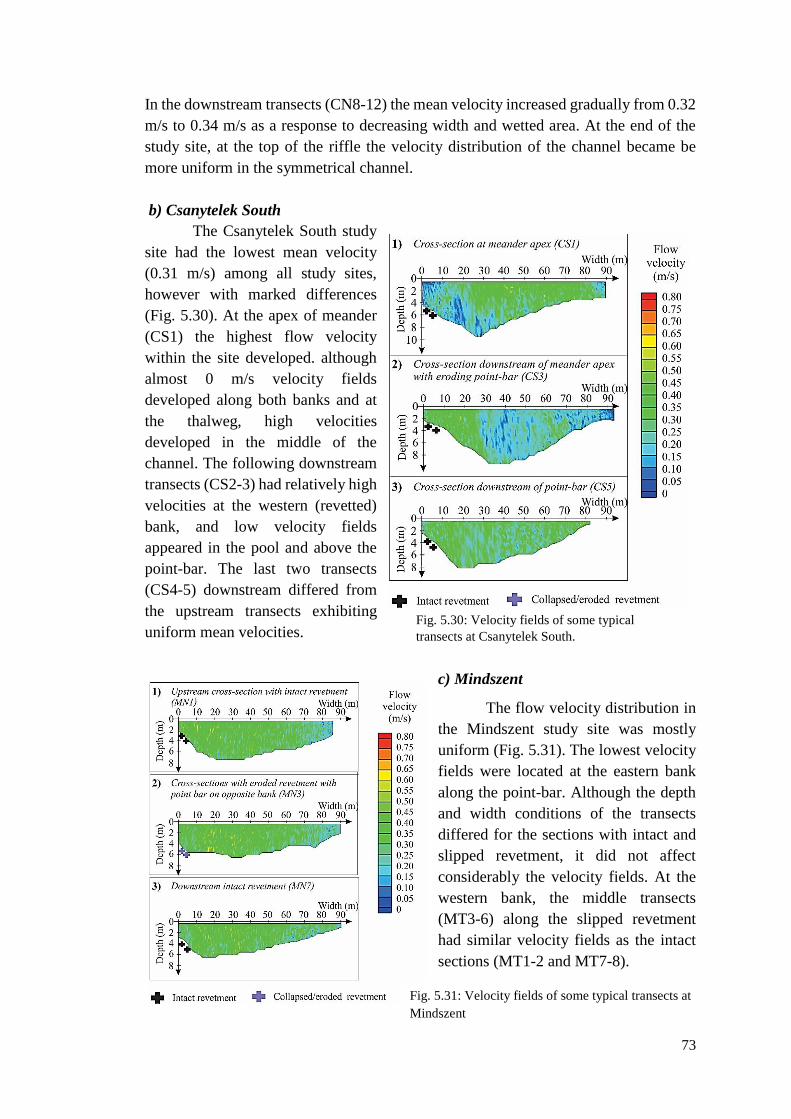
73
In the downstream transects (CN8-12) the mean velocity increased gradually from 0.32
m/s to 0.34 m/s as a response to decreasing width and wetted area. At the end of the
study site, at the top of the riffle the velocity distribution of the channel became be
more uniform in the symmetrical channel.
b) Csanytelek South
The Csanytelek South study
site had the lowest mean velocity
(0.31 m/s) among all study sites,
however with marked differences
(Fig. 5.30). At the apex of meander
(CS1) the highest flow velocity
within the site developed. although
almost 0 m/s velocity fields
developed along both banks and at
the thalweg, high velocities
developed in the middle of the
channel. The following downstream
transects (CS2-3) had relatively high
velocities at the western (revetted)
bank, and low velocity fields
appeared in the pool and above the
point-bar. The last two transects
(CS4-5) downstream differed from
the upstream transects exhibiting
uniform mean velocities.
c) Mindszent
The flow velocity distribution in
the Mindszent study site was mostly
uniform (Fig. 5.31). The lowest velocity
fields were located at the eastern bank
along the point-bar. Although the depth
and width conditions of the transects
differed for the sections with intact and
slipped revetment, it did not affect
considerably the velocity fields. At the
western bank, the middle transects
(MT3-6) along the slipped revetment
had similar velocity fields as the intact
sections (MT1-2 and MT7-8).
Fig. 5.30: Velocity fields of some typical
transects at Csanytelek South.
Fig. 5.31: Velocity fields of some typical transects at
Mindszent
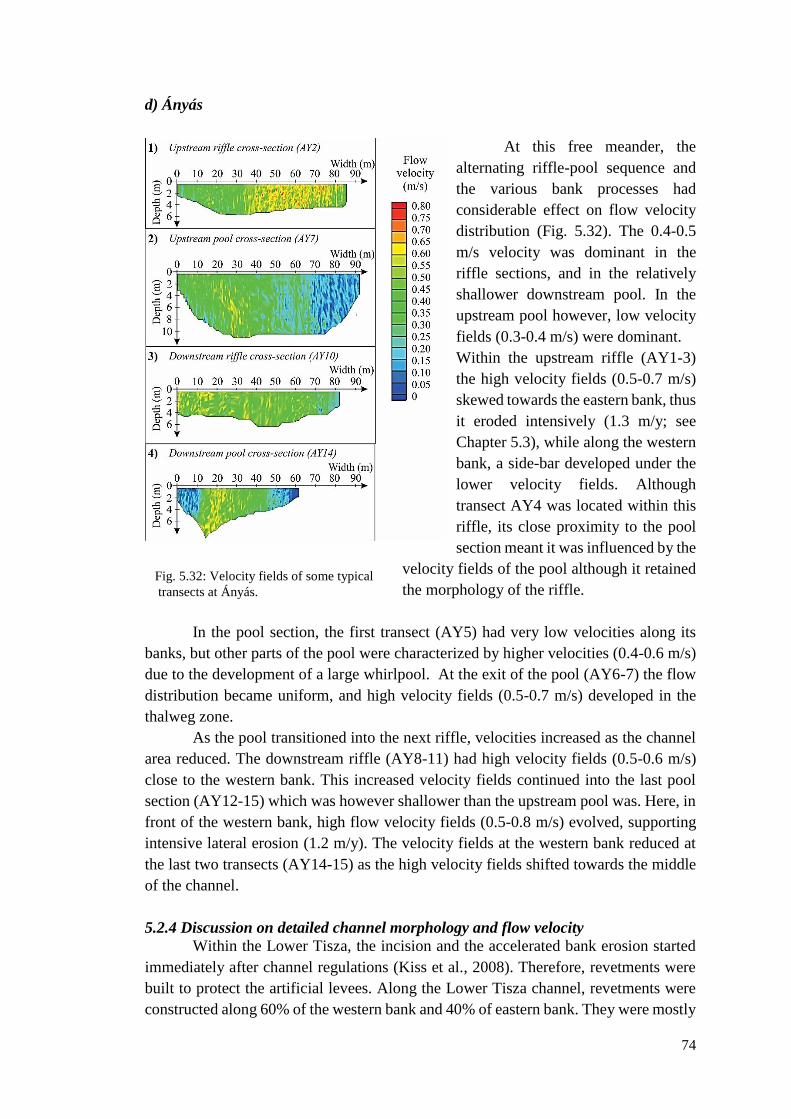
74
d) Ányás
At this free meander, the
alternating riffle-pool sequence and
the various bank processes had
considerable effect on flow velocity
distribution (Fig. 5.32). The 0.4-0.5
m/s velocity was dominant in the
riffle sections, and in the relatively
shallower downstream pool. In the
upstream pool however, low velocity
fields (0.3-0.4 m/s) were dominant.
Within the upstream riffle (AY1-3)
the high velocity fields (0.5-0.7 m/s)
skewed towards the eastern bank, thus
it eroded intensively (1.3 m/y; see
Chapter 5.3), while along the western
bank, a side-bar developed under the
lower velocity fields. Although
transect AY4 was located within this
riffle, its close proximity to the pool
section meant it was influenced by the
velocity fields of the pool although it retained
the morphology of the riffle.
In the pool section, the first transect (AY5) had very low velocities along its
banks, but other parts of the pool were characterized by higher velocities (0.4-0.6 m/s)
due to the development of a large whirlpool. At the exit of the pool (AY6-7) the flow
distribution became uniform, and high velocity fields (0.5-0.7 m/s) developed in the
thalweg zone.
As the pool transitioned into the next riffle, velocities increased as the channel
area reduced. The downstream riffle (AY8-11) had high velocity fields (0.5-0.6 m/s)
close to the western bank. This increased velocity fields continued into the last pool
section (AY12-15) which was however shallower than the upstream pool was. Here, in
front of the western bank, high flow velocity fields (0.5-0.8 m/s) evolved, supporting
intensive lateral erosion (1.2 m/y). The velocity fields at the western bank reduced at
the last two transects (AY14-15) as the high velocity fields shifted towards the middle
of the channel.
5.2.4 Discussion on detailed channel morphology and flow velocity
Within the Lower Tisza, the incision and the accelerated bank erosion started
immediately after channel regulations (Kiss et al., 2008). Therefore, revetments were
built to protect the artificial levees. Along the Lower Tisza channel, revetments were
constructed along 60% of the western bank and 40% of eastern bank. They were mostly
Fig. 5.32: Velocity fields of some typical
transects at Ányás.

75
built before 1960 (82% of revetments). Afterwards, the active bank erosion terminated
or slowed down; and as was presented in Chapter 5.1, on some sections, the channel
became even narrower. However, incision became more intensive as the channel began
to adjust itself to the construction of revetments (Kiss et al., 2008; Amissah et al., 2018).
The density of revetments (mean: 0.50 km/km) however, was not uniform within the
Lower Tisza. The middle and more sinuous reach had a lower revetment density (0.39
km/km). Along this reach, more revetments started to collapse (Kiss et al., 2019)
because the high sinuosity provided favourable conditions for channel adjustments;
thus, the erosion of revetments
Based on the research, it became apparent that several factors contribute to the
collapse of revetment. Primarily, the type of revetment is a significant factor: most of
the collapsed revetments are placed-rock revetments (CN and MT sites), thus, the
incision of the channel can initiate the displacement of the stones one-by-one. On the
contrary, in the revetment with the stepped-block design (within a concrete frame,
stones were placed), it can prevent the erosion of single rocks longer (CS site).
However, for these revetments, the energy of the flow is deflected away from the
revetted bank to the opposite bank, initiating the erosion of point-bars, though low flow
velocities and energy should be characteristic under natural conditions (Klingemann et
al., 1984).
The placed-rock revetments erode in two different ways as indicated by my
conceptual model of bank erosion and revetment collapse in the Lower Tisza (Fig.
5.33). High velocities generated near the revetment along the concave bank accelerates
vertical erosion. Thus, since the regulations, the channel became deeper by 1-2 m
(Amissah et al., 2018). This provides favourable conditions for landslides along longer
revetted sections (as was detected at MT), or the collapse of the stones one-by-one
(observed at CN). In the latter case, the downstream end of placed-rock revetments
erodes first, as a result of the co-existence of the following factors: (1) the thalweg is
skewed close to the revetted bank, (2) the smooth upstream revetment section has
velocity acceleration, thus (3) the flow has higher erodibility. Due to this, although the
revetment protects the bank from lateral erosion, immediately at its end, the flow has
high erosivity, enhancing vertical and lateral channel erosion. Therefore, downstream
of the revetment, failures and slides with high intensity develop on the non-revetted
bank and also, a deep pool is created. However, the erosional front migrates upstream.
Initially, probably because the skewed thalweg increases the size of the pool providing
suitable conditions for collapse of the revetment’s rocks one-by-one. Subsequently, the
rocks fall into the deep pool, allowing intensive lateral erosion of the formerly protected
bank. Based on the longitudinal profile of the channel bottom and the bankline, a knick-
point could be identified: downstream of this knick-point both the vertical and lateral
erosion accelerates creating a small pool at the end of the revetment. This knick-point
propagates upstream, and newer parts of the revetment will collapse until the entire
revetment is destroyed.
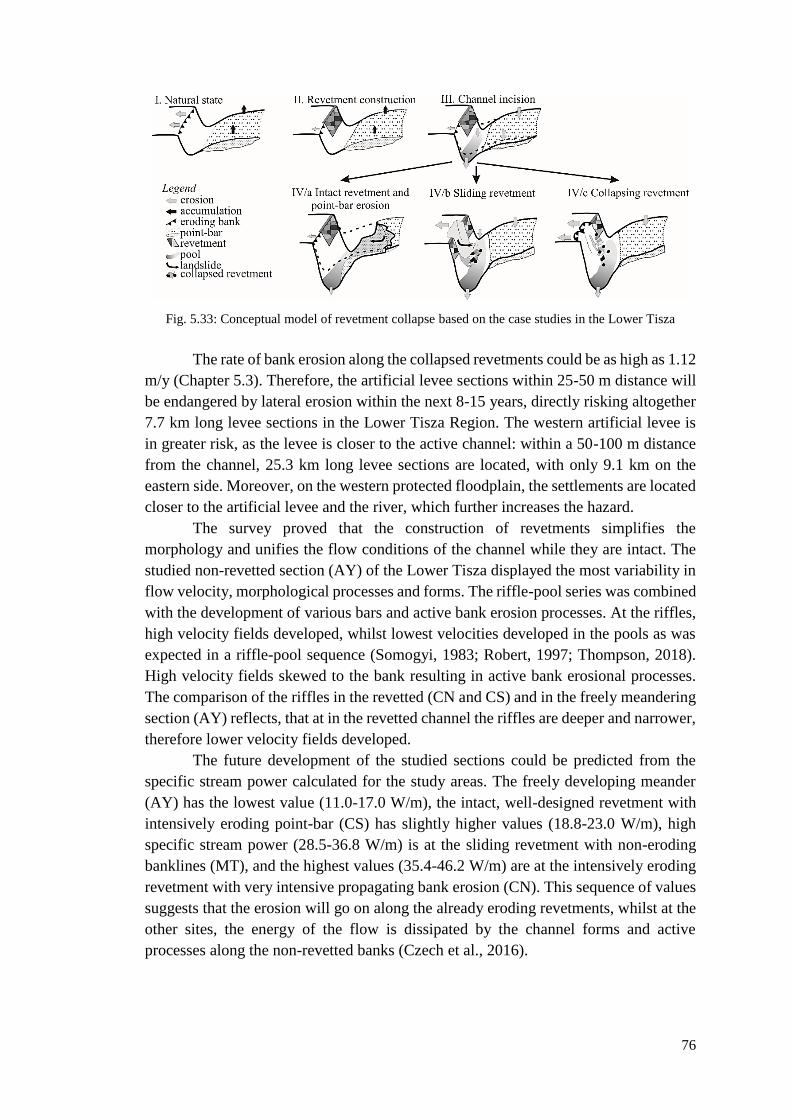
76
Fig. 5.33: Conceptual model of revetment collapse based on the case studies in the Lower Tisza
The rate of bank erosion along the collapsed revetments could be as high as 1.12
m/y (Chapter 5.3). Therefore, the artificial levee sections within 25-50 m distance will
be endangered by lateral erosion within the next 8-15 years, directly risking altogether
7.7 km long levee sections in the Lower Tisza Region. The western artificial levee is
in greater risk, as the levee is closer to the active channel: within a 50-100 m distance
from the channel, 25.3 km long levee sections are located, with only 9.1 km on the
eastern side. Moreover, on the western protected floodplain, the settlements are located
closer to the artificial levee and the river, which further increases the hazard.
The survey proved that the construction of revetments simplifies the
morphology and unifies the flow conditions of the channel while they are intact. The
studied non-revetted section (AY) of the Lower Tisza displayed the most variability in
flow velocity, morphological processes and forms. The riffle-pool series was combined
with the development of various bars and active bank erosion processes. At the riffles,
high velocity fields developed, whilst lowest velocities developed in the pools as was
expected in a riffle-pool sequence (Somogyi, 1983; Robert, 1997; Thompson, 2018).
High velocity fields skewed to the bank resulting in active bank erosional processes.
The comparison of the riffles in the revetted (CN and CS) and in the freely meandering
section (AY) reflects, that at in the revetted channel the riffles are deeper and narrower,
therefore lower velocity fields developed.
The future development of the studied sections could be predicted from the
specific stream power calculated for the study areas. The freely developing meander
(AY) has the lowest value (11.0-17.0 W/m), the intact, well-designed revetment with
intensively eroding point-bar (CS) has slightly higher values (18.8-23.0 W/m), high
specific stream power (28.5-36.8 W/m) is at the sliding revetment with non-eroding
banklines (MT), and the highest values (35.4-46.2 W/m) are at the intensively eroding
revetment with very intensive propagating bank erosion (CN). This sequence of values
suggests that the erosion will go on along the already eroding revetments, whilst at the
other sites, the energy of the flow is dissipated by the channel forms and active
processes along the non-revetted banks (Czech et al., 2016).
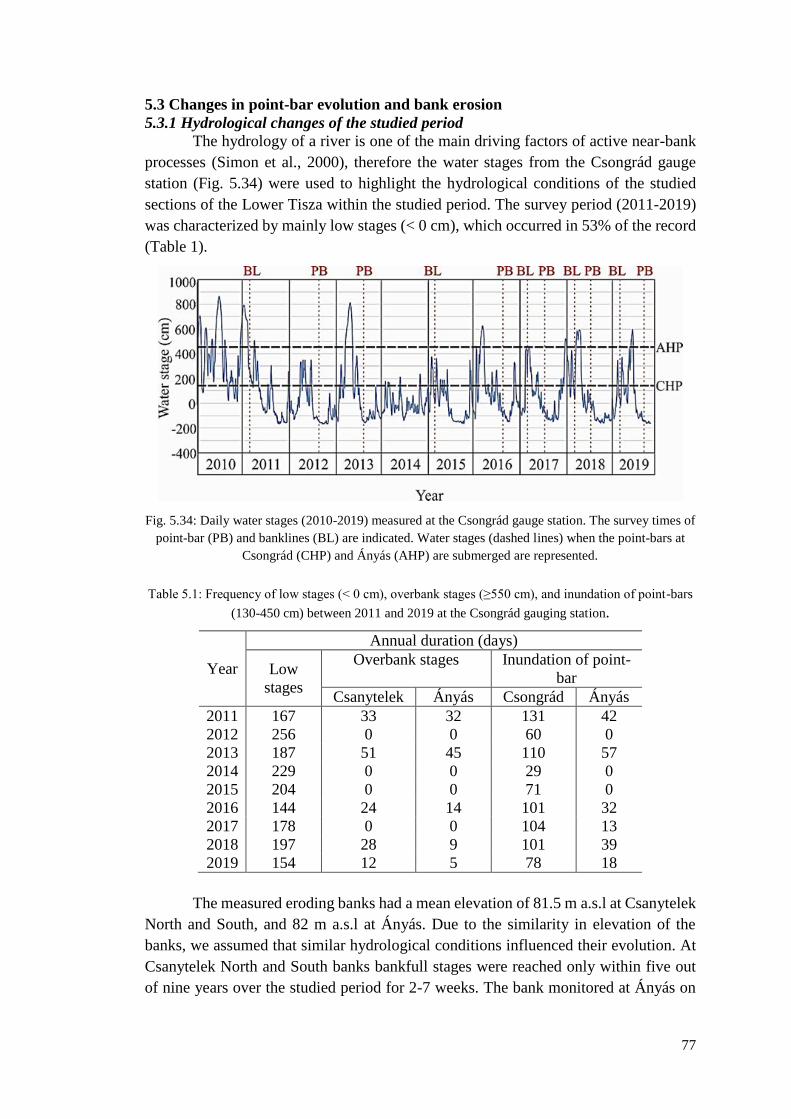
77
5.3 Changes in point-bar evolution and bank erosion
5.3.1 Hydrological changes of the studied period
The hydrology of a river is one of the main driving factors of active near-bank
processes (Simon et al., 2000), therefore the water stages from the Csongrád gauge
station (Fig. 5.34) were used to highlight the hydrological conditions of the studied
sections of the Lower Tisza within the studied period. The survey period (2011-2019)
was characterized by mainly low stages (< 0 cm), which occurred in 53% of the record
(Table 1).
Fig. 5.34: Daily water stages (2010-2019) measured at the Csongrád gauge station. The survey times of
point-bar (PB) and banklines (BL) are indicated. Water stages (dashed lines) when the point-bars at
Csongrád (CHP) and Ányás (AHP) are submerged are represented.
Table 5.1: Frequency of low stages (< 0 cm), overbank stages (≥550 cm), and inundation of point-bars
(130-450 cm) between 2011 and 2019 at the Csongrád gauging station.
Year
Annual duration (days)
Low
stages
Overbank stages Inundation of point-
bar
Csanytelek Ányás Csongrád Ányás
2011 167 33 32 131 42
2012 256 0 0 60 0
2013 187 51 45 110 57
2014 229 0 0 29 0
2015 204 0 0 71 0
2016 144 24 14 101 32
2017 178 0 0 104 13
2018 197 28 9 101 39
2019 154 12 5 78 18
The measured eroding banks had a mean elevation of 81.5 m a.s.l at Csanytelek
North and South, and 82 m a.s.l at Ányás. Due to the similarity in elevation of the
banks, we assumed that similar hydrological conditions influenced their evolution. At
Csanytelek North and South banks bankfull stages were reached only within five out
of nine years over the studied period for 2-7 weeks. The bank monitored at Ányás on
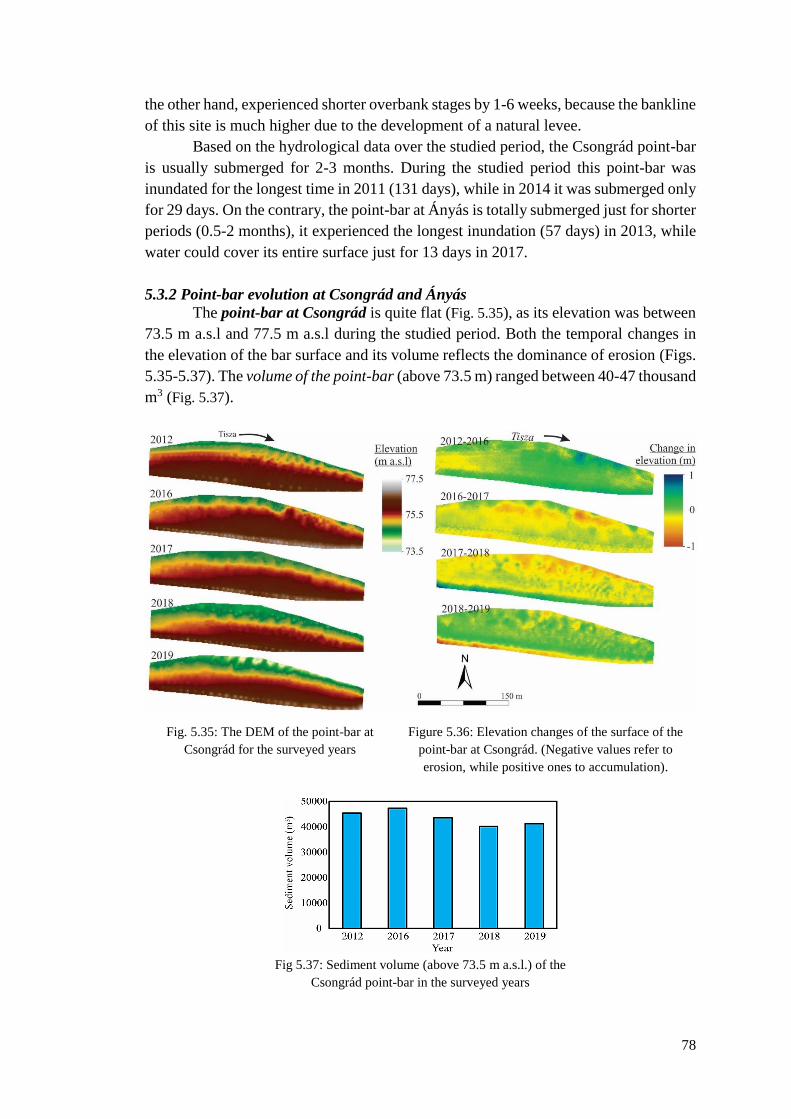
78
the other hand, experienced shorter overbank stages by 1-6 weeks, because the bankline
of this site is much higher due to the development of a natural levee.
Based on the hydrological data over the studied period, the Csongrád point-bar
is usually submerged for 2-3 months. During the studied period this point-bar was
inundated for the longest time in 2011 (131 days), while in 2014 it was submerged only
for 29 days. On the contrary, the point-bar at Ányás is totally submerged just for shorter
periods (0.5-2 months), it experienced the longest inundation (57 days) in 2013, while
water could cover its entire surface just for 13 days in 2017.
5.3.2 Point-bar evolution at Csongrád and Ányás
The point-bar at Csongrád is quite flat (Fig. 5.35), as its elevation was between
73.5 m a.s.l and 77.5 m a.s.l during the studied period. Both the temporal changes in
the elevation of the bar surface and its volume reflects the dominance of erosion (Figs.
5.35-5.37). The volume of the point-bar (above 73.5 m) ranged between 40-47 thousand
m3 (Fig. 5.37).
Fig. 5.35: The DEM of the point-bar at
Csongrád for the surveyed years
Figure 5.36: Elevation changes of the surface of the
point-bar at Csongrád. (Negative values refer to
erosion, while positive ones to accumulation).
Fig 5.37: Sediment volume (above 73.5 m a.s.l.) of the
Csongrád point-bar in the surveyed years
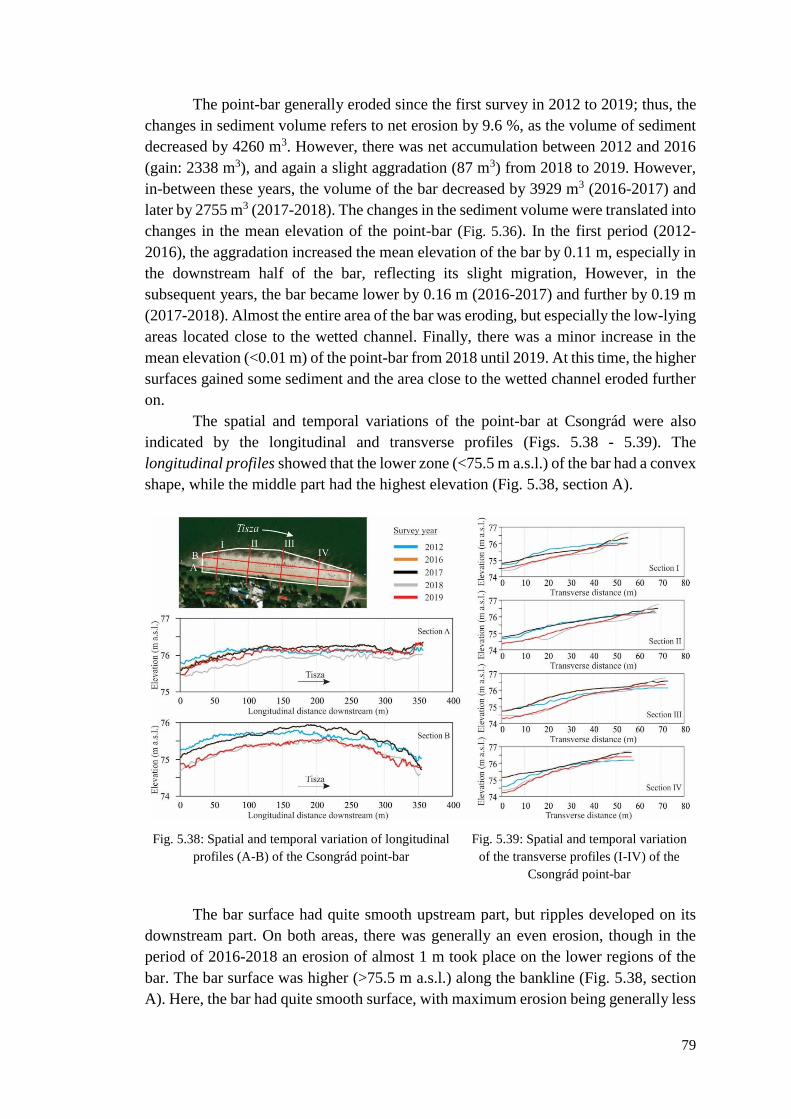
79
The point-bar generally eroded since the first survey in 2012 to 2019; thus, the
changes in sediment volume refers to net erosion by 9.6 %, as the volume of sediment
decreased by 4260 m3. However, there was net accumulation between 2012 and 2016
(gain: 2338 m3), and again a slight aggradation (87 m3) from 2018 to 2019. However,
in-between these years, the volume of the bar decreased by 3929 m3 (2016-2017) and
later by 2755 m3 (2017-2018). The changes in the sediment volume were translated into
changes in the mean elevation of the point-bar (Fig. 5.36). In the first period (2012-
2016), the aggradation increased the mean elevation of the bar by 0.11 m, especially in
the downstream half of the bar, reflecting its slight migration, However, in the
subsequent years, the bar became lower by 0.16 m (2016-2017) and further by 0.19 m
(2017-2018). Almost the entire area of the bar was eroding, but especially the low-lying
areas located close to the wetted channel. Finally, there was a minor increase in the
mean elevation (<0.01 m) of the point-bar from 2018 until 2019. At this time, the higher
surfaces gained some sediment and the area close to the wetted channel eroded further
on.
The spatial and temporal variations of the point-bar at Csongrád were also
indicated by the longitudinal and transverse profiles (Figs. 5.38 - 5.39). The
longitudinal profiles showed that the lower zone (<75.5 m a.s.l.) of the bar had a convex
shape, while the middle part had the highest elevation (Fig. 5.38, section A).
Fig. 5.38: Spatial and temporal variation of longitudinal
profiles (A-B) of the Csongrád point-bar Fig. 5.39: Spatial and temporal variation
of the transverse profiles (I-IV) of the
Csongrád point-bar
The bar surface had quite smooth upstream part, but ripples developed on its
downstream part. On both areas, there was generally an even erosion, though in the
period of 2016-2018 an erosion of almost 1 m took place on the lower regions of the
bar. The bar surface was higher (>75.5 m a.s.l.) along the bankline (Fig. 5.38, section
A). Here, the bar had quite smooth surface, with maximum erosion being generally less
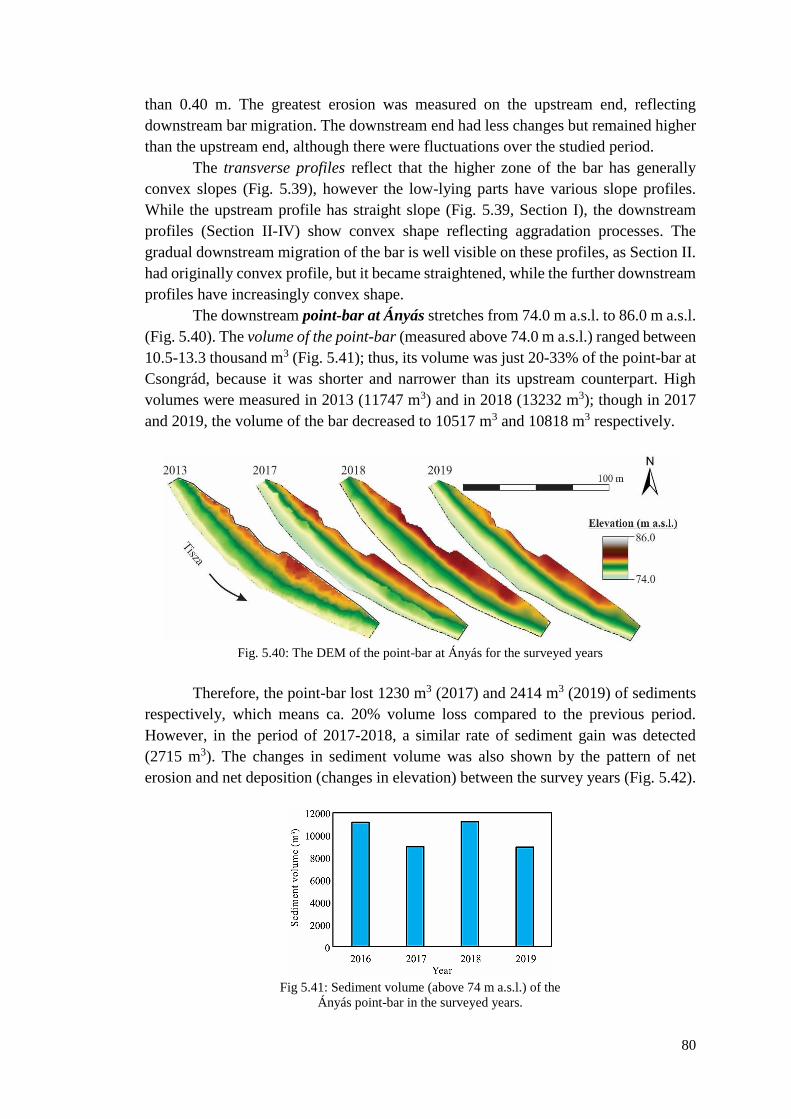
80
than 0.40 m. The greatest erosion was measured on the upstream end, reflecting
downstream bar migration. The downstream end had less changes but remained higher
than the upstream end, although there were fluctuations over the studied period.
The transverse profiles reflect that the higher zone of the bar has generally
convex slopes (Fig. 5.39), however the low-lying parts have various slope profiles.
While the upstream profile has straight slope (Fig. 5.39, Section I), the downstream
profiles (Section II-IV) show convex shape reflecting aggradation processes. The
gradual downstream migration of the bar is well visible on these profiles, as Section II.
had originally convex profile, but it became straightened, while the further downstream
profiles have increasingly convex shape.
The downstream point-bar at Ányás stretches from 74.0 m a.s.l. to 86.0 m a.s.l.
(Fig. 5.40). The volume of the point-bar (measured above 74.0 m a.s.l.) ranged between
10.5-13.3 thousand m3 (Fig. 5.41); thus, its volume was just 20-33% of the point-bar at
Csongrád, because it was shorter and narrower than its upstream counterpart. High
volumes were measured in 2013 (11747 m3) and in 2018 (13232 m3); though in 2017
and 2019, the volume of the bar decreased to 10517 m3 and 10818 m3 respectively.
Fig. 5.40: The DEM of the point-bar at Ányás for the surveyed years
Therefore, the point-bar lost 1230 m3 (2017) and 2414 m3 (2019) of sediments
respectively, which means ca. 20% volume loss compared to the previous period.
However, in the period of 2017-2018, a similar rate of sediment gain was detected
(2715 m3). The changes in sediment volume was also shown by the pattern of net
erosion and net deposition (changes in elevation) between the survey years (Fig. 5.42).
Fig 5.41: Sediment volume (above 74 m a.s.l.) of the
Ányás point-bar in the surveyed years.
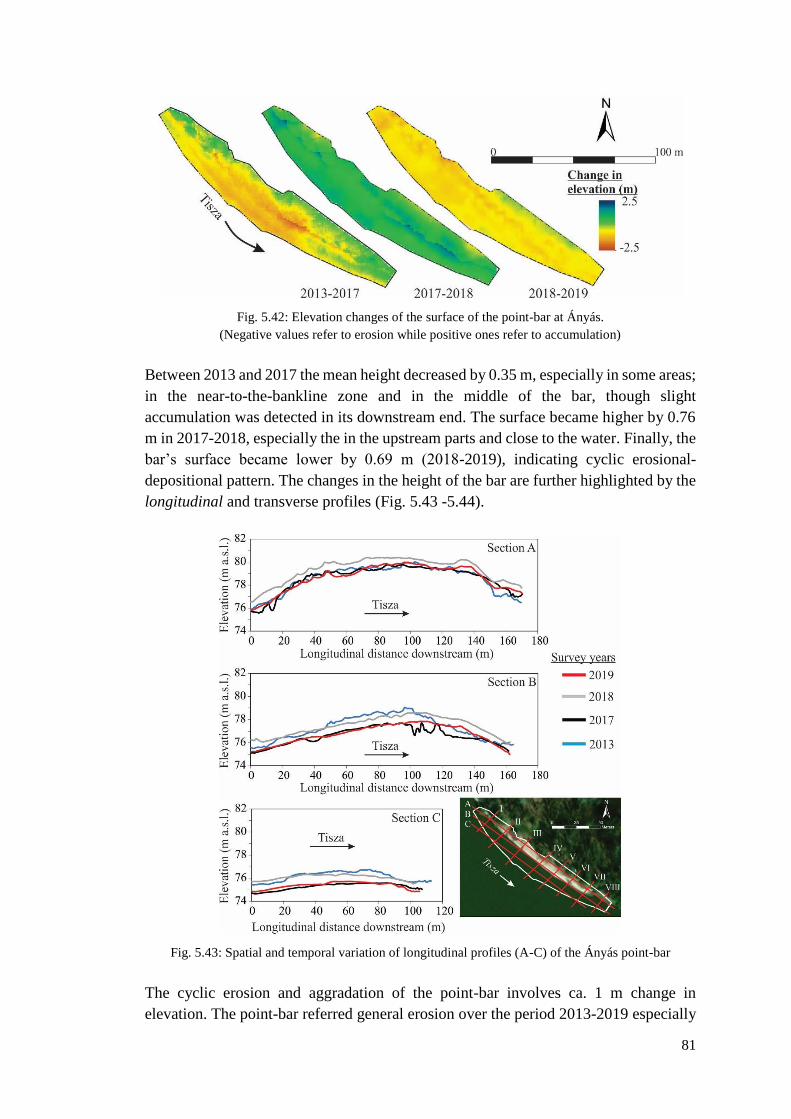
81
Fig. 5.42: Elevation changes of the surface of the point-bar at Ányás.
(Negative values refer to erosion while positive ones refer to accumulation)
Between 2013 and 2017 the mean height decreased by 0.35 m, especially in some areas;
in the near-to-the-bankline zone and in the middle of the bar, though slight
accumulation was detected in its downstream end. The surface became higher by 0.76
m in 2017-2018, especially the in the upstream parts and close to the water. Finally, the
bar’s surface became lower by 0.69 m (2018-2019), indicating cyclic erosional-
depositional pattern. The changes in the height of the bar are further highlighted by the
longitudinal and transverse profiles (Fig. 5.43 -5.44).
Fig. 5.43: Spatial and temporal variation of longitudinal profiles (A-C) of the Ányás point-bar
The cyclic erosion and aggradation of the point-bar involves ca. 1 m change in
elevation. The point-bar referred general erosion over the period 2013-2019 especially

82
in its lower zone (<76 m a.s.l.), having a gradual downstream shift in the highest point
of the zone (Fig 5.43: section C). The middle zone (76-78 m a.s.l.) is also characterized
by erosion, however there was a slight net aggradation at the downstream end of the
bar, and its higher central region also migrated downstream (Fig 5.43: section B). The
upper surfaces (>78 m a.s.l.) had aggradation at both the downstream and upstream
ends of the point-bar (Fig 5.43: section A).
The transverse profiles reflect deposition on the downstream ends of the point-
bar even more visibly (Fig. 5.44). The upstream profiles (I-IV) had very characteristic
concave slopes on the middle zone of the bar, especially at the time of the first survey
(2012). Later this area started to accumulate, thus straight slopes evolved, though the
highest zone still faced erosion. Later (2017-2018), although there was aggradation
over the whole point-bar, the highest gains were at the upstream end, and in the lower
zone of the bar. Erosion again characterized the period 2018-2019 but more uniformly
than the period 2013-2017. The downstream transverse profiles (V-VIII) had mainly
straight slopes, however they turned into convex ones until 2019, referring to
accumulation after an erosional period. Nowadays (2019), the lower zone has a mix of
concave and convex profiles, while the higher elevations have straight or convex ones,
referring to erosion in the lower zone and accumulation in the upper one.
Fig. 5.44: Spatial and temporal variation of the transverse profiles (I-VIII) of the Ányás point-bar

83
5.3.3 Bank erosion at Csanytelek and Ányás
The bank erosion of the monitored sections of the Lower Tisza River differed
both in extent and magnitude (Fig 5.45). The bankline experienced minimal erosion
(within measurement errors) at Csanytelek South because of the existence of a
revetment; but, there was a medium erosion rate at Csanytelek North (mean: 0.79 m/y),
and a high bank retreat was measured at the freely meandering Ányás bend (mean: 1.29
m/y).
The erosion rates at Csanytelek North and Ányás differed both in magnitude
and temporality (Fig. 5.45-5.46). The erosion rate gradually increased at Csanytelek
North; thus, compared to the first period (2015-2017) when the mean erosion rate was
0.56 m/y, it doubled to 1.12 m/y in 2018-2019. The erosion rate (0.67 m/y) in the
intermediate period (2017-2018) showed only a slight increase (ca. 20%) compared to
the first period. At Ányás, the bank erosion rate had an inverse trend. Between 2011
and 2013 the bank eroded by a high rate (2.75 m/y), the next period (2013-2018) was
characterized by 82% reduction in the rate to 0.51 m/y. Between 2018 and 2019
however, there was a 20% increase in the rate (0.61 m/y).
Spatially, the erosion rate was quite uniform both at Csanytelek North and
Ányás, though some sections were more affected by erosion (E1-4) than the others (Fig
5.45). Intense erosion (1.2 m/y) at Csanytelek North occurred at two locations. At E1,
bank erosion was initiated by the collapse of the downstream end of the placed-rock
revetment. The exposed and steep (ca. 30o) bank then failed through bank scouring, and
a mix of failure and slips. At E2, the bank is gentler (ca. 20o) and erosion takes place
in the form of scouring and creeping.
At Ányás bend also, the downstream section (E3 and E4) of the monitored bank
had intense erosion (2.4 m/y). Here the bank was steeper (ca. 50o) and the bank failed
mainly through slips with trees on the slumped material. In the steepest locations
toppling failure occurred with fallen trees which collapsed into the channel with the
bank material.
Fig. 5.45: Changes in banklines at the monitored river sections
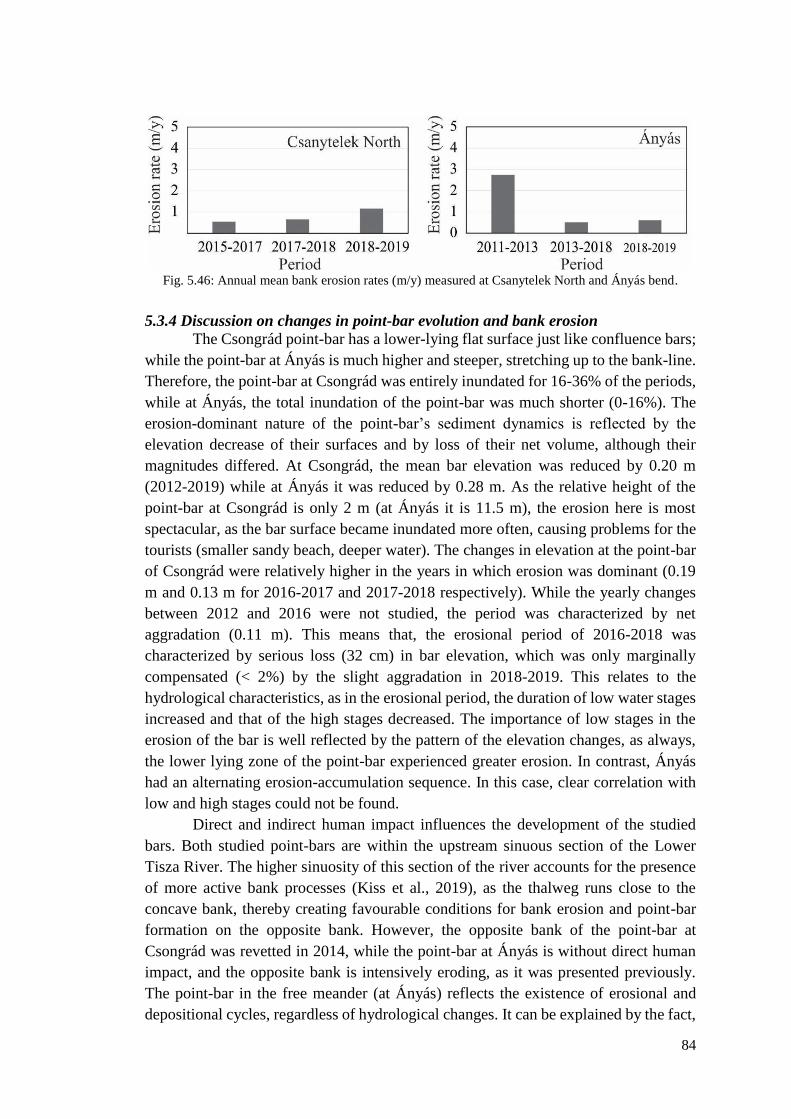
84
Fig. 5.46: Annual mean bank erosion rates (m/y) measured at Csanytelek North and Ányás bend.
5.3.4 Discussion on changes in point-bar evolution and bank erosion
The Csongrád point-bar has a lower-lying flat surface just like confluence bars;
while the point-bar at Ányás is much higher and steeper, stretching up to the bank-line.
Therefore, the point-bar at Csongrád was entirely inundated for 16-36% of the periods,
while at Ányás, the total inundation of the point-bar was much shorter (0-16%). The
erosion-dominant nature of the point-bar’s sediment dynamics is reflected by the
elevation decrease of their surfaces and by loss of their net volume, although their
magnitudes differed. At Csongrád, the mean bar elevation was reduced by 0.20 m
(2012-2019) while at Ányás it was reduced by 0.28 m. As the relative height of the
point-bar at Csongrád is only 2 m (at Ányás it is 11.5 m), the erosion here is most
spectacular, as the bar surface became inundated more often, causing problems for the
tourists (smaller sandy beach, deeper water). The changes in elevation at the point-bar
of Csongrád were relatively higher in the years in which erosion was dominant (0.19
m and 0.13 m for 2016-2017 and 2017-2018 respectively). While the yearly changes
between 2012 and 2016 were not studied, the period was characterized by net
aggradation (0.11 m). This means that, the erosional period of 2016-2018 was
characterized by serious loss (32 cm) in bar elevation, which was only marginally
compensated (< 2%) by the slight aggradation in 2018-2019. This relates to the
hydrological characteristics, as in the erosional period, the duration of low water stages
increased and that of the high stages decreased. The importance of low stages in the
erosion of the bar is well reflected by the pattern of the elevation changes, as always,
the lower lying zone of the point-bar experienced greater erosion. In contrast, Ányás
had an alternating erosion-accumulation sequence. In this case, clear correlation with
low and high stages could not be found.
Direct and indirect human impact influences the development of the studied
bars. Both studied point-bars are within the upstream sinuous section of the Lower
Tisza River. The higher sinuosity of this section of the river accounts for the presence
of more active bank processes (Kiss et al., 2019), as the thalweg runs close to the
concave bank, thereby creating favourable conditions for bank erosion and point-bar
formation on the opposite bank. However, the opposite bank of the point-bar at
Csongrád was revetted in 2014, while the point-bar at Ányás is without direct human
impact, and the opposite bank is intensively eroding, as it was presented previously.
The point-bar in the free meander (at Ányás) reflects the existence of erosional and
depositional cycles, regardless of hydrological changes. It can be explained by the fact,
85
that the erosion of the concave bank created favourable conditions (wide channel) for
the development of the bar on the convex bank which translates and migrates
downstream. On the contrary, at the revetted section at Csongrád, the point-bar
develops in a confined channel, which is characterized by incision (Amissah et al.,
2017, 2018). This incision also affects the point-bar’s surface, lowering it, though
smaller in-channel flood waves might deposit some material on the surface. At
Csongrád, the river was heavily constrained by cut-offs and bank stabilization, which
began in the late 19th century. The construction of revetment along the concave bank
close to the confluence with the Körös River and the presence of the confluence seem
to have affected the morphodynamics of this river section. With river confluences
known to be geomorphological nodes which play an important role in the river’s
morphological evolution (Dixon et al., 2018), it may have contributed to the sediment
dynamics both on the bar and downstream of the bar thus, distorting the natural
evolution of the point-bar.
The bank erosion at Csanytelek North and Ányás were different, although they
had similar hydrological conditions. The two sites had comparable bankfull stages both
in magnitude and their durations. The bank erosion rate at Csanytelek North increased
from 2013 to 2019, although the stages did not commensurate with it. This suggests
that the processes of erosion within this section was not necessarily controlled only by
the hydrological regime, although according to Hickin (1974) floods control most
channel forming processes including bank erosion. The erosion within this section was
probably controlled by high flow energy generated from high velocities due to the
revetment, which was even distinguishable at low stage (Chapter 5.2, Kiss et al., 2019).
This increased flow energy was transferred to the downstream end of the revetted
section where it was dissipated. It seems, that at Csanytelek North, the moderate stages
were more suited to the erosion of the revetment and subsequent lateral erosion. As
highlighted by Luppi et al. (2009), as moderate flow is a conducive hydrologic
condition for this type of failure, the annual rates of erosion at Csanytelek North
increased over the period 2015-2019, as greater and greater proportions of the
revetment became mobilized.
At Ányás, the high and near-vertical banks failed mainly through circular slips
and toppling failure (Kiss et al., 2019). This is usually through saturation of the bank
material which lowers its angle of repose, and eventually failing through slip failure
and toppling (Department of Natural Resources and Water, 2006). This mode of
collapse was mostly accelerated with bankfull stages. High water stages therefore
create perfect conditions for the initiation of failure in these high vertical banks as
indicated by Luppi et al. (2009). The yearly rates of erosion decreased from 2011 to
2019 probably as a response to the reduction in the bankfull stages which occurred
within the period. In spite of this, medium stages still created favourable conditions for
the erosion through scouring of the toe of the banks, and eventually the bank collapsing
into the channel. That notwithstanding, the absence of the bankfull stages affected the
magnitudes of the erosion.
The human impacts at the three study areas are quite different. Although the
western bank of the sections of the Lower Tisza at Csanytelek North and Csanytelek
86
South are both revetted, the results indicated erosion at Csanytelek North while
virtually no bank erosion was recorded at Csanytelek South. This indicates differences
in the effectiveness of the bank stabilization at the two revetted sections. As indicated
by the conceptual model of bank erosion and revetment collapse in the Lower Tisza
River (Chapter 5.2, Kiss et al., 2019), the construction of revetments along the banks
of the Lower Tisza River increased flow velocities and as a result, high erosivity of
flow. At Csanytelek South, the stepped-block revetment design deflected the flow
energy resulting in no bank erosion. This was not the case at Csanytelek North however.
The high erosivity initiated the collapse of the individual stones at the end of the placed-
rock revetment within this river section. This collapse enhanced the lateral and vertical
erosion of the exposed river bank with a new of the revetment formed. The process is
repeated at the new end with an upstream propagation. While this process takes place,
lateral and vertical erosion of the initial ends also continue thereby creating a three-
dimensional erosional front: lateral (into floodplain towards levees), vertical (incision
into channel bed thereby creating a local scour, and forming a pool together with the
lateral erosion); and longitudinal (in the upstream direction, enhanced by the pool
formed and eroding the revetment further). Although the construction of the revetment
transferred stream power to the downstream end of the revetted sections, the placed-
rock revetment at Csanytelek North failed due to the possibility of the rocks of the
revetment to be eroded one by one. Currently, the bank erodes by 0.79 m/y in average
(max 1.16 m/y). As the artificial levee is just 25-50 m distance from the eroding bank,
it will be vulnerable in 20-40 years. Previous studies however suggested as high as 3-6
m/y erosion rates at banks with collapsed revetment along the Lower Tisza, making
artificial levees vulnerable within just 8-15 years (Kiss et al., 2013, 2019). Downstream
of the collapsed revetment, erosion was initiated by the increased flow velocities. The
erosional processes within this section was mainly through direct corrosion which is
controlled mainly by the flow conditions (Hooke, 1979).
The meander at Ányás is without direct human impact, thus, the process of bank
erosion is different. With high and steep banks on the concave outer bank, circular slips
are mainly responsible for the great erosion rate (1.29 m/y in average, max 2.75 m/y).
The high banks with the steep slopes (ca. 50°) create the necessary conditions for the
slips and toppling into the channel. This is mainly through thalweg incision as a result
of the channel response to the various human interventions in the Lower Tisza (Chapter
5.1; Amissah et al., 2017), thus, though this study area is not directly influenced by
human impact, the propagating effects of the engineering works influence the processes
here as well. The high erosion rates create failure blocks and slump debris in front of
the eroding bank. The high flow velocities and the local turbulence are responsible for
the erosion of sediment slump debris (Thorne, 1991). Thus, at low stages, the energy
of the flow attacks the slumped material to satisfy the sediment transport capacity of
the river. This reduces the actual energy available for bank and bed corrasion thereby
reducing bank and bed erosion rates.
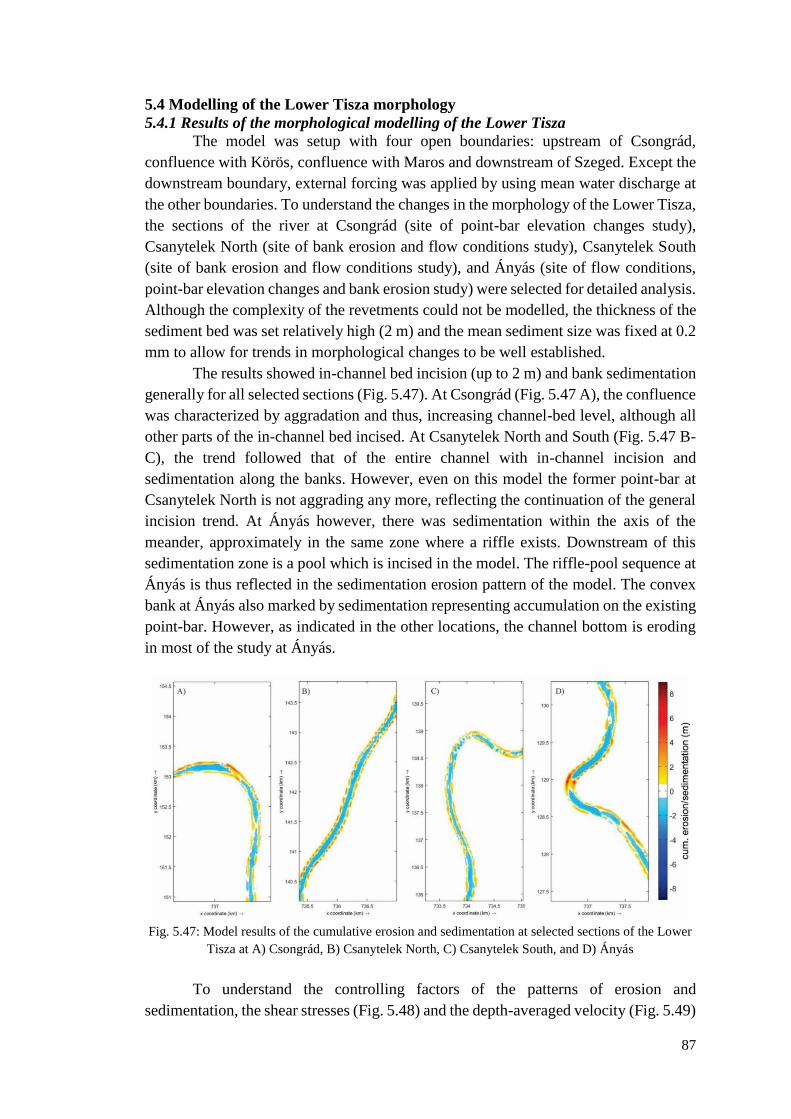
87
5.4 Modelling of the Lower Tisza morphology
5.4.1 Results of the morphological modelling of the Lower Tisza
The model was setup with four open boundaries: upstream of Csongrád,
confluence with Körös, confluence with Maros and downstream of Szeged. Except the
downstream boundary, external forcing was applied by using mean water discharge at
the other boundaries. To understand the changes in the morphology of the Lower Tisza,
the sections of the river at Csongrád (site of point-bar elevation changes study),
Csanytelek North (site of bank erosion and flow conditions study), Csanytelek South
(site of bank erosion and flow conditions study), and Ányás (site of flow conditions,
point-bar elevation changes and bank erosion study) were selected for detailed analysis.
Although the complexity of the revetments could not be modelled, the thickness of the
sediment bed was set relatively high (2 m) and the mean sediment size was fixed at 0.2
mm to allow for trends in morphological changes to be well established.
The results showed in-channel bed incision (up to 2 m) and bank sedimentation
generally for all selected sections (Fig. 5.47). At Csongrád (Fig. 5.47 A), the confluence
was characterized by aggradation and thus, increasing channel-bed level, although all
other parts of the in-channel bed incised. At Csanytelek North and South (Fig. 5.47 B-
C), the trend followed that of the entire channel with in-channel incision and
sedimentation along the banks. However, even on this model the former point-bar at
Csanytelek North is not aggrading any more, reflecting the continuation of the general
incision trend. At Ányás however, there was sedimentation within the axis of the
meander, approximately in the same zone where a riffle exists. Downstream of this
sedimentation zone is a pool which is incised in the model. The riffle-pool sequence at
Ányás is thus reflected in the sedimentation erosion pattern of the model. The convex
bank at Ányás also marked by sedimentation representing accumulation on the existing
point-bar. However, as indicated in the other locations, the channel bottom is eroding
in most of the study at Ányás.
Fig. 5.47: Model results of the cumulative erosion and sedimentation at selected sections of the Lower
Tisza at A) Csongrád, B) Csanytelek North, C) Csanytelek South, and D) Ányás
To understand the controlling factors of the patterns of erosion and
sedimentation, the shear stresses (Fig. 5.48) and the depth-averaged velocity (Fig. 5.49)
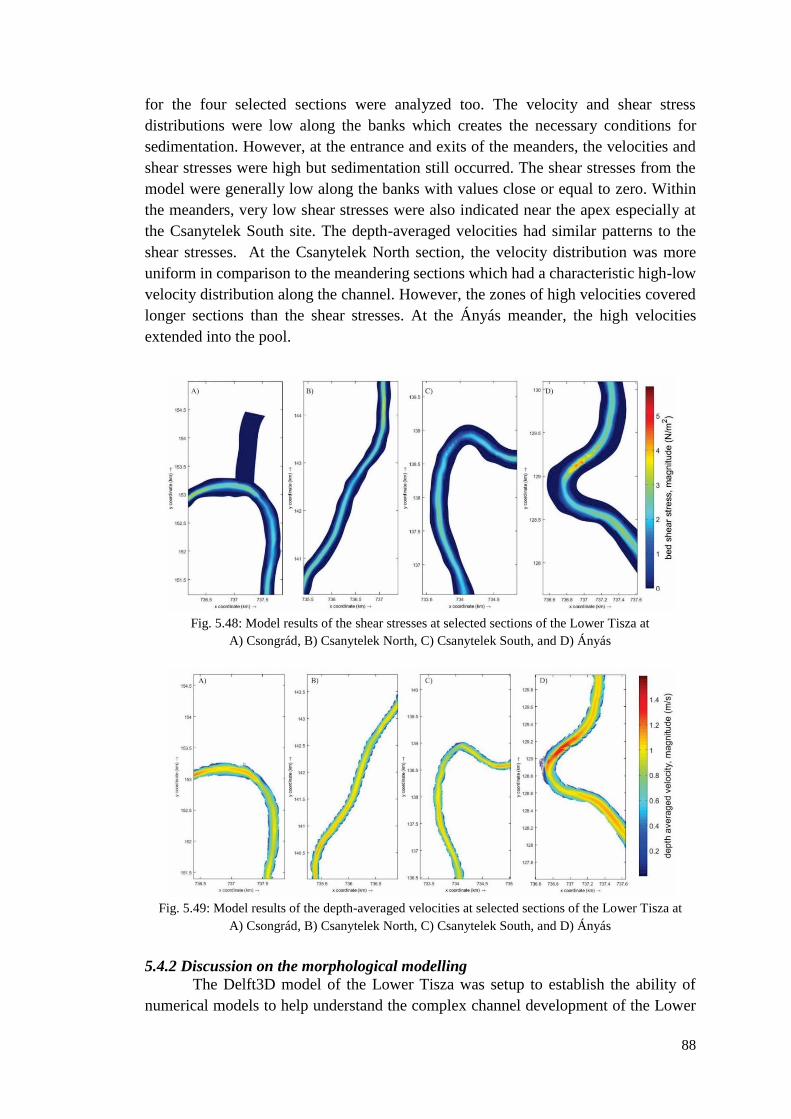
88
for the four selected sections were analyzed too. The velocity and shear stress
distributions were low along the banks which creates the necessary conditions for
sedimentation. However, at the entrance and exits of the meanders, the velocities and
shear stresses were high but sedimentation still occurred. The shear stresses from the
model were generally low along the banks with values close or equal to zero. Within
the meanders, very low shear stresses were also indicated near the apex especially at
the Csanytelek South site. The depth-averaged velocities had similar patterns to the
shear stresses. At the Csanytelek North section, the velocity distribution was more
uniform in comparison to the meandering sections which had a characteristic high-low
velocity distribution along the channel. However, the zones of high velocities covered
longer sections than the shear stresses. At the Ányás meander, the high velocities
extended into the pool.
Fig. 5.48: Model results of the shear stresses at selected sections of the Lower Tisza at
A) Csongrád, B) Csanytelek North, C) Csanytelek South, and D) Ányás
Fig. 5.49: Model results of the depth-averaged velocities at selected sections of the Lower Tisza at
A) Csongrád, B) Csanytelek North, C) Csanytelek South, and D) Ányás
5.4.2 Discussion on the morphological modelling
The Delft3D model of the Lower Tisza was setup to establish the ability of
numerical models to help understand the complex channel development of the Lower
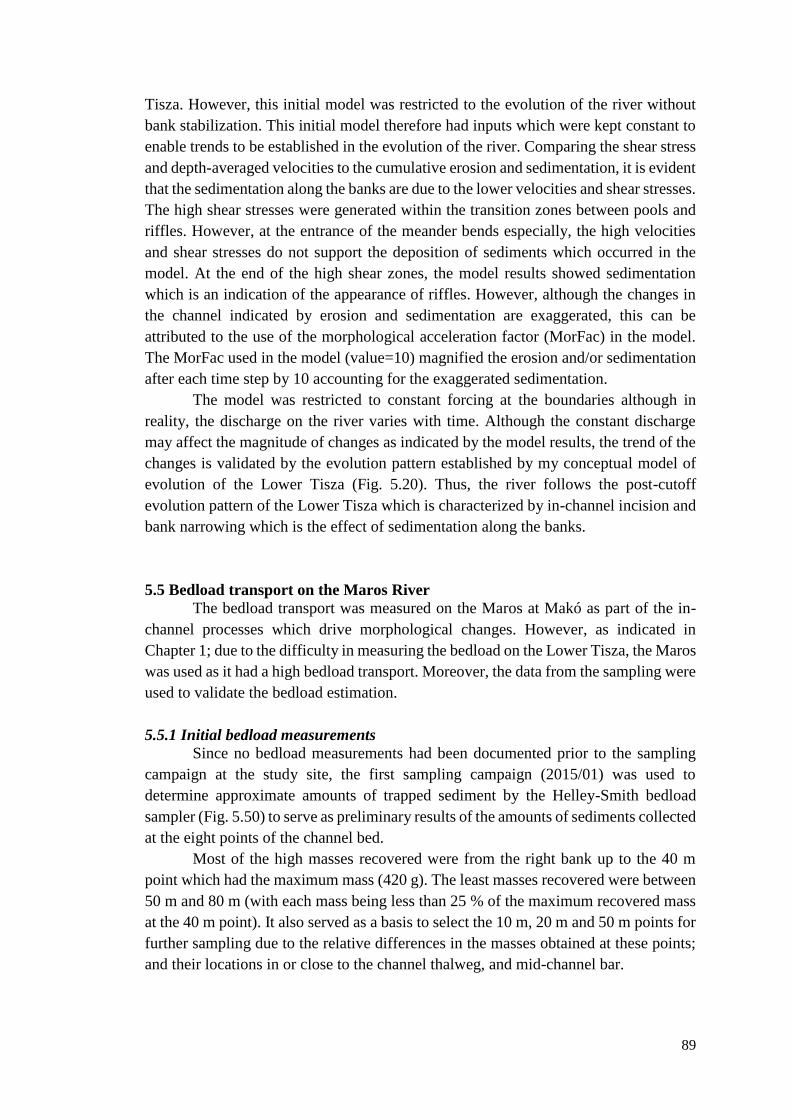
89
Tisza. However, this initial model was restricted to the evolution of the river without
bank stabilization. This initial model therefore had inputs which were kept constant to
enable trends to be established in the evolution of the river. Comparing the shear stress
and depth-averaged velocities to the cumulative erosion and sedimentation, it is evident
that the sedimentation along the banks are due to the lower velocities and shear stresses.
The high shear stresses were generated within the transition zones between pools and
riffles. However, at the entrance of the meander bends especially, the high velocities
and shear stresses do not support the deposition of sediments which occurred in the
model. At the end of the high shear zones, the model results showed sedimentation
which is an indication of the appearance of riffles. However, although the changes in
the channel indicated by erosion and sedimentation are exaggerated, this can be
attributed to the use of the morphological acceleration factor (MorFac) in the model.
The MorFac used in the model (value=10) magnified the erosion and/or sedimentation
after each time step by 10 accounting for the exaggerated sedimentation.
The model was restricted to constant forcing at the boundaries although in
reality, the discharge on the river varies with time. Although the constant discharge
may affect the magnitude of changes as indicated by the model results, the trend of the
changes is validated by the evolution pattern established by my conceptual model of
evolution of the Lower Tisza (Fig. 5.20). Thus, the river follows the post-cutoff
evolution pattern of the Lower Tisza which is characterized by in-channel incision and
bank narrowing which is the effect of sedimentation along the banks.
5.5 Bedload transport on the Maros River
The bedload transport was measured on the Maros at Makó as part of the in-
channel processes which drive morphological changes. However, as indicated in
Chapter 1; due to the difficulty in measuring the bedload on the Lower Tisza, the Maros
was used as it had a high bedload transport. Moreover, the data from the sampling were
used to validate the bedload estimation.
5.5.1 Initial bedload measurements
Since no bedload measurements had been documented prior to the sampling
campaign at the study site, the first sampling campaign (2015/01) was used to
determine approximate amounts of trapped sediment by the Helley-Smith bedload
sampler (Fig. 5.50) to serve as preliminary results of the amounts of sediments collected
at the eight points of the channel bed.
Most of the high masses recovered were from the right bank up to the 40 m
point which had the maximum mass (420 g). The least masses recovered were between
50 m and 80 m (with each mass being less than 25 % of the maximum recovered mass
at the 40 m point). It also served as a basis to select the 10 m, 20 m and 50 m points for
further sampling due to the relative differences in the masses obtained at these points;
and their locations in or close to the channel thalweg, and mid-channel bar.
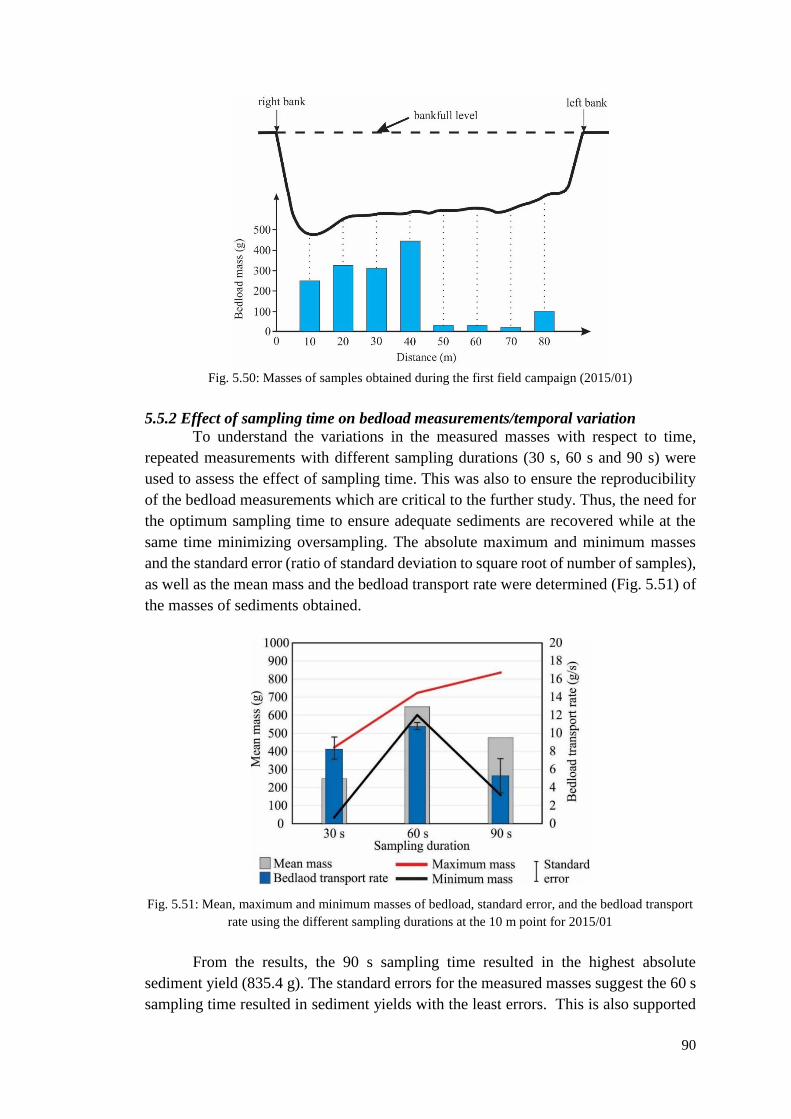
90
Fig. 5.50: Masses of samples obtained during the first field campaign (2015/01)
5.5.2 Effect of sampling time on bedload measurements/temporal variation
To understand the variations in the measured masses with respect to time,
repeated measurements with different sampling durations (30 s, 60 s and 90 s) were
used to assess the effect of sampling time. This was also to ensure the reproducibility
of the bedload measurements which are critical to the further study. Thus, the need for
the optimum sampling time to ensure adequate sediments are recovered while at the
same time minimizing oversampling. The absolute maximum and minimum masses
and the standard error (ratio of standard deviation to square root of number of samples),
as well as the mean mass and the bedload transport rate were determined (Fig. 5.51) of
the masses of sediments obtained.
Fig. 5.51: Mean, maximum and minimum masses of bedload, standard error, and the bedload transport
rate using the different sampling durations at the 10 m point for 2015/01
From the results, the 90 s sampling time resulted in the highest absolute
sediment yield (835.4 g). The standard errors for the measured masses suggest the 60 s
sampling time resulted in sediment yields with the least errors. This is also supported
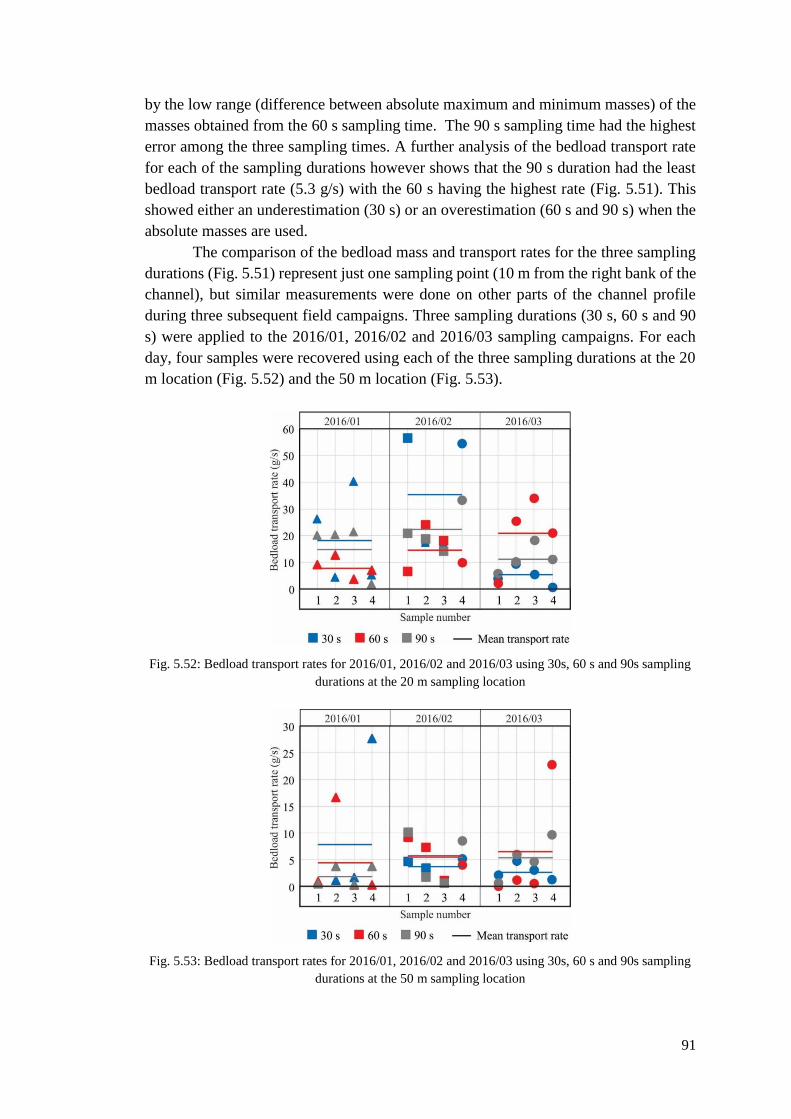
91
by the low range (difference between absolute maximum and minimum masses) of the
masses obtained from the 60 s sampling time. The 90 s sampling time had the highest
error among the three sampling times. A further analysis of the bedload transport rate
for each of the sampling durations however shows that the 90 s duration had the least
bedload transport rate (5.3 g/s) with the 60 s having the highest rate (Fig. 5.51). This
showed either an underestimation (30 s) or an overestimation (60 s and 90 s) when the
absolute masses are used.
The comparison of the bedload mass and transport rates for the three sampling
durations (Fig. 5.51) represent just one sampling point (10 m from the right bank of the
channel), but similar measurements were done on other parts of the channel profile
during three subsequent field campaigns. Three sampling durations (30 s, 60 s and 90
s) were applied to the 2016/01, 2016/02 and 2016/03 sampling campaigns. For each
day, four samples were recovered using each of the three sampling durations at the 20
m location (Fig. 5.52) and the 50 m location (Fig. 5.53).
Fig. 5.52: Bedload transport rates for 2016/01, 2016/02 and 2016/03 using 30s, 60 s and 90s sampling
durations at the 20 m sampling location
Fig. 5.53: Bedload transport rates for 2016/01, 2016/02 and 2016/03 using 30s, 60 s and 90s sampling
durations at the 50 m sampling location
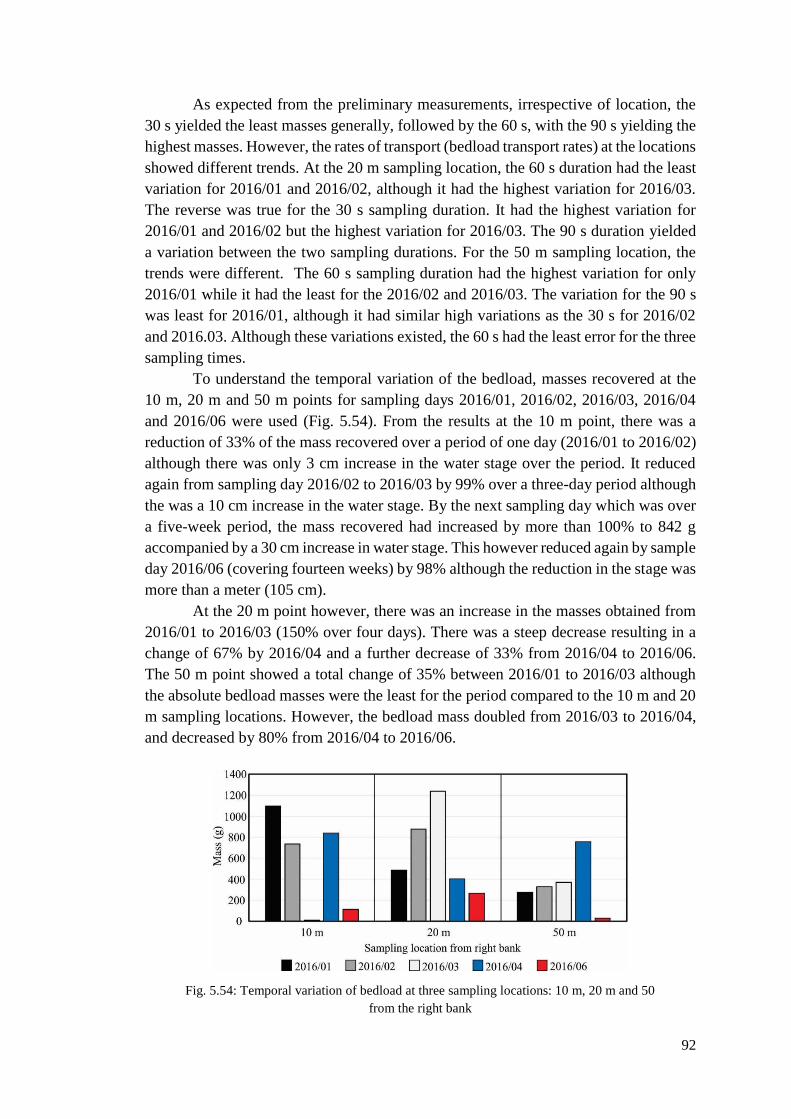
92
As expected from the preliminary measurements, irrespective of location, the
30 s yielded the least masses generally, followed by the 60 s, with the 90 s yielding the
highest masses. However, the rates of transport (bedload transport rates) at the locations
showed different trends. At the 20 m sampling location, the 60 s duration had the least
variation for 2016/01 and 2016/02, although it had the highest variation for 2016/03.
The reverse was true for the 30 s sampling duration. It had the highest variation for
2016/01 and 2016/02 but the highest variation for 2016/03. The 90 s duration yielded
a variation between the two sampling durations. For the 50 m sampling location, the
trends were different. The 60 s sampling duration had the highest variation for only
2016/01 while it had the least for the 2016/02 and 2016/03. The variation for the 90 s
was least for 2016/01, although it had similar high variations as the 30 s for 2016/02
and 2016.03. Although these variations existed, the 60 s had the least error for the three
sampling times.
To understand the temporal variation of the bedload, masses recovered at the
10 m, 20 m and 50 m points for sampling days 2016/01, 2016/02, 2016/03, 2016/04
and 2016/06 were used (Fig. 5.54). From the results at the 10 m point, there was a
reduction of 33% of the mass recovered over a period of one day (2016/01 to 2016/02)
although there was only 3 cm increase in the water stage over the period. It reduced
again from sampling day 2016/02 to 2016/03 by 99% over a three-day period although
the was a 10 cm increase in the water stage. By the next sampling day which was over
a five-week period, the mass recovered had increased by more than 100% to 842 g
accompanied by a 30 cm increase in water stage. This however reduced again by sample
day 2016/06 (covering fourteen weeks) by 98% although the reduction in the stage was
more than a meter (105 cm).
At the 20 m point however, there was an increase in the masses obtained from
2016/01 to 2016/03 (150% over four days). There was a steep decrease resulting in a
change of 67% by 2016/04 and a further decrease of 33% from 2016/04 to 2016/06.
The 50 m point showed a total change of 35% between 2016/01 to 2016/03 although
the absolute bedload masses were the least for the period compared to the 10 m and 20
m sampling locations. However, the bedload mass doubled from 2016/03 to 2016/04,
and decreased by 80% from 2016/04 to 2016/06.
Fig. 5.54: Temporal variation of bedload at three sampling locations: 10 m, 20 m and 50
from the right bank

93
5.5.3 Channel morphology and spatial variation of bedload yield
The influence of channel morphology on bedload transport was also studied in
detail. In sand-bedded rivers like the Maros, the cross-section can change quite rapidly,
as it was observed during the same sampling day or between the different sampling
days. The mobility of the channel bed is well represented by two separate runs within
the same day. For example, during sampling day 2016/06, along most of the cross-
section, the bed level changed in less than an hour of measurement. The bed elevation
had changed by ca.10 cm on the mid-channel bars (approximately at 40 m, 50 m and
60 m points), and up to 30 cm on the lateral bar approximately at the 70 m and 80 m
points (Fig. 5.55). The changes in the bed within the same sampling day refer to ripple
mark and sand-bar migration, though the shape of the channel bed and the location of
thalweg remained the same. In between sampling days, maximum changes of up to 50
cm occurred at the thalweg position, 10-40 cm on the mid-channel bars and 60-90 cm
on the lateral bars.as indicated by the surveys for 2016/01, 2016/03 and 2016/06 (Fig.
5.56), the river bed aggraded by 0.5 m in average, although its maximum was more
than 1 m at some locations (from 80 m from the bankline).
Fig. 5.55: Changes in channel bed topography at the gauging station within a day (2016/06)
Fig. 5.56: Mean depth of studied river bed for 2016/01, 2016/03 and 2016/06
showing the changes in the bed in between surveys
The daily and long-term channel bed variations influence the spatial variation
of masses collected by the bedload sampler across the section. To present the spatial
changes the results of 2016/04 sampling campaign were used, when up to seven
samples at each sampling points were collected applying the 60 s sampling time (Fig.
5.57). Although the 20 m sampling point was expected to have a high sediment yield
based on previous sampling campaigns, the bedload transport had a relatively low yield
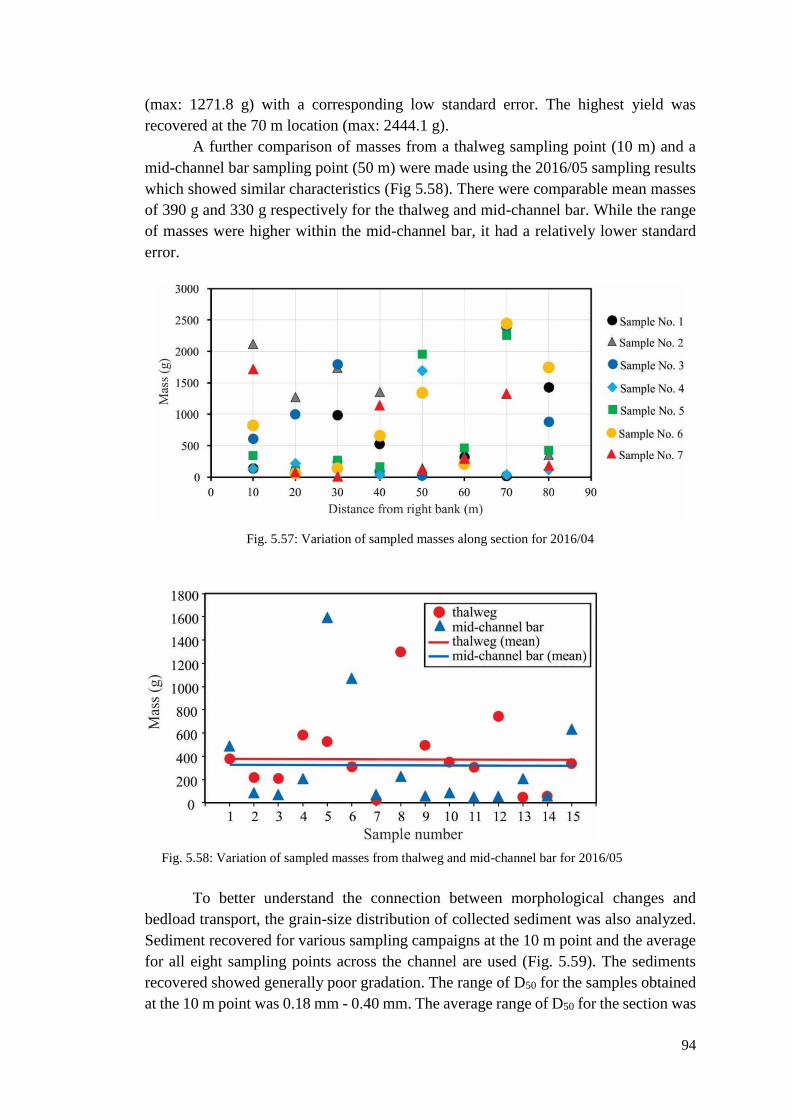
94
(max: 1271.8 g) with a corresponding low standard error. The highest yield was
recovered at the 70 m location (max: 2444.1 g).
A further comparison of masses from a thalweg sampling point (10 m) and a
mid-channel bar sampling point (50 m) were made using the 2016/05 sampling results
which showed similar characteristics (Fig 5.58). There were comparable mean masses
of 390 g and 330 g respectively for the thalweg and mid-channel bar. While the range
of masses were higher within the mid-channel bar, it had a relatively lower standard
error.
Fig. 5.57: Variation of sampled masses along section for 2016/04
Fig. 5.58: Variation of sampled masses from thalweg and mid-channel bar for 2016/05
To better understand the connection between morphological changes and
bedload transport, the grain-size distribution of collected sediment was also analyzed.
Sediment recovered for various sampling campaigns at the 10 m point and the average
for all eight sampling points across the channel are used (Fig. 5.59). The sediments
recovered showed generally poor gradation. The range of D50 for the samples obtained
at the 10 m point was 0.18 mm - 0.40 mm. The average range of D50 for the section was
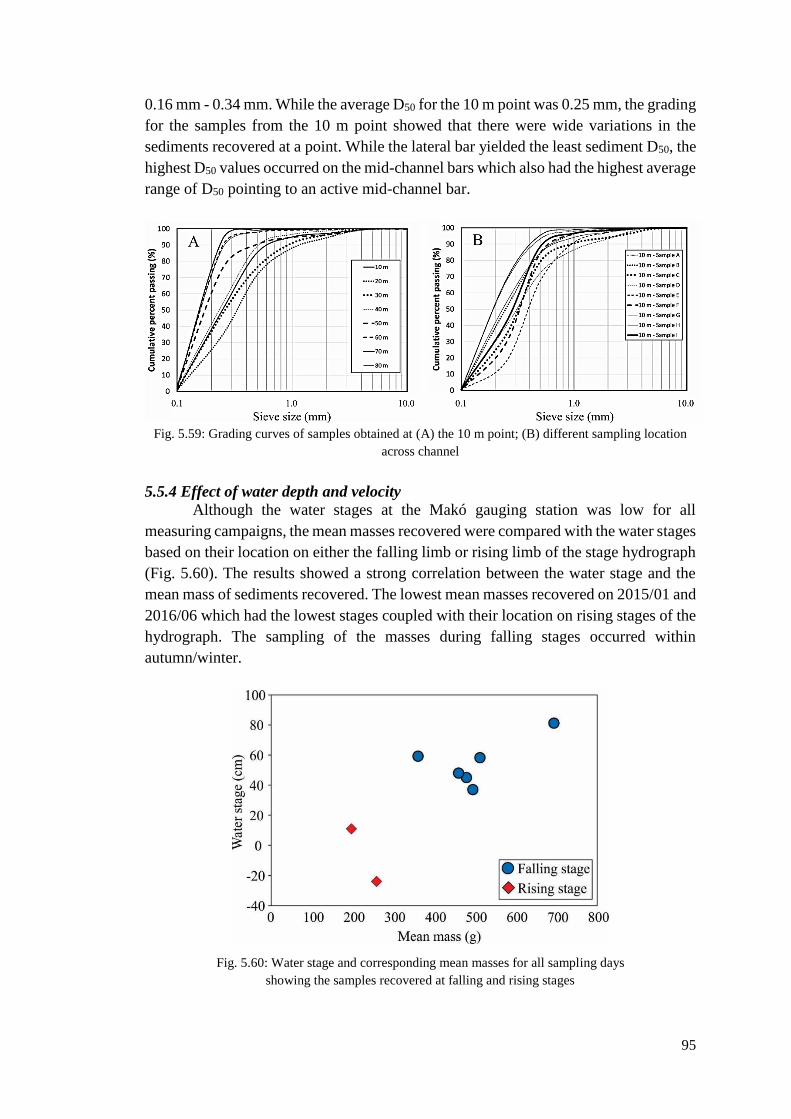
95
0.16 mm - 0.34 mm. While the average D50 for the 10 m point was 0.25 mm, the grading
for the samples from the 10 m point showed that there were wide variations in the
sediments recovered at a point. While the lateral bar yielded the least sediment D50, the
highest D50 values occurred on the mid-channel bars which also had the highest average
range of D50 pointing to an active mid-channel bar.
Fig. 5.59: Grading curves of samples obtained at (A) the 10 m point; (B) different sampling location
across channel
5.5.4 Effect of water depth and velocity
Although the water stages at the Makó gauging station was low for all
measuring campaigns, the mean masses recovered were compared with the water stages
based on their location on either the falling limb or rising limb of the stage hydrograph
(Fig. 5.60). The results showed a strong correlation between the water stage and the
mean mass of sediments recovered. The lowest mean masses recovered on 2015/01 and
2016/06 which had the lowest stages coupled with their location on rising stages of the
hydrograph. The sampling of the masses during falling stages occurred within
autumn/winter.
Fig. 5.60: Water stage and corresponding mean masses for all sampling days
showing the samples recovered at falling and rising stages
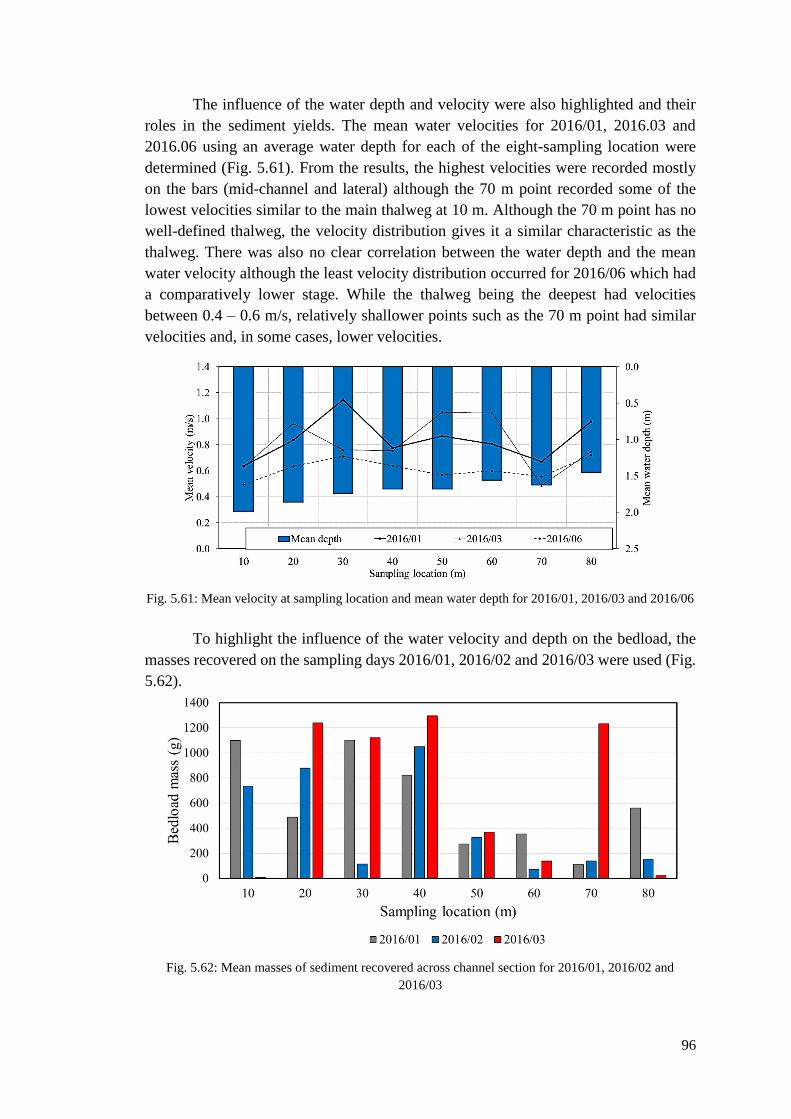
96
The influence of the water depth and velocity were also highlighted and their
roles in the sediment yields. The mean water velocities for 2016/01, 2016.03 and
2016.06 using an average water depth for each of the eight-sampling location were
determined (Fig. 5.61). From the results, the highest velocities were recorded mostly
on the bars (mid-channel and lateral) although the 70 m point recorded some of the
lowest velocities similar to the main thalweg at 10 m. Although the 70 m point has no
well-defined thalweg, the velocity distribution gives it a similar characteristic as the
thalweg. There was also no clear correlation between the water depth and the mean
water velocity although the least velocity distribution occurred for 2016/06 which had
a comparatively lower stage. While the thalweg being the deepest had velocities
between 0.4 – 0.6 m/s, relatively shallower points such as the 70 m point had similar
velocities and, in some cases, lower velocities.
Fig. 5.61: Mean velocity at sampling location and mean water depth for 2016/01, 2016/03 and 2016/06
To highlight the influence of the water velocity and depth on the bedload, the
masses recovered on the sampling days 2016/01, 2016/02 and 2016/03 were used (Fig.
5.62).
Fig. 5.62: Mean masses of sediment recovered across channel section for 2016/01, 2016/02 and
2016/03
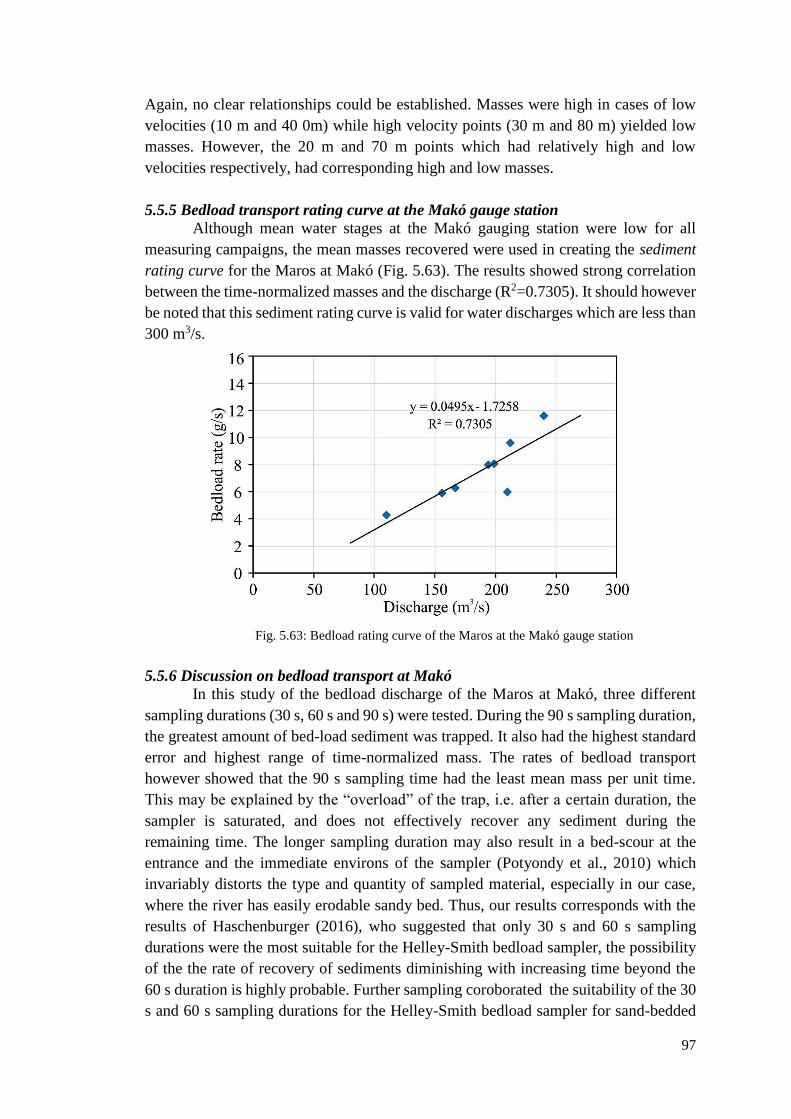
97
Again, no clear relationships could be established. Masses were high in cases of low
velocities (10 m and 40 0m) while high velocity points (30 m and 80 m) yielded low
masses. However, the 20 m and 70 m points which had relatively high and low
velocities respectively, had corresponding high and low masses.
5.5.5 Bedload transport rating curve at the Makó gauge station
Although mean water stages at the Makó gauging station were low for all
measuring campaigns, the mean masses recovered were used in creating the sediment
rating curve for the Maros at Makó (Fig. 5.63). The results showed strong correlation
between the time-normalized masses and the discharge (R2=0.7305). It should however
be noted that this sediment rating curve is valid for water discharges which are less than
300 m3/s.
Fig. 5.63: Bedload rating curve of the Maros at the Makó gauge station
5.5.6 Discussion on bedload transport at Makó
In this study of the bedload discharge of the Maros at Makó, three different
sampling durations (30 s, 60 s and 90 s) were tested. During the 90 s sampling duration,
the greatest amount of bed-load sediment was trapped. It also had the highest standard
error and highest range of time-normalized mass. The rates of bedload transport
however showed that the 90 s sampling time had the least mean mass per unit time.
This may be explained by the “overload” of the trap, i.e. after a certain duration, the
sampler is saturated, and does not effectively recover any sediment during the
remaining time. The longer sampling duration may also result in a bed-scour at the
entrance and the immediate environs of the sampler (Potyondy et al., 2010) which
invariably distorts the type and quantity of sampled material, especially in our case,
where the river has easily erodable sandy bed. Thus, our results corresponds with the
results of Haschenburger (2016), who suggested that only 30 s and 60 s sampling
durations were the most suitable for the Helley-Smith bedload sampler, the possibility
of the the rate of recovery of sediments diminishing with increasing time beyond the
60 s duration is highly probable. Further sampling coroborated the suitability of the 30
s and 60 s sampling durations for the Helley-Smith bedload sampler for sand-bedded

98
rivers. However, based on our results, we suggest that in sand-beddeed rivers, the
optimum sampling time should be 60 s.
There was high temporal variability of bedload for all sampled points as shown
by the results. Although not a direct consequence of the sampling time, other factors
including the in-bed morphology and the changing bed-form may be responsible as
explained subsequently. However, one possible source of bedload variability in the
results is the position of the Helley-Smith sampler during sediment sampling due to the
variability of the channel bed (Fig. 5.64). There will be under recovery in the first
scenario where the nozzle of the sampler lies on dune. Conversely, with the nozzle
embedded in the dune (second scenario), there is the possibility of over-sampling due
to the sediments from the dune being trapped into the sampler. However, as indicated
by third scenario, the ideal placement of the nozzle of the sampler to flush with the
channel bed eliminates this instrument error.
Fig. 5.64: Positioning of Helley-Smith on channel bed as
a possible source of error during bedload sampling
With a highly variable bed as indicated by the changes in the in-channel bed,
the high variability has direct implications for both the quantity and quality of
sediments reaching various points across the section, and the orientation of the Helley-
Smith bedload sampler during sampler. While the variability of the quantity of bedload
across the section have been shown in the results, this has also been hypothesized by
Gran and Czuba (2017) that sand-bedded channels are likely to experience translational
sediment pulses, while storages significantly alter rates of bedload transport. Sipos and
Kiss (2004) also indicated that in the Maros, there is a high variability of sediment
transport due to its dynamic nature with frequent thalweg shifts and sediments carried
in high dunes. With the quality of sediments, although the sediments recovered are
generally poorly graded sands, there was a high content of sediment (up to 20% in some
cases) less than the size of the mesh of the sampler bag (0.25 mm) as indicated by the
grain-size distributions (Fig. 5.59). This suggests that there is a probability of a loss of
some sediments passing through the mesh. At some locations: 50 m, 60 m, 70 m and
80 m especially, they had up to 40% of sediment sizes similar or less than the size of
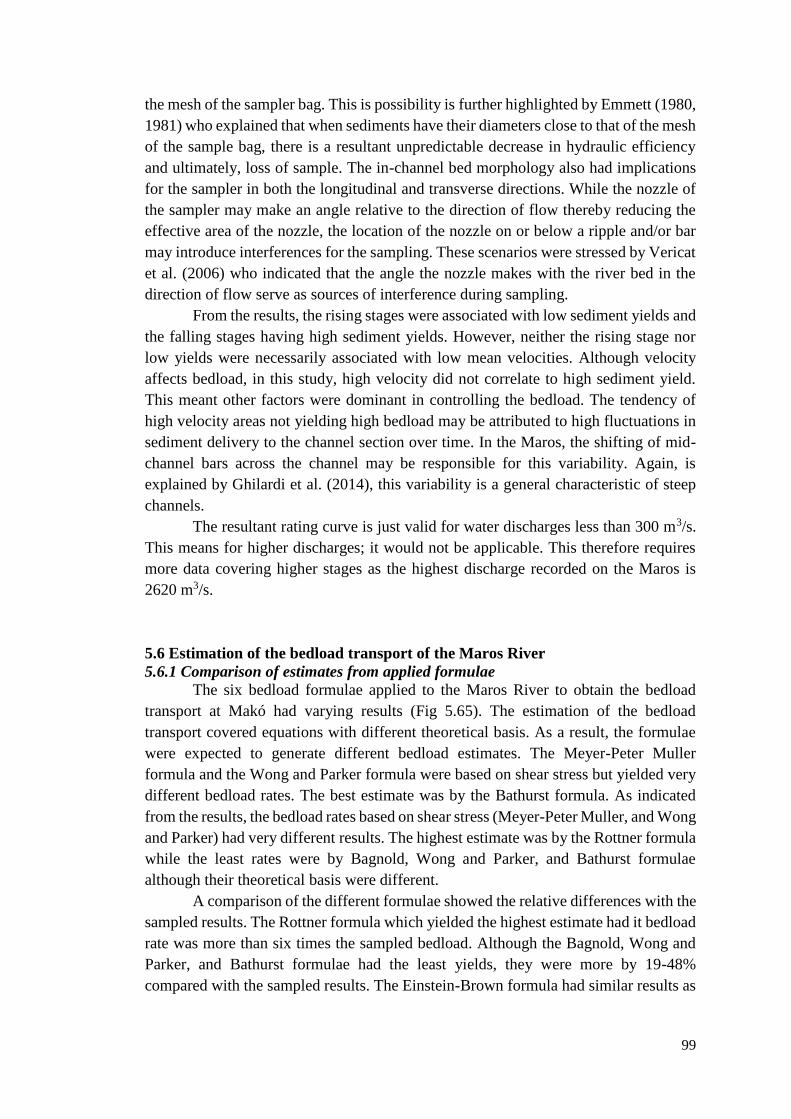
99
the mesh of the sampler bag. This is possibility is further highlighted by Emmett (1980,
1981) who explained that when sediments have their diameters close to that of the mesh
of the sample bag, there is a resultant unpredictable decrease in hydraulic efficiency
and ultimately, loss of sample. The in-channel bed morphology also had implications
for the sampler in both the longitudinal and transverse directions. While the nozzle of
the sampler may make an angle relative to the direction of flow thereby reducing the
effective area of the nozzle, the location of the nozzle on or below a ripple and/or bar
may introduce interferences for the sampling. These scenarios were stressed by Vericat
et al. (2006) who indicated that the angle the nozzle makes with the river bed in the
direction of flow serve as sources of interference during sampling.
From the results, the rising stages were associated with low sediment yields and
the falling stages having high sediment yields. However, neither the rising stage nor
low yields were necessarily associated with low mean velocities. Although velocity
affects bedload, in this study, high velocity did not correlate to high sediment yield.
This meant other factors were dominant in controlling the bedload. The tendency of
high velocity areas not yielding high bedload may be attributed to high fluctuations in
sediment delivery to the channel section over time. In the Maros, the shifting of mid-
channel bars across the channel may be responsible for this variability. Again, is
explained by Ghilardi et al. (2014), this variability is a general characteristic of steep
channels.
The resultant rating curve is just valid for water discharges less than 300 m3/s.
This means for higher discharges; it would not be applicable. This therefore requires
more data covering higher stages as the highest discharge recorded on the Maros is
2620 m3/s.
5.6 Estimation of the bedload transport of the Maros River
5.6.1 Comparison of estimates from applied formulae
The six bedload formulae applied to the Maros River to obtain the bedload
transport at Makó had varying results (Fig 5.65). The estimation of the bedload
transport covered equations with different theoretical basis. As a result, the formulae
were expected to generate different bedload estimates. The Meyer-Peter Muller
formula and the Wong and Parker formula were based on shear stress but yielded very
different bedload rates. The best estimate was by the Bathurst formula. As indicated
from the results, the bedload rates based on shear stress (Meyer-Peter Muller, and Wong
and Parker) had very different results. The highest estimate was by the Rottner formula
while the least rates were by Bagnold, Wong and Parker, and Bathurst formulae
although their theoretical basis were different.
A comparison of the different formulae showed the relative differences with the
sampled results. The Rottner formula which yielded the highest estimate had it bedload
rate was more than six times the sampled bedload. Although the Bagnold, Wong and
Parker, and Bathurst formulae had the least yields, they were more by 19-48%
compared with the sampled results. The Einstein-Brown formula had similar results as
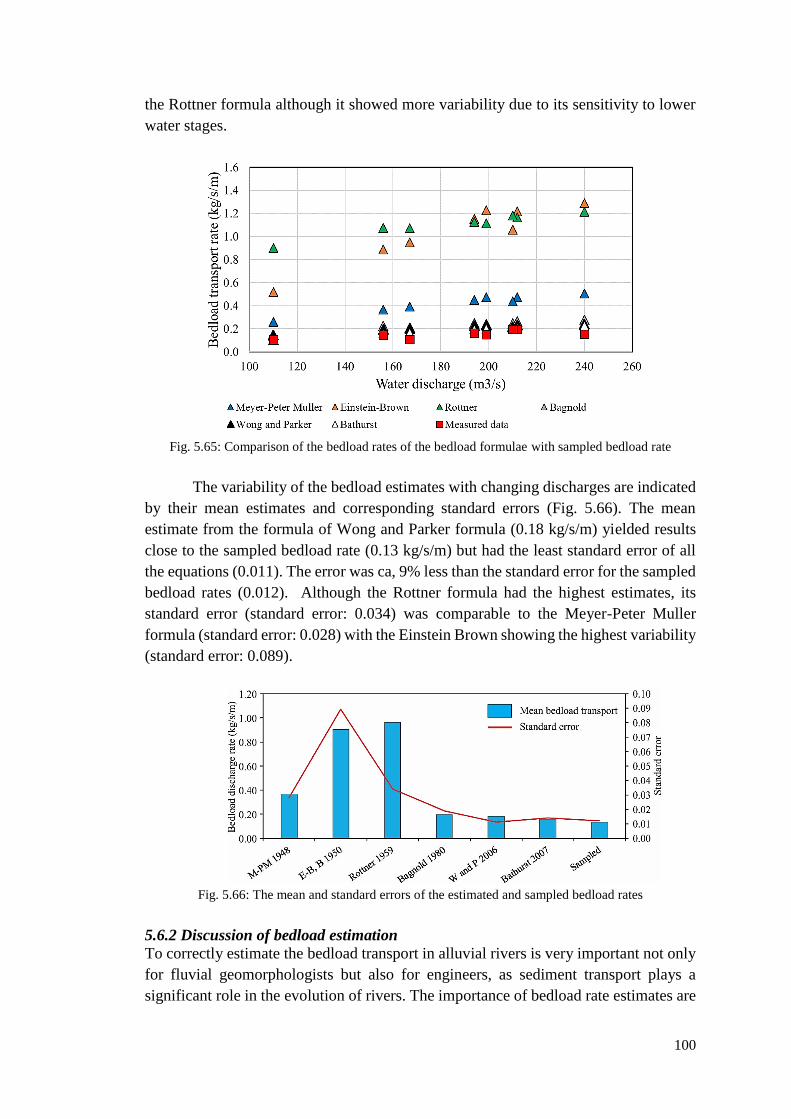
100
the Rottner formula although it showed more variability due to its sensitivity to lower
water stages.
Fig. 5.65: Comparison of the bedload rates of the bedload formulae with sampled bedload rate
The variability of the bedload estimates with changing discharges are indicated
by their mean estimates and corresponding standard errors (Fig. 5.66). The mean
estimate from the formula of Wong and Parker formula (0.18 kg/s/m) yielded results
close to the sampled bedload rate (0.13 kg/s/m) but had the least standard error of all
the equations (0.011). The error was ca, 9% less than the standard error for the sampled
bedload rates (0.012). Although the Rottner formula had the highest estimates, its
standard error (standard error: 0.034) was comparable to the Meyer-Peter Muller
formula (standard error: 0.028) with the Einstein Brown showing the highest variability
(standard error: 0.089).
Fig. 5.66: The mean and standard errors of the estimated and sampled bedload rates
5.6.2 Discussion of bedload estimation
To correctly estimate the bedload transport in alluvial rivers is very important not only
for fluvial geomorphologists but also for engineers, as sediment transport plays a
significant role in the evolution of rivers. The importance of bedload rate estimates are

101
even more significant when the technical difficulties, cost and dangers associated with
bedload sampling are considered.
In testing the six bedload formulae, it was important that the estimates provided
by any formula to be very consistent. This condition of consistency is highlighted by
the standard errors. From the results, the equations with the least estimates of the
bedload rates were the most consistent. The highest estimates of the bedload rate was
by the Rottner formula and Einstein-Brown formula which are based on regression and
probability respectively. Their higher estimates may therefore be attributed to using
statistical and probabilistic analysis as the basis of their development, while the other
formulae are based on some natural attribute of flow. Although the Rottner formula
yielded the highest mean bedload transport rate, it was not the least consistent as the
Einstein-Brown formula had a higher standard error. The Meyer-Peter Muller formula
is an older formula which has been analyzed by various author to improve its
predictability (Wong and Parker, 2006; Huang, 2010; Sidiropoulous et al., 2018; Kurigi
et al., 2019).
In this present study, the sensitivity of the various formulae was not tested.
However, as indicated by Claude et al. (2012), the bedload formulae are not sensitive
to differences in the mean sediment diameter; hence, the sediment size did not play a
role in the differences in their estimates. This is further shown by the Bathurst formula
and Wong and Parker formula which gave good estimates of the bedload although their
applicable sediment range used in developing them were higher than the sediment size
used in the estimation of the bedload transport rate for my study. However, changes in
the stage may affect the estimates especially with the Rottner and Einstein-Brown
formulae. Even at low stages used for the estimates, the two formulae responded to
both the least and highest values which resulted in their higher variability. However,
same cannot be said for the other formulae as they did not show any appreciable
sensitivity for the range of water stages applied. As already indicated, although the
Wong and Parker formula is a modified form of the Meyer-Peter Muller equation, it
yielded very consistent values, as well as close estimates to the measured bedload rate
from the sampling.
In a highly dynamic alluvial river channel, the effect of changing bedforms
affects the bedload transport rates. However, in this study, no corrections were made to
incorporate this variable bed. Although, the best estimate is from the Bathurst formula,
the results generally suggest the more recent bedload formulae have been calibrated to
perform better estimates of the bedload transport based on the performance of the six
bedload formulae used.
102
6. CONCLUSIONS
This PhD research focused on the morphological response of a lowland river
channel subjected to various engineering interventions which ranged from
channelization to make the river more navigable, to bank stabilization methods (mainly
through revetments) which were to control the evolution of the river channel which
posed various forms of hazards. To better understand how the evolution of the river,
various analyses were done to ascertain the processes driving the changes in the river
channel. Furthermore, the ability of forecasting methods including the use of a process-
based model and empirical formulae were tested to project future development of the
river to help in decision making which is critical in effective river management.
6.1 Centurial changes in the Lower Tisza channel
The human interventions in the Lower Tisza included the construction of
levees, artificial meander cutoffs, and the construction of revetments and groynes.
However, in this study, the effects of meander cutoffs and the revetments which directly
impacted the river channel were studied in detail. The aim of artificial meander cutoffs
was to straighten the channel, and they were made between 1850 and 1889 which
reduced the length of the Lower Tisza by one third. The reduction in length effectively
increased the slope and as a result, the stream power of the channel. The revetments
within the Lower Tisza on the other hand, were constructed from the late 19th century
(1886) with the latest in 2001. However, most of them (ca. 54% of revetments) were
built between 1925 and 1965. The middle section of the river had the highest length of
revetments (58%) but the least density of all the reaches due to its longer length.
The temporal changes in the vertical channel parameters can be categorized
into three distinct periods based on the response of the channel to the various direct
engineering interventions. In response to the artificial meander cutoffs, there was an
increase in cross-sectional area from 1891-1961 although the latter part of the period
was characterized by a slower rate of increase due to the declining influence of the
cutoffs. The next period, 1961-1976 was marked by a reduction in the cross-sectional
area as a response to the construction of revetments; while the last period, 1976-2017
was also characterized by an increase in the cross-sectional area of the channel as the
channel began to re-establish it evolution trend after adjusting to the revetments.
However, the last two decades have been marked with the highest ever rate of increase
in the cross-sectional area of the Lower Tisza. These changes in the cross-sectional area
were reflected in the changes in the depth and width values of the channel too. The
channel generally incised and experienced narrowing over the entire 126-year studied
period. This meant the any increase in cross-sectional area was due to the increase in
the depth conditions of the river. The drastic reduction in the cross-sectional area of the
channel for period 1961-1976 was characterized by both aggradation and narrowing.
Although the width generally decreased over the 126-year period, the mean width
increased between 1999 and 2017 referring to the rapid increase in the channel cross-
sectional area. The pattern of temporal changes in the Lower Tisza from my research
compares to the work of Kiss et al. (2008) and Sipos et al. (2007) although it involved

103
shorter river sections. It is important to note that the bank erosion which necessitated
the construction of the revetment was and is responsible for the collapse of the
revetments has been indicated by Simon (1992) as the channel’s most efficient means
of energy dissipation. Furthermore, although rates of incision were not as high as 0.6
m/y as indicated by Simon (1989) and Baena-Escudero et al. (2019), their theory of the
migration of incision rates upstream may very well be responsible for the relatively
widespread incision in parts of the Lower Tisza not directly affected by human impacts.
Spatially, the evolution of the Lower Tisza channel was controlled by intensity
of the engineering interventions. Generally, the upper reach had the highest change,
while the least change was in the middle reach although it is the most active of the
reaches. The lower reach on the other hand, was relatively stable due to its proximity
to the confluence of the Tisza River with the larger Danube which affected channel
processes. The mean cross-sectional area of the Lower Tisza channel was highest in
the lower reach for all periods irrespective of the impact of the various engineering
interventions. The larger cross-sectional area may be attributed to the proximity of the
confluence of the Maros within this reach, as well as the influence of the larger Danube,
of which the Tisza is a tributary. The smallest cross-sections however alternated
between the very middle reach and the upper reach. From 1891 to 1961, the smallest
cross-section was in the middle reach. However, this changed after the construction of
the revetments as the river expended its energy to erode the unrevetted sections. Also,
within the middle reach, the type of revetment and their spacing served perfect
conditions for the erosion of the revetments; thus, increasing the channel size. The
depth of the Lower Tisza channel was generally highest within the lower reach, with
an increasing depth downstream. Over the studied period however, the thalweg depth
has evolved towards a uniform mean value in 2017. The width of the channel was
similarly highest in the lower reach although there is no clear downstream trend as in
the case of the depth. However, the least and highest widths for the channel were in the
middle and lower reaches respectively for the whole period.
The morphological evolution of the Lower Tisza River was mostly controlled
by the various direct engineering interventions. The has also been established by Surian
and Rinaldi (2003) for single thread alluvial rivers. Provencal et al. (2014) also
attributed the impact of various engineering interventions to the changes morphology
of the Rhône River in France over a 130-year period similar to my research; although
it covered a 120 km section, slightly longer than the Lower Tisza. The meanders,
which are free of cutoffs developed with little influence from the cutoffs. Based on the
evolution indicated by the low rates of change, the river had achieved some form of
equilibrium by 1961 based on a 100-year readjustment period of equilibrium for the
Lower Tisza as hypothesized by Kiss et al. (2008). This quasi-equilibrium was
however distorted with the construction of the revetment, as a new period of re-
adjustment was created with the revetments controlling the morphological
development of the channel. After this evolutionary setback, the channel began to re-
establish the pre-revetment evolution pattern. The results of this PhD research indicate
that the channel is still undergoing changes with a non-linear pattern of temporal change
which is supported by Surian and Rinadi’s (2006) channel evolution theory. The

104
response of the entire studied channel refers to the fact, that adjustments to various
human interventions were relatively rapid initially, after which the adjustments slowed
down considerably and became asymptotic. The non-linearity of evolution is analogous
to the theory of Phillip (1992) which highlights the complexity and non-linearity of
geomorphic systems, although my research simplified the process-response of the
various human impacts which are more complex than have been analyzed in this
research. The general morphological evolution of the channel is represented by the
conceptual model (Fig. 5.20).
The process-based model of the Lower Tisza was able to replicate the evolution
of the river without the presence of the revetments. Due to the complexity of the
revetments along the banks of the Lower Tisza, the effects of the revetments were not
modelled. The model results however suggest that the river without bank stabilization
measures will evolve generally with channel incision and narrowing, following the
original evolution pattern after the cutoffs before the construction of revetments and
groynes.
6.2 Morphology, in-channel processes and near-bank processes
The morphology of the river section, as well as the presence and state of
revetments, were found to control the in-channel processes of the Lower Tisza River.
The revetted sections (both meandering and straightened) generally had lower mean
velocities than the freely meandering section of the river. The meandering sections
(both revetted and unrevetted) on the other hand, had lower stream power than the
straightened sections. The Lower Tisza cannel was found to be eroding in both revetted
and unrevetted; and, straightened and meandering sections. However, two types of
revetment were present in the studied sections of the river: placed-rock revetment and
stepped-block revetment. Due to the differences in their construction, only the placed-
rock revetment erodes. My analysis suggests that incision caused by the construction
of the revetments within the channel can accelerate the erosion of the placed-rock
revetment which failed as the rocks can fall into the over-deepened pools one-by-one.
Although revetment erosion occurred mainly with the placed-rock revetments, two
types of revetment erosion were however identified (Fig. 5.33). Both types are erosion
are made possible by the high velocities generated near the revetments which cause
incision and finally the erosion of the revetment. In the first type, the incision creates
deep and steep vertical banks which are necessary condition for landslides. Thus, the
revetted section fails through landslides. In the second type of erosion, the incision of
the channel coupled with the high erosivity generated at the end of the revetment causes
the rocks at the end of the revetment to collapse one-by-one. The collapse creates a
pool due to both vertical and lateral erosion which creates the conditions for further
collapse of the revetment.
Due to the identified vulnerability of the placed-rock revetments, I suggest
reviewing the existing bank-protection practice in similar environments: (1) in case of
new revetment constructions the revetments should be extended far more downstream
towards the inflection zone, thus its end will be farther from the high erosivity velocity
105
fields, (2) a strengthened stepped-block type should be applied, and (3) in some narrow
and sharp bends even the replacement of artificial levee sections could be considered
or (4) the diversion of the thalweg by applying groynes.
My study also proved that the construction of revetments has had drastic long-
term effects on bank processes. Aside the relatively high costs of revetments, they
seem to have caused a range of unfavourable processes such as incision, enhanced
erosion and evacuation of sediment from parts of the river. This conclusion of the
unfavourable processes I highlighted was also presented by Klingeman et al. (1984).
Along the unrevetted sections, erosional processes became dominant, as the transferred
stream energy initiated active bank erosion downstream of revetments. This erosion
downstream of revetments propagates upstream which destabilizes the entire system.
This may cause further incision, accelerate the erosion around built-in structures (e.g.
bridge piers, groynes), and lower ground-water levels. The result of these may be the
development of hydrological droughts, and lowered low stages, making water-
withdrawal very difficult and expensive.
This PhD research has established erosion to be the dominant near-bank
process along the channel of the Lower Tisza as indicated by erosion of point-bars, as
well as bank erosion on unrevetted sections. However, there is a general loss of active
bank processes of the Lower Tisza due to the engineering intervention which
transformed the originally meandering equilibrium river into a meandering incising
one (Kiss et al., 2008). The loss of morphological character and fluvial processes is
identical to Yu et al. (2016) although the fluvial settings were different. As highlighted
by Kiss et al. (2019), in the late 19th century, active point-bars developed in all bends
and meanders of the Lower Tisza covering about half the studied reach with a length
of 52.3 km (in 47 locations). However, with the change in bank processes, only 4.7 km
of the banks have active bars at about 20 locations (with both point-bar in convex banks
and side bars in concave and straight sections). The construction of revetments to
stabilize banks has reduced intensive natural near-bank processes. However, the
channel incision due to the various engineering constructions has initiated intense bank
erosion of the concave banks, and erosion of the active point-bars of the Lower Tisza.
In the morphology of the meandering Lower Tisza River, the active near-bank
processes of the Lower Tisza river as indicated by the changes in the point-bar
elevation and bank erosion refer to a loss of equilibrium; as the development of point-
bars and bank erosion give an indication of the state of equilibrium of a river channel.
As highlighted by Church and Rice (2009) and Schuurman et al (2016), the reduction
in the active processes, and the predominantly erosion-dominant nature of the Lower
Tisza suggests a loss of equilibrium. My research has proved that point-bars, especially
those with revetments on their opposite banks are declining. Although most of them
have already been lost, the remaining ones will also soon disappear if the status quo
remains. Only those point-bars which are in free meanders might survive. Based on our
case study, such a point-bar follows the seasonal variations in hydrology and bank
erosion on the opposite bank, representing cyclic deposition and erosion of sediments
on its surface. Although the geomorphic processes are variable, and our research has
temporal and spatial limitations based on the size of the Lower Tisza River and the
106
period of adjustment of the river after regulations, the results of this research have
implications for future river management.
Based on the active processes it could be assumed, that most active point-bars
will be lost (eroded) with the exception of those which are without direct human impact.
The process will be accelerated if new revetments are built and the collapsed ones are
restored. However, it would be imperative for river managers to preserve the natural
environment and the sensitive ecosystems created by these active bank processes by
the possible restoration of some bank processes by the removal of hard bank
stabilization structures. Management of the river system should gradually refocus on
soft engineering measures and find ways of reviewing existing management schemes
to reflect this new shift in ideology, with an exhortation to engineers as indicated by
Lawler (1993) to adopt geomorphic methods in river management schemes as they may
lead to improved solutions.
6.3 Measurement and estimation of sediment transport
Bedload transport is fundamental in channel incision processes, therefore I also
focused on measuring and estimation bedload sediment transport. However, due to
limitations in technology, I measured it on only the Maros River. My measurement
revealed that the bedload transport rate on the Maros at Makó is 350,000 t/y although
Bogárdi (1974) indicated that the bedload transport of the Maros was 28,000 t/y. The
optimum sampling time using the 76 mm Helley-Smith bedload sampler on the Maros
was also determined to be 60 s which compared well with Haschenburger (2016) who
suggested 30 s and 60 s as suitable sampling times for the Helley Smith sampler.
The estimation of the bedload sediment transport of the Maros at Makó
presented a different perspective to understanding the differences in the various
formulae available for predicting bedload. Although the sediment sampling had its
errors possible due to changing channel bed forms and the sampler, the Bathurst
formula predicted bedload rates similar to the rates obtained from the sampling
campaigns. Therefore, this can be applied in bedload prediction for similar flow
conditions. For different flow conditions however, further calibration is needed due to
the possibility bedload formulae being sensitive to the changing flow conditions. As
indicated by López et al. (2014) in applying bedload formulae in the Lower Ebro River
in Spain, the Bathurst formula was one of two formulae that yielded good agreement
with the sampled bedload rate. Although the bedload formulae generally over predicted
the bedload rates based on the rates from the sampling, Claude et al. (2012) also
indicated the variability of the bedload transport formulae.

107
7. ACKNOWLEDGEMENT
I want to first of all thank God for His grace throughout my PhD research.
“Success is no accident. It is hard work, perseverance, learning, studying, sacrifice
and most of all, love of what you are doing or learning to do” - Edson Arantes do
Nascimento.
Undoubtedly, my profound gratitude goes to my supervisors, Dr. Sipos and Dr.
Kiss for their patience and guidance during these past four years. You were not just my
supervisors, but mentors as well. I cherish all the times we spent on the field together
and the pieces of advice to be both a good academic and person. This dissertation is
mainly due to your support and direction.
I want to acknowledge the Hungarian Government for granting me the
Stipendium Hungaricum Scholarship to undertake my doctoral studies in Hungary.
Secondly, I thank all those who played various roles to ensure that I could begin my
studies especially my lovely family and Prof. Lawrence Atepor. May the good Lord
continue to brighten your corner wherever you go.
To all the lecturers, staff and colleague PhD researchers of the Department of
Physical Geography and Geoinformatics of the University of Szeged, I am appreciative
of your warm reception throughout my stay in Hungary. You really made me feel
welcome, and a part of one big family, not forgetting my lovely Ghanaian colleagues
in Szeged. My sincere thanks also go to the students of the department who helped me
in the field during measurements especially Roland Kispál. Together, we overcame
both the harsh summer heat and the cold winter chills. To all the staff of ATIVIZIG
who provided data or technical support to make this research a reality, I cannot thank
you enough. Your support will never be forgotten.
108
8. REFERENCES
Abernethy, B., Rutherfurd, I.D., 2000. Does the weight of riparian trees destabilize
riverbanks? Regulated Rivers: Research & Management 16, 565–576.
Allan, J.D., 2004. Landscapes and Riverscapes: The Influence of Land Use on Stream
Ecosystems. Annual Review of Ecology, Evolution, and Systematics 35, 257–284.
Amissah, G. J., Kiss, T., Fiala, K., 2018. Morphological Evolution of the Lower Tisza River
(Hungary) in the 20th Century in Response to Human Interventions. Water, 10(7), 884.
Amissah, G. J., Kiss, T., Fiala, K., 2017. Centurial Changes in the Depth Conditions of a
Regulated River: Case Study of the Lower Tisza River, Hungary. Journal of
Environmental Geography, 10(1–2), 41–51.
Anderson, M.C., Kustas, W.P., Norman, J.M., 2003. Upscaling and Downscaling—A
Regional View of the Soil–Plant–Atmosphere Continuum. Agronomy Journal 95, 1408.
Anderson, S.P., Anderson, R.S., 2010. Geomorphology: The Mechanics and Chemistry of
Landscapes. Cambridge University Press, U. K.
Antonelli, C., Provansal, M., Vella, C., 2004. Recent morphological channel changes in a
deltaic environment. The case of the Rhône River, France. Geomorphology, 57(3), 385–
402.
Armanini, A., Gregoretti, C., 2005. Incipient sediment motion at high slopes in uniform flow
condition. Water Resources Research 41.
Arróspide, F., Mao, L., Escauriaza, C., 2018. Morphological evolution of the Maipo River in
central Chile: Influence of instream gravel mining. Geomorphology 306, 182–197.
Ashraf, F. B., Torabi Haghighi, A., Marttila, H., Kløve, B., 2016. Assessing impacts of
climate change and river regulation on flow regimes in cold climate: A study of a pristine
and a regulated river in the sub-arctic setting of Northern Europe. Journal of Hydrology,
542, 410–422.
Aubert, G., Langlois, V.J., Allemand, P., 2016. Bedrock incision by bedload: insights from
direct numerical simulations. Earth Surface Dynamics 4, 327–342.
Azevedo, I.C., Bordalo, A.A., Duarte, P.M., 2010. Influence of river discharge patterns on
the hydrodynamics and potential contaminant dispersion in the Douro estuary (Portugal).
Water Research 44, 3133–3146.
Baena-Escudero, R., Rinaldi, M., García-Martínez, B., Guerrero-Amador, I.C., Nardi, L.,
2019. Channel adjustments in the lower Guadalquivir River (southern Spain) over the
last 250 years. Geomorphology 337, 15–30.
Bagnold, R. A., 1980. An empirical correlation of bedload transport rates in flumes and
natural rivers. Proceedings of the Royal Society of London. A. Mathematical and
Physical Sciences, 372(1751), 453–473.
Bašić, T., Britton, J.R., Rice, S.P., G. Pledger, A., 2017. Impacts of gravel jetting on the
composition of fish spawning substrates: Implications for river restoration and fisheries
management. Ecological Engineering 107, 71–81.
Bathurst, J. C., 2007. Effect of coarse surface layer on bed-load transport. Journal of
Hydraulic Engineering, 133(11), 1192–1205.
Beechie, T.J., Pollock, M.M., Baker, S., 2008. Channel incision, evolution and potential
recovery in the Walla Walla and Tucannon River basins, northwestern USA. Earth
Surface Processes and Landforms 33, 784–800.
Beighley, R.E., Eggert, K.G., Dunne, T., He, Y., Gummadi, V., Verdin, K.L., 2009.
Simulating hydrologic and hydraulic processes throughout the Amazon River Basin.
Hydrological Processes 23, 1221–1235.
Ben Moshe, L., Haviv, I., Enzel, Y., Zilberman, E., Matmon, A., 2008. Incision of alluvial
channels in response to a continuous base level fall: Field characterization, modeling,
and validation along the Dead Sea. Geomorphology 93, 524–536.
Benn, P. C., Erskine, W. D., 1994. Complex channel response to flow regulation: Cudgegong
River below Windamere Dam, Australia. Applied Geography, 14(2), 153–168.
Bertoldi, W., Gurnell, A., Surian, N., Tockner, K., Zanoni, L., Ziliani, L., Zolezzi, G., 2009.
Understanding reference processes: linkages between river flows, sediment dynamics

109
and vegetated landforms along the Tagliamento River, Italy. River Research and
Applications 25, 501–516.
Beylich, A.A., Laute, K., 2014. Combining impact sensor field and laboratory flume
measurements with other techniques for studying fluvial bedload transport in steep
mountain streams. Geomorphology 218, 72–87.
Bezdán, M., 2010. Characteristics of the flow regime along the regulated Tisza river reach
downstream of Tiszafüred. Journal of Env. Geogr. 3, 25–30.
Biedenharn, D.S., Thorne, C.R., Watson, C.C., 2006. Wash load/bed material load concept in
Regional Sediment Management, in: Proceedings of the Eighth Federal Interagency
Sedimentation Conference (8th FISC). Reno, NV, USA.
Bierman, P.R., Montgomery, D.R., 2014. Key Concepts in Geomorphology. W. H. Freeman,
New York, NY.
Blanckaert, K., Duarte, A., Chen, Q., Schleiss, A.J., 2012. Flow processes near smooth and
rough (concave) outer banks in curved open channels. Journal of Geophysical Research:
Earth Surface 117.
Blettler, M.C.M., Amsler, M.L., Ezcurra De Drago, I., Drago, E.C., Paira, A.R., Espinola,
L.A., 2012. Hydrodynamic and morphologic effects on the benthic invertebrate ecology
along a meander bend of a large river (Paraguay River, Argentina–Paraguay). Ecological
Engineering 44, 233–243.
Bogárdi, J., 1974. Sediment transport in alluvial streams. Akadémiai Kiadó.
Bogoni, M., Putti, M., Lanzoni, S., 2017. Modeling meander morphodynamics over self-
formed heterogeneous floodplains. Water Resources Research 53, 5137–5157.
Booth, D.B., 1990. Stream-Channel Incision Following Drainage-Basin Urbanization1.
JAWRA Journal of the American Water Resources Association 26, 407–417.
Boskidis, I., Kokkos, N., Sapounidis, A., Triantafillidis, S., Kamidis, N., Koutrakis, E.,
Sylaios, G.K., 2018. Ecohydraulic modelling of Nestos River Delta under low flow
regimes. Ecohydrology & Hydrobiology, SI: Ecohydrology for the Circular Economy
and Nature-Based Solutions towards mitigation/adaptation to Climate Change 18, 391–
400.
Bowman, D., Svoray, T., Devora, Sh., Shapira, I., Laronne, J.B., 2010. Extreme rates of
channel incision and shape evolution in response to a continuous, rapid base-level fall,
the Dead Sea, Israel. Geomorphology 114, 227–237.
Brierley, G. J., Fryirs, K., 2005. Geomorphology and River Management: Applications of the
River Styles Framework. Blackwell Publishing Company, NJ, USA.
Brookes, A., 1985. Traditional engineering methods, physical consequences and alternative
practices. Progress in Physical Geography: Earth and Environment, 9(1), 44–73.
Brown, C. B., 1950. Sediment transportation. In H. Rouse (Ed.), Engineering Hydraulics.
John Wiley Sons, Ltd. Chichester.
Bunte, K., Abt, S.R., Potyondy, J.P., Swingle, K.W., 2008. A Comparison of Coarse Bedload
Transport Measured with Bedload Traps and Helley-Smith Samplers. Geodinamica Acta
21(1-2), 53-66.
Bussi, G., Whitehead, P.G., Gutiérrez-Cánovas, C., Ledesma, J.L.J., Ormerod, S.J., Couture,
R.-M., 2018. Modelling the effects of climate and land-use change on the
hydrochemistry and ecology of the River Wye (Wales). Science of The Total
Environment 627, 733–743.
Calle, M., Alho, P., Benito, G., 2017. Channel dynamics and geomorphic resilience in an
ephemeral Mediterranean river affected by gravel mining. Geomorphology, 285, 333–
346.
Camporeale, C., Ridolfi, L., 2010. Interplay among river meandering, discharge stochasticity
and riparian vegetation. Journal of Hydrology 382, 138–144.
Chang, H. H., 2008. River morphology and river channel changes. Transactions of Tianjin
University, 14(4), 254–262.
Chang, H. H., 1986. River Channel Changes: Adjustments of Equilibrium. Journal of
Hydraulic Engineering, 112(1), 43–55.

110
Chanson, H., 2004. Hydraulics of Open Channel Flow: An Introduction, 2nd edition. Elsevier
Butterworth-Heinemann, Oxford, UK.
Charlton, R., 2007. Fundamentals of Fluvial Geomorphology. Routledge, UK.
Chen, D., Tang, C., 2012. Evaluating secondary flows in the evolution of sine-generated
meanders. Geomorphology, Meandering Channels 163–164, 37–44.
Choi, S.-U., Kang, H., 2006. Numerical investigations of mean flow and turbulence structures
of partly-vegetated open-channel flows using the Reynolds stress model. Journal of
Hydraulic Research 44, 203–217.
Choi, S.-U., Lee, J., 2015. Prediction of Total Sediment Load in Sand-Bed Rivers in Korea
Using Lateral Distribution Method. JAWRA Journal of the American Water Resources
Association 51, 214–225.
Chu, M. L., Knouft, J. H., Ghulam, A., Guzman, J. A., Pan, Z., 2013. Impacts of urbanization
on river flow frequency: A controlled experimental modeling-based evaluation
approach. Journal of Hydrology, 495, 1–12.
Church, M., 2006. Bed Material Transport and the Morphology of Alluvial River Channels.
Annual Review of Earth and Planetary Sciences 34, 325–354.
Church, M., Hassan, M.A., 2005. Chapter 9 Upland gravel-bed rivers with low sediment
transport, in: Garcia, C., Batalla, R.J. (Eds.), Developments in Earth Surface Processes,
Catchment Dynamics and River Processes. Elsevier, pp. 141–168.
Church, M., Rice, S.P., 2009. Form and growth of bars in a wandering gravel-bed river. Earth
Surface Processes and Landforms 34, 1422–1432.
Clarke, D.B., Bryson, R.A., 1959. An Investigation of the Circulation over Second Point Bar,
Lake Mendota. Limnology and Oceanography 4, 140–144.
Claude, N., Rodrigues, S., Bustillo, V., Bréhéret, J.-G., Macaire, J.-J., Belleudy, P., 2012.
Estimating bedload transport in a large sand–gravel bed river from direct sampling, dune
tracking and empirical formulas. Geomorphology 179, 40–57.
Coe, M.T., Costa, M.H., Howard, E.A., 2008. Simulating the surface waters of the Amazon
River basin: impacts of new river geomorphic and flow parameterizations. Hydrological
Processes 22, 2542–2553.
Coleman, J.M., 1969. Brahmaputra river: Channel processes and sedimentation. Sedimentary
Geology 3, 129–239.
Coratza, P., De Waele, J., 2012. Geomorphosites and Natural Hazards: Teaching the
Importance of Geomorphology in Society. Geoheritage, 4(3), 195–203.
Cosma, M., Ghinassi, M., D’Alpaos, A., Roner, M., Finotello, A., Tommasini, L., Gatto, R.,
2019. Point-bar brink and channel thalweg trajectories depicting interaction between
vertical and lateral shifts of microtidal channels in the Venice Lagoon (Italy).
Geomorphology 342, 37–50.
Costa, A., Molnar, P., Lane, S.N., Bakker, M., 2015. Impact of river regulation on potential
sediment mobilization and transport in an Alpine catchment. EGU General Assembly
Conference Abstracts 10061.
Costabile, P., Macchione, F., 2015. Enhancing river model set-up for 2-D dynamic flood
modelling. Environmental Modelling and Software 67, 89–107.
Coulthard, T.J., Van De Wiel, M.J., 2012. Modelling river history and evolution.
Philosophical Transactions of the Royal Society A: Mathematical, Physical and
Engineering Sciences 370, 2123–2142.
Couper, P., Stott, T., Maddock, I., 2002. Insights into river bank erosion processes derived
from analysis of negative erosion-pin recordings: observations from three recent UK
studies. Earth Surface Processes and Landforms 27, 59–79.
Couper, P.R., Maddock, I.P., 2001. Subaerial river bank erosion processes and their
interaction with other bank erosion mechanisms on the River Arrow, Warwickshire, UK.
Earth Surface Processes and Landforms 26, 631–646.
Croke, J., Thompson, C., Fryirs, K., 2017. Prioritizing the placement of riparian vegetation
to reduce flood risk and end-of-catchment sediment yields: Important considerations in
hydrologically-variable regions. Journal of Environmental Management 190, 9–19.
111
Crosato, A., Saleh, M.S., 2011. Numerical study on the effects of floodplain vegetation on
river planform style. Earth Surface Processes and Landforms 36, 711–720.
Cserkész-Nagy, Á., Tóth, T., Vajk, Ö., Sztanó, O., 2010. Erosional scours and meander
development in response to river engineering: Middle Tisza region, Hungary.
Proceedings of the Geologists’ Association, 121(2), 238–247.
Csoma, J., 1973. Basic idea and methods of modern river management. Water Science
Research Institute, Budapest.
Czech, W., Radecki-Pawlik, A., Wyżga, B., Hajdukiewicz, H., 2016. Modelling the flooding
capacity of a Polish Carpathian river: A comparison of constrained and free channel
conditions. Geomorphology, 272, 32–42.
Dade, W.B., Renshaw, C.E., Magilligan, F.J., 2011. Sediment transport constraints on river
response to regulation. Geomorphology 126, 245–251.
Dai, Z., Liu, J. T., Fu, G., Xie, H., 2013. A thirteen-year record of bathymetric changes in the
North Passage, Changjiang (Yangtze) estuary. Geomorphology, 187, 101–107.
Dapporto, S., Rinaldi, M., Casagli, N., Vannocci, P., 2003. Mechanisms of riverbank failure
along the Arno River, central Italy. Earth Surface Processes and Landforms 28, 1303–
1323.
Darby, S.E., 1998. Modelling width adjustment in straight alluvial channels. Hydrological
Processes 12, 1299–1321.
Darby, S.E., Alabyan, A.M., Wiel, M.J.V. de, 2002. Numerical simulation of bank erosion
and channel migration in meandering rivers. Water Resources Research 38, 2-1-2–21.
Davies, D.K., 1966. Sedimentary Structures and Subfacies of a Mississippi River Point Bar.
The Journal of Geology 74, 234–239.
Davis, L., Harden, C.P., 2014. Factors Contributing to Bank Stability in Channelized, Alluvial
Streams. River Research and Applications 30, 71–80.
De Marchis, M., Napoli, E., 2008. The effect of geometrical parameters on the discharge
capacity of meandering compound channels. Advances in Water Resources 31, 1662–
1673.
de Nooij, R.J.W., Verberk, W.C.E.P., Lenders, H.J.R., Leuven, R.S.E.W., Nienhuis, P.H.,
2006. The Importance of Hydrodynamics for Protected and Endangered Biodiversity of
Lowland Rivers. Hydrobiologia 565, 153–162.
De Vriend, H.J., 1977. A mathematical model of steady flow in curved shallow channels.
Journal of Hydraulic Research 15, 37–54.
Department of Natural Resources and Water., 2006. What causes bank erosion?
https://www.qld.gov.au/__data/assets/pdf_file/0033/67677/what-causes-stream-bed-
erosion.pdf
Dewan, A., Corner, R., Saleem, A., Rahman, Md Masudur, Haider, M.R., Rahman, Md
Mostafizur, Sarker, M.H., 2017. Assessing channel changes of the Ganges-Padma River
system in Bangladesh using Landsat and hydrological data. Geomorphology 276, 257–
279.
Dey, S., Ali, S.Z., 2017. Mechanics of Sediment Transport: Particle Scale of Entrainment to
Continuum Scale of Bedload Flux. J. Eng. Mech. 143, 04017127. Dietrich, W.E., Smith,
J.D., 1983. Influence of the point bar on flow through curved channels. Water Resources
Research 19, 1173–1192.
Dingman, S.L., 2009. Fluvial Hydraulics. Oxford University Press, Oxford, UK.
Dixon, S. J., Sambrook Smith, G. H., Best, J. L., Nicholas, A. P., Bull, J. M., Vardy, M. E.,
Sarker, M. H., Goodbred, S., 2018. The planform mobility of river channel confluences:
Insights from analysis of remotely sensed imagery. Earth-Science Reviews, 176, 1–18.
Domer, A., Sitkov, O., Ovadia, O., Shochat, E., 2019. Effect of riparian vegetation clear-
cutting on avian community in the Northern Negev. Biological Conservation 236, 435–
442.
Downs, P.W., Piégay, H., 2019. Catchment-scale cumulative impact of human activities on
river channels in the late Anthropocene: implications, limitations, prospect.
Geomorphology 338, 88–104.

112
Downs, P.W., Simon, A., 2001. Fluvial geomorphological analysis of the recruitment of large
woody debris in the Yalobusha River network, Central Mississippi, USA.
Geomorphology 37, 65–91.
Du, J., Qian, L., Rui, H., Zuo, T., Zheng, D., Xu, Y., Xu, C.-Y., 2012. Assessing the effects
of urbanization on annual runoff and flood events using an integrated hydrological
modeling system for Qinhuai River basin, China. Journal of Hydrology, 464–465, 127–
139.
Dunka, S., Fejér, L., Vágás, I., 1996. A verítékeshonfoglalás—ATisza szabályozás története
(The New Conquest—History of the Regulation of Tisza River). Vízügyi Múzeumés
Levéltár.
Earchi, E., Roth, G., Siccardi, F., 1995. The Po: Centuries of river training. Physics and
Chemistry of the Earth 20, 475–478.
Edwards, B.L., Keim, R.F., Johnson, E.L., Hupp, C.R., Marre, S., King, S.L., 2016.
Geomorphic adjustment to hydrologic modifications along a meandering river:
Implications for surface flooding on a floodplain. Geomorphology 269, 149–159.
Einstein, H.A., Anderson, A.G., Johnson, J.W., 1940. A distinction between bed-load and
suspended load in natural streams. Eos, Transactions American Geophysical Union 21,
628–633.
Eke, E., Parker, G., Shimizu, Y., 2014. Numerical modeling of erosional and depositional
bank processes in migrating river bends with self-formed width: Morphodynamics of bar
push and bank pull. Journal of Geophysical Research: Earth Surface 119, 1455–1483.
Emmett, W. W., 1981. Measurement of bedload in rivers. Erosion and Sediment Transport
Measurement. Proceedings of the Florence Symposium. IAHS Publ. No. 133.
Emmett, W. W., 1980. A field calibration of the sediment-trapping characteristics of the
Helley-Smith bed-load sampler. USGS Numbered Series No. 1139, Professional Paper.
Engel, F.L., Rhoads, B.L., 2017. Velocity profiles and the structure of turbulence at the outer
bank of a compound meander bend. Geomorphology 295, 191–201.
Engelund, F., Fredsøe, J., 1982. Hydraulic Theory of Alluvial Rivers. In V. T. Chow (Ed.),
Advances in Hydroscience, 13, 187–215.
Erskine, W. D., 1992. Channel response to large-scale river training works: Hunter river,
Australia. Regulated Rivers: Research and Management, 7(3), 261–278.
Ferguson, R., 2010. Time to abandon the Manning equation? Earth Surface Processes and
Landforms, 35(15), 1873–1876.
Ferguson, R.I., 1977. Meander sinuosity and direction variance. GSA Bulletin 88, 212–214.
Fetherston, K.L., Naiman, R.J., Bilby, R.E., 1995. Large woody debris, physical process, and
riparian forest development in montane river networks of the Pacific Northwest.
Geomorphology, Biogeomorphology, Terrestrial and Freshwater Systems 13, 133–144.
Fiala, K., Sipos, G., Kiss, T., Lazar, M., 2007. Morfológiai változások és a vízvezető-
képesség alakulása a Tisza algyői és a Maros makói szelvényében a 2000. évi árvíz
kapcsán. Hidrológiai Közlöny 87(5), 37-46.
Fleischmann, A., Siqueira, V., Paris, A., Collischonn, W., Paiva, R., Pontes, P., Crétaux, J.-
F., Bergé-Nguyen, M., Biancamaria, S., Gosset, M., Calmant, S., Tanimoun, B., 2018.
Modelling hydrologic and hydrodynamic processes in basins with large semi-arid
wetlands. Journal of Hydrology 561, 943–959.
Fryirs, KA, Brierley, G., 2013. Floodplain forms and processes. Geomorphic Analysis of
River Systems: An Approach to Reading the Landscape, Fryirs KA, Brierley GJ (Eds),
1st Editionn. Blackwell: Chichester, UK, 155–173.
Fryirs, K.A., Brierley, G.J., 2012. Geomorphic Analysis of River Systems: An Approach to
Reading the Landscape. John Wiley & Sons, Ltd, Chichester, UK.
Fryirs, Kirstie, Brierley, G. J., 2001. Variability in sediment delivery and storage along river
courses in Bega catchment, NSW, Australia: Implications for geomorphic river recovery.
Geomorphology, 38(3), 237–265.
Fryirs, K. A., Brierley, G. J., Preston, N. J., Kasai, M., 2007. Buffers, barriers and blankets:
The (dis)connectivity of catchment-scale sediment cascades. CATENA, 70(1), 49–67.

113
Fryirs, Kirstie, Brierley, G., Spink, A., 2008. A response gradient of river adjustment and
recovery in the upper Hunter catchment: Impacts of human disturbance since European
settlement. Australia and New Zealand Geomorphology Group (ANZGG).
Galay, V.J., 1983. Causes of river bed degradation. Water Resources Research 19, 1057–
1090.
Galia, T., Hradecký, J., 2014. Estimation of bedload transport in headwater streams using a
numerical model (Moravskoslezké Beskydy Mountains, Czech Republic). AUC
Geographica 49, 21–31.
Gao, P., 2008. Understanding watershed suspended sediment transport. Progress in Physical
Geography: Earth and Environment 32, 243–263.
Gaurav, K., Tandon, S.K., Devauchelle, O., Sinha, R., Métivier, F., 2017. A single width–
discharge regime relationship for individual threads of braided and meandering rivers
from the Himalayan Foreland. Geomorphology 295, 126–133.
Gautier, E., Dépret, T., Costard, F., Virmoux, C., Fedorov, A., Grancher, D., Konstantinov,
P., Brunstein, D., 2018. Going with the flow: Hydrologic response of middle Lena
River (Siberia) to the climate variability and change. Journal of Hydrology, 557, 475–
488.
Ghilardi, T., Franca, M. J., Schleiss, A. J., 2014. Bed load fluctuations in a steep channel.
Water Resources Research, 50(8), 6557–6576.
Ghinassi, M., Ielpi, A., Aldinucci, M., Fustic, M., 2016. Downstream-migrating fluvial point
bars in the rock record. Sedimentary Geology 334, 66–96.
Gibson, S., Shelley, J., 2020. Flood disturbance, recovery, and inter-flood incision on a large
sand-bed river. Geomorphology 351, 106973.
Gilbert, G. K., 1877. Report on the geology of the Henry Mountains. USGS Monograph 212,
U.S. Government Printing Office, Washington DC.
Gilvear, D., Winterbottom, S., Sichingabula, H., 2000. Character of channel planform change
and meander development: Luangwa River, Zambia. Earth Surface Processes and
Landforms 25, 421–436.
Glas, M., Glock, K., Tritthart, M., Liedermann, M., Habersack, H., 2018. Hydrodynamic and
morphodynamic sensitivity of a river’s main channel to groyne geometry. Journal of
Hydraulic Research, 56(5), 714–726.
Gomez, B., Church, M., 1989. An assessment of bed load sediment transport formulae for
gravel bed rivers. Water Resources Research 25, 1161–1186.
Goudie, A., 2013. The human impact on the natural environment: past, present and future,
7th edition. Wiley-Blackwell, Chichester.
Goudie, A., 2003. Geomorphological Techniques. Routledge. Guan, M., Liang, Q., 2017. A
two-dimensional hydro-morphological model for river hydraulics and morphology with
vegetation. Environmental Modelling & Software 88, 10–21.
Gran, K. B., Czuba, J. A., 2017. Sediment pulse evolution and the role of network structure.
Geomorphology, 277, 17–30.
Gregory, K. J., 2006. The human role in changing river channels. Geomorphology, 79(3),
172–191.
Guillen, J., Palanques, A., 1992. Sediment dynamics and hydrodynamics in the lower course
of a river highly regulated by dams: The Ebro River. Sedimentology, 39(4), 567–579.
Güneralp, İ., Abad, J.D., Zolezzi, G., Hooke, J., 2012. Advances and challenges in
meandering channels research. Geomorphology, Meandering Channels 163–164, 1–9.
Güneralp, İ., Rhoads, B.L., 2011. Influence of floodplain erosional heterogeneity on planform
complexity of meandering rivers. Geophysical Research Letters 38(14), L14401.
Gurnell, A., Surian, N., Zanoni, L., 2009. Multi-thread river channels: A perspective on
changing European alpine river systems. Aquatic Sciences, 71(3), 253.
Hagstrom, C.A., Leckie, D.A., Smith, M.G., 2018. Point bar sedimentation and erosion
produced by an extreme flood in a sand and gravel-bed meandering river. Sedimentary
Geology 377, 1–16.

114
Ham, D.G., Church, M., 2000. Bed-material transport estimated from channel
morphodynamics: Chilliwack River, British Columbia. Earth Surface Processes and
Landforms 25, 1123–1142.
Haque, E., 2000. Risk Assessment, Emergency Preparedness and Response to Hazards: The
Case of the 1997 Red River Valley Flood, Canada. Natural Hazards, 21,225–245.
Harmar, O. P., Clifford, N. J., Thorne, C. R., Biedenharn, D. S., 2005. Morphological changes
of the Lower Mississippi River: Geomorphological response to engineering intervention.
River Research and Applications, 21(10), 1107–1131.
Harvey, M.D., Watson, C.C., 1986. Fluvial Processes and Morphological Thresholds in
Incised Channel Restoration. JAWRA Journal of the American Water Resources
Association 22, 359–368.
Haschenburger, J. K., 2016. Cross-channel patterns of bed material transport in a poorly
sorted sand-bed channel. Geomorphology, 273, 374–384.
Hassanzadeh, Y., 2012. Hydraulics of sediment transport. In J.-H. Zheng (Ed.),
Hydrodynamics: Theory and Model (pp. 23–58). InTech.
Helley, E.J., Smith, W., 1971. Development and calibration of a pressure-difference bedload
sampler (Open file report.). US Geological Survey, Water Resources Division, Menlo
Park, CA.
Hey, R.D., 1976. Geometry of river meanders. Nature 262, 482–484.
Hickin, E. J., 2009. River Channel Changes: Retrospect and Prospect. In Modern and Ancient
Fluvial Systems (pp. 59–83). John Wiley and Sons, Ltd, Chichester.
Hickin, E.J., 1974. The development of meanders in natural river-channels. American Journal
of Science 274, 414–442.
Hickin, E.J., 1969. A newly-identified process of point bar formation in natural streams.
American Journal of Science 267, 999–1010.
Hickin, E.J., Nanson, G.C., 1984. Lateral Migration Rates of River Bends. Journal of
Hydraulic Engineering 110, 1557–1567.
Hjulström, F., 1935. Studies of the morphological activity of rivers as illustrated by the River
Fyris, Bulletin. Geological Institute Uppsala 25, 221–527.
Hodskinson, A., Ferguson, R.I., 1998. Numerical modelling of separated flow in river bends:
model testing and experimental investigation of geometric controls on the extent of flow
separation at the concave bank. Hydrological Processes 12, 1323–1338.
Hooke, J. M., 2004. Cutoffs galore! Occurrence and causes of multiple cutoffs on a
meandering river. Geomorphology, 61(3), 225–238.
Hooke, J. M., 1995. River channel adjustment to meander cutoffs on the River Bollin and
River Dane, northwest England. Geomorphology, 14(3), 235–253.
Hooke, J.M., 1984. Changes in river meanders: a review of techniques and results of analyses.
Progress in Physical Geography: Earth and Environment 8, 473–508.
Hooke, J.M., 1980. Magnitude and distribution of rates of river bank erosion. Earth Surface
Processes and Landforms 5, 143–157.
Hooke, J. M., 1979. An analysis of the processes of river bank erosion. Journal of Hydrology,
42(1), 39–62.
Houben, P., Hoffmann, T., Zimmermann, A., Dikau, R., 2006. Land use and climatic impacts
on the Rhine system (RheinLUCIFS): Quantifying sediment fluxes and human impact
with available data. CATENA, 66(1), 42–52.
Huang, S., Chen, C., Jaffé, P.R., 2018. Seasonal distribution of nitrifiers and denitrifiers in
urban river sediments affected by agricultural activities. Science of The Total
Environment 642, 1282–1291.
Hugget, R.J., 2011. Fundamentals of Geomorphology, 3rd edition., Routledge Fundamentals
of Physical Geography. Routledge, London and New York.
ICPDR. (2008). Annual Report 2008. ICPDR, Vienna.
Ihrig, D., 1973. A magyar vízszabályozás története (History of water regulation in Hungary).
National Water Management Authority (OVH).

115
Imaizumi, F., Gomi, T., Kobayashi, S., Negishi, J.N., 2009. Changes in bedload transport rate
associated with episodic sediment supply in a Japanese headwater channel. CATENA 77,
207–215.
Isaac, V.J., Castello, L., Santos, P.R.B., Ruffino, M.L., 2016. Seasonal and interannual
dynamics of river-floodplain multispecies fisheries in relation to flood pulses in the
Lower Amazon. Fisheries Research 183, 352–359.
Iwasaki, T., Shimizu, Y., Kimura, I., 2016. Numerical simulation of bar and bank erosion in
a vegetated floodplain: A case study in the Otofuke River. Advances in Water Resources,
Numerical modelling of river morphodynamics 93, 118–134.
Iwata, T., Nakano, S., Murakami, M., 2003. Stream meanders increase insectivorous bird
abundance in riparian deciduous forests. Ecography 26, 325–337.
Jaeger, K.L., Sutfin, N.A., Tooth, S., Michaelides, K., Singer, M., 2017. Geomorphology and
Sediment Regimes of Intermittent Rivers and Ephemeral Streams, in: Intermittent Rivers
and Ephemeral Streams. Elsevier, Amsterdam.
James, L.A., 1997. Channel incision on the Lower American River, California, from
streamflow gage records. Water Resources Research 33, 485–490.
Jia, Y., Wang, Z., Zheng, X., Li, Y., 2016. A study on limit velocity and its mechanism and
implications for alluvial rivers. International Journal of Sediment Research 31, 205–211.
Joeckel, R. M., Tucker, S. T., McMullin, J. D., 2016. Morphosedimentary features from a
major flood on a small, lower-sinuosity, single-thread river: The unknown quantity of
overbank deposition, historical-change context, and comparisons with a multichannel
river. Sedimentary Geology, 343, 18–37.
Julien, P. Y., 2018. River Mechanics. Cambridge University Press, UK.
Károlyi, Z., 1960. A Tisza mederváltozásai—Különös tekintettel az árvízvédelemre (River-
bed changes of the Tisza River, with special attention to flood protection). VITUKI,
Budapest.
Kasse, C., Bohncke, S. J. P., Vandenberghe, J., Gábris, G. 2010. Fluvial style changes during
the last glacial–interglacial transition in the middle Tisza valley (Hungary). Proceedings
of the Geologists’ Association, 121(2), 180–194.
Kasvi, E., Vaaja, M., Alho, P., Hyyppä, H., Hyyppä, J., Kaartinen, H., Kukko, A., 2013.
Morphological changes on meander point bars associated with flow structure at different
discharges. Earth Surface Processes and Landforms 38, 577–590.
Keesstra, S.D., van Dam, O., Verstraeten, G., van Huissteden, J., 2009. Changing sediment
dynamics due to natural reforestation in the Dragonja catchment, SW Slovenia. CATENA
78, 60–71.
Kesel, R.H., Dunne, K.C., McDonald, R.C., Allison, K.R., Spicer, B.E., 1974. Lateral Erosion
and Overbank Deposition on the Mississippi River in Louisiana Caused by 1973
Flooding. Geology 2, 461–464.
Khan, N.I., Islam, A., 2003. Quantification of erosion patterns in the Brahmaputra–Jamuna
River using geographical information system and remote sensing techniques.
Hydrological Processes 17, 959–966.
King, A. J., Townsend, S. A., Douglas, M. M., Kennard, M. J., 2015. Implications of water
extraction on the low-flow hydrology and ecology of tropical savannah rivers: An
appraisal for northern Australia. Freshwater Science, 34(2), 741–758.
Kingsford, R.T., Thomas, R.F., 2004. Destruction of Wetlands and Waterbird Populations by
Dams and Irrigation on the Murrumbidgee River in Arid Australia. Environmental
Management 34, 383–396.
Kis É., Lóczy D., 2018. Természeti és antropogén tényezők szerepe az Alsó-Tisza menti
partfal-instabilitások kialakulásában. FK 142, 328–343.
Kiss, T., 2014. Fluviális Folyamatok antropogén hatásra megváltozó dinamikája: Egyensúly
és érzékenység vizsgáta folyóvizi környezetben. Akadémiai doktori értekezés.
University of Szeged, Hungary.
Kiss, T., Balogh, M., 2015. Characteristics of point-bar development under the influence of a
dam: Case study on the Dráva River at Sigetec, Croatia. Journal of Environmental
Geography, 8(1–2), 23–30.

116
Kiss, T., Sàndor, A., 2009. Land use changes and their effect on floodplain aggradation along
the Middle-Tisza River, Hungary. AGD Landscape and Environment, 3(1), 1–10.
Kiss, T., Amissah, G. J., Fiala, K., 2019. Bank Processes and Revetment Erosion of a Large
Lowland River: Case Study of the Lower Tisza River, Hungary. Water, 11(6), 1313.
Kiss, T., Andrási, G., Hernesz, P., 2011. Morphological alteration of the Drava as the result
of human impact. AGD Landscape and Environment, 5(2), 58–75.
Kiss, T., Fiala, K., Sipos, G., 2008. Alterations of channel parameters in response to river
regulation works since 1840 on the Lower Tisza River (Hungary). Geomorphology,
98(1–2), 96–110.
Kiss, T., Blanka, V., Andrási, G., Hernesz, P., 2013. Extreme Weather and the Rivers of
Hungary: Rates of Bank Retreat. In D. Loczy (Ed.), Geomorphological impacts of
extreme weather (pp. 83–98). Springer Netherlands.
Kiss, T., Fiala, K., Sipos, G., Szatmári, G., 2019. Long-term hydrological changes after
various river regulation measures: Are we responsible for flow extremes? Hydrology
Research, 50(2), 417–430.
Kiss, T., Urdea, P., Sipos, G., Sűmeghy, B., Katona, O., Tóth, O., Onaca, A., Ardelean,
Timofte, F., Ardelean, C., Kovács, Á., 2012. The past of the river. In G. Sipos (Ed.),
Past, present, future of the Maros/Mureş River (pp. 167–178). Department of Physical
Geography and Geoinformatics, University of Szeged.
Klimek, K., Latocha, A., 2007. Response of small mid-mountain rivers to human impact with
particular reference to the last 200 years; Eastern Sudetes, Central Europe.
Geomorphology, 92(3), 147–165.
Klingeman, P. C., Kehe, S. M., Owusu, Y. A., 1984. Streambank Erosion Protection and
Channel Scour Manipulation Using Rockfill Dikes and Gabions. Water Resources
Research Institute, Oregon State University, Project Number 6864-09, 176.
Knighton, D., 2004. Fluvial Forms and Processes: A New Perspective. Taylor and Francis,
UK.
Knox, R. L., Latrubesse, E. M., 2016. A geomorphic approach to the analysis of bedload and
bed morphology of the Lower Mississippi River near the Old River Control Structure.
Geomorphology, 268, 35–47.
Kondolf, G. M., Piégay, H., Landon, N., 2002. Channel response to increased and decreased
bedload supply from land use change: Contrasts between two catchments.
Geomorphology, 45(1), 35–51.
Kondolf, G. M., 1997. Hungry Water: Effects of Dams and Gravel Mining on River Channels.
Environmental Management, 21(4), 533–551. Kondolf, G. M., 1994. Geomorphic and
environmental effects of instream gravel mining. Landscape and Urban Planning, 28(2),
225–243.
Konsoer, K.M., Rhoads, B.L., Langendoen, E.J., Best, J.L., Ursic, M.E., Abad, J.D., Garcia,
M.H., 2016. Spatial variability in bank resistance to erosion on a large meandering,
mixed bedrock-alluvial river. Geomorphology, The Natural and Human Structuring of
Rivers and other Geomorphic Systems: A Special Issue in Honor of William L. Graf 252,
80–97.
Kroes, D. E., Kraemer, T. F., 2013. Human-induced stream channel abandonment/capture
and filling of floodplain channels within the Atchafalaya River Basin, Louisiana.
Geomorphology, 201, 148–156.
Krzeminska, D., Kerkhof, T., Skaalsveen, K., Stolte, J., 2019. Effect of riparian vegetation
on stream bank stability in small agricultural catchments. CATENA 172, 87–96.
Kuriqi, A., Koçileri, G., Ardiclioglu, M., 2019. Potential of Meyer-Peter and Müller approach
for estimation of bed-load sediment transport under different hydraulic regimes.
Modeling Earth Systems and Environment. Springer, Switzerland.
Lach, J., Wyżga, B., 2002. Channel incision and flow increase of the upper Wisłoka River,
southern Poland, subsequent to the reafforestation of its catchment. Earth Surface
Processes and Landforms 27, 445–462.

117
Laczay, I. A., 1977. Channel pattern changes of Hungarian rivers: The example of the Hernád
River. River Channel Changes. John Wiley and Sons, Ltd., Chichester, 185–192.
Laczay, I. A., 1975. River system of the Maros (Vízrajzi Atlasz sorozat). VITUKI, Budapest.
Lai, Y.G., Greimann, B.P., 2008. Modeling of Erosion and Deposition at Meandering
Channels, in: World Environmental and Water Resources Congress 2008. Presented at
the World Environmental and Water Resources Congress 2008, American Society of
Civil Engineers, Honolulu, Hawaii, United States, pp. 1–11.
Landon, N., Piégay, H., Bravard, J. P., 1998. The Drôme river incision (France): From
assessment to management. Landscape and Urban Planning, 43(1), 119–131.
Langbein, W.B., Leopold, L.B., 1964. Quasi-equilibrium states in channel morphology.
American Journal of Science 262, 782–794.
Lanzoni, S., Seminara, G., 2006. On the nature of meander instability. Journal of Geophysical
Research: Earth Surface 111, F04006.
Larson, M.G., Booth, D.B., Morley, S.A., 2001. Effectiveness of large woody debris in stream
rehabilitation projects in urban basins. Ecological Engineering 18, 211–226.
Lászlóffy, W., 1982. A Tisza: Vízi munkálatok és vízgazdálkodás a tiszai vízrendszerben.
Akadémiai Kiadó, Budapest.
Latapie, A., Camenen, B., Rodrigues, S., Paquier, A., Bouchard, J. P., Moatar, F., 2014.
Assessing channel response of a long river influenced by human disturbance. CATENA,
121, 1–12.
Latrubesse, E.M., Amsler, M.L., de Morais, R.P., Aquino, S., 2009. The geomorphologic
response of a large pristine alluvial river to tremendous deforestation in the South
American tropics: The case of the Araguaia River. Geomorphology, Short and Long
Term Processes, Landforms and Responses in Large Rivers 113, 239–252.
Lawler, D.M., 1993. The measurement of river bank erosion and lateral channel change: A
review. Earth Surface Processes and Landforms 18, 777–821.
Lawler, D.M., 1992. Design and installation of a novel automatic erosion monitoring system.
Earth Surface Processes and Landforms 17, 455–463.
Lawler, D.M., Couperthwaite, J., Bull, L.J., Harris, N.M., 1997. Bank erosion events and
processes in the Upper Severn basin. Hydrology and Earth System Sciences Discussions
1, 523–534.
Lecce, S.A., 1997. Nonlinear Downstream Changes in Stream Power on Wisconsin’s Blue
River. Annals of the Association of American Geographers 87, 471–486.
Leeder, M., 1999. Sedimentology and Sedimentary Basins. From Turbulence to Tectonics.
Blackwell Science, Oxford, UK.
Legleiter, C. J., 2014. A geostatistical framework for quantifying the reach-scale spatial
structure of river morphology: 2. Application to restored and natural channels.
Geomorphology, 205, 85–101.
Lehotský, M., Novotný, J., Szmańda, J.B., Grešková, A., 2010. A suburban inter-dike river
reach of a large river: Modern morphological and sedimentary changes (the Bratislava
reach of the Danube River, Slovakia). Geomorphology, Introduction to Management of
Large Rivers 117, 298–308.
Lemma, H., Nyssen, J., Frankl, A., Poesen, J., Adgo, E., Billi, P., 2019. Bedload transport
measurements in the Gilgel Abay River, Lake Tana Basin, Ethiopia. Journal of
Hydrology 577, 123968.
Leopold, L.B., 1994. A View of the River. Harvard University Press, USA.
Leopold, L.B., Langbein, W.B., 1966. River meanders. Scientific American 214, 60–73.
Leopold, L.B., Wolman, M.G., 1960. River meanders. GSA Bulletin 71, 769–793.
Leopold, L.B., Wolman, M.G., Miller, J.P., 1964. Fluvial processes in geomorphology. Dover
Publications, New York, NY.
Lewin, J., Manton, M.M.M., 1975. Welsh floodplain studies: The nature of floodplain
geometry. Journal of Hydrology 25, 37–50.
Li, Z., Gao, P., 2019. Channel adjustment after artificial neck cutoffs in a meandering river
of the Zoige basin within the Qinghai-Tibet Plateau, China. CATENA 172, 255–265.

118
Li, L., Lu, X., Chen, Z., 2007. River channel change during the last 50 years in the middle
Yangtze River, the Jianli reach. Geomorphology, 85(3), 185–196.
Liébault, F, Piégay, H., 2001. Assessment of channel changes due to long-term bedload
supply decrease, Roubion River, France. Geomorphology, 36(3–4), 167–186.
Liébault, F., Gomez, B., Page, M., Marden, M., Peacock, D., Richard, D., Trotter, C. M.,
2005. Land‐use change, sediment production and channel response in upland regions.
River Research and Applications, 21(7), 739–756.
Liu, X., Bai, Y., 2014. Turbulent structure and bursting process in multi-bend meander
channel. Journal of Hydrodynamics, Ser. B 26, 207–215.
Loehr, J., 1987. Impact of the hydrodynamic conditions on the primary production in an
impounded river. Ecological Modelling 39, 227–245.
Lofthouse, C., Robert, A., 2008. Riffle–pool sequences and meander morphology.
Geomorphology 99, 214–223.
Lopes, L.F.G., Do Carmo, J.S.A., Vitor Cortes, R.M., Oliveira, D., 2004. Hydrodynamics and
water quality modelling in a regulated river segment: application on the instream flow
definition. Ecological Modelling 173, 197–218.
López, R., Vericat, D., Batalla, R.J., 2014. Evaluation of bed load transport formulae in a
large regulated gravel bed river: The lower Ebro (NE Iberian Peninsula). Journal of
Hydrology 510, 164–181.
Luppi, L., Rinaldi, M., Teruggi, L.B., Darby, S.E., Nardi, L., 2009. Monitoring and numerical
modelling of riverbank erosion processes: a case study along the Cecina River (central
Italy). Earth Surface Processes and Landforms 34, 530–546.
Ma, F., Ye, A., Gong, W., Mao, Y., Miao, C., Di, Z., 2014. An estimate of human and natural
contributions to flood changes of the Huai River. Global and Planetary Change, 119,
39–50.
Macfarlane, W.W., Gilbert, J.T., Jensen, M.L., Gilbert, J.D., Hough-Snee, N., McHugh, P.A.,
Wheaton, J.M., Bennett, S.N., 2017. Riparian vegetation as an indicator of riparian
condition: Detecting departures from historic condition across the North American West.
Journal of Environmental Management, 202, 447–460.
Martin, D., Pititto, F., Gil, J., Mura, M.P., Bahamon, N., Romano, C., Thorin, S., Schvartz,
T., Dutrieux, É., Bocquenet, Y., 2019. Long-distance influence of the Rhône River plume
on the marine benthic ecosystem: Integrating descriptive ecology and predictive
modelling. Science of The Total Environment 673, 790–809.
Martín-Vide, J.P., Ferrer-Boix, C., Ollero, A., 2010. Incision due to gravel mining: Modeling
a case study from the Gállego River, Spain. Geomorphology, Introduction to
Management of Large Rivers 117, 261–271.
Martín-Vide, J.P., Plana-Casado, A., Sambola, A., Capapé, S., 2015. Bedload transport in a
river confluence. Geomorphology 250, 15–28.
Matsubara, Y., Howard, A.D., 2014. Modeling planform evolution of a mud-dominated
meandering river: Quinn River, Nevada, USA. Earth Surface Processes and Landforms
39, 1365–1377.
Matsuda, I., 2009. River morphology and channel processes, in: Dooge, J.C.I. (Ed.), Fresh
Surface Water, Encyclopedia of Life Support Systems. EOLSS Publications/UNESCO,
Oxford, UK, pp. 299–309.
McLean, D.G., Church, M., Tassone, B., 1999. Sediment transport along lower Fraser River:
1. Measurements and hydraulic computations. Water Resources Research 35, 2533–
2548.
Meert, P., Pereira, F., Willems, P., 2018. Surrogate modeling-based calibration of
hydrodynamic river model parameters. Journal of Hydro-environment Research 19, 56–
67.
Meng, B., Liu, J., Bao, K., Sun, B., 2019. Water fluxes of Nenjiang River Basin with
ecological network analysis: Conflict and coordination between agricultural
development and wetland restoration. Journal of Cleaner Production 213, 933–943.
Meyer-Peter, E., Muller, R., 1948. Formulas for Bed Load Transport. Proc. 2nd. Meet., Int.
Assoc. Hydraul. Res., Stockholm, 3, 39–64.

119
Mezősi, G., 2017. The Physical Geography of Hungary. Springer International Publishing,
Switzerland.
Mezősi, G., 1987. Regulation of the Tisza. In: Hillslope experiments and geomorphological
problems of big rivers (pp. 111–120). Geographical Reseach Institute, Hungarian
Academy of Sciences.
Micheli, E.R., Kirchner, J.W., 2002. Effects of wet meadow riparian vegetation on
streambank erosion. 2. Measurements of vegetated bank strength and consequences for
failure mechanics. Earth Surface Processes and Landforms 27, 687–697.
Millar, R.G., 2000. Influence of bank vegetation on alluvial channel patterns. Water
Resources Research 36, 1109–1118.
Mirza, M. M. Q., Warrick, R., Ericksen, N., 2003. The implications of climate change on
floods of the Ganges, Brahmaputra and Meghna rivers in Bangladesh. Climatic Change,
57(3), 287–318.
Mitchell, S.B., Couperthwaite, J.S., West, J.R., Lawler, D.M., 1999. Dynamics of erosion and
deposition events on an intertidal mudbank at Burringham, River Trent, UK.
Hydrological Processes 13, 1155–1166.
Montgomery, D.R., Buffington, J.M., 1998. Channel processes, classification, and response,
In: Naiman, R.J., Bilby, R.E. (Eds.), River Ecology and Management: Lessons from the
Pacific Coastal Ecoregion. Springer, New York, NY., pp. 13–42.
Moody, J.A., 2019. Dynamic relations for the deposition of sediment on floodplains and point
bars of a freely-meandering river. Geomorphology 327, 585–597.
Morais, E.S., Rocha, P.C., Hooke, J., 2016. Spatiotemporal variations in channel changes
caused by cumulative factors in a meandering river: The lower Peixe River, Brazil.
Geomorphology 273, 348–360.
Mosselman, E., 1995. A review of mathematical models of river planform changes. Earth
Surface Processes and Landforms 20, 661–670.
Motta, D., Langendoen, E.J., Abad, J.D., García, M.H., 2014. Modification of meander
migration by bank failures. Journal of Geophysical Research: Earth Surface 119, 1026–
1042.
Murgatroyd, A.L., Ternan, J.L., 1983. The impact of afforestation on stream bank erosion and
channel form. Earth Surface Processes and Landforms 8, 357–369.
Mutton, D., Haque, C.E., 2004. Human Vulnerability, Dislocation and Resettlement:
Adaptation Processes of River-bank Erosion-induced Displacees in Bangladesh.
Disasters 28, 41–62.
Nagata, N., Hosoda, T., Muramoto, Y., 2000. Numerical Analysis of River Channel Processes
with Bank Erosion. Journal of Hydraulic Engineering 126, 243–252.
Nagata, T., Watanabe, Y., Yasuda, H., Ito, A., 2014. Development of a meandering channel
caused by the planform shape of the river bank. Earth Surface Dynamics 2, 255–270.
Nakagawa, H., Zhang, H., Baba, Y., Kawaike, K., Teraguchi, H., 2013. Hydraulic
characteristics of typical bank-protection works along the Brahmaputra/Jamuna River,
Bangladesh. Journal of Flood Risk Management 6, 345–359.
Nanson, G.C., 1980. Point bar and floodplain formation of the meandering Beatton River,
northeastern British Columbia, Canada. Sedimentology 27, 3–29.
Nagy, J., Kiss, T., 2016. Hydrological and Morphological Changes of the Lower Danube Near
Mohács, Hungary. Journal of Environmental Geography, 9(1–2), 1–6.
Nagy, J., Fiala, K., Blanka, V., Sipos, G., Kiss, T., 2017. Hullámtéri feltöltődés mértéke és
árvizek közötti kapcsolat az Alsó-Tiszán. Földrajzi Közlemények, 141(1), 44–59.
Nardi, L., Rinaldi, M., 2015. Spatio-temporal patterns of channel changes in response to a
major flood event: The case of the Magra River (central–northern Italy). Earth Surface
Processes and Landforms, 40(3), 326–339.
Neal, E.G., 2009. Channel Incision and Water-Table Decline Along a Recently Formed
Proglacial Stream, Mendenhall Valley, Southeastern Alaska (Professional Paper No.
1760- E). U.S. Geological Survey, Reston, Virginia.
Nelson, N.C., Erwin, S.O., Schmidt, J.C., 2013. Spatial and temporal patterns in channel
change on the Snake River downstream from Jackson Lake dam, Wyoming.
120
Geomorphology, The Field Tradition in Geomorphology 43rd Annual Binghamton
Geomorphology Symposium, held 21-23 September 2012 in Jackson, Wyoming USA
200, 132–142.
Nicoll, T.J., Hickin, E.J., 2010. Planform geometry and channel migration of confined
meandering rivers on the Canadian prairies. Geomorphology 116, 37–47.
Nijssen, B., Lettenmaier, D.P., Liang, X., Wetzel, S.W., Wood, E.F., 1997. Streamflow
simulation for continental-scale river basins. Water Resources Research 33, 711–724.
Nijssen, B., O’Donnell, G. M., Hamlet, A. F., Lettenmaier, D. P., 2001. Hydrologic
Sensitivity of Global Rivers to Climate Change. Climatic Change, 50(1), 143–175.
O’Neal, M.A., Pizzuto, J.E., 2011. The rates and spatial patterns of annual riverbank erosion
revealed through terrestrial laser-scanner surveys of the South River, Virginia. Earth
Surface Processes and Landforms 36, 695–701.
Osei, N. A., Harvey, G. L., Gurnell, A. M., 2015. The early impact of large wood introduction
on the morphology and sediment characteristics of a lowland river. Limnologica, 54, 33–
43.
Oskin, M.E., Burbank, D.W., Phillips, F.M., Marrero, S.M., Bookhagen, B., Selander, J.A.,
2014. Relationship of channel steepness to channel incision rate from a tilted and
progressively exposed unconformity surface. Journal of Geophysical Research: Earth
Surface 119, 366–384.
Ouyang, Y., Leininger, T.D., Moran, M., 2013. Impacts of reforestation upon sediment load
and water outflow in the Lower Yazoo River Watershed, Mississippi. Ecological
Engineering 61, 394–406.
Palmer, M., Bernhardt, E., Chornesky, E., Collins, S., Dobson, A., Duke, C., Gold, B.,
Jacobson, R., Kingsland, S., Kranz, R., Mappin, M., Martinez, M. L., Micheli, F., Morse,
J., Pace, M., Pascual, M., Palumbi, S., Reichman, O. J., Simons, A., … Turner, M., 2004.
Ecology for a Crowded Planet. Science, 304(5675), 1251–1252.
Panday, P.K., Coe, M.T., Macedo, M.N., Lefebvre, P., Castanho, A.D. de A., 2015.
Deforestation offsets water balance changes due to climate variability in the Xingu River
in eastern Amazonia. Journal of Hydrology 523, 822–829.
Parker, G., Andres, D., 1976. Detrimental effects of river channelization. In: Rivers’76, Proc.
Symp. On Inland Waterways for Navigation, Flood Control and Water Diversions; 3rd
Annual Symp. Of The WA 2, New York, ASCE, 1248–1266.
Petit, F., Poinsart, D., Bravard, J.-P., 1996. Channel incision, gravel mining and bedload
transport in the Rhône river upstream of Lyon, France (“canal de Miribel”). CATENA
26, 209–226.
Petts, G. E., 1979. Complex response of river channel morphology subsequent to reservoir
construction: Progress in Physical Geography: Earth and Environment, 3(3), 329–362.
Petts, G., Gurnell, A., 2013. Hydrogeomorphic Effects of Reservoirs, Dams, and Diversions,
in: Treatise on Geomorphology. Elsevier, pp. 96–114.
Petts, G. E., Moeller, H., Roux, A. L., 1989. Historical change of large alluvial rivers: Western
Europe. John Wiley and Sons, Chichester.
Pfeiffer, A.M., Finnegan, N.J., Willenbring, J.K., 2017. Sediment supply controls equilibrium
channel geometry in gravel rivers. Proceedings of the National Academy of Sciences
114, 3346.
Phillips, J. D., 1999. Earth Surface Systems: Complexity, Order and Scale. Wiley-Blackwell,
UK.
Phillips, J. D., 1992. Nonlinear dynamical systems in geomorphology: Revolution or
evolution? Geomorphology, 5(3), 219–229.
Picco, L., Comiti, F., Mao, L., Tonon, A., Lenzi, M.A., 2017. Medium and short term riparian
vegetation, island and channel evolution in response to human pressure in a regulated
gravel bed river (Piave River, Italy). CATENA, Geoecology in Mediterranean mountain
areas. Tribute to Professor José María García Ruiz 149, 760–769.
Piégay, H., Cuaz, M., Javelle, E., Mandier, P., 1997. Bank erosion management based on
geomorphological, ecological and economic criteria on the Galaure River, France.
Regulated Rivers: Research & Management 13, 433–448.
121
Pinke, Z., 2014. Modernization and decline: An eco-historical perspective on regulation of
the Tisza Valley, Hungary. Journal of Historical Geography, 45, 92–105.
Pinter, N., Heine, R. A., 2005. Hydrodynamic and morphodynamic response to river
engineering documented by fixed-discharge analysis, Lower Missouri River, USA.
Journal of Hydrology, 302(1), 70–91.
Piqué, G., Batalla, R.J., Sabater, S., 2016. Hydrological characterization of dammed rivers in
the NW Mediterranean region. Hydrological Processes 30, 1691–1707.
Pizzuto, J.E., 2016. Modelling fluvial morphodynamics, in: Kondolf, G.M., Piégay, H. (Eds.),
Tools in Fluvial Geomorphology. John Wiley and Sons, Ltd, pp. 442–455.
Posner, A.J., Duan, J.G., 2012. Simulating river meandering processes using stochastic bank
erosion coefficient. Geomorphology, Meandering Channels 163–164, 26–36.
Potyondy, J. P., Bunte, K., Abt, S. R., Swingle, K. W., 2010. Bedload movement in mountain
channels: Insights gained from use of portable bedload traps. In: Proc. 4th Fed.
Interagency Hydrol. Model. Conf. and 9th Fed. Interagency Sediment. Conf.
Powell, D.M., 2014. Flow resistance in gravel-bed rivers: Progress in research. Earth-Science
Reviews 136, 301–338.
Prosser, I.P., Hughes, A.O., Rutherfurd, I.D., 2000. Bank erosion of an incised upland channel
by subaerial processes: Tasmania, Australia. Earth Surface Processes and Landforms
25, 1085–1101.
Provansal, M., Dufour, S., Sabatier, F., Anthony, E.J., Raccasi, G., Robresco, S., 2014. The
geomorphic evolution and sediment balance of the lower Rhône River (southern France)
over the last 130years: Hydropower dams versus other control factors. Geomorphology
219, 27–41.
Pyrce, R.S., Ashmore, P.E., 2005. Bedload path length and point bar development in gravel-
bed river models. Sedimentology 52, 839–857.
Rakonczai, J., Kozák, P., 2011. The consequences of human impacts on Hungarian river
basins. Zeitschrift Für Geomorphologie, Supplementary Issues, 55(1), 95–107.
Restrepo, J.D., Kettner, A.J., Syvitski, J.P.M., 2015. Recent deforestation causes rapid
increase in river sediment load in the Colombian Andes. Anthropocene 10, 13–28.
Richards, K.S., 1982. Rivers: form and process in alluvial channels. Methuen, London and
New York.
Rickenmann, D., Turowski, J.M., Fritschi, B., Klaiber, A., Ludwig, A., 2012. Bedload
transport measurements at the Erlenbach stream with geophones and automated basket
samplers. Earth Surface Processes and Landforms 37, 1000–1011.
Righter, K., Caffee, M., Rosas-Elguera, J., Valencia, V., 2010. Channel incision in the Rio
Atenguillo, Jalisco, Mexico, defined by 36Cl measurements of bedrock. Geomorphology
120, 279–292.
Rinaldi, M., 2003. Recent channel adjustments in alluvial rivers of Tuscany, central Italy.
Earth Surface Processes and Landforms, 28(6), 587–608.
Rinaldi, M., Casagli, N., Dapporto, S., Gargini, A., 2004. Monitoring and modelling of pore
water pressure changes and riverbank stability during flow events. Earth Surface
Processes and Landforms 29, 237–254.
Rinaldi, M., Mengoni, B., Luppi, L., Darby, S.E., Mosselman, E., 2008. Numerical simulation
of hydrodynamics and bank erosion in a river bend. Water Resources Research 44,
W09428.
Rinaldi, M., Simon, A., 1998. Bed-level adjustments in the Arno River, central Italy.
Geomorphology 22, 57–71.
Rinaldi, M., Wyżga, B., Surian, N., 2005. Sediment mining in alluvial channels: physical
effects and management perspectives. River Research and Applications 21, 805–828.
Roberge, M., 2002. Human Modification of the Geomorphically Unstable Salt River in
Metropolitan Phoenix. The Professional Geographer 54, 175–189.
Robert, A., 2003. River Processes: An Introduction to Fluvial Dynamics. Hodder Arnold,
London.

122
Robert, A., 1997. Characteristics of velocity profiles along riffle-pool sequences and
estimates of bed shear stress. Geomorphology, 19(1), 89–98. Rosgen, D.L., 1994. A
classification of natural rivers. CATENA 22, 169–199.
Rottner, J., 1959. A formula for bed-load transportation. La Houille Blanche, 14(3), 285–307.
Rusnák, M., Lehotský, M., Kidová, A., 2016. Channel migration inferred from aerial
photographs, its timing and environmental consequences as responses to floods: A case
study of the meandering Topľa River, Slovak Carpathians. Moravian Geographical
Reports 24, 32–43.
Ryan, S.E., Porth, L.S., 1999. A field comparison of three pressure-difference bedload
samplers. Geomorphology 30, 307–322.
Salik, K.M., Hashmi, M.Z.-R., Ishfaq, S., Zahdi, W.-Z., 2016. Environmental flow
requirements and impacts of climate change-induced river flow changes on ecology of
the Indus Delta, Pakistan. Regional Studies in Marine Science 7, 185–195.
Sanchis-Ibor, C., Segura-Beltrán, F., Almonacid-Caballer, J., 2017. Channel forms recovery
in an ephemeral river after gravel mining (Palancia River, Eastern Spain). CATENA 158,
357–370.
Sàndor, A., Kiss, T., 2008. Floodplain aggradation caused by the high magnitude flood of
2006 in the Lower Tisza Region, Hungary. Journal of Environmental Geography, 1(1–
2), 31–39.
Sankalp, S., Khatua, Kishanjit.K., Pradhan, A., 2015. Boundary Shear Stress Analysis in
Meandering Channels at the Bend Apex. Aquatic Procedia, International Conference on
Water Resources, Coastal and Ocean Engineering (ICWRCOE’15) 4, 812–818.
Schielen, R.M.J., Blom, A., 2018. A reduced complexity model of a gravel-sand river
bifurcation: Equilibrium states and their stability. Advances in Water Resources 121, 9–
21.
Schumm, S. A., 1985. Patterns of Alluvial Rivers. Annual Review of Earth and Planetary
Sciences, 13(1), 5–27.
Schumm, S. A., 1977. The fluvial system. John Wiley and Sons, Chichester.
Schumm, S. A., 1963. Sinuosity of Alluvial Rivers on the Great Plains. GSA Bulletin, 74(9),
1089–1100. Scott, M.L., Lines, G.C., Auble, G.T., 2000. Channel incision and patterns
of cottonwood stress and mortality along the Mojave River, California. Journal of Arid
Environments 44, 399–414.
Schuurman, F., Shimizu, Y., Iwasaki, T., Kleinhans, M.G., 2016. Dynamic meandering in
response to upstream perturbations and floodplain formation. Geomorphology 253, 94–
109.
Schweitzer, F., 2009. Strategy or disaster. Flood Prevention Related Issues and Actions in the
Tisza River Basin. Hungarian Geographical Bulletin, 58(1), 3–17.
Schwenk, J., Lanzoni, S., Foufoula‐Georgiou, E., 2015. The life of a meander bend:
Connecting shape and dynamics via analysis of a numerical model. Journal of
Geophysical Research: Earth Surface 120, 690–710.
Shields, F. D., 1991. Woody Vegetation and Riprap Stability Along the Sacramento River
Mile 84.5–1191. JAWRA Journal of the American Water Resources Association, 27(3),
527–536.
Shields, F.D., Knight, S.S., Cooper, C.M., 1994. Effects of channel incision on base flow
stream habitats and fishes. Environmental Management 18, 43–57.
Shields, F.D., Lizotte, R.E., Knight, S.S., Cooper, C.M., Wilcox, D., 2010. The stream
channel incision syndrome and water quality. Ecological Engineering 36, 78–90.
Sidiropoulos, E., Papalaskaris, T., Hrissanthou, V., 2018. Parameter Optimization of a Bed
Load Transport Formula for Nestos River, Greece. Proceedings 2, 627.
Simon, A., 1992. Energy, time, and channel evolution in catastrophically disturbed fluvial
systems. Geomorphology, Proceedings 23rd Binghamton Symposium in
Geomorphology 5, 345–372.
Simon, A., 1989. A model of channel response in disturbed alluvial channels. Earth Surface
Processes and Landforms 14, 11–26.
123
Simon, A., Curini, A., Darby, S.E., Langendoen, E.J., 2000. Bank and near-bank processes in
an incised channel. Geomorphology 35, 193–217.
Simon, A., Doyle, M., Kondolf, M., Shields, F.D., Rhoads, B., McPhillips, M., 2007. Critical
Evaluation of How the Rosgen Classification and Associated “Natural Channel Design”
Methods Fail to Integrate and Quantify Fluvial Processes and Channel Response1.
JAWRA Journal of the American Water Resources Association 43, 1117–1131.
Simon, A., Rinaldi, M., 2006. Disturbance, stream incision, and channel evolution: The roles
of excess transport capacity and boundary materials in controlling channel response.
Geomorphology, 37th Binghamton Geomorphology Symposium 79, 361–383.
Singh, I.B., 1972. On the bedding in the natural-levee and the point-bar deposits of the Gomti
river, Uttar Pradesh, India. Sedimentary Geology 7, 309–317.
Sipos, G., Kiss, T., 2004. Island development and morphological stability on the lowland
reach of River Maros, Hungary. Geomorphologia Slovaca, 4(1), 52–62.
Sipos, G., Kiss, T., Fiala, K., 2008. Changes of cross-sectional morphology and channel
capacity during an extreme flood event, Lower Tisza and Maros Rivers, Hungary.
Journal of Environmental Geography, 1(1), 41–51.
Sipos, G., Kiss, T., Fiala, K., 2007. Morphological alterations due to channelization along the
lower Tisza and Maros rivers (Hungary). Geogr. Fis. Dinam. Quat., 30, 239–247.
Sipos, G., Právetz, T., Katona, O., Ardelean, F., Timofte, F., Onaca, A., Kiss, T., Kovács, F.,
Tobak, Z., 2012. The ever changing river. In G. Sipos (Ed.), Past, present, future of the
Maros/Mureş River (pp. 179–192). Department of Physical Geography and
Geoinformatics, University of Szeged.
Sklar, L.S., Dietrich, W.E., 2004. A mechanistic model for river incision into bedrock by
saltating bed load. Water Resources Research 40, W06301.
Sklar, L.S., Dietrich, W.E., 2001. Sediment and rock strength controls on river incision into
bedrock. Geology 29, 1087–1090.
Slattery, M.C., Burt, T.P., 1995. Size characteristics of sediment eroded from agricultural
soil: dispersed versus non-dispersed, ultimate versus effective, in: Hickin, E.J. (Ed.),
River Geomorphology, International Association of Geomorphologists. John Wiley and
Sons, Chichester, pp. 1–17.
Slaymaker, O., Spencer, T., Embleton-Hamann, C. (Eds.), 2009. Geomorphology and Global
Environmental Change. Cambridge University Press, UK.
Smith, L.M., Winkley, B.R., 1996. The response of the Lower Mississippi River to river
engineering. Engineering Geology 45, 433–455.
Snyder, N. P., Whipple, K. X., Tucker, G. E., Merritts, D. J., 2003. Importance of a stochastic
distribution of floods and erosion thresholds in the bedrock river incision problem.
Journal of Geophysical Research: Solid Earth, 108(B2).
Somogyi, S., 1983. River-section types of the Hungarian river network (A magyar
folyóhálózat szakaszjellegtípusai). Földrajzi Közlemények, 31(1–2), 220–229.
Somogyi, S., 1979. Regulated rivers in Hungary. Geographica Polonica, 41, 39–53.
Srisunthon, P., Choowong, M., 2019. Quaternary meandering evolution and architecture of a
point bar in the Mun River on the sandstone-dominated Khorat Plateau from northeastern
Thailand. Quaternary International 525, 25–35.
Stanford, J. A., Ward, J. V., 1993. An Ecosystem Perspective of Alluvial Rivers: Connectivity
and the Hyporheic Corridor. Journal of the North American Benthological Society,
12(1), 48–60.
Steiger, J., James, M., Gazelle, F., 1998. Channelization and consequences on floodplain
system functioning on the Garonne River, SW France. Regulated Rivers: Research and
Management, 14(1), 13–23.
Sterling, S.M., Church, M., 2002. Sediment trapping characteristics of a pit trap and the
Helley-Smith sampler in a cobble gravel bed river. Water Resources Research 38, 19-1-
19–11.
Stoesser, T., Ruether, N., Olsen, N.R.B., 2010. Calculation of primary and secondary flow
and boundary shear stresses in a meandering channel. Advances in Water Resources 33,
158–170.

124
Sun, T., Meakin, P., Jøssang, T., 2001. A computer model for meandering rivers with multiple
bed load sediment sizes: 1. Theory. Water Resources Research 37, 2227–2241.
Surian, N., 1999. Channel changes due to river regulation: The case of the Piave River, Italy.
Earth Surface Processes and Landforms, 24(12), 1135–1151.
Surian, N., Mao, L., Giacomin, M., Ziliani, L., 2009. Morphological effects of different
channel-forming discharges in a gravel-bed river. Earth Surface Processes and
Landforms 34, 1093–1107.
Surian, N., Rinaldi, M., 2003. Morphological response to river engineering and management
in alluvial channels in Italy. Geomorphology, 50(4), 307–326.
Szlávik, L., 2001. A Tisza-völgy árvízvédelme és fejlesztése (Flood control and development
in the Tisza Valley). In: Dormány G., Kovács F., Péti M., Rakonczai J. (Eds.),
Proceedings of Geographical Conference, Department of Physical Geography and
Geoinformatics, University of Szeged, Szeged.
Szlávik, L., 2000. Az Alföld árvízi veszélyeztetettsége (Flood hazard in the Great Hungarian
Plain). A Víz Szerepe És Jelentosége (Role and Significance of Water in the Great
Hungarian Plain), Nagyalföld Alapítvány, Békéscsaba.
Thodsen, H., 2007. The influence of climate change on stream flow in Danish rivers. Journal
of Hydrology, 333(2), 226–238.
Thompson, D. M., 2018. Pool–Riffle Sequences. In Reference Module in Earth Systems and
Environmental Sciences. Elsevier, Amsterdam.
Thompson, D.M., Puklin, L.S., Marshall, A.E., 2016. The long-term impact of channel
stabilization using gabion structures on Zealand River, New Hampshire. Ecological
Engineering 95, 779–792.
Thorne, C.R., 1991. Bank erosion and meander migration of the Red and Mississippi Rivers,
USA. Hydrology for the Water Management of Large River Basins (Proceedings of the
Vienna Symposium), 301–313.
Thorne, C. R., Tovey, N. K., 1981. Stability of composite river banks. Earth Surface
Processes and Landforms, 6(5), 469–484.
Tiron Dutu, L., Dutu, F., Secrieru, D., Opreanu, G., 2019. Sediments grain size and geo-
chemical interpretation of three successive cutoff meanders of the Danube Delta,
Romania. Geochemistry 79, 399–407.
Tooth, S., Nanson, G. C., 2000. Equilibrium and Non-Equilibrium Conditions in Dryland
Rivers. Physical Geography, 21(3), 183–211.
Topping, D.J., Mueller, E.R., Schmidt, J.C., Griffiths, R.E., Dean, D.J., Grams, P.E., 2018.
Long-Term Evolution of Sand Transport Through a River Network: Relative Influences
of a Dam Versus Natural Changes in Grain Size from Sand Waves. Journal of
Geophysical Research: Earth Surface 123, 1879–1909.
Török, I., 1977. A Maros alföldi szakaszának szabályozási terve (Regulation plan of the
lowland section of River Maros). ATIVIZIG, Szeged.
Trueheart, M.E., Dewoolkar, M.M., Rizzo, D.M., Huston, D., Bomblies, A., 2020. Simulating
hydraulic interdependence between bridges along a river corridor under transient flood
conditions. Science of The Total Environment 699, 134046.
Tubino, M., Seminara, G., 1990. Free–forced interactions in developing meanders and
suppression of free bars. Journal of Fluid Mechanics 214, 131–159.
Turowski, J.M., Rickenmann, D., Dadson, S.J., 2010. The partitioning of the total sediment
load of a river into suspended load and bedload: a review of empirical data.
Sedimentology 57, 1126–1146.
Twidale, C.R., 2004. River patterns and their meaning. Earth-Science Reviews 67, 159–218.
Twidale, C. R., Campbell, E. M., 2005. Australian Landforms: Understanding a Low, Flat,
Arid and Old Landscape. Rosenberg Publishing, Australia.
Urdea, P., Sipos, G., Kiss, T., Onaca, A., 2012. The Maros/Mureş. In G. Sipos (Ed.), Past,
present, future of the Maros/Mureş River (pp. 159–166). Department of Physical
Geography and Geoinformatics, University of Szeged.

125
Vágás, I., 1982. A Tisza árvizei. Vízügyi Dokumentációs és Továbbképző Intézet,
Budapest.van den Berg, J. H., 1995. Prediction of alluvial channel pattern of perennial
rivers. Geomorphology, 12(4), 259–279.
van Rijn, L. C., 1986. Manual sediment transport measurements. Delft Hydraulics
Laboratory, Delft, The Netherlands.
van Rijn, L.C., Hans, R., 2019. Definitions, processes and models in morphology. URL
http://www.coastalwiki.org/wiki/Definitions,_processes_and_models_in_morphology
(accessed 8.11.19).
Vargas-Luna, A., Crosato, A., Byishimo, P., Uijttewaal, W.S.J., 2019. Impact of flow
variability and sediment characteristics on channel width evolution in laboratory
streams. Journal of Hydraulic Research 57, 51–61.
Vargas‐Luna, A., Duró, G., Crosato, A., Uijttewaal, W., 2019. Morphological Adaptation of
River Channels to Vegetation Establishment: A Laboratory Study. Journal of
Geophysical Research: Earth Surface 124, 1981–1995.
Vázquez-Tarrío, D., Menéndez-Duarte, R., 2014. Bedload transport rates for coarse-bed
streams in an Atlantic region (Narcea River, NW Iberian Peninsula). Geomorphology
217, 1–14.
Vericat, D., Batalla, R.J., 2010. Sediment transport from continuous monitoring in a perennial
Mediterranean stream. CATENA 82, 77–86.
Vericat, D., Batalla, R.J., 2006. Sediment transport in a large impounded river: The lower
Ebro, NE Iberian Peninsula. Geomorphology, Sediment and Geochemical Budgets 79,
72–92.
Vericat, D., Church, M., Batalla, R. J., 2006. Bed load bias: Comparison of measurements
obtained using two (76 and 152 mm) Helley-Smith samplers in a gravel bed river. Water
Resources Research, 42(1), W01402.
Wakelin-King, G.A., Webb, J.A., 2007. Upper-Flow-Regime Mud Floodplains, Lower-Flow-
Regime Sand Channels: Sediment Transport and Deposition in a Drylands Mud-
Aggregate River. Journal of Sedimentary Research 77, 702–712.
Wallick, J.R., Lancaster, S.T., Bolte, J.P., 2006. Determination of bank erodibility for natural
and anthropogenic bank materials using a model of lateral migration and observed
erosion along the Willamette River, Oregon, USA. River Research and Applications 22,
631–649.
Wang, B., Xu, Y. J., 2018. Decadal-Scale Riverbed Deformation and Sand Budget of the Last
500 km of the Mississippi River: Insights into Natural and River Engineering Effects on
a Large Alluvial River. Journal of Geophysical Research: Earth Surface, 123(5), 874–
890.
Wang, B., Xu, Y.J., 2016. Long-term geomorphic response to flow regulation in a 10-km
reach downstream of the Mississippi–Atchafalaya River diversion. Journal of
Hydrology: Regional Studies 8, 10–25.
Wang, D., Ma, Y., Liu, X., Huang, H.Q., Huang, L., Deng, C., 2019. Meandering-
anabranching river channel change in response to flow-sediment regulation: Data
analysis and model validation. Journal of Hydrology 579, 124209.
Wang, H., Yang, Z., Saito, Y., Liu, J.P., Sun, X., Wang, Y., 2007. Stepwise decreases of the
Huanghe (Yellow River) sediment load (1950–2005): Impacts of climate change and
human activities. Global and Planetary Change 57, 331–354.
Wang, L., Melville, B.W., Whittaker, C.N., Guan, D., 2018. Effects of a downstream
submerged weir on local scour at bridge piers. Journal of Hydro-environment Research
20, 101–109.
Wang, S., Fu, B., Liang, W., Liu, Y., Wang, Y., 2017. Driving forces of changes in the water
and sediment relationship in the Yellow River. Science of The Total Environment 576,
453–461.
Watson, C.C., Biedenharn, D.S., Bledsoe, B.P., 2007. Use of Incised Channel Evolution
Models in Understanding Rehabilitation Alternatives1. JAWRA Journal of the American
Water Resources Association 38, 151–160.
126
Weatherly, H., Jakob, M., 2014. Geomorphic response of Lillooet River, British Columbia,
to meander cutoffs and base level lowering. Geomorphology, 217, 48–60.
Weisscher, S.A.H., Shimizu, Y., Kleinhans, M.G., 2019. Upstream perturbation and
floodplain formation effects on chute-cutoff-dominated meandering river pattern and
dynamics. Earth Surface Processes and Landforms 44, 2156–2169.
Wentworth, C.K., 1922, A scale of grade and class terms for clastic sediments. Journal of
Geology 30, 377–392.
Whitney, J.W., Glancy, P.A., Buckingham, S.E., Ehrenberg, A.C., 2015. Effects of rapid
urbanization on streamflow, erosion, and sedimentation in a desert stream in the
American Southwest. Anthropocene 10, 29–42.
Williams, G.P., 1986. River meanders and channel size. Journal of Hydrology 88, 147–164.
Williams, G.P., Wolman, M.G., 1984. Downstream effects of dams on alluvial rivers
(Geological Survey Professional Paper No. 1286). USGS, Washington, USA.
Wohl, E. E., 2004. Disconnected Rivers: Linking Rivers to Landscapes. Yale University
Press, USA.
Wohl, E.E., Bledsoe, B.P., Jacobson, R.B., Poff, N.L., Rathburn, S.L., Walters, D.M., Wilcox,
A.C., 2015. The Natural Sediment Regime in Rivers: Broadening the Foundation for
Ecosystem Management. BioScience 65, 358–371.
Wong, M., Parker, G., 2006. Reanalysis and Correction of Bed-Load Relation of Meyer-Peter
and Müller Using Their Own Database. Journal of Hydraulic Engineering, 132(11),
1159–1168.
Woo, H.S., Julien, P.Y., Richardson, E.V., 1986. Washload and Fine Sediment Load. Journal
of Hydraulic Engineering 112, 541–545.
Wright, N., Crosato, A., 2011. 2.07 - The Hydrodynamics and Morphodynamics of Rivers,
in: Wilderer, P. (Ed.), Treatise on Water Science. Elsevier, Oxford, pp. 135–156.
Wu, C., Ullah, M.S., Lu, J., Bhattacharya, J.P., 2016. Formation of point bars through rising
and falling flood stages: Evidence from bar morphology, sediment transport and bed
shear stress. Sedimentology 63, 1458–1473.
Wyżga, B., 2007. A review on channel incision in the Polish Carpathian rivers during the 20th
century, in: Habersack, H., Piégay, H., Rinaldi, M. (Eds.), Developments in Earth
Surface Processes, Gravel-Bed Rivers VI: From Process Understanding to River
Restoration. Elsevier, pp. 525–553.
Xia, J., Li, T., Li, X., Zhang, X., Zong, Q., 2014. Daily Bank Erosion Rates in the Lower
Yellow River Before and After Dam Construction. JAWRA Journal of the American
Water Resources Association 50, 1325–1337.
Yang, C.T., 1977. The movement of sediment in rivers. Geophysical Surveys 3, 39–68.
Yang, C.T., 1971. On river meanders. Journal of Hydrology 13, 231–253.
Yang, C.T., Simões, F.J., 2005. Wash Load and Bed-Material Load Transport in the Yellow
River. Journal of Hydraulic Engineering 131, 413–418.
Yang, S.L., Li, H., Ysebaert, T., Bouma, T. J., Zhang, W. X., Wang, Y. Y., Li, P., Li, M.,
Ding, P. X., 2008. Spatial and temporal variations in sediment grain size in tidal
wetlands, Yangtze Delta: On the role of physical and biotic controls. Estuarine, Coastal
and Shelf Science, 77(4), 657–671.
Yang, S.L., Zhang, J., Zhu, J., Smith, J. P., Dai, S. B., Gao, A., Li, P., 2005. Impact of dams
on Yangtze River sediment supply to the sea and delta intertidal wetland response.
Journal of Geophysical Research: Earth Surface, 110, F03006.
Yang, X., Lu, X., Ran, L., Tarolli, P., 2019. Geomorphometric Assessment of the Impacts of
Dam Construction on River Disconnectivity and Flow Regulation in the Yangtze Basin.
Sustainability 11, 3427.
Yates, R., Waldron, B., Van Arsdale, R., 2003. Urban effects on flood plain natural hazards:
Wolf River, Tennessee, USA. Engineering Geology, 70, 1–15.
Ye, B., Yang, D., Kane, D. L., 2003. Changes in Lena River streamflow hydrology: Human
impacts versus natural variations. Water Resources Research, 39, 1200.
127
Yu, G.-A., Disse, M., Huang, H.Q., Yu, Y., Li, Z., 2016. River network evolution and fluvial
process responses to human activity in a hyper-arid environment – Case of the Tarim
River in Northwest China. CATENA 147, 96–109.
Yu, G.-A., Li, Z., Yang, H., Lu, J., Huang, H.Q., Yi, Y., 2020. Effects of riparian plant roots
on the unconsolidated bank stability of meandering channels in the Tarim River, China.
Geomorphology 351, 106958.
Zen, S., Zolezzi, G., Toffolon, M., Gurnell, A.M., 2016. Biomorphodynamic modelling of
inner bank advance in migrating meander bends. Advances in Water Resources,
Ecogeomorphological feedbacks of water fluxes, sediment transport and vegetation
dynamics in rivers and estuaries 93, 166–181.
Zhou, M., Xia, J., Deng, S., Lu, J., Lin, F., 2018. Channel adjustments in a gravel-sand bed
reach owing to upstream damming. Global and Planetary Change 170, 213–220.
Ziegler, A.D., Sidle, R.C., Phang, V.X.H., Wood, S.H., Tantasirin, C., 2014a. Bedload
transport in SE Asian streams—Uncertainties and implications for reservoir
management. Geomorphology, Tropical Rivers of South and South-east Asia: Landscape
evolution, morphodynamics and hazards 227, 31–48.
Ziegler, A.D., Sidle, R.C., Phang, V.X.H., Wood, S.H., Tantasirin, C., 2014b. Bedload
transport in SE Asian streams—Uncertainties and implications for reservoir
management. Geomorphology, Tropical Rivers of South and South-east Asia: Landscape
evolution, morphodynamics and hazards 227, 31–48.
Zolezzi, G., Luchi, R., Tubino, M., 2012. Modeling morphodynamic processes in meandering
rivers with spatial width variations. Reviews of Geophysics 50.
Zope, P. E., Eldho, T. I., Jothiprakash, V.,2016. Impacts of land use–land cover change and
urbanization on flooding: A case study of Oshiwara River Basin in Mumbai, India.
CATENA, 145, 142–154.

128
9. ABSTRACT
The Lower Tisza, like most lowland alluvial rivers has been altered by
engineering constructions including the construction of levees to protect settlements,
artificial meander cutoffs to improve its navigability, and the construction of revetment
and groynes to stabilize its banks. These human interventions in the river system have
had various impacts on the evolution of the river.
Although recent researches have sought to investigate the impacts of these
interventions, they have been rather limited to short sections of the river. To have
parametric connections between the changes at the various sections of the Lower Tisza,
this research covered the response of the entire Lower Tisza reach (89-km length) from
upstream of Csongrád to the Hungarian-Serbian border to various human interventions
which included artificial meander cutoff cutoffs and the construction of bank
stabilization (revetments and groynes). The influence of the planform (indicated by
sinuosity) on the changes in channel morphology were also analyzed. Thus, the
morphological evolution of the river was investigated from 1891 until 2017 using data
from hydrological surveys (1891, 1931, 1961, 1976, 1999 and 2017) and the
Hydrological Atlas (1976) of the Lower Tisza. Besides, to understand the short-term
changes in the in-channel processes, characteristic locations with different
morphological characteristics within the more sinuous middle section of the river were
selected, and the flow and bank processes measured. In the morphological evolution of
a meandering lowland river, the development of point-bars and bank erosion are critical
near-bank processes which indicate the sediment and hydraulic regime of the river
system; thus, reflect the equilibrium conditions of the river channel. Therefore, the
changes in elevation of the point-bars (between 2011 and 2019) at a freely developing
meander and a section with revetment on its opposite bank were therefore monitored
using a Topcon RTK GPS. Digital elevation models (DEM) were generated using
ArcGIS 10.3 for the point-bar data and analyzed. Similarly, the bank erosion (between
2011 and 2019) at three locations (two revetted sections and a naturally meandering
section) were also monitored using a Topcon RTK GPS. To understand the short-term
changes in the in-channel processes, the velocity and discharge of the river were
measured using a boat-mounted River Ray ADCP and GPS at four selected sites (three
revetted sections and a naturally meandering section). The measured velocity and
discharge data for different geomorphic units were analyzed using the WinRiver

129
software together with a DEM of the Lower Tisza which was produced from merging
airborne LiDAR and a high-frequency survey of the channel bathymetry. Furthermore,
the bedload sediment transport on the Maros at the Makó gauging station was also
monitored using a 76 mm-Helley-Smith sampler as part of the in-channel processes. At
the Makó gauging station which is operated and maintained by the ATIVIZIG, a
motorized monitoring station with a fixed-steel cable across the river section allow
sampling instruments to be moved at defined intervals along the river cross-section. An
ADCP was also used to measure the flow characteristics on sampling days. Thus,
bedload transport rate, the optimum sampling duration and the effects of both the
channel morphology and flow characteristics were analyzed. To be able to predict the
bedload transport of the Maros and the morphological evolution of the Lower Tisza,
six bedload formulae and the Delft3D model were used respectively.
The analysis of the results suggests, that from 1891 until 1961 there was channel
incision and narrowing of the Lower Tisza, while the mean cross-sectional area
increased in response to the artificial meander cutoffs as the channel proceeded towards
a quasi-equilibrium. Between 1961-1976, the construction of revetments to stop lateral
erosion which threatened the levees eliminated most active bars (areal reduction from
140 ha to 4 ha) and distorted the morphological evolution of the river. The overlap of
the initial evolution pattern with the effects of the revetments resulted in aggradation
within the channel and narrowing which caused a drastic reduction in the channel cross-
sectional area. However, in the subsequent period (1976-2017), the evolution of the
channel was controlled by the effects of the bank stabilization which resulted in channel
incision and an increase in channel cross-sectional area. Within the period however,
although the rate of increase was slower initially, it later increased with the highest
mean cross-sectional area occurring in 2017. The evolution pattern of the river suggests
that it will continue to increase its cross-sectional area to achieve a new equilibrium,
with the initially meandering river transforming into an ingrown meandering river.
The spatiality of geomorphic units and the presence of revetments influence the
velocity distribution in the Lower Tisza. The non-meandering revetted sections had
relatively more uniform velocity distributions, while the meandering sections did not.
However, while the freely meandering meander had the highest velocity distributions,
the revetted meander had the smallest. The flow characteristics at the revetted sections
were found to depend on the rate and type of revetment collapse. Within the studied
sites, although stepped-block revetments experienced no collapse, the placed-rock

130
revetment collapsed in two ways. The high velocities generated by the revetment
created conditions for intense incision which caused some revetments to collapse
through landslides. At the end of the placed-rock revetment, high erosivity of the
downstream section of the revetments coupled with the high incision caused the
collapse of the individual rocks of the revetments. Large pools developed in front of
the revetments, playing an important role in initiating their erosion which has an
upstream propagation. Currently, erosional processes dominate the river. At the point-
bars, their elevations decreased by 0.19-0.40 m, with the highest rates occurring on the
freely developing point-bar. The bank erosion rate differed based on the type of bank.
It was 0.6 m/y along the revetted section, while at a freely meandering section, it was
2.3 m/y. These intensive erosional processes refer to an incising meandering channel,
which must be considered during future planning of in-channel structures (e.g.
revetments, bridges), thus, geomorphic methods must be considered in any river
engineering scheme.
Although the morphological model could replicate the changes in the
morphology of the Tisza with in-channel incision and sedimentation along the banks,
further modelling is needed to adequately apply it in river management as complex
nature of the current state of the river with revetments could not be well modelled.
The bedload studies indicated 60 s as the optimum sampling duration for low
flow conditions which may change in different hydrological settings. The annual
bedload transport of the Maros from the measurement was ca. 350,000 t/y while the
estimated values ranged from ca. 460,000-2,900,000 t/y with the best estimate given
by the Bathurst formula. Although the estimation of the bedload transport rates showed
varied results for the different formula, the Bathurst equation yielded estimates within
20% of the bedload rates from sampling.
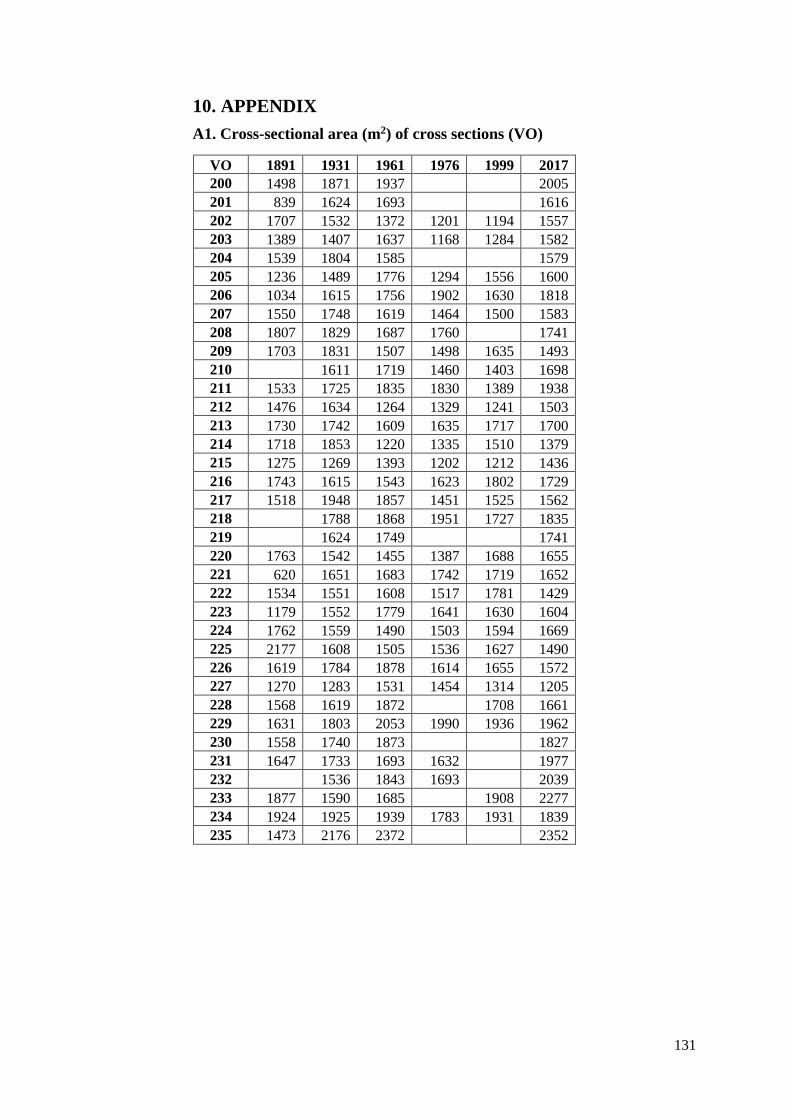
131
10. APPENDIX
A1. Cross-sectional area (m2) of cross sections (VO)
VO 1891 1931 1961 1976 1999 2017
200 1498 1871 1937 2005
201 839 1624 1693 1616
202 1707 1532 1372 1201 1194 1557
203 1389 1407 1637 1168 1284 1582
204 1539 1804 1585 1579
205 1236 1489 1776 1294 1556 1600
206 1034 1615 1756 1902 1630 1818
207 1550 1748 1619 1464 1500 1583
208 1807 1829 1687 1760 1741
209 1703 1831 1507 1498 1635 1493
210 1611 1719 1460 1403 1698
211 1533 1725 1835 1830 1389 1938
212 1476 1634 1264 1329 1241 1503
213 1730 1742 1609 1635 1717 1700
214 1718 1853 1220 1335 1510 1379
215 1275 1269 1393 1202 1212 1436
216 1743 1615 1543 1623 1802 1729
217 1518 1948 1857 1451 1525 1562
218 1788 1868 1951 1727 1835
219 1624 1749 1741
220 1763 1542 1455 1387 1688 1655
221 620 1651 1683 1742 1719 1652
222 1534 1551 1608 1517 1781 1429
223 1179 1552 1779 1641 1630 1604
224 1762 1559 1490 1503 1594 1669
225 2177 1608 1505 1536 1627 1490
226 1619 1784 1878 1614 1655 1572
227 1270 1283 1531 1454 1314 1205
228 1568 1619 1872 1708 1661
229 1631 1803 2053 1990 1936 1962
230 1558 1740 1873 1827
231 1647 1733 1693 1632 1977
232 1536 1843 1693 2039
233 1877 1590 1685 1908 2277
234 1924 1925 1939 1783 1931 1839
235 1473 2176 2372 2352
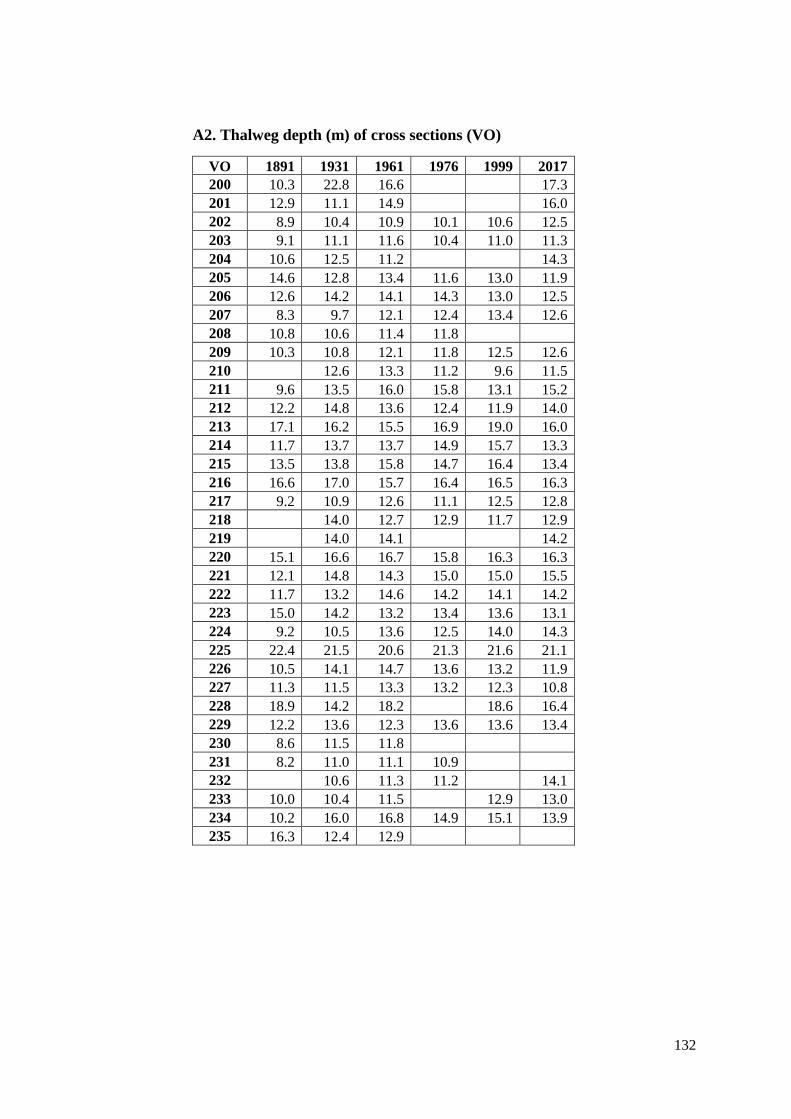
132
A2. Thalweg depth (m) of cross sections (VO)
VO 1891 1931 1961 1976 1999 2017
200 10.3 22.8 16.6 17.3
201 12.9 11.1 14.9 16.0
202 8.9 10.4 10.9 10.1 10.6 12.5
203 9.1 11.1 11.6 10.4 11.0 11.3
204 10.6 12.5 11.2 14.3
205 14.6 12.8 13.4 11.6 13.0 11.9
206 12.6 14.2 14.1 14.3 13.0 12.5
207 8.3 9.7 12.1 12.4 13.4 12.6
208 10.8 10.6 11.4 11.8
209 10.3 10.8 12.1 11.8 12.5 12.6
210 12.6 13.3 11.2 9.6 11.5
211 9.6 13.5 16.0 15.8 13.1 15.2
212 12.2 14.8 13.6 12.4 11.9 14.0
213 17.1 16.2 15.5 16.9 19.0 16.0
214 11.7 13.7 13.7 14.9 15.7 13.3
215 13.5 13.8 15.8 14.7 16.4 13.4
216 16.6 17.0 15.7 16.4 16.5 16.3
217 9.2 10.9 12.6 11.1 12.5 12.8
218 14.0 12.7 12.9 11.7 12.9
219 14.0 14.1 14.2
220 15.1 16.6 16.7 15.8 16.3 16.3
221 12.1 14.8 14.3 15.0 15.0 15.5
222 11.7 13.2 14.6 14.2 14.1 14.2
223 15.0 14.2 13.2 13.4 13.6 13.1
224 9.2 10.5 13.6 12.5 14.0 14.3
225 22.4 21.5 20.6 21.3 21.6 21.1
226 10.5 14.1 14.7 13.6 13.2 11.9
227 11.3 11.5 13.3 13.2 12.3 10.8
228 18.9 14.2 18.2 18.6 16.4
229 12.2 13.6 12.3 13.6 13.6 13.4
230 8.6 11.5 11.8
231 8.2 11.0 11.1 10.9
232 10.6 11.3 11.2 14.1
233 10.0 10.4 11.5 12.9 13.0
234 10.2 16.0 16.8 14.9 15.1 13.9
235 16.3 12.4 12.9

133
A3. Mean depth (m) of cross sections (VO)
VO 1891 1931 1961 1976 1999 2017
200 5.9 10.7 11.2 12.5
201 10.4 7.6 8.5 11.1
202 6.5 7.3 8.8 8.5 8.3 9.4
203 6.5 7.8 8.8 7.5 8.5 8.4
204 6.7 7.8 8.1 8.8
205 9.8 8.9 8.2 7.5 8.6 8.4
206 9.5 10.4 9.3 8.6 9.1 9.4
207 5.7 7.7 7.6 9.7 10.3 9.4
208 7.6 8.8 9.0 9.4 9.4
209 8.1 8.1 8.9 8.9 10.2 10.4
210 8.6 8.0 8.3 8.4 9.3
211 6.8 8.9 9.6 11.5 9.4 11.2
212 7.9 8.7 8.9 9.3 8.6 10.0
213 10.6 11.0 9.8 10.7 9.5
214 7.1 7.0 9.2 9.0 11.2 9.1
215 6.5 9.7 11.1 11.1 10.4 9.1
216 9.5 8.2 9.3 9.3 10.0 10.9
217 7.2 8.8 8.7 8.4 9.3 9.3
218 10.5 9.1 9.4 8.4 9.7
219 10.5 9.9 10.3
220 8.5 9.5 10.4 9.8 10.7 10.3
221 9.3 10.8 11.3 12.1 11.2 11.2
222 7.9 8.0 9.5 9.0 9.7 10.2
223 11.0 11.1 10.0 10.6 11.1 10.1
224 6.6 7.6 8.4 8.3 9.1 9.2
225 12.7 9.5 12.6 10.7 12.1 13.3
226 7.6 9.1 7.0 8.3 9.6 8.9
227 7.1 7.5 8.5 9.1 8.8 8.2
228 11.4 9.8 10.0 12.6 11.6
229 8.8 9.5 9.9 9.6 10.1 9.8
230 6.3 8.0 8.3 9.1
231 6.8 6.5 7.4 7.9 8.7
232 6.9 8.8 7.4 8.7
233 6.2 7.9 8.3 9.9 9.8
234 7.8 9.9 9.4 10.1 10.5 10.3
235 12.7 9.2 9.0 9.1

134
A4. Bankfull Width (m) of cross sections (VO)
VO 1891 1931 1961 1976 1999 2017
200 257.1 178.4 181.2 148.0
201 84.4 219.8 219.7 140.7
202 270.3 219.1 169.8 143.9 144.8 159.5
203 217.0 178.9 209.9 160.9 152.1 156.0
204 234.6 254.1 228.7 166.1
205 139.1 166.7 226.6 169.6 176.4 193.6
206 105.9 159.5 193.2 193.2 180.1 176.9
207 266.3 234.9 232.5 156.7 154.8 157.6
208 241.7 211.1 190.2 195.4 171.6
209 205.9 237.8 172.2 160.9 160.9 161.0
210 202.8 232.0 171.8 172.8 178.4
211 234.7 206.1 192.7 165.0 151.7 164.5
212 191.3 189.3 144.8 148.7 148.1 153.6
213 160.5 163.7 163.0 163.2 163.4 130.0
214 253.3 262.8 138.1 129.3 137.3 128.8
215 211.4 127.6 131.7 112.1 120.6 110.8
216 200.5 201.5 175.5 168.0 169.6 156.7
217 213.9 221.3 223.2 173.0 173.9 177.9
218 174.9 201.4 207.7 209.2 202.7
219 156.9 175.4 174.4
220 215.0 161.9 137.9 133.9 156.6 157.7
221 68.7 147.1 152.7 154.7 154.4 156.4
222 214.2 189.0 174.1 154.8 184.8 147.5
223 108.1 137.1 151.0 152.1 153.0 158.9
224 277.5 205.3 226.2 181.0 178.4 184.7
225 189.0 165.7 123.1 116.1 146.8 123.8
226 214.3 203.8 255.1 176.2 179.4 160.6
227 186.4 163.6 174.1 158.8 153.9 138.3
228 143.2 177.3 188.6 133.4 146.6
229 197.3 192.8 211.9 205.9 187.1 180.6
230 257.2 218.9 230.8 196.3
231 249.4 272.9 226.2 209.4 219.5
232 241.5 223.3 230.0 218.3
233 312.0 210.7 200.9 198.4 196.3
234 254.5 196.1 201.1 180.1 186.8 180.0
235 119.4 230.6 260.8 264.9
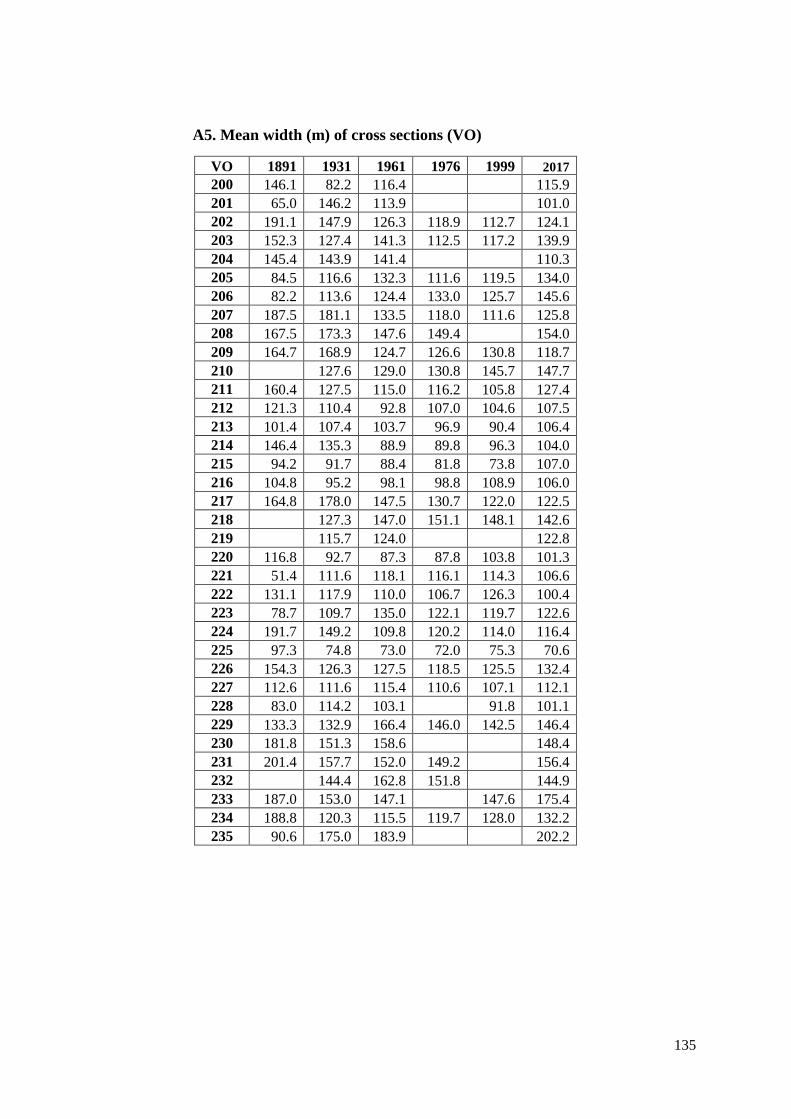
135
A5. Mean width (m) of cross sections (VO)
VO 1891 1931 1961 1976 1999 2017
200 146.1 82.2 116.4 115.9
201 65.0 146.2 113.9 101.0
202 191.1 147.9 126.3 118.9 112.7 124.1
203 152.3 127.4 141.3 112.5 117.2 139.9
204 145.4 143.9 141.4 110.3
205 84.5 116.6 132.3 111.6 119.5 134.0
206 82.2 113.6 124.4 133.0 125.7 145.6
207 187.5 181.1 133.5 118.0 111.6 125.8
208 167.5 173.3 147.6 149.4 154.0
209 164.7 168.9 124.7 126.6 130.8 118.7
210 127.6 129.0 130.8 145.7 147.7
211 160.4 127.5 115.0 116.2 105.8 127.4
212 121.3 110.4 92.8 107.0 104.6 107.5
213 101.4 107.4 103.7 96.9 90.4 106.4
214 146.4 135.3 88.9 89.8 96.3 104.0
215 94.2 91.7 88.4 81.8 73.8 107.0
216 104.8 95.2 98.1 98.8 108.9 106.0
217 164.8 178.0 147.5 130.7 122.0 122.5
218 127.3 147.0 151.1 148.1 142.6
219 115.7 124.0 122.8
220 116.8 92.7 87.3 87.8 103.8 101.3
221 51.4 111.6 118.1 116.1 114.3 106.6
222 131.1 117.9 110.0 106.7 126.3 100.4
223 78.7 109.7 135.0 122.1 119.7 122.6
224 191.7 149.2 109.8 120.2 114.0 116.4
225 97.3 74.8 73.0 72.0 75.3 70.6
226 154.3 126.3 127.5 118.5 125.5 132.4
227 112.6 111.6 115.4 110.6 107.1 112.1
228 83.0 114.2 103.1 91.8 101.1
229 133.3 132.9 166.4 146.0 142.5 146.4
230 181.8 151.3 158.6 148.4
231 201.4 157.7 152.0 149.2 156.4
232 144.4 162.8 151.8 144.9
233 187.0 153.0 147.1 147.6 175.4
234 188.8 120.3 115.5 119.7 128.0 132.2
235 90.6 175.0 183.9 202.2