Phase Transitions and Microstructure of Emulsion Systems ... transition of emulsions.pdf · Phase...
11
Phase Transitions and Microstructure of Emulsion Systems Prepared with Acylglycerols/Zinc Stearate Emulsifier Adam Macierzanka,* ,² Halina Szela ¸ g, ² Thomas Moschakis, ‡ and Brent S. Murray ‡ Department of the Technology of Fats and Detergents, Chemical Faculty, Gdan ˜ sk UniVersity of Technology, Narutowicza 11/12, 80-952 Gdan ˜ sk, Poland, and Procter Department of Food Science, UniVersity of Leeds, Leeds LS2 9JT, United Kingdom ReceiVed NoVember 1, 2005. In Final Form: January 4, 2006 The emulsification processes, during which acylglycerols/zinc stearate emulsifier, water, and oil phase formed ternary systems, such as water-in-oil (W/O) emulsions, oil-in-water (O/W) dispersions, and unstable oil-water mixtures, were investigated in order to characterize the progressive transformations of the dispersed systems. The type, structure, and phase transitions of the systems were found to be determined by temperature and water phase content. Crystallization of the emulsifier caused the destabilization and subsequent phase inversion of the emulsions studied, at a temperature of 60-61 °C. The observed destabilization was temporary and led, at lower temperature, to W/O emulsions, “O/W + O” systems, or O/W dispersions, depending on the water content. Simultaneous emulsification and cooling of 20-50 wt % water systems resulted in the formation of stable W/O emulsions that contained a number of large water droplets with dispersed oil globules inside them (“W/O + O/W/O”). In water-rich systems (60-80 wt % of water), crystallization of the emulsifier was found to influence the formation of crystalline vesicle structures that coexisted, in the external water phase, with globules of crystallized oil phase. Results of calorimetric, rheological, and light scattering experiments, for the O/W dispersions obtained, indicate the possible transition of a monostearoylglycerol-based R-crystalline gel phase to a coagel state, in these multicomponent systems. I. Introduction One of the most common emulsifiers for the stabilization of W/O emulsions is monoesters of glycerol and fatty acids (monoacylglycerols; MAGs). Usually, transesterification of hydrogenated natural oils/fats with glycerol (glycerolysis), or direct esterification of glycerol with fatty acids, are used to synthesize the mixture of mono- and diacylglycerols (typically 40-55% of MAG). The mixture contains also triacylglycerols. Upon further purification by molecular distillation, 90-95% MAG product can be prepared. 1,2 Both, mono/diacylglycerols and distilled MAGs are generally recognized as safe and can be used in many pharmaceuticals, food products, and cosmetic formulations. One very important feature of MAGs is their ability to form lyotropic liquid crystalline phases in the presence of water. 3-6 When distilled, saturated MAGs are mixed with water and heated to the Krafft temperature (T C ; defined as the melting point of the hydrocarbon chains 4 ), the so-called lamellar mesophase will be formed. In this phase, bimolecular lipid layers are separated by water, which penetrates into the planes of polar headgroups of the MAG molecules. Below T C , the mesophase transforms to the R-gel phase, in which MAG molecules are still aligned in individual bilayers, separated by water. However, the hydrocarbon chains are not still in a liquidlike state. Since the R-gel is not thermodynamically stable, it converts into the coagel phase (a network of platelike -crystals in water). A possible mechanism of the R-gelfcoagel conversion has been reported by Sein et al. 7 and van Duynhoven and co-workers. 8 In most emulsion systems, the concentration of emulsifier is usually not high enough to allow for the formation of multilamellar liquid-crystalline structures at the water-oil interface. As explained in the literature, 4,9 very hydrophilic emulsifiers (e.g., diacetyl tartaric acid ester of MAG, polysorbates or sodium dodecyl sulfate) form lamellar phases with neutral lipids and water. However, low-polar MAGs undergo a phase transition from lamellar to reversed hexagonal mesophases in the presence of triacylglycerols. As reported by Mele et al., 10 very stable W/O emulsions can be prepared by gradual dispersing water in the lamellar and reversed hexagonal phases, formed by glycerol monooleate-based systems. These authors reported that a glycerol monooleate/trioleate mass ratio ) 85/15 was optimal to form liquid crystalline phases first and then emulsions with high water content (up to about 80 wt %). MAGs used in commercial W/O emulsions (such as margarine) form a crystallized film at the surface of water droplets. This way a strong barrier against coalescence is produced. According to Patino et al., 11 interfacial crystallization of glycerol mono- palmitin, monoolein, and monolaurin, previously adsorbed at the oil-water interface, influences the reduction of the interfacial tension. Krog and Larsson 12 have postulated that crystallization * Corresponding author. E-mail: [email protected]. Telephone: +48 58 347 29 27. Fax: +48 58 347 26 94. ² Gdan ˜sk University of Technology. ‡ University of Leeds. (1) Zielinski, R. J. In Food Emulsifiers and their Applications; Hasenhuettl, G. L., Hartel, R. W., Eds.; Chapman & Hall: New York, 1997; Chapter 2. (2) Stauffer, C. E. In Fats in Food Technology; Rajah, K. K., Ed.; Sheffield Academic Press: Sheffield, U.K., 2002; Chapter 7. (3) Larsson, K. Zeit. Phys. Chem. Neue Folge 1967, 56, 173-198. (4) Krog, N. J. In Food Emulsions, 3rd ed.; Friberg, S. E., Larsson, K., Eds.; Marcel Dekker: New York, 1997; Chapter 4. (5) Krog, N. In Crystallization Processes in Fats and Lipid Systems; Garti, N., Sato, K., Eds.; Marcel Dekker: New York, 2001; Chapter 15. (6) Morley, W. G.; Tiddy, G. J. T. J. Chem. Soc., Faraday Trans. 1993, 89, 2823-2831. (7) Sein, A.; Verheij, J. A.; Agterof, G. M. J. Colloid Interface Sci. 2002, 249, 412-422. (8) van Duynhoven, J. P. M.; Broekmann, I.; Sein, A., van Kempen, G. M. P.; Goudappel, G.-J. W.; Veeman, W. S. J. Colloid Interface Sci. 2005, 285, 703-710. (9) Yatagai, M.; Komaki, M.; Nakajima, T.; Hashimoto, T. J. Am. Oil Chem. Soc. 1990, 67, 154-160. (10) Mele, S.; Murgia, S.; Monduzzi, M. Colloids Surf. A 2003, 228, 57-63. (11) Rodrı ´gez Patino, J. M.; Rodrı ´gez Nin ˜o, M. R.; Carrera Sa ´nchez, C.; Navarro Garcı ´a, J. M.; Rodrı ´guez Rodrı ´guez Mateo, G.; Cejudo Ferna ´ndez, M. Colloids Surf. B 2001, 21, 87-99. 2487 Langmuir 2006, 22, 2487-2497 10.1021/la052937p CCC: $33.50 © 2006 American Chemical Society Published on Web 02/08/2006
Transcript of Phase Transitions and Microstructure of Emulsion Systems ... transition of emulsions.pdf · Phase...

Phase Transitions and Microstructure of Emulsion Systems Preparedwith Acylglycerols/Zinc Stearate Emulsifier
Adam Macierzanka,*,† Halina Szela¸g,† Thomas Moschakis,‡ and Brent S. Murray‡
Department of the Technology of Fats and Detergents, Chemical Faculty, Gdan˜sk UniVersity ofTechnology, Narutowicza 11/12, 80-952 Gdan˜sk, Poland, and Procter Department of Food Science,
UniVersity of Leeds, Leeds LS2 9JT, United Kingdom
ReceiVed NoVember 1, 2005. In Final Form: January 4, 2006
The emulsification processes, during which acylglycerols/zinc stearate emulsifier, water, and oil phase formedternary systems, such as water-in-oil (W/O) emulsions, oil-in-water (O/W) dispersions, and unstable oil-water mixtures,were investigated in order to characterize the progressive transformations of the dispersed systems. The type, structure,and phase transitions of the systems were found to be determined by temperature and water phase content. Crystallizationof the emulsifier caused the destabilization and subsequent phase inversion of the emulsions studied, at a temperatureof 60-61 °C. The observed destabilization was temporary and led, at lower temperature, to W/O emulsions, “O/W+ O” systems, or O/W dispersions, depending on the water content. Simultaneous emulsification and cooling of 20-50wt % water systems resulted in the formation of stable W/O emulsions that contained a number of large water dropletswith dispersed oil globules inside them (“W/O+ O/W/O”). In water-rich systems (60-80 wt % of water), crystallizationof the emulsifier was found to influence the formation of crystalline vesicle structures that coexisted, in the externalwater phase, with globules of crystallized oil phase. Results of calorimetric, rheological, and light scattering experiments,for the O/W dispersions obtained, indicate the possible transition of a monostearoylglycerol-basedR-crystalline gelphase to a coagel state, in these multicomponent systems.
I. Introduction
One of the most common emulsifiers for the stabilization ofW/O emulsions is monoesters of glycerol and fatty acids(monoacylglycerols; MAGs). Usually, transesterification ofhydrogenated natural oils/fats with glycerol (glycerolysis), ordirect esterification of glycerol with fatty acids, are used tosynthesize the mixture of mono- and diacylglycerols (typically40-55% of MAG). The mixture contains also triacylglycerols.Upon further purification by molecular distillation, 90-95%MAG product can be prepared.1,2 Both, mono/diacylglycerolsand distilled MAGs are generally recognized as safe and can beused in many pharmaceuticals, food products, and cosmeticformulations.
One very important feature of MAGs is their ability to formlyotropic liquid crystalline phases in the presence of water.3-6
When distilled, saturated MAGs are mixed with water and heatedto the Krafft temperature (TC; defined as the melting point of thehydrocarbon chains4), the so-called lamellar mesophase will beformed. In this phase, bimolecular lipid layers are separated bywater, which penetrates into the planes of polar headgroups ofthe MAG molecules. BelowTC, the mesophase transforms to theR-gel phase, in which MAG molecules are still aligned inindividual bilayers, separated by water. However, the hydrocarbon
chains are not still in a liquidlike state. Since theR-gel is notthermodynamically stable, it converts into the coagel phase (anetwork of platelikeâ-crystals in water). A possible mechanismof theR-gelfcoagel conversion has been reported by Sein et al.7
and van Duynhoven and co-workers.8
In most emulsion systems, the concentration of emulsifier isusually not high enough to allow for the formation of multilamellarliquid-crystalline structures at the water-oil interface. Asexplained in the literature,4,9 very hydrophilic emulsifiers (e.g.,diacetyl tartaric acid ester of MAG, polysorbates or sodiumdodecyl sulfate) form lamellar phases with neutral lipids andwater. However, low-polar MAGs undergo a phase transitionfrom lamellar to reversed hexagonal mesophases in the presenceof triacylglycerols. As reported by Mele et al.,10very stable W/Oemulsions can be prepared by gradual dispersing water in thelamellar and reversed hexagonal phases, formed by glycerolmonooleate-based systems. These authors reported that a glycerolmonooleate/trioleate mass ratio) 85/15 was optimal to formliquid crystalline phases first and then emulsions with high watercontent (up to about 80 wt %).
MAGs used in commercial W/O emulsions (such as margarine)form a crystallized film at the surface of water droplets. Thisway a strong barrier against coalescence is produced. Accordingto Patino et al.,11 interfacial crystallization of glycerol mono-palmitin, monoolein, and monolaurin, previously adsorbed atthe oil-water interface, influences the reduction of the interfacialtension. Krog and Larsson12 have postulated that crystallization
* Corresponding author. E-mail: [email protected]. Telephone:+48 58 347 29 27. Fax:+48 58 347 26 94.
† Gdansk University of Technology.‡ University of Leeds.(1) Zielinski, R. J. InFood Emulsifiers and their Applications; Hasenhuettl,
G. L., Hartel, R. W., Eds.; Chapman & Hall: New York, 1997; Chapter 2.(2) Stauffer, C. E. InFats in Food Technology; Rajah, K. K., Ed.; Sheffield
Academic Press: Sheffield, U.K., 2002; Chapter 7.(3) Larsson, K.Zeit. Phys. Chem. Neue Folge1967, 56, 173-198.(4) Krog, N. J. InFood Emulsions, 3rd ed.; Friberg, S. E., Larsson, K., Eds.;
Marcel Dekker: New York, 1997; Chapter 4.(5) Krog, N. InCrystallization Processes in Fats and Lipid Systems; Garti, N.,
Sato, K., Eds.; Marcel Dekker: New York, 2001; Chapter 15.(6) Morley, W. G.; Tiddy, G. J. T.J. Chem. Soc., Faraday Trans.1993, 89,
2823-2831.
(7) Sein, A.; Verheij, J. A.; Agterof, G. M.J. Colloid Interface Sci. 2002, 249,412-422.
(8) van Duynhoven, J. P. M.; Broekmann, I.; Sein, A., van Kempen, G. M.P.; Goudappel, G.-J. W.; Veeman, W. S.J. Colloid Interface Sci. 2005, 285,703-710.
(9) Yatagai, M.; Komaki, M.; Nakajima, T.; Hashimoto, T.J. Am. Oil Chem.Soc.1990, 67, 154-160.
(10) Mele, S.; Murgia, S.; Monduzzi, M.Colloids Surf. A2003, 228, 57-63.(11) Rodrı´gez Patino, J. M.; Rodrı´gez Nino, M. R.; Carrera Sa´nchez, C.; Navarro
Garcıa, J. M.; Rodrı´guez Rodrı´guez Mateo, G.; Cejudo Ferna´ndez, M.ColloidsSurf. B2001, 21, 87-99.
2487Langmuir2006,22, 2487-2497
10.1021/la052937p CCC: $33.50 © 2006 American Chemical SocietyPublished on Web 02/08/2006

of MAG at the interface can be expected to be more rapidcompared to the nucleation-crystal growth mechanism in theoil phase. The influence of MAG concentration on the interfacialtension was studied by Szela¸g and Zwierzykowski13 for paraffinoil-water systems. At a temperature of 45°C, monolaurin reducedthe interfacial tension to 15.9 mN/m, whereas the use ofmonostearin yielded 19.9 mN/m. These values were measuredfor MAG concentrations equal to the critical micelle concentration(CMC): 5.26× 10⁻⁴ and 3.8× 10⁻⁴ mol/dm3, respectively. Themost interesting result was the decrease of the interfacial tensionto less than 2 mN/m when a mixture of monostearoylglyceroland sodium stearate (molar ratio) 9:1) was used, showing thesynergistic effect of the combination. Investigations on theeffectiveness of acylglycerol emulsifiers, modified with sodiumand potassium soaps, showed the possibility of using suchemulsifiers for the stabilization of O/W emulsions.14
As presented elsewhere,15,16modification of the hydrophobicproperties of acylglycerol emulsifiers can be realized by meansof the controlled esterification of glycerol with fatty acids in thepresence of zinc soaps. In contrasts to the use of alkali soaps,the synthesized products are very effective in the stabilizationof W/O-type emulsions.17 Preliminary studies on the phasebehavior, dispersion distribution, and physical stability of W/O(paraffin and vegetable oil) emulsions, prepared with differentacylglycerols/zinc carboxylate emulsifiers, have been reportedin a previous publication.18 However, the detailed microscopicand thermal characteristics of the phase transitions were notdiscussed. It has been the aim of the present work to analyze theinfluence of temperature and water:oil ratio on the transitionpathways in the dispersed systems, prepared with acylglycerols/zinc stearate emulsifier. Investigations were performed in orderto characterize the structural changes of the systems that occurredduring the dynamic emulsification processes. Time-dependenttransitions in the structure of obtained O/W dispersion on storagewere also studied.
II. Experimental Section
II. A. Materials. Water used for the preparation of all dispersedsystems was from a Milli-Q Elix system (Millipore). A mixture ofparaffin oil and paraffin wax (9:1 wt/wt) was used as the oil phase.Both components of the oil phase were supplied by Sigma-Aldrich.
Acylglycerols/zinc stearate (AGs/ZnSt) emulsifier was synthesizedby means of direct esterification of glycerol with stearic acid(octadecanoic acid, C18:0; from Sigma-Aldrich), in the presence ofzinc stearate. The composition of the emulsifier (checked by GCand HPLC) was as follows: 43.0 wt % of MAG (monostearate), 7.7wt % of zinc stearate (ZnSt), 26.3 wt % of diacylglycerol (DAG,distearate), 6.1 wt % of triacylglycerol (TAG, tristearate), 9.9 wt %of stearic acid, and 7.0 wt % of glycerol. Details of the emulsifiersynthesis have been presented in a recent report.15 The hydrophile-lipophile balance (HLB) of the emulsifier was 4.7, determinedexperimentally via the Griffin method (the emulsion comparisonmethod).19,20 The emulsion composition during estimation of theHLB number was as follows: oil phase (paraffin oil), 40 wt %;water, 55 wt %; blend of the AGs/ZnSt and standard emulsifiers,5 wt %. Tween 60 (from Sigma-Aldrich; HLB) 14.9) was usedas a standard emulsifier. The contents of Tween 60 (XT60, wt %) and
AGs/ZnSt emulsifier (XAGs/ZnSt, wt %), in their mixture, werecalculated as follows
where RHLB is a required HLB of paraffin oil used as an oil phase(RHLB ) 10.5), and HLBT60 and HLBAGs/ZnSt are HLB values ofTween 60 and the examined AGs/ZnSt emulsifier, respectively. Foreach calculation ofXT60 andXAGs/ZnSt, a different HLBAGs/ZnStvaluewas assumed. For each assumption of the HLBAGs/ZnSt, the resultingXT60/XAGs/ZnStratio, calculated according to eqs 1 and 2, yielded theHLB of the emulsifier mixture equal to the RHLB value of the oilphase. Equality of both values is a rule of thumb in a preparationof stable emulsions.19,21 After preparation (emulsification at 500rpm under continuous cooling from 80 to 25°C), the emulsionswere poured into 10-mL graduated test tubes and were observed forany sign of phase separation to occur. The HLBAGs/ZnStvalue assumedin the calculation of theXT60/XAGs/ZnStratio of the emulsifier blendthat yielded the most stable O/W emulsion was judged to be theHLB number of the AGs/ZnSt emulsifier. Stability of emulsions(stored 24 h at 23( 1 °C after preparation) was evaluated bycentrifugation at 5000 rpm for 3 min (23( 1 °C) and subsequentdetermination of the volume of separated oil or water phase. At first,the emulsions were prepared with 0.5 HLB unit apart. After anapproximate HLB value of the emulsifier was established, theexperiments were repeated by making emulsions having 0.1-0.2HLB unit apart until the exact HLB number was established. Theestimated confidence interval of the determination of HLB was(0.1.
A commercially available blend of glycerol tri- and distearates(Fluka AG), consisting of 71.3 wt % tristearate, 20.2 wt % distearate,8.1 wt % stearic acid, and 0.4 wt % monostearate and glycerol, wasused for the preparation of DAG-free product. For this purpose, theequivalent amounts of tri-/distearate and stearic acid were mixed at150 °C for 3 h (200 rpm) in order to esterify the hydroxyl groupsof the partial acylglycerols and glycerol. The use of the large excessof stearic acid allowed for almost complete esterification of di- andmonostearate and glycerol to tristearate. The final product contained53.9 wt % of tristearate, 46.0 wt % of stearic acid, and traces (0.1wt %) of distearate. The mixture obtained was utilized in thepreparation of the emulsifying blends used in the investigations ofthe stability of W/O emulsions prepared in the absence of DAGand/or ZnSt. In these investigations, glycerol monostearate (99%purity), synthesized in our laboratory by the modified isopropyl-ideneglycerol method,22,23 and purified by silica gel columnchromatography, was also used.
II.B. Preparation of the Dispersed Systems and their Char-acterization. All dispersed systems were prepared in a glass,thermostated emulsor equipped with a mechanical stirrer (RZR 2021,Heidolph) with a steel paddle agitator. Distilled water as well as amixture of oil phase and AGs/ZnSt emulsifier (10 wt % of theemulsifier, with respect to the total amount of oil and water phases)were separately heated to 80°C, and subsequently water was addedto the oil phase. At this temperature, the emulsifier was melted (seeendothermic peak at temperature of about 65°C, Figure 1a; the DSCprocedure applied is described below). Emulsification (at 500 rpm)was obtained by keeping a constant rate of cooling of the system,in the temperature range 80-25 °C. Water:oil weight ratios wereas follows: 20:80, 30:70, 40:60, 50:50, 55:45, 60:40, 70:30, and80:20. The phase inversion temperature (PIT) was determined fromcontinuous measurements of the electrical conductivity and thetemperature of the system. The conductivity was examined usinga conductivity cell.24 During the emulsification process, samples ofthe systems were collected and immediately studied by CLSM (see
(12) Krog, N.; Larsson, K.Fat Sci. Technol. 1992, 94, 55.(13) Szela¸g, H.; Zwierzykowski, W.Przem. Chem. 2003, 82, 1184-1186.(14) Szela¸g, H.; Zwierzykowski, W.Colloids Surf. A1999, 155, 349-357.(15) Macierzanka, A.; Szela¸g, H. Ind. Eng. Chem. Res. 2004, 43, 7744-7753.(16) Szela¸g, H.; Macierzanka, A.Tenside Surfact. Det. 2001, 38, 377-380.(17) Szela¸g, H.; Macierzanka, A.Proceedings of the 14th Surfactants in Solution
Symposium; UB - Oficina de Congressos: Barcelona, 2002.(18) Szela¸g, H.; Macierzanka, A.; Pawłowicz, R.J. Dispersion Sci. Technol.
2004, 25, 173-182.(19) Griffin, W. C. J. Soc. Cosmet. Chem.1949, 1, 311-326.(20) Lin, T. J.J. Soc. Cosmet. Chem. 1970, 21, 365-375.
(21) Bergwein, K.Fette, Seifen, Anstrichm.1967, 69, 353-355.(22) Hartman, L.Chem., Ind.1960, 711-712.(23) Zwierzykowski, W.; Orze¸cka, B.; Spich, K.Tenside Detergents1976, 13,
313-316.(24) McClements, D. J.Food Emulsions: Principles, Practice and Techniques;
CRC Press: Boca Raton, FL, 1999; Chapter 10.
XT60 ) 100 (RHLB- HLBAGs/ZnSt)/(HLBT60 - HLBAGs/ZnSt) (1)
XAGs/ZnSt) 100- XT60 (2)
2488 Langmuir, Vol. 22, No. 6, 2006 Macierzanka et al.

below). This enabled the meticulous characterization of the resultsof the various dynamic transitions that occurred while mixing andsimultaneous cooling of the emulsions. The corresponding transitiontemperature was determined from three preparations and measure-ments and showed a maximum standard error of(0.3 °C. CLSManalyses were also performed for O/W dispersions stored at 23(1°C for couple days after preparation. Sudden and significant changesin the macroscopic appearance of the systems (e.g., homogeneity,phase separation, fluidity) were also investigated by visual observa-tions.
Two different W/O emulsions (W:O) 40:60 wt/wt) were made:(i) with ZnSt (>95% purity), synthesized as reported elsewhere15
and (ii) with glycerol monostearate (99% purity). In both cases, theamount of the emulsifier was equal to 5 wt % of the total amountof oil and aqueous phases. The emulsions were made according tothe procedure described earlier in this section. ZnSt and MAG wereused separately in order to compare the microstructures of theemulsions stabilized by these compounds with the microstructureof the W/O system prepared with the AGs/ZnSt emulsifier.
II.C. Confocal Laser Scanning Microscopy (CLSM).Samplesof dispersed systems were stained with Nile Red dye solution (0.4µg of dye per 1 mL of the sample), placed into a welled slide, andtransferred to the microscope. A Leica TCS SP2 confocal laserscanning microscope was used. The confocal microscope wasmounted on a Leica DM RXE microscope. A 20× dry objectivewith numerical aperture 0.7 or a 63× water-immersion objectivewith numerical aperture 1.20 were used in all experiments. Thisconfocal microscope acquires images at a fast rate, because it scansthe beam quickly along one dimension, by using an acousto-opticdeflector. The acquisition time for each 1024× 1024 pixel slice,in the horizontalx-y plane, was typically 3 s, although much fasteracquisition is possible at lower resolution or with a reduced fieldof view. The signals from the sample were collected, and eight scanswere averaged during the creation of each image. The images weretransferred to computer. CLSM was operated in fluorescence mode,at 23( 1 °C. Fluorescence from the sample was excited with the488 nm line of an Ar-laser as the light source; the emission peakof the light was around 565 nm. Because Nile Red stains oilysubstances, the oil phase appears as brightly colored and the darkregions represent the water phase in all the CLSM micrographs.
II.D. Differential Interference Contrast (DIC) Optical Mi-croscopy.A DIC optical microscopy was used to characterize theshape and surface microstructure of the water droplets in the W/Oemulsions. Images were obtained by using an Olympus BX-60microscope with APO oil-immersion objectives with 60× and 100×magnifications and numerical aperture 1.3, equipped with an OlympusDP-50 digital camera. Micrographs were recorded at 23( 1 °C. Themicroscope was operated in transmission light mode. In theobservations of O/W emulsions, the hydrophilic Evans Blue dyewas used to expose the water phase. A staining aqueous solution ofconcentration of 0.1% (wt/v) was gently mixed with emulsion samplesin amounts required to achieve the desire contrast between oil andwater phases in microscopic visualizations.
II.E. Calorimetric Measurements. Differential scanning calo-rimetry (DSC) was applied to (i) determine melting and crystallization
temperatures of AGs/ZnSt emulsifier and (ii) characterize the thermalbehavior of O/W dispersions prepared with that emulsifier. A MettlerTA 3000 thermal analysis system, equipped with a TC 10 TAprocessor and a DSC 30 temperature cell, was used. Samples of theemulsifier or dispersions (30 mg) were weighed in standard 40µLaluminum pans and sealed by a press. Measurements were performedin the endothermic and exothermic scanning modes. Samples wereheated and subsequently cooled between 25 and 80 and 80-25 °C,respectively. The rates of heating and cooling were 2°C/min. Anempty pan was used as a reference.
When the thermal behavior of O/W dispersions was studied,subsequent reheating (25-80°C; 2°C/min) of the sample was alsoperformed. That additional scan was performed in order to determinethe difference in the heat content of the sample, between the firstheating and the second heating. As found in the literature,7,25,26forbinary MAG-water systems, the enthalpy of melting of pureâ-crystalline MAG coagel phase is about twice the value obtainedfor the melting of the liquid-crystallineR-gel phase. The coagelindex (CI), defined as the ratio between the enthalpies of the heating(∆Hh) and reheating (∆Hrh) scan,7,26 indicates the amount ofR-gelthat converted to coagel. When the CI) 1, the examined materialis in theR-gel state. For a pure coagel, this parameter is about 2.Both phases convert into the lamellar phase at melting temperature,but, when cooled, the lamellar phase converts only to theR-gelphase.25Since the transition ofR-gel to coagel usually requires daysor weeks, the immediate reheating scan exhibits the melting of theR-gel.
In our experiments, we examined the kinetics of the similar phasetransition in theO/Wdispersion,preparedwithacylglycerol emulsifier(AGs/ZnSt). We defined the ratio∆Hh/∆Hrh as a parameter calledthe Dispersion Coagel Index (DCI).
II.F. Evaluation of the Stability of Dispersed Systems.Changesin the dispersity of emulsions were monitored by multiple lightscattering (MLS) method using a Turbiscane LAb Expert analyzer(Formulaction). A freshly prepared emulsion (ca. 25 mL) was placedinto a flat-bottomed cylindrical glass cell and stored at 23( 1 °Cover a period of about one year. The sample was scanned by usingtwo synchronous optical sensors that detected light transmittedthrough the sample and backscattered by the sample (180° and 45°from the incident light, respectively). The reading head acquiredbackscattering and transmission data every 40µm while movingalong the entire height of the cell (i.e., 55 mm). The light source wasan electro-luminescent diode (λair ) 880 nm). The one-scan analyseswere carried out at one-day intervals at a temperature of 23°C ((0,5°C). Additionally, the emulsion stability was assessed in the test,where a temperature was gradually increased from 25 to 60°C.During this analysis, sample of emulsion was scanned every 1 minfor about 100 min.
The Lambert-Beer law gives an analytical expression of thetransmitted flux,T, measured by the Turbiscan as a function of thephoton mean free path,λ
where r is the internal radius of the measurement cell, andT0 is thetransmittance of the continuous phase. The backscattered flux, BS,is directly linked to the photon transport length,λ*, through thedispersed system, by the following relation:
whereB≈0.2 is the boundary reflection factor in cylindrical geometryandhd is the detector height. Thus, BS is inversely proportional tothe square root ofλ* . Bothλ andλ* depend on the physical featuresof the dispersed phase (mean particle diameter,d, and particle volumefraction,φ). The parameterλ represents the average distance traveled
(25) Heertje, I.; Roijers, E. C.; Hendrickx, H. A. C. M.Lebensm.-Wiss.u.-Technol. 1998, 31, 387-396.
(26) Cassin, G.; de Costa, C.; van Duynhoven, J. P. M.; Agterof, W. G. M.Langmuir1998, 14, 5757-5763.
Figure 1. DSC thermograms obtained for heating (a) and cooling(b) of AGs/ZnSt emulsifier.
T ) T0 e-2r /λ (3)
BS≈ [(1 - B)/3] (hd/λ*) 1/2 (4)
Systems Prepared with Acylglycerols/Zinc Stearate Langmuir, Vol. 22, No. 6, 20062489

by photons before undergoing a diffusion phenomenon. Whereas,λ* corresponds to the distance of penetration of the photon in thedispersed system (i.e., the distance above which a photon is scatteredin the backward direction)
The optical parametersQs and g are given by the Mie theory.27
Details of the measurement principles and the theory of the MLSmethod are given by Mengual et al.28,29
The stability of dispersed systems was also evaluated in simpletests, where emulsion samples were centrifuged at 5000 or 10000rpm for 5 min at 23( 1 °C. Afterward, the volume of separatedwater or oil phase was checked.
II.G. O/W Dispersion Consistency Measurements.A FeinmessOFD VEB penetrometer was used. A ball-shaped, steel punch, affixedto a steel stem and an aluminum rod (wt. 55.9 g) of the penetrometer,was initially held in a stationary position with the punch tip just incontact with the surface of the dispersion sample, contained in aglass cup (volume 100 mL). The cups used for measurements werefilled with the dispersion just after its preparation (i.e., when thedispersion was in semi-fluid state), sealed with polyethylene film(to prevent water evaporation), and stored at 23( 1 °C prior toexamination. During the test, the punch was allowed to penetratethe sample for 5 s. Penetration depth was determined from triplicatepreparations and measurements. The results obtained showed astandard error of 1-5%.
III. Results and Discussion
The microscopic examination of the structure of the dispersedsystems allowed identification of the pathways of the phasetransitions during the emulsification processes. To determinethe PIT, continuous measurements of temperature and electricalconductivity were also made. Based on the data obtained and themacroscopic appearance of the systems (homogeneity, separationof water or oil phase, significant changes of fluidity), the phasediagram was formulated (Figure 2). It shows the dependence oftype of the dispersed system on temperature and water phasecontent. As mentioned in the Experimental Section (II.B.), atemperature was reduced gradually from 80 to 25°C during theemulsification processes.
At the beginning of the dispersion formation, a W/O emulsionwas formed due to the hydrophobic character of the emulsifier(HLB ) 4.7), even for the system that contained 80 wt % ofwater (Figure 2). On cooling the emulsion systems to 61-60°C,a sudden, significant increase in fluidity was observed, attributedto the destabilization of emulsions induced by the crystallizationof the emulsifier (i.e., formation of the considerable amounts ofacylglycerols crystals). In the emulsions containing 60-80 wt% water, such changes in fluidity were preceded by flocculationof the water droplets (Figure 2). As shown in the DSC thermogram(Figure 1b), crystallization of the emulsifier began sharply at 60°C. Thus, the thermal behavior of the emulsifier correlates withthe first observed temperature transition. Emulsifier crystallizationproduced complete destabilization of W/O emulsion. Micrographsof the system obtained show regions with separated oil and waterphases (Figure 3). Acylglycerols crystals are in the oil phase.The destabilization led (under continuous emulsification) to aphase inversion. The type of system subsequently formed was
dependent on the water:oil ratio, as described below in thefollowing sections.
III.A. Water:Oil Weight Ratios ) 20:80÷55:45. In themixtures that contained up to 55 wt % of water, a decrease offluidity was subsequently observed, as a result of the phaseinversion at 58-57 °C. The inversion and formation of an O/Wemulsion occurred simultaneously with some destabilization ofthe system, i.e., separation of the excess of oil phase. This wasattributed to the relatively high content of oil (45-80 wt %) inthe system plus the hydrophobic nature of AGs/ZnSt emulsifier.As shown in Figure 4, large flocs of irregularly shaped O/Wemulsion aggregates were suspended in the separated oil.
Since the external phase of the whole system was still paraffinoil, the conductivity remained unchanged, at around 0-0.1µS.Such a system has been designated as “O/W+ O” (Figure 2).From the photographs in Figure 5a, it is seen that the systemcannot be considered double emulsion due to the apparent lackof the macroscopic uniformity, characteristic of stable emulsions.In fact, samples of such mixtures (when placed in a test tube)showed a rapid sedimentation of O/W emulsion aggregates and
(27) van de Hulst, H. C.Multiple Light Scattering: Tables, Formulas andApplications; Academic Press: New York, 1980.
(28) Mengual, O.; Meunier, G.; Cayre´, I.; Puech, K.; Snabre, P.Talanta1999,50, 445-456.
(29) Mengual, O.; Meunier, G.; Cayre, I.; Puech, K.; Snabre, P.Colloids Surf.A 1999, 152, 111-123.
λ ) 2d/(3φQs) (5)
λ* ) λ/(1- g) ) 2d/[3φ(1 - g)Qs] (6)
Figure 2. Phase diagram of the water/oil systems prepared withAGs/ZnSt emulsifier. The black-colored area represents the tem-perature range, at which dramatic, temporary increase of the fluiditywas observed. The numbers in the circles refer to the followingfigures, which show micrographs of the relevant dispersed systems.
Figure 3. CLSM micrograph for a destabilized water-oil system(50:50 wt/wt) obtained after the cooling of W/O emulsion to 60°C.Arrows indicate acylglycerols crystals formed in the oil phase. Black-colored regions represent the separated aqueous phase.
2490 Langmuir, Vol. 22, No. 6, 2006 Macierzanka et al.

location of the separated oil in the uppermost regions. This processwas monitored by the MLS method using a Turbiscan apparatus(Figure 5). The “O/W+ O” mixture (W:O) 40:60 wt/wt) usedin this experiment was produced by emulsification carried outfrom 80 to 45°C (see Figure 2), and subsequently, the systemwas immediately transferred to the MLS analyzer. The MLSmeasurements were performed at 45( 0.5°C. A sample of thefreshly prepared “O/W+ O” system was opaque (light could notbe transmitted through the sample,T ) 0%); however, thedivergences in the backscattering (BS) signals indicated theaforementioned lack of uniformity of this system (Figure 5a).After a few minutes, the progressive sedimentation of the O/Wemulsion aggregates could be easy detected from the increasein T level and a resulting decrease in BS signals for the top partof the sample (formation of the oil layer), as well as the localincreases of the BS values in the middle and lower regions (Figure5b). After moderate centrifugation (1000 rpm, 1 min), thesedimented aggregates formed a layer of opaque O/W emulsionwith the BS level of about 50% (Figure 5c). The separation ofsome clear oil phase was signaled by the detection of lighttransmitted through the uppermost regions of the sample (T )60%). Formation of the water phase, at the bottom of the testtube, was not observed. Monitoring of this sedimentation processgave an insight into the nature of the “O/W+ O” system. Fromthe changes in BS andTprofiles, one may conclude that observedsedimentation was not a simple separation of oil and water phases.For such a case, theT reading for the lower section of thecentrifuged sample would be also.0, together with low BS
Figure 4. CLSM micrograph of the “O/W+ O” (W:O weight ratio) 40:60) system from 45°C (a). Arrows (b) indicate the numerousoil droplets dispersed within the water phase (black-colored regionsrepresent water).
Figure 5. Schematic illustration and multiple light scattering (MLS)analysis of the “O/W+ O” system (W:O weight ratio) 40:60):(a) freshly prepared system (the photographs show the macroscopicappearance of the system spread on the glass plate); (b) time-dependent sedimentation of the O/W emulsion aggregates; (c)separation of the O/W emulsion from the external oil, acceleratedby the moderate centrifugation (the micrograph shows the separatedO/W emulsion). BS andT are the intensities of light backscatteredby the sample and transmitted through the sample, respectively.Gis an electrical conductivity of the system. For more details see text.
Systems Prepared with Acylglycerols/Zinc Stearate Langmuir, Vol. 22, No. 6, 20062491
level for this section, due to high transparency of water. Theelectrical conductivity (G) of the emulsion layer was 5-6 µS.As shown in the micrograph of this emulsion (Figure 5c), manydispersed oil droplets were flocculated due to the presence ofacylglycerols crystals that linked the droplets. In additional tests,a sample of the emulsion layer was stained with the hydrophilicEvans Blue dye. As observed in the microscope, the dye stainedonly the continuous phase, showing the water to be an externalphase of this emulsion. The O/W nature of the emulsion layerwas also observed in the test where a drop of the emulsion wasadded to distilled water. The emulsion was easily dispersible inwater. The above simple tests confirmed the O/W type of theemulsion obtained from the sedimentation in the “O/W+ O”system, and furthermore, they proved the formation of the O/Wemulsion and its existence with some separated oil in “O/W+O” mixture, formed as a result of destabilization and inversionof W/O emulsions containing up to 55 wt % of water (Figure2).
Formation of similar “O/W+ O” systems was observed duringthe cooling of the W/O emulsions (20-60 wt % of water) preparedwith acylglycerol emulsifiers (acyl group: C16:0 and C18:0),modified with sodium and potassium soaps.14 The change fromW/O to “O/W + O” was induced by cooling the systems totemperatures ranging between 55 and 45°C, depending onacylglycerols fatty acid moiety and the type of soap cation.
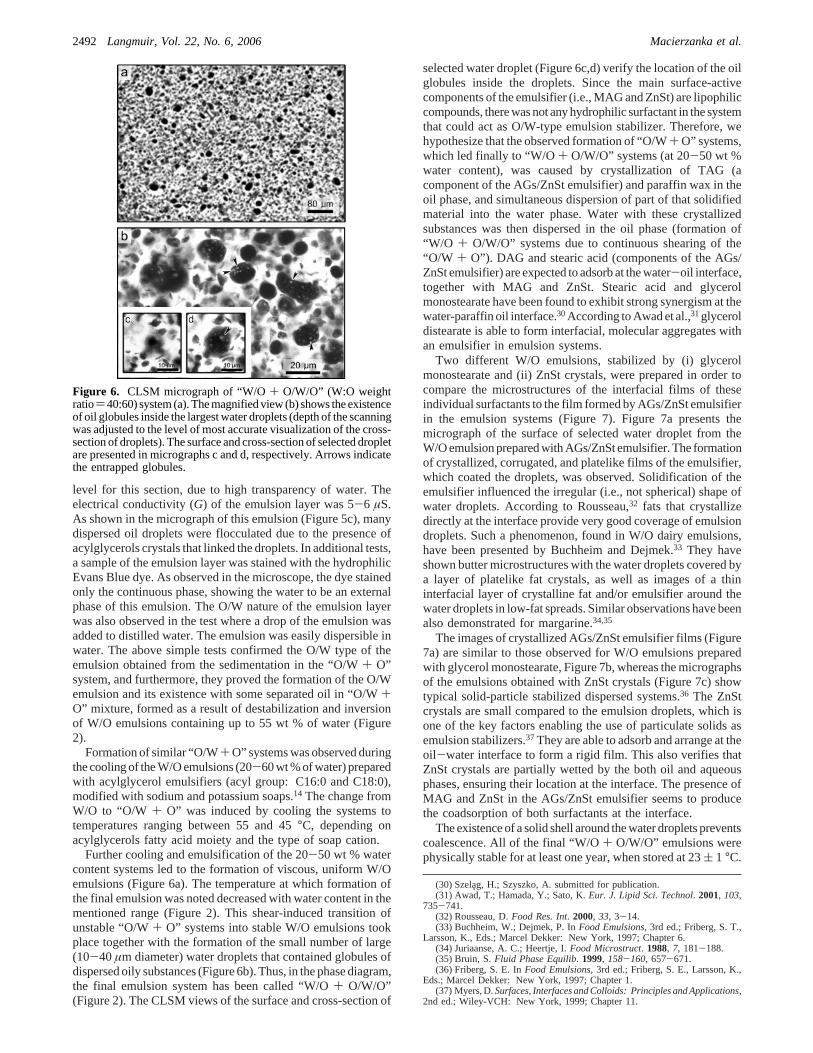
Further cooling and emulsification of the 20-50 wt % watercontent systems led to the formation of viscous, uniform W/Oemulsions (Figure 6a). The temperature at which formation ofthe final emulsion was noted decreased with water content in thementioned range (Figure 2). This shear-induced transition ofunstable “O/W+ O” systems into stable W/O emulsions tookplace together with the formation of the small number of large(10-40µm diameter) water droplets that contained globules ofdispersed oily substances (Figure 6b). Thus, in the phase diagram,the final emulsion system has been called “W/O+ O/W/O”(Figure 2). The CLSM views of the surface and cross-section of
selected water droplet (Figure 6c,d) verify the location of the oilglobules inside the droplets. Since the main surface-activecomponents of the emulsifier (i.e., MAG and ZnSt) are lipophiliccompounds, there was not any hydrophilic surfactant in the systemthat could act as O/W-type emulsion stabilizer. Therefore, wehypothesize that the observed formation of “O/W+ O” systems,which led finally to “W/O+ O/W/O” systems (at 20-50 wt %water content), was caused by crystallization of TAG (acomponent of the AGs/ZnSt emulsifier) and paraffin wax in theoil phase, and simultaneous dispersion of part of that solidifiedmaterial into the water phase. Water with these crystallizedsubstances was then dispersed in the oil phase (formation of“W/O + O/W/O” systems due to continuous shearing of the“O/W + O”). DAG and stearic acid (components of the AGs/ZnSt emulsifier) are expected to adsorb at the water-oil interface,together with MAG and ZnSt. Stearic acid and glycerolmonostearate have been found to exhibit strong synergism at thewater-paraffin oil interface.30According to Awad et al.,31glyceroldistearate is able to form interfacial, molecular aggregates withan emulsifier in emulsion systems.
Two different W/O emulsions, stabilized by (i) glycerolmonostearate and (ii) ZnSt crystals, were prepared in order tocompare the microstructures of the interfacial films of theseindividual surfactants to the film formed by AGs/ZnSt emulsifierin the emulsion systems (Figure 7). Figure 7a presents themicrograph of the surface of selected water droplet from theW/O emulsion prepared with AGs/ZnSt emulsifier. The formationof crystallized, corrugated, and platelike films of the emulsifier,which coated the droplets, was observed. Solidification of theemulsifier influenced the irregular (i.e., not spherical) shape ofwater droplets. According to Rousseau,32 fats that crystallizedirectly at the interface provide very good coverage of emulsiondroplets. Such a phenomenon, found in W/O dairy emulsions,have been presented by Buchheim and Dejmek.33 They haveshown butter microstructures with the water droplets covered bya layer of platelike fat crystals, as well as images of a thininterfacial layer of crystalline fat and/or emulsifier around thewater droplets in low-fat spreads. Similar observations have beenalso demonstrated for margarine.34,35
The images of crystallized AGs/ZnSt emulsifier films (Figure7a) are similar to those observed for W/O emulsions preparedwith glycerol monostearate, Figure 7b, whereas the micrographsof the emulsions obtained with ZnSt crystals (Figure 7c) showtypical solid-particle stabilized dispersed systems.36 The ZnStcrystals are small compared to the emulsion droplets, which isone of the key factors enabling the use of particulate solids asemulsion stabilizers.37They are able to adsorb and arrange at theoil-water interface to form a rigid film. This also verifies thatZnSt crystals are partially wetted by the both oil and aqueousphases, ensuring their location at the interface. The presence ofMAG and ZnSt in the AGs/ZnSt emulsifier seems to producethe coadsorption of both surfactants at the interface.
The existence of a solid shell around the water droplets preventscoalescence. All of the final “W/O+ O/W/O” emulsions werephysically stable for at least one year, when stored at 23( 1 °C.
(30) Szela¸g, H.; Szyszko, A. submitted for publication.(31) Awad, T.; Hamada, Y.; Sato, K.Eur. J. Lipid Sci. Technol. 2001, 103,
735-741.(32) Rousseau, D.Food Res. Int. 2000, 33, 3-14.(33) Buchheim, W.; Dejmek, P. InFood Emulsions, 3rd ed.; Friberg, S. T.,
Larsson, K., Eds.; Marcel Dekker: New York, 1997; Chapter 6.(34) Juriaanse, A. C.; Heertje, I.Food Microstruct. 1988, 7, 181-188.(35) Bruin, S.Fluid Phase Equilib. 1999, 158-160, 657-671.(36) Friberg, S. E. InFood Emulsions, 3rd ed.; Friberg, S. E., Larsson, K.,
Eds.; Marcel Dekker: New York, 1997; Chapter 1.(37) Myers, D.Surfaces, Interfaces and Colloids: Principles and Applications,
2nd ed.; Wiley-VCH: New York, 1999; Chapter 11.
Figure 6. CLSM micrograph of “W/O+ O/W/O” (W:O weightratio) 40:60) system (a). The magnified view (b) shows the existenceof oil globules inside the largest water droplets (depth of the scanningwas adjusted to the level of most accurate visualization of the cross-section of droplets). The surface and cross-section of selected dropletare presented in micrographs c and d, respectively. Arrows indicatethe entrapped globules.
2492 Langmuir, Vol. 22, No. 6, 2006 Macierzanka et al.

From the MLS analysis (Figure 8a), it is seen that the intensityof light backscattered by the emulsion remained constant duringthe 1-year storage, demonstrating no changes in the emulsionstructure (e.g., flocculation or coalescence of droplets). Lack ofthe local increases in the BS level for the lower part of the samplescanned (Figure 8a′), i.e., the signs characteristic for thesedimentation of dispersed water droplets,28,29 showed thecrystallization of acylglycerols at the water/oil interface and inthe continuous oil phase to be the factor yielding the spatialarrangement of droplets that prevented the gravitational migrationof emulsified water during this long time period. The parameter∆BS5-50 mmhas been defined as a difference in mean BS value(recorded for the emulsion sample in the region from 5 to 50 mmof its height; BS5-50mm, Figure 8a′), between the first scan andn scan.
The 1-year-old emulsions were stable also during thecentrifugation at 5000 rpm for 5 min. However, in emulsionscontaining 40-50 wt % water, the increase to 10 000 rpm resultedin the formation of a thin oil film (less than 1% of the oil phasevolume) at the top of test samples. It was a result of the increaseof the concentration of droplets in lower regions of the emulsionsamples, but, since a separation of water phase was not detected,the centrifugation seems to not affect significantly the coalescencerate.
Stability of the emulsions stored one year at 23( 1 °C wasalso evaluated in the test where the temperature was increasedstepwise from 25 to 60°C (Figure 8b). Changes in backscatteringof the samples were monitored on-line (one scan every one minuteof analysis). The progressive decrease in the BS5-50 mmnumberobserved was attributed to the flocculation of water droplets.The most considerable drop of∆BS5-50 mm was noted when55-60°C was reached. At this temperature, melting of the AGs/ZnSt emulsifier began (Figure 1a); thus, with all probability, thechange was the effect of the resulting increase of the degree offlocculation/coalescence. It is well-known that an aggregationof droplets (i.e., flocculation) can lead to their merger and theresulting creation of larger droplets (coalescence phenomenon).Such variations in particle size (both flocculation and coalescence)are detected by the MLS method as a decrease of BS over thewhole height of emulsion sample as long as the change of particlesize does not produce the migration of dispersed particles. Whenthe temperature of the analysis reached 60°C, gravitationalsedimentation of the water droplets was not observed yet. About20-min storage at this temperature was required to detect theonset of the sedimentation.
To assess the influence of DAG and ZnSt on the emulsionstability, three different emulsions were prepared and analyzed.They were obtained in the presence of (i) AGs/ZnSt emulsifier,(ii) emulsifying mixture A, or (iii) mixture B. The mixtures Aand B were composed of the defined amounts of the samecompounds that were present in the composition of AGs/ZnStemulsifier (see section II.A.). The only difference was the absenceof DAG (mixture A) or DAG + ZnSt (mixture B). All of theemulsions were 40 wt % water systems of the W/O type. Afterpreparation, the emulsions were immediately transferred to theMLS analyzer and scanned at constant temperature of 50( 0.5°C. Under quiescent conditions, the increased temperature ofanalyses did not affect the emulsion type. It was applied in orderto accelerate any signs of destabilization to occur. At around 23°C, the emulsions were very stable against sedimentation of waterdroplets and other destabilizing mechanisms (e.g., flocculation).
As shown in Figure 9a, storage at 50°C resulted in a relativelyrapid decrease in the BS5-50 mmnumber of all of the emulsionsdue to a flocculation of water droplets. Coalescence was rathernot possible because the melting temperature of the emulsifier
Figure 7. DIC micrographs of representative water droplets from W/O emulsions stabilized by AGs/ZnSt emulsifier (a), glycerol monostearate(b), and ZnSt crystals (c).
Figure 8. Backscattering profile of “W/O+ O/W/O” emulsion(W:O weight ratio) 40:60) prepared with the AGs/ZnSt emulsifier:(a) storage at 23( 1 °C (graph a′ shows backscattering value versussample height for the 1-year-old emulsion); (b) the effect of increasedtemperature on the stability of the emulsion stored 1 year at 23(1 °C prior to measurement. For abbreviations see text.
Systems Prepared with Acylglycerols/Zinc Stearate Langmuir, Vol. 22, No. 6, 20062493
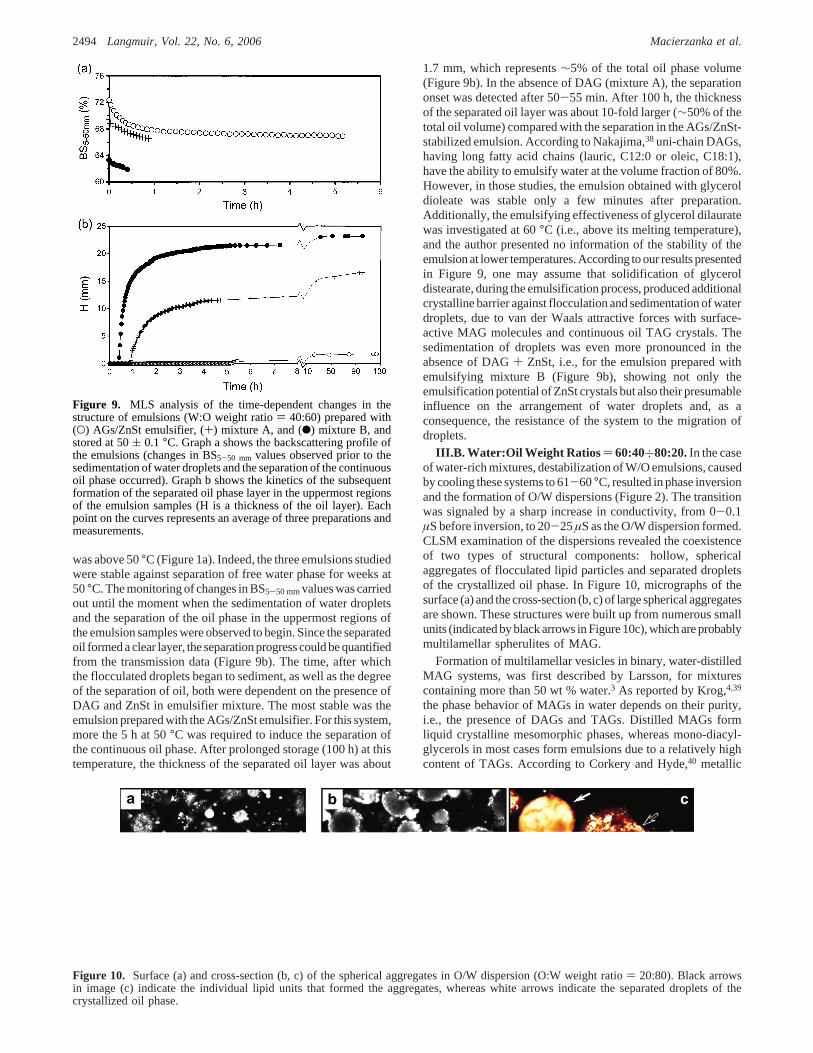
was above 50°C (Figure 1a). Indeed, the three emulsions studiedwere stable against separation of free water phase for weeks at50°C. The monitoring of changes in BS5-50 mmvalues was carriedout until the moment when the sedimentation of water dropletsand the separation of the oil phase in the uppermost regions ofthe emulsion samples were observed to begin. Since the separatedoil formed a clear layer, the separation progress could be quantifiedfrom the transmission data (Figure 9b). The time, after whichthe flocculated droplets began to sediment, as well as the degreeof the separation of oil, both were dependent on the presence ofDAG and ZnSt in emulsifier mixture. The most stable was theemulsion prepared with the AGs/ZnSt emulsifier. For this system,more the 5 h at 50°C was required to induce the separation ofthe continuous oil phase. After prolonged storage (100 h) at thistemperature, the thickness of the separated oil layer was about
1.7 mm, which represents∼5% of the total oil phase volume(Figure 9b). In the absence of DAG (mixture A), the separationonset was detected after 50-55 min. After 100 h, the thicknessof the separated oil layer was about 10-fold larger (∼50% of thetotal oil volume) compared with the separation in the AGs/ZnSt-stabilized emulsion. According to Nakajima,38uni-chain DAGs,having long fatty acid chains (lauric, C12:0 or oleic, C18:1),have the ability to emulsify water at the volume fraction of 80%.However, in those studies, the emulsion obtained with glyceroldioleate was stable only a few minutes after preparation.Additionally, the emulsifying effectiveness of glycerol dilauratewas investigated at 60°C (i.e., above its melting temperature),and the author presented no information of the stability of theemulsionat lower temperatures.According toour resultspresentedin Figure 9, one may assume that solidification of glyceroldistearate, during the emulsification process, produced additionalcrystalline barrier against flocculation and sedimentation of waterdroplets, due to van der Waals attractive forces with surface-active MAG molecules and continuous oil TAG crystals. Thesedimentation of droplets was even more pronounced in theabsence of DAG+ ZnSt, i.e., for the emulsion prepared withemulsifying mixture B (Figure 9b), showing not only theemulsification potential of ZnSt crystals but also their presumableinfluence on the arrangement of water droplets and, as aconsequence, the resistance of the system to the migration ofdroplets.
III.B. Water:Oil Weight Ratios ) 60:40÷80:20.In the caseof water-rich mixtures, destabilization of W/O emulsions, causedby cooling these systems to 61-60°C, resulted in phase inversionand the formation of O/W dispersions (Figure 2). The transitionwas signaled by a sharp increase in conductivity, from 0-0.1µS before inversion, to 20-25µS as the O/W dispersion formed.CLSM examination of the dispersions revealed the coexistenceof two types of structural components: hollow, sphericalaggregates of flocculated lipid particles and separated dropletsof the crystallized oil phase. In Figure 10, micrographs of thesurface (a) and the cross-section (b, c) of large spherical aggregatesare shown. These structures were built up from numerous smallunits (indicated by black arrows in Figure 10c), which are probablymultilamellar spherulites of MAG.
Formation of multilamellar vesicles in binary, water-distilledMAG systems, was first described by Larsson, for mixturescontaining more than 50 wt % water.3 As reported by Krog,4,39
the phase behavior of MAGs in water depends on their purity,i.e., the presence of DAGs and TAGs. Distilled MAGs formliquid crystalline mesomorphic phases, whereas mono-diacyl-glycerols in most cases form emulsions due to a relatively highcontent of TAGs. According to Corkery and Hyde,40 metallic
Figure 9. MLS analysis of the time-dependent changes in thestructure of emulsions (W:O weight ratio) 40:60) prepared with(O) AGs/ZnSt emulsifier, (+) mixture A, and (b) mixture B, andstored at 50( 0.1 °C. Graph a shows the backscattering profile ofthe emulsions (changes in BS5-50 mm values observed prior to thesedimentation of water droplets and the separation of the continuousoil phase occurred). Graph b shows the kinetics of the subsequentformation of the separated oil phase layer in the uppermost regionsof the emulsion samples (H is a thickness of the oil layer). Eachpoint on the curves represents an average of three preparations andmeasurements.
Figure 10. Surface (a) and cross-section (b, c) of the spherical aggregates in O/W dispersion (O:W weight ratio) 20:80). Black arrowsin image (c) indicate the individual lipid units that formed the aggregates, whereas white arrows indicate the separated droplets of thecrystallized oil phase.
2494 Langmuir, Vol. 22, No. 6, 2006 Macierzanka et al.

soaps, TAGs, and many DAGs do not exhibit lyotropicmesomorphism and are thus nonswelling in water. Taking intoaccount these findings, we hypothesize that the formation ofMAG spherulites in the O/W dispersions took place afterseparation of the glycerol monoester molecules from nonswellingcomponents of AGs/ZnSt emulsifier (i.e., zinc stearate, DAG,and TAG). Saturated C16/C18 MAGs are dispersible in waterbetween 55 and 70°C in the form of lamellar aggregates orvesicles.5 As found by Borne´ et al.41 for the ternary monoolein-sodium oleate-water (2H2O) system, different vesicle phasescan be formed spontaneously at high water contents upon dilutingcubic and lamellar phases. According to van Duynhoven et al.,8
fatty acid can be accommodated in the MAG bilayer of the swollenR-gel phase, but upon transition to the coagel phase (â crystals+ water), it is separated into a relative “noncoagel” mobile phase,coexisting with the coagel crystal plates.
Besides MAG spherulites, crystallized droplets of the oil phasewere also observed (see white arrows in Figure 10c). Thesedroplets were formed probably as a result of crystallization ofDAG, TAG, and paraffin wax in the oil phase. As mentionedearlier in the previous section, ZnSt crystals are able to effectivelyadsorb at the water-oil interface. Additionally, as reported byAwad and co-workers,31 glycerol distearate can form interfacialtemplates in O/W emulsions and accelerate the crystal nucleationrate in an emulsified oil phase. Thus, it is highly possible thatthe combination of these two compounds in the water-rich O/Wdispersion could determine the formation of the interfacial layerthat covered the droplets of crystallized oil phase.
From Figure 11, it can be seen that the structure of the sphericalaggregates depended on the temperature. Cooling of thedispersion, from 50 to 25°C, resulted in the formation of moretightly packed crystalline walls of the aggregates. Spheruliteswere found to lose their separate character and form a moreuniform structure. During the emulsification some sphericalaggregates were broken up due to the shear applied (Figure 12a).At 25 °C, many spherulites that initially formed aggregates were
seen to adsorb at the surface of those spherical aggregates thatremained undestroyed in the system (Figure 12b,c). After 3 daysstorage at 23( 1 °C, dispersions revealed the presence of giantspherical and oval aggregates (Figure 13a). Crystallized dropletsof the oil phase were separated from the aggregates. The close-packed structure of the thick walls of the aggregates can beclearly seen in Figure 13 (panels b and c).
The phenomena described are supposed to be caused by agradual phase transition of theR-crystalline gel phase of MAG,which formed spherulites, intoâ-crystalline coagel. In theliterature,4 a specific mode of crystallization has been suggestedfor the dispersion of monocaprin in water. It is proposed that,as a consequence of the contact of dispersion aggregates withtheâ-crystal surface, the bimolecular lipid leaflets unfold fromthe aggregates into the surface of the crystal. The crystallitesthen grow with discrete layers in a direction perpendicular to thesurface plane. A similar mechanism of crystallization may beproposed as an explanation of our microscopic observations.
To obtain a quantitative measure of the changes in dispersionof the O/W system, MLS measurements were performed. Theadsorption of small spherulites at the surface of undestroyedspherical aggregates and their fusion with the crystalline structureof the aggregates resulted in a decrease of a degree of dispersionof the O/W system. This was indicated by the drop in the BS5-50
mmlevel of the dispersion, observed during 3 days after preparation(Figure 14a). The subsequent increase of the BS5-50 mm valuemay be attributed to the gradual transformation of theR-gel intoa coagel network in the crystalline structure of the sphericalaggregates. It is known that the MAG coagel phase is capableof enclosing large quantities of water.25,35 Hence, the effectivevolume fraction of the dispersed phase increased, yielding higherintensity of light backscattered by the dispersion.
(38) Nakajima, Y.J. Am. Oil Chem. Soc.2004, 81, 907-912.(39) Krog, N. InLipid Technologies and Applications, Part 5; Gunstone, F.
D., Padley, F. B., Eds.; Marcel Dekker: New York, 1997; Chapter 20.(40) Corkery, R. W.; Hyde, S. T.Langmuir1996, 12, 5528-5529.(41) Borne, J.; Nylander, T.; Khan, A.Langmuir2001, 17, 7742-7751.
Figure 11. CLSM micrographs of surface (upper images) and cross-section (lower images) of selected spherical aggregates in O/Wdispersion (O:W) 20:80 wt/wt). Comparison of the samples collectedat 50 (a) and 25°C (b).
Figure 12. CLSM images of O/W dispersion obtained after coolingthe system (O:W) 20:80 wt/wt) from 80 to 25°C. Arrows in imagea indicate the fragments of the aggregates that were destroyed dueto stirring the system. Some spherulites were found to adsorb at thesurface of other aggregates (arrows in the micrographs b and c).Image c shows the magnification of surface of the aggregate withadsorbed spherulites.
Systems Prepared with Acylglycerols/Zinc Stearate Langmuir, Vol. 22, No. 6, 20062495

As reported by Chupin et al.,42 the 2H NMR study on lipidorganization and dynamics of the binary, deuterated mono-stearoylglycerol-water system, showed the liquid crystalline-to-gel phase transformation at temperature lowered from 67 to55 °C. According to the authors of these investigations, uponfurther cooling of the gel below 40°C, the transition into thecoagel phase took place. This transition occurred gradually intime, indicating the metastability of the gel phase. The trans-formation of theR-gel into a coagel, in water-distilled MAGsmixtures, is relatively quick if the pH is as low as 5-6.4 In O/Wdispersions examined by us, the pH varied in the narrow range4.8-5.0, during the dispersion (80-25 °C) and storage at 23(1°C. The acidic pH value was due to the presence of some freestearic acid. The formation of coagel phase can be also promotedby mechanical agitation.25
The increased BS5-50 mm level of the dispersion remainedconstant for prolonged time (∼1 year at 23( 1 °C, Figure 14a),showing no detectable changes in the size and migration of thedispersed particles. Similarly, the “W/O+ O/W/O” emulsionpresented in the previous section (Figure 8b), the 1-year-oldO/W dispersion required heating to 55-60 °C for the mostconsiderable flocculation/coalescence-induced decrease in theBS5-50 mm level to be observed (Figure 14b). The onset ofcreaming and resulting progressive separation of water phase atthe bottom of test tubes was observed after the maximumtemperature of analysis, i.e., 60°C, was reached and kept constantfor about 15 min (data not shown).
After storage at 23( 1 °C for several days after preparation,the O/W dispersions developed a firmer consistency. It wasobserved that the penetration depth of the measuring punch intothe samples dropped to less than 1 mm. The change of consistency,
from an initial semifluid to a final semisolid state, took 4-135days, depending on the water content (Figure 15). It appears thatsuch an increase in hardness was caused by the transition in theMAG-crystalline phase, as proposed above. All of the dispersionsstored one year at 23( 1°C were stable during the centrifugationat 10 000 rpm (5 min). Phase separation was not observed in thistest. As postulated by Heertje and co-workers,25 the increase inhardness, observed also for liquid crystalline phases of distilledMAGs and water, may be attributed to the phase change fromR-gel to coagel. They have argued that the change of consistencyarises from a diffusion-controlled growth of the MAG crystalsand their subsequent interconnection into a fine-mashed network.The similar change of the rheological properties of MAG gels,attributed to theR-gelfcoagel conversion, was also demonstratedby Sein et al.7
(42) Chupin, V.; Boots, J.-W. P.; Killian, J. A.; Demel, R. A.; de Kruijff, B.Chem. Phys. Lipids2001, 109, 15-28.
Figure 13. CLSM visualization of O/W dispersion (O:W) 20:80wt/wt) after storage for 3 days at 23( 1°C. Arrows indicate numerousdroplets of the crystallized oil phase that were located between thegiant aggregates (a). Structure of the surface, and cross-section ofselected, representative aggregates are shown in images b and c,respectively.
Figure 14. Backscattering profile of O/W dispersion (O:W) 20:80 wt/wt) prepared with the AGs/ZnSt emulsifier: (a) storage at 23( 1 °C; (b) the effect of increased temperature on the stability ofthe dispersion stored 1 year at 23( 1 °C prior to measurement. Forabbreviations see text.
Figure 15. Influence of storage time at 23( 1°C on the consistencyof O/W dispersions. Water content in the dispersion (wt %): 60 (2),70 (9), 80 (b).
2496 Langmuir, Vol. 22, No. 6, 2006 Macierzanka et al.

The proof for theR-gelf coagel transition in O/W dispersionprepared with AGs/ZnSt emulsifier seems to come from theresults of the DSC measurements (Figure 16). From thermogramsobtained for heating and reheating of dispersion samples (O:Wphase ratio) 20:80, wt/wt), DCI values were calculated (see theExperimental Section, II.E.). As shown in Figure 16A, almostcomplete conversion to coagel (DCI≈ 2), at 23( 1 °C, tookabout 90 days. In this case (Figure 16B), the endothermic peakin the first heating curve, corresponding to the melting of thecoagel phase (curve a), presents about twice the heat content ofthe sample, compared to the melting ofR-gel phase, representedby the peak in the second heating curve (c). Reheating wasperformed just after controlled cooling of the dispersion sample
(curve b). DSC experiments were not focused on the examinationof mechanical, chemical, or thermal treatments of the dispersionon the kinetics of coagel formation but rather on the investigationof possibility of theR-gelf coagel transformation in the MAG-based, multicomponent (complex emulsifier/water/oil), dispersedsystem. Formation of the MAG coagel phase was previouslystudied mainly for the binary MAG-water gels.4,7,25,26,42
IV. Conclusions
The water/oil ratio as well as the change of temperature stronglydetermined the character of the phase transitions that took placeduring the emulsification in the presence of acylglycerols/zincstearate emulsifier.
The emulsifier crystallization-induced destabilization of W/Oemulsions produced a phase inversion and subsequent formationof (i) mixtures of W/O emulsions and double (O/W/O) emulsions(“W/O + O/W/O”), for 20-50 wt % water systems, and (ii)complex O/W dispersions (60-80 wt % of water) that containedlarge spherical aggregates of flocculated lipid particles, andcrystallized droplets of oil phase.
CLSM, DSC, MLS, and consistency experiments showed thepossible transition of monostearoylglycerol-basedR-crystallinegel phase to a coagel state, in O/W dispersions over time. Thechange could be monitored via the evaluation of a dispersioncoagel index (DCI), and microscopic inspection of the dispersionmicrostructure. CLSM was effective in the visualization of theMAG aggregates.
Both, “W/O+ O/W/O” emulsions and O/W dispersions seemto be stable over considerable time (at least one year at 23(1°C). The maximum water uptake in stable “W/O+ O/W/O”system was 50 wt %.
Acknowledgment. We are grateful to Dr. R. Pawłowicz(Department of Food Chemistry, Technology and Biotechnology,Gdansk University of Technology) for technical assistance withthe DCS measurements. This work was partially supported byKBN, the State Committee for Scientific Research (ResearchProject 7 T09B 108 20).
LA052937P
Figure 16. Thermal behavior of O/W dispersion (O:W weight ratio) 20:80) prepared with AGs/ZnSt emulsifier. Section A shows thestorage time-dependent formation of coagel in the O/W dispersion(at 23( 1 °C), displayed as an increase of dispersion coagel index(DCI) value. Section B presents the DSC thermograms of heating(a), cooling (b), and reheating (c) of the O/W dispersion, stored 90days at 23( 1 °C, prior to examination.
Systems Prepared with Acylglycerols/Zinc Stearate Langmuir, Vol. 22, No. 6, 20062497