
Phase II: Optimizing Cleaning Energy in Batch and Inline Spray … · 2016-11-16 · Phase II:...
63
Phase II: Optimizing Cleaning Energy in Batch and Inline Spray Systems Steve Stach, Austin American Tech. Mike Bixenman, Kyzen Corp.
Transcript of Phase II: Optimizing Cleaning Energy in Batch and Inline Spray … · 2016-11-16 · Phase II:...
Phase II:
Optimizing Cleaning Energy
in Batch and
Inline Spray Systems
Steve Stach, Austin American Tech.Mike Bixenman, Kyzen Corp.

Outline
Project Review
Phase 1 Questions / Theory
Phase II Results
Phase II Conclusions / Tools
Future Work – Phase III
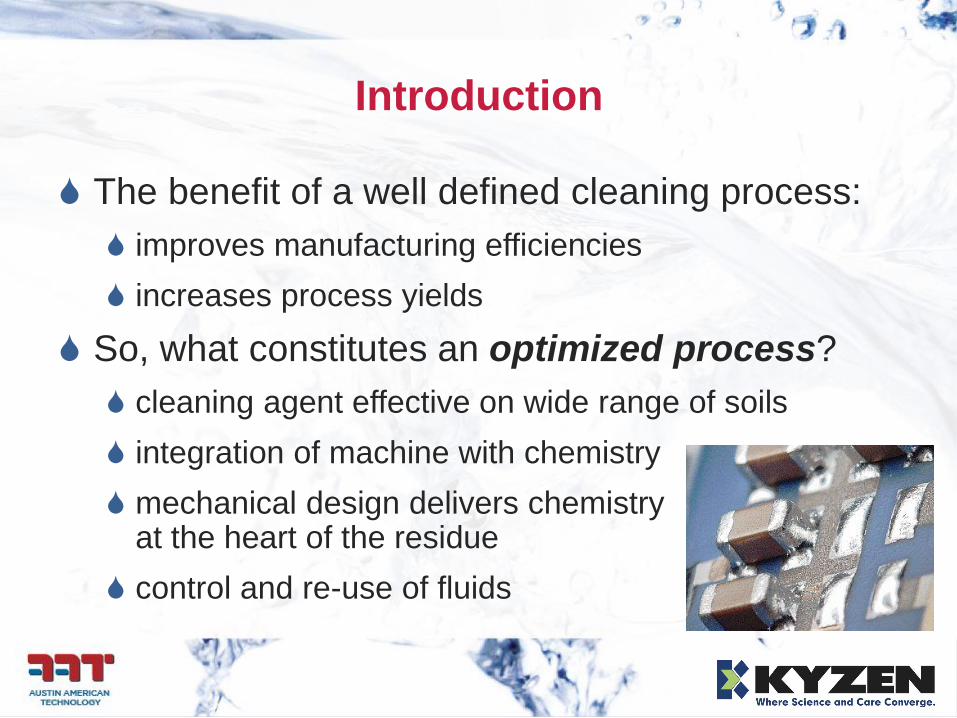
Introduction
The benefit of a well defined cleaning process:
improves manufacturing efficiencies
increases process yields
So, what constitutes an optimized process?
cleaning agent effective on wide range of soils
integration of machine with chemistry
mechanical design delivers chemistry at the heart of the residue
control and re-use of fluids
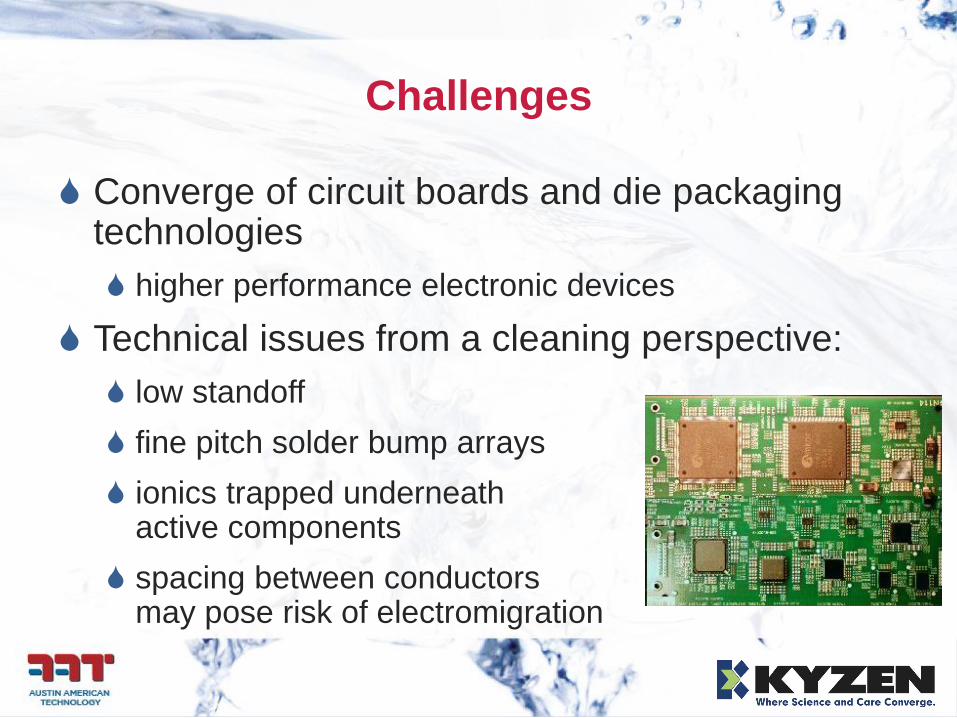
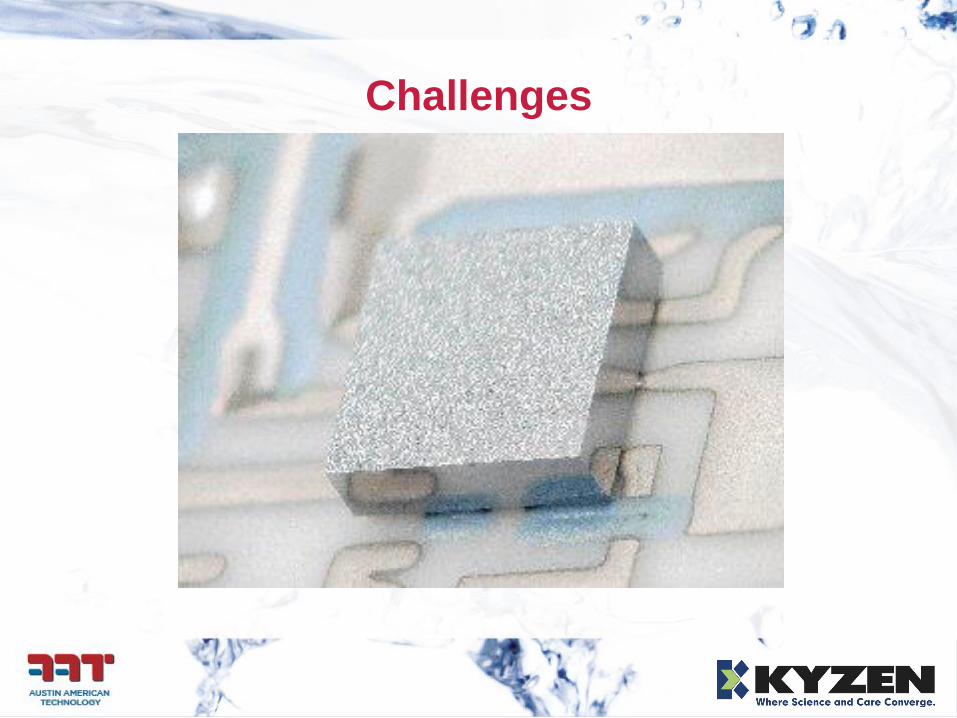
Challenges
Converge of circuit boards and die packaging technologies
higher performance electronic devices
Technical issues from a cleaning perspective:
low standoff
fine pitch solder bump arrays
ionics trapped underneath active components
spacing between conductors may pose risk of electromigration
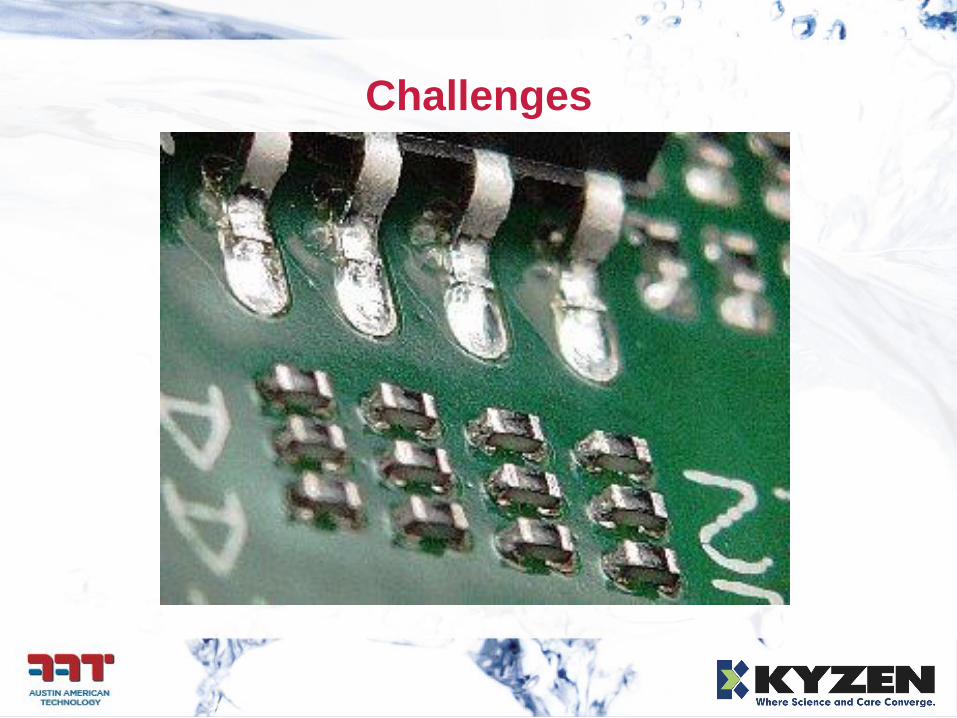
Challenges
Challenges
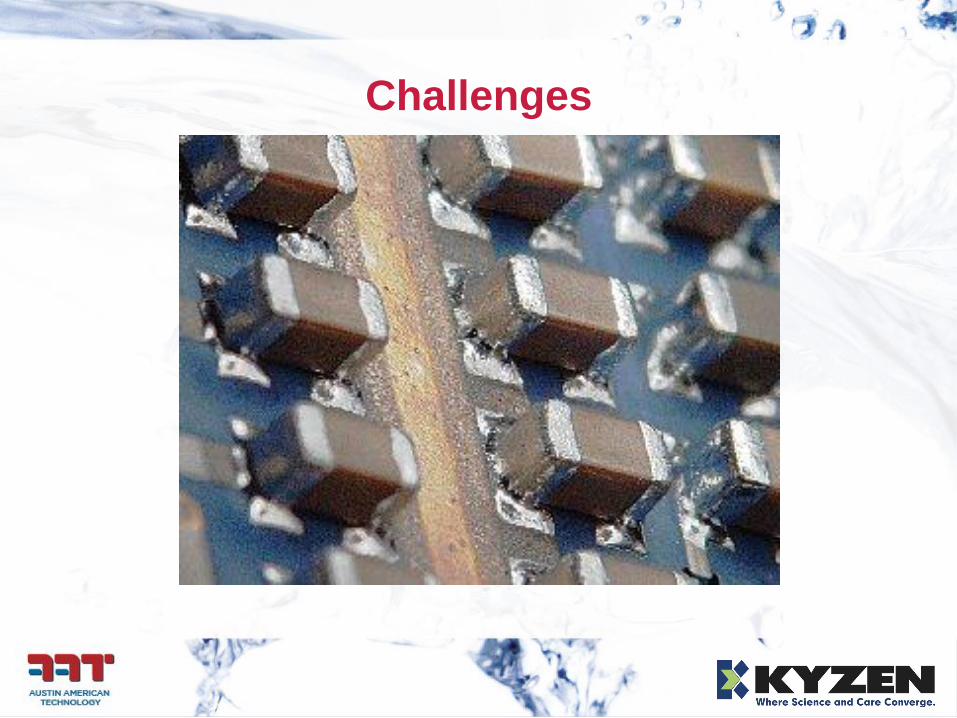
Challenges
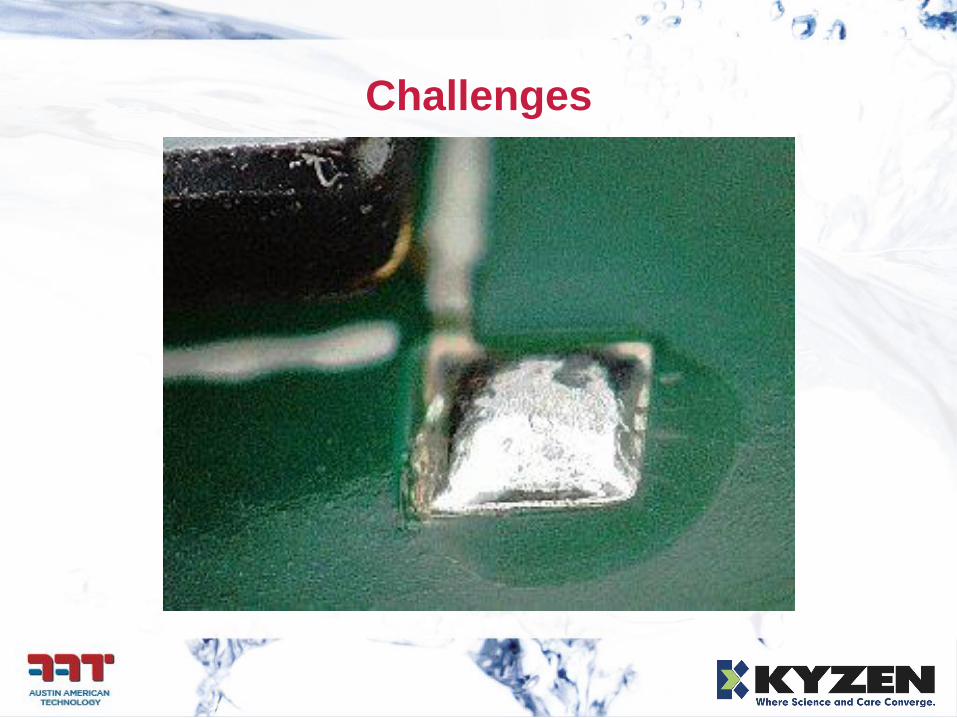
Challenges
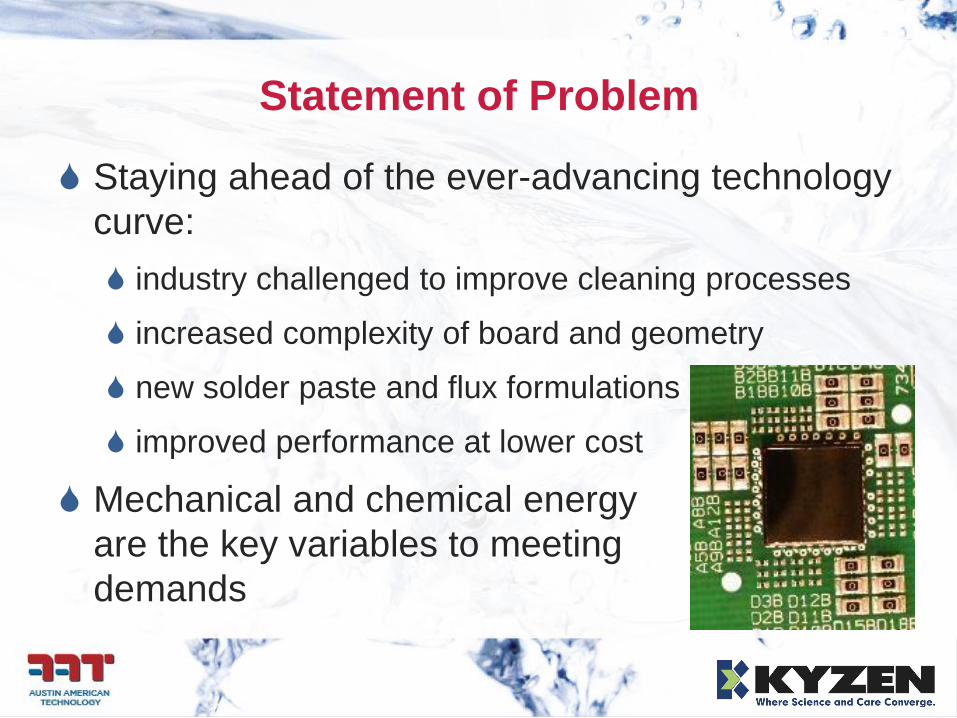
Statement of Problem
Staying ahead of the ever-advancing technology
curve:
industry challenged to improve cleaning processes
increased complexity of board and geometry
new solder paste and flux formulations
improved performance at lower cost
Mechanical and chemical energy
are the key variables to meeting
demands
Research Basis
Cleaning is becoming more market critical
Miniaturization converges circuit assembly and die packaging technologies
More assemblers cleaning “no-clean” because of performance issues
More assemblers cleaning “Lead-free” as residues are generally tougher & uglier than 63/37 leaded “no-clean”
Our Hypothesis – Understanding mechanical and chemical energy are the key variables to meeting demands
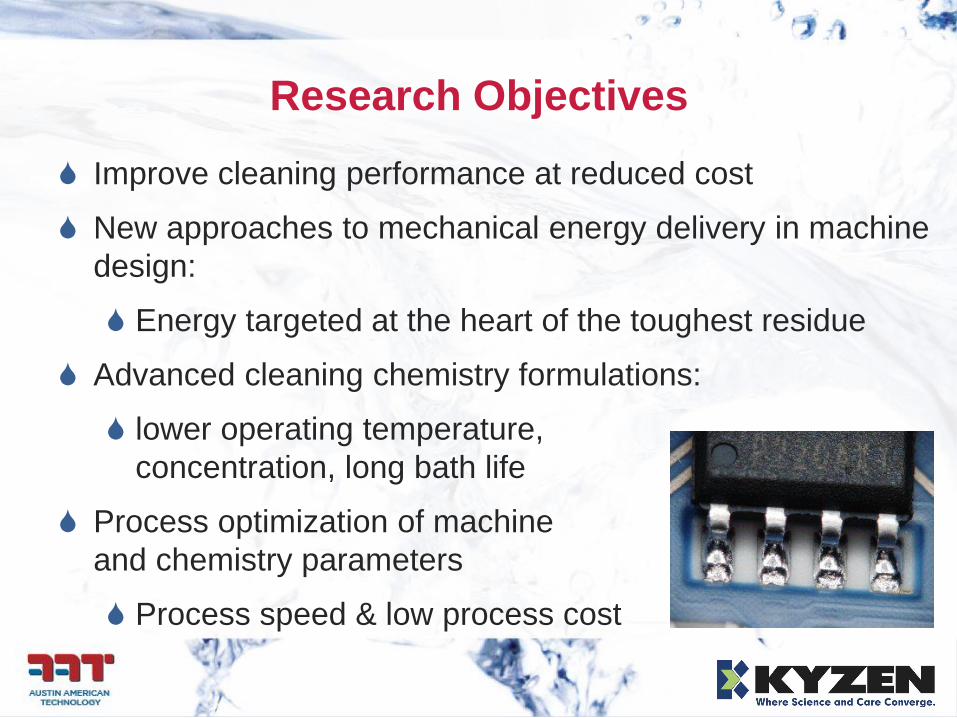
Research Objectives
Improve cleaning performance at reduced cost
New approaches to mechanical energy delivery in machine
design:
Energy targeted at the heart of the toughest residue
Advanced cleaning chemistry formulations:
lower operating temperature,
concentration, long bath life
Process optimization of machine
and chemistry parameters
Process speed & low process cost
Phase II Research Questions
What are the cleaning mechanisms?
What are the rates of the cleaning mechanisms?
How does the gap spacing affect the cleaning rate?
Is there any difference between lead-free and
leaded flux cleaning?
How does flux aging affect cleaning rate?
Can we write an equation to predict cleaning rate?
Project Review
Research Objective
Understand & design better cleaning fluids and “spray in air” de-fluxing systems to meet new market demands
Smaller, faster, more reliable, eco-friendly electronic products
Phase I (2004) – Develop theoretical model
Propose Rate equation for predicting cleaning performance
Define forces and how they are effected by spray nozzle design
Phase II (2005) – Design experiment to test phase I model
“Real time ” measurement of cleaning rate
Modified rate equation based on observed data
Comparison of lead-free vs. traditional leaded no-clean
Phase III (2006) - Optimize system variables
Multiple-lead-free fluxes, process timing, chemistry, machine and process variables,
Phase I: Rate Theory
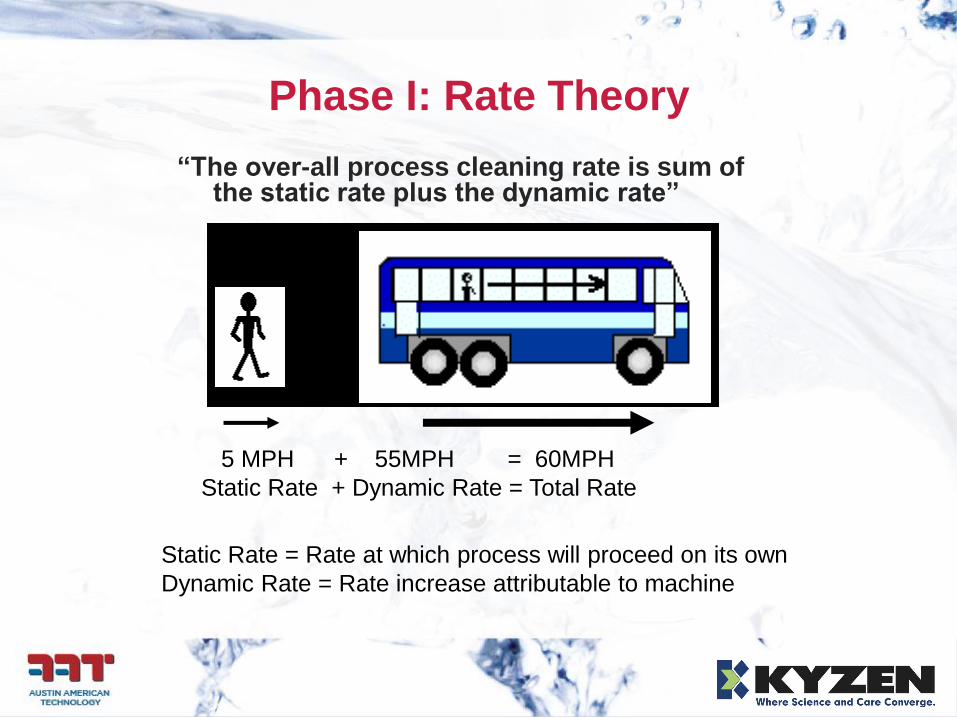
“The over-all process cleaning rate is sum of the static rate plus the dynamic rate”
5 MPH + 55MPH = 60MPH
Static Rate + Dynamic Rate = Total Rate
Static Rate = Rate at which process will proceed on its own
Dynamic Rate = Rate increase attributable to machine
Phase I: Rate Theory
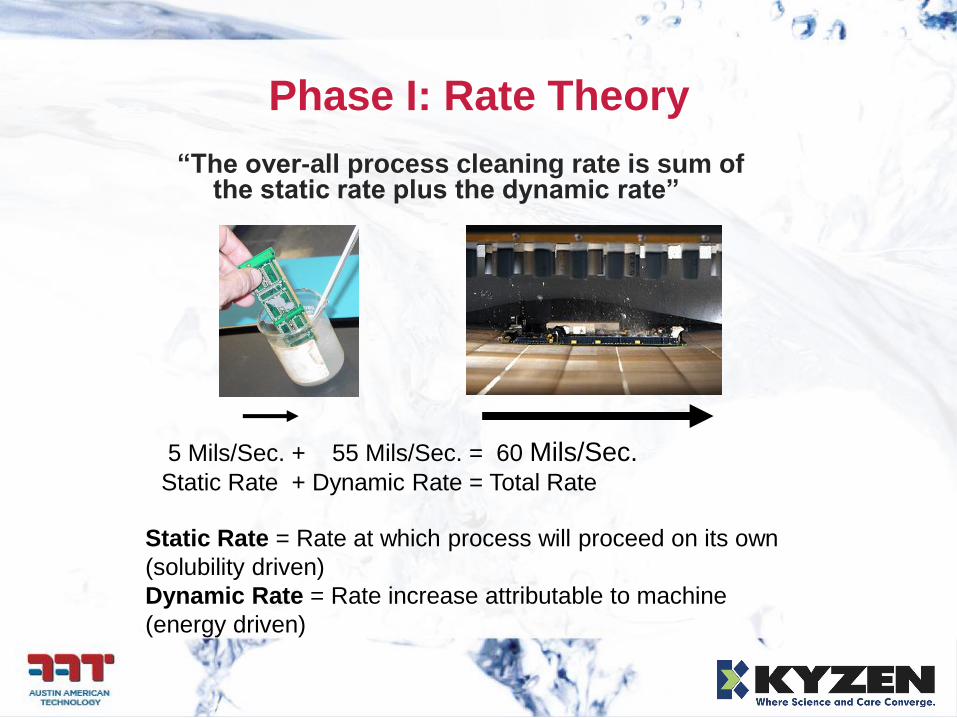
“The over-all process cleaning rate is sum of the static rate plus the dynamic rate”
5 Mils/Sec. + 55 Mils/Sec. = 60 Mils/Sec. Static Rate + Dynamic Rate = Total Rate
Static Rate = Rate at which process will proceed on its own
(solubility driven)
Dynamic Rate = Rate increase attributable to machine
(energy driven)
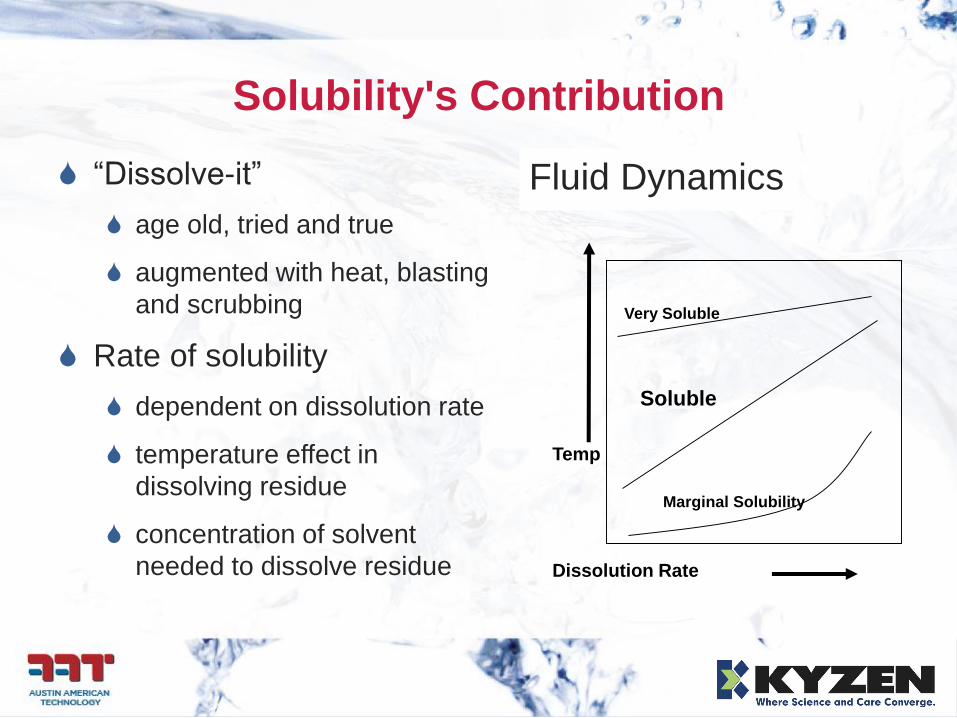
Solubility's Contribution
“Dissolve-it”
age old, tried and true
augmented with heat, blasting
and scrubbing
Rate of solubility
dependent on dissolution rate
temperature effect in
dissolving residue
concentration of solvent
needed to dissolve residue
Fluid Dynamics
Soluble
Very Soluble
Marginal Solubility
Dissolution Rate
Temp
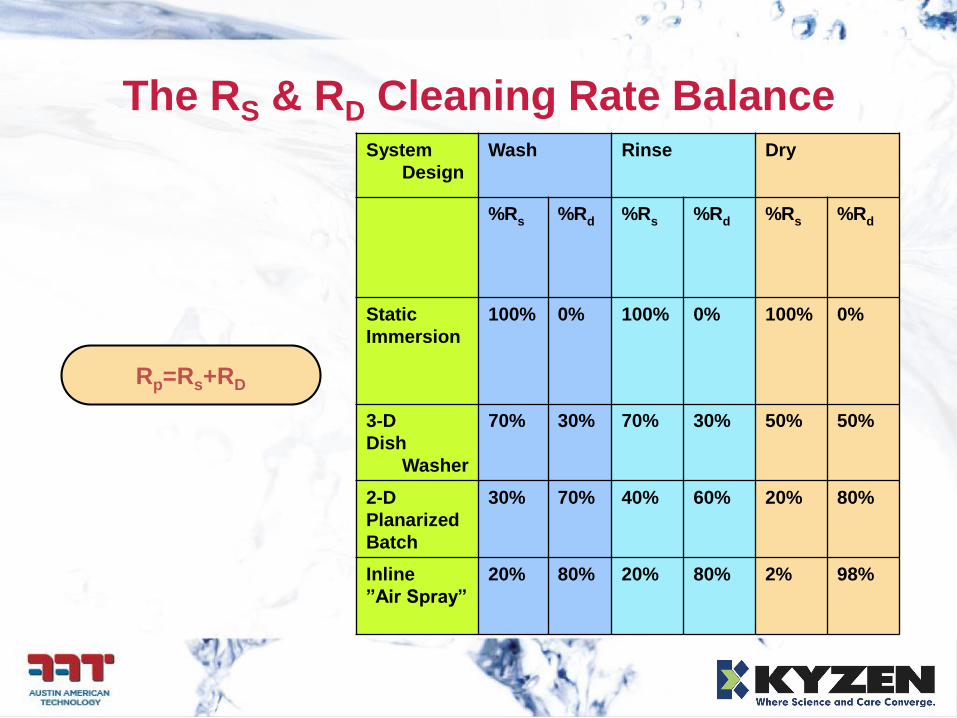
The RS & RD Cleaning Rate Balance
Rp=Rs+RD
System
Design
Wash Rinse Dry
%Rs %Rd %Rs %Rd %Rs %Rd
Static
Immersion
100% 0% 100% 0% 100% 0%
3-D
Dish
Washer
70% 30% 70% 30% 50% 50%
2-D
Planarized
Batch
30% 70% 40% 60% 20% 80%
Inline
”Air Spray”
20% 80% 20% 80% 2% 98%
Process Parameters
Key to predicting optimized process performance
understanding the nature of the soil and the chemical
and physical needs for removing it
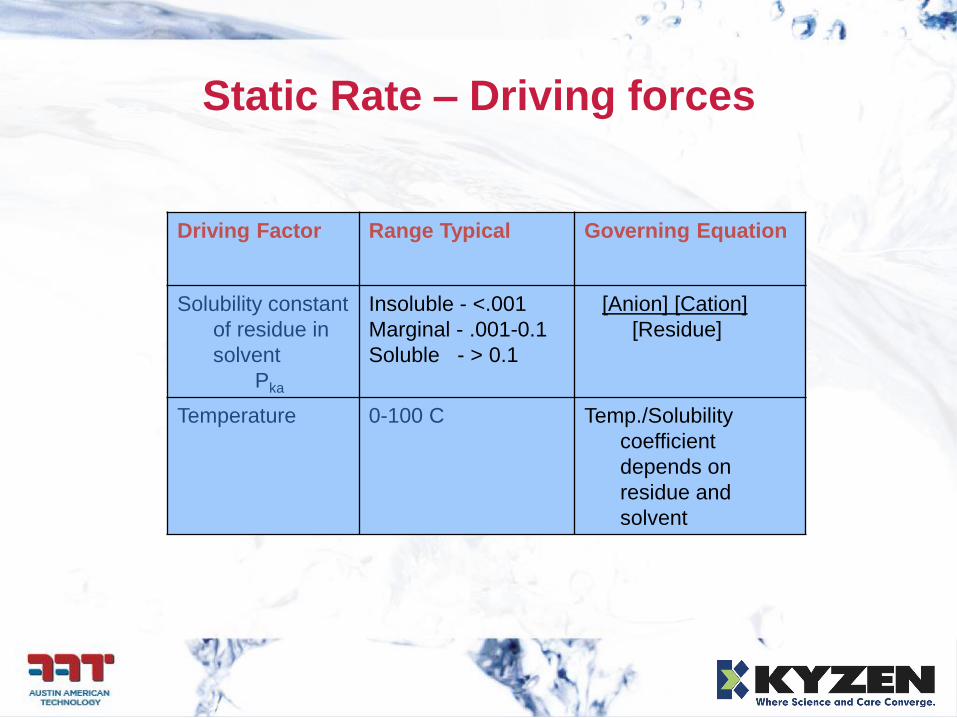
Static Rate – Driving forces
Driving Factor Range Typical Governing Equation
Solubility constant
of residue in
solvent
Pka
Insoluble - <.001
Marginal - .001-0.1
Soluble - > 0.1
[Anion] [Cation]
[Residue]
Temperature 0-100 C Temp./Solubility
coefficient
depends on
residue and
solvent
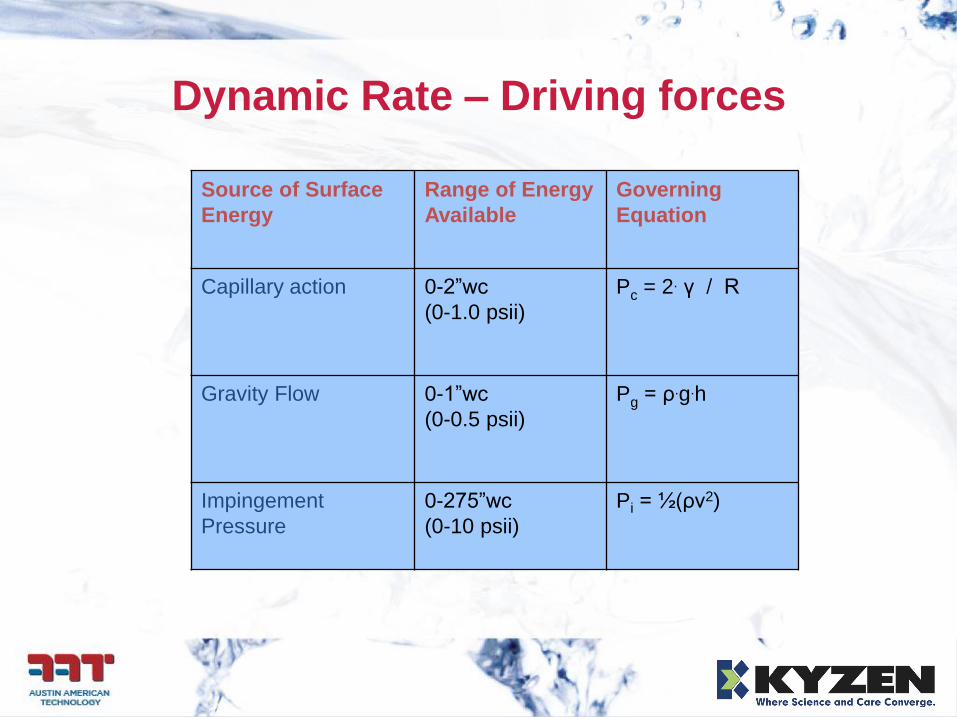
Dynamic Rate – Driving forces
Source of Surface
Energy
Range of Energy
Available
Governing
Equation
Capillary action 0-2”wc
(0-1.0 psii)
Pc = 2. γ / R
Gravity Flow 0-1”wc
(0-0.5 psii)
Pg = ρ.g.h
Impingement
Pressure
0-275”wc
(0-10 psii)
Pi = ½(ρv2)
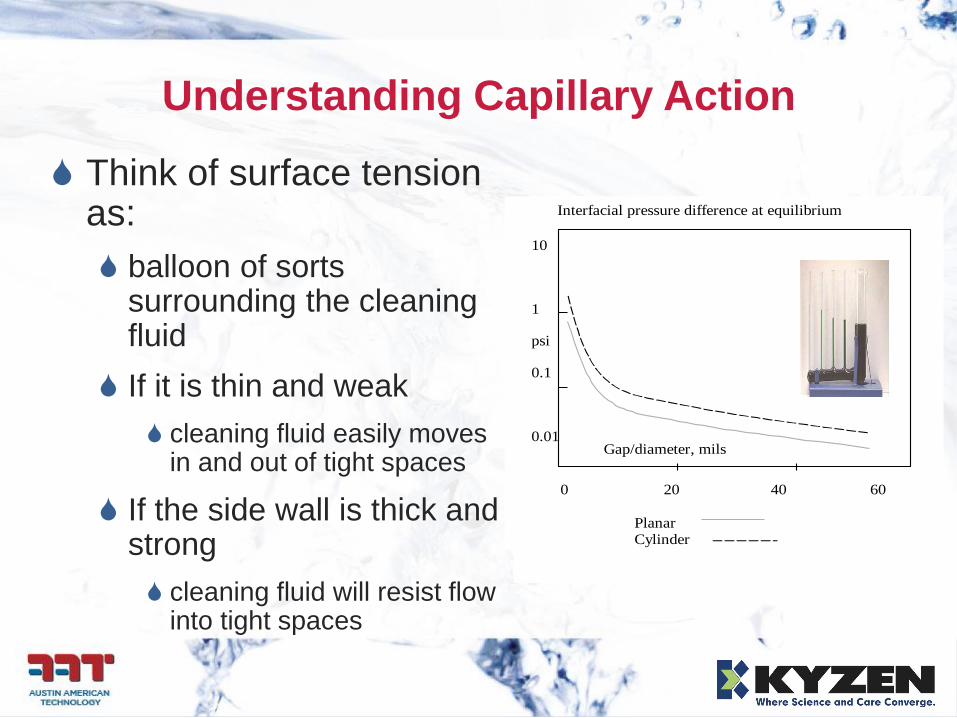
Understanding Capillary Action
Interfacial pressure difference at equilibrium
10
1
psi
0.1
0.01
0 20 40 60
Gap/diameter, mils
Planar Cylinder
Think of surface tension as:
balloon of sorts surrounding the cleaning fluid
If it is thin and weak
cleaning fluid easily moves in and out of tight spaces
If the side wall is thick and strong
cleaning fluid will resist flow into tight spaces
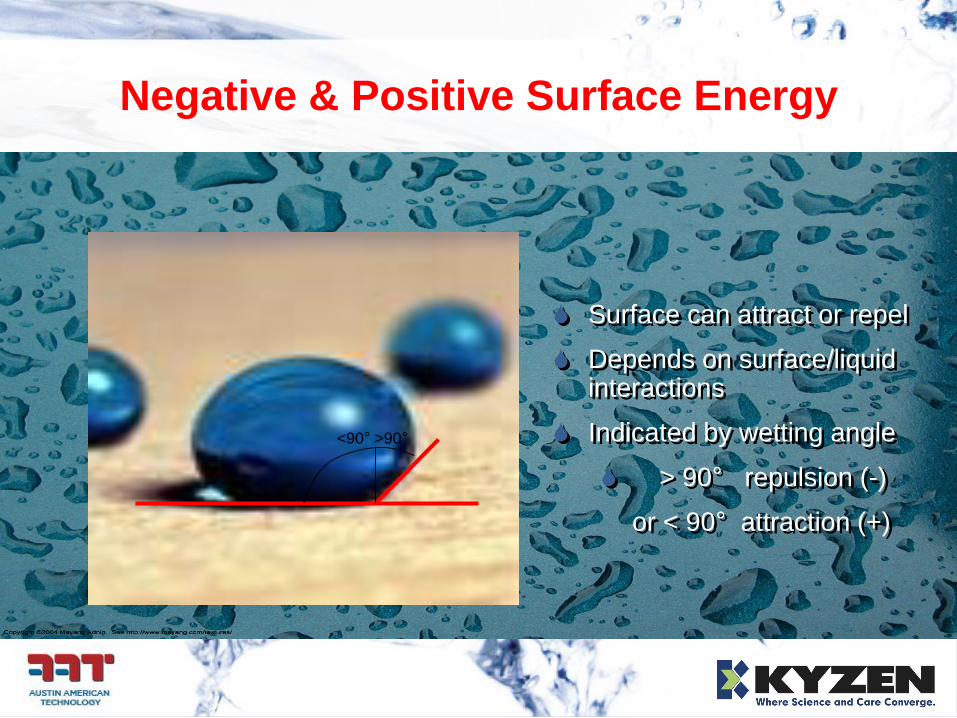
Negative & Positive Surface Energy
Surface can attract or repel
Depends on surface/liquid interactions
Indicated by wetting angle
> 90° repulsion (-)
or < 90° attraction (+)
<90° >90°

Spray System Nozzle Design
Spray Type Typical
pressure @
2”,50psi man.
/Pressure
loss/in
Indicated use
Fan/Delta 2 psi /
~50%
drop/inch
Wide coverage,
overlap for high
impingement or
close work
distance
Conical 0.4 psi /
~75%
drop/inch
Widest coverage
area, lowest
kinetic energy,
flooding
applications
Coherent 10 psi /
~10%
drop/inch
Smallest coverage,
highest energy
density over
longest distance
Four variables determine
Impact pressure
Nozzle type
Distance
Manifold pressure
Fluid Density
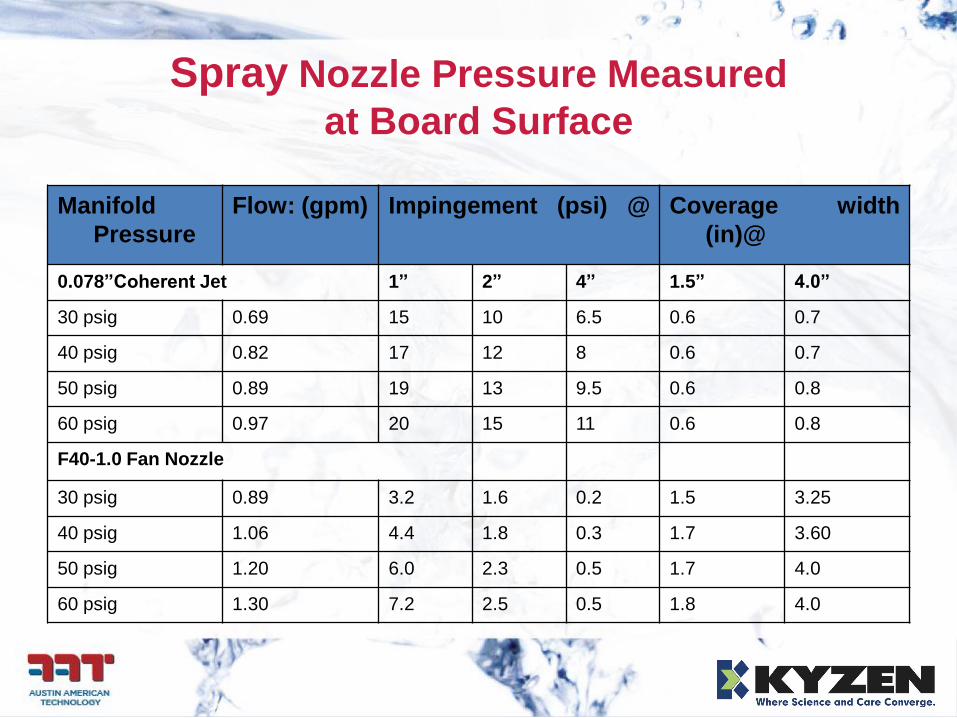
Spray Nozzle Pressure Measured
at Board Surface
Manifold
Pressure
Flow: (gpm) Impingement (psi) @ Coverage width
(in)@
0.078”Coherent Jet 1” 2” 4” 1.5” 4.0”
30 psig 0.69 15 10 6.5 0.6 0.7
40 psig 0.82 17 12 8 0.6 0.7
50 psig 0.89 19 13 9.5 0.6 0.8
60 psig 0.97 20 15 11 0.6 0.8
F40-1.0 Fan Nozzle
30 psig 0.89 3.2 1.6 0.2 1.5 3.25
40 psig 1.06 4.4 1.8 0.3 1.7 3.60
50 psig 1.20 6.0 2.3 0.5 1.7 4.0
60 psig 1.30 7.2 2.5 0.5 1.8 4.0
Phase II Testing Outline
Test Parameters/Matrix Development
Test Vehicle Design & Prep
Development of Cleaning Analysis Recording
Lab “CARL”
Video Analysis
Testing Results
Conclusions
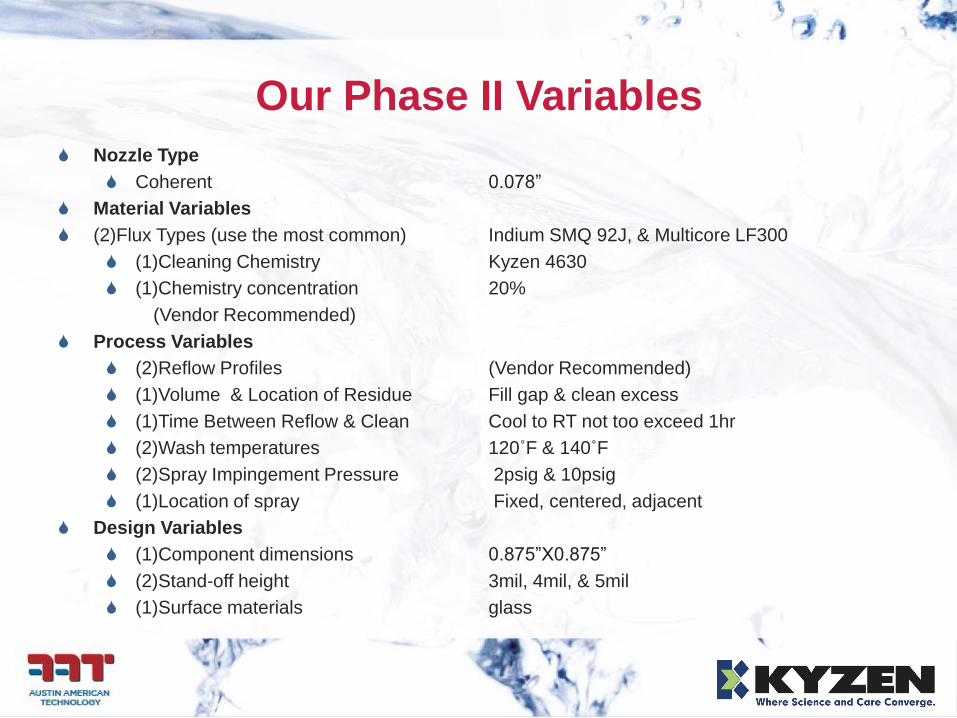
Our Phase II Variables
Nozzle Type
Coherent 0.078”
Material Variables
(2)Flux Types (use the most common) Indium SMQ 92J, & Multicore LF300
(1)Cleaning Chemistry Kyzen 4630
(1)Chemistry concentration 20%
(Vendor Recommended)
Process Variables
(2)Reflow Profiles (Vendor Recommended)
(1)Volume & Location of Residue Fill gap & clean excess
(1)Time Between Reflow & Clean Cool to RT not too exceed 1hr
(2)Wash temperatures 120˚F & 140˚F
(2)Spray Impingement Pressure 2psig & 10psig
(1)Location of spray Fixed, centered, adjacent
Design Variables
(1)Component dimensions 0.875”X0.875”
(2)Stand-off height 3mil, 4mil, & 5mil
(1)Surface materials glass
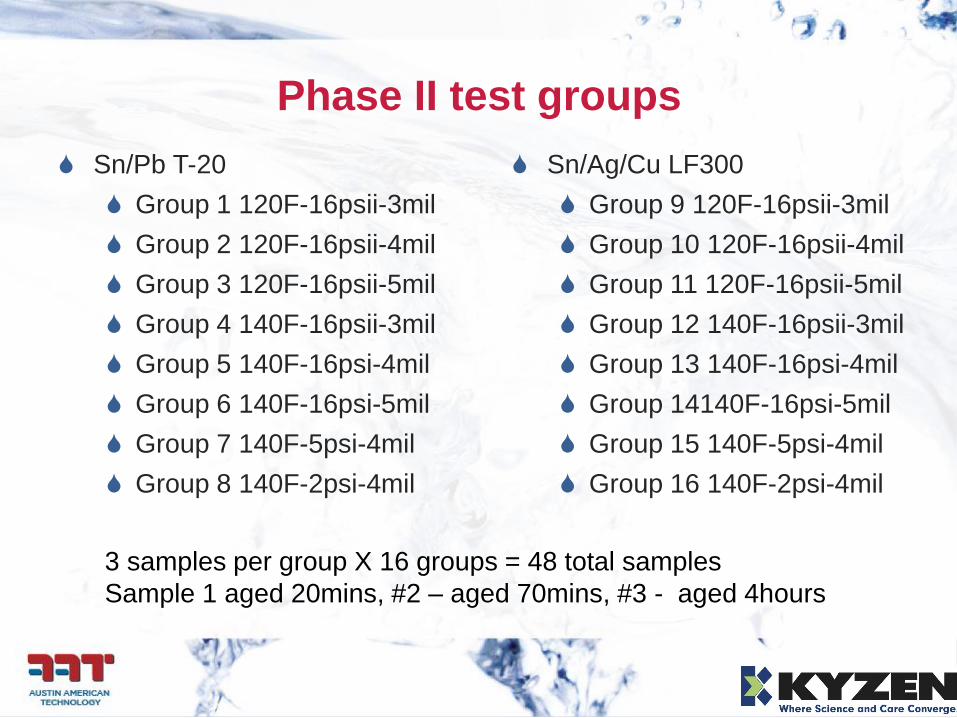
Phase II test groups
Sn/Pb T-20
Group 1 120F-16psii-3mil
Group 2 120F-16psii-4mil
Group 3 120F-16psii-5mil
Group 4 140F-16psii-3mil
Group 5 140F-16psi-4mil
Group 6 140F-16psi-5mil
Group 7 140F-5psi-4mil
Group 8 140F-2psi-4mil
3 samples per group X 16 groups = 48 total samples
Sample 1 aged 20mins, #2 – aged 70mins, #3 - aged 4hours
Sn/Ag/Cu LF300
Group 9 120F-16psii-3mil
Group 10 120F-16psii-4mil
Group 11 120F-16psii-5mil
Group 12 140F-16psii-3mil
Group 13 140F-16psi-4mil
Group 14140F-16psi-5mil
Group 15 140F-5psi-4mil
Group 16 140F-2psi-4mil
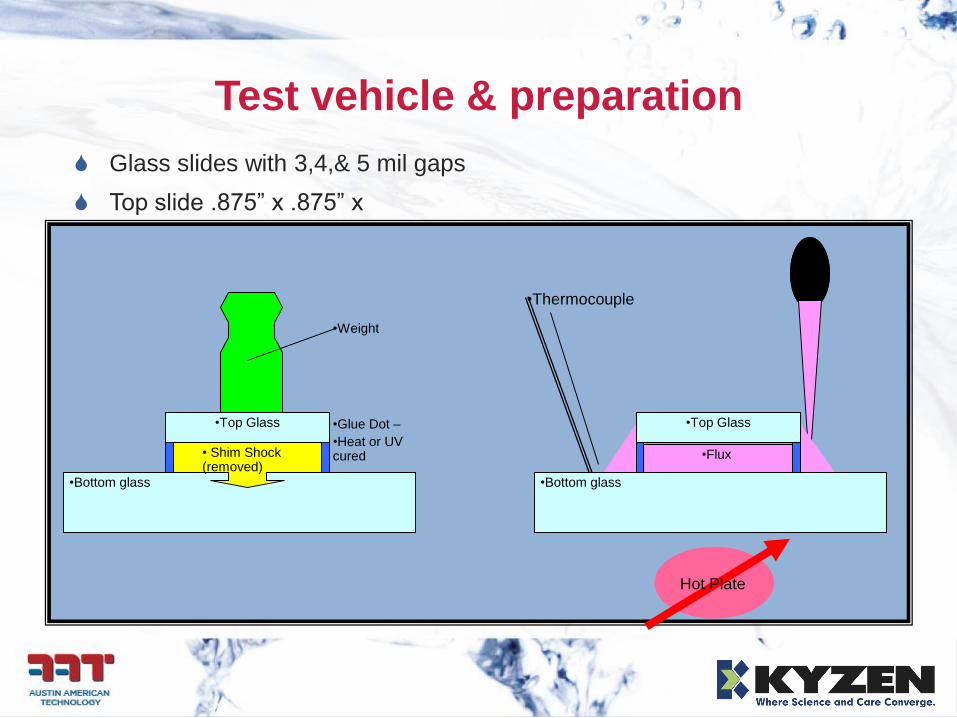
Test vehicle & preparation
•Flux
Glass slides with 3,4,& 5 mil gaps
Top slide .875” x .875” x
•Bottom glass
•Glue Dot –
•Heat or UV cured• Shim Shock
(removed)
•Top Glass
•Weight
•Top Glass
Hot Plate
•Bottom glass
•Thermocouple
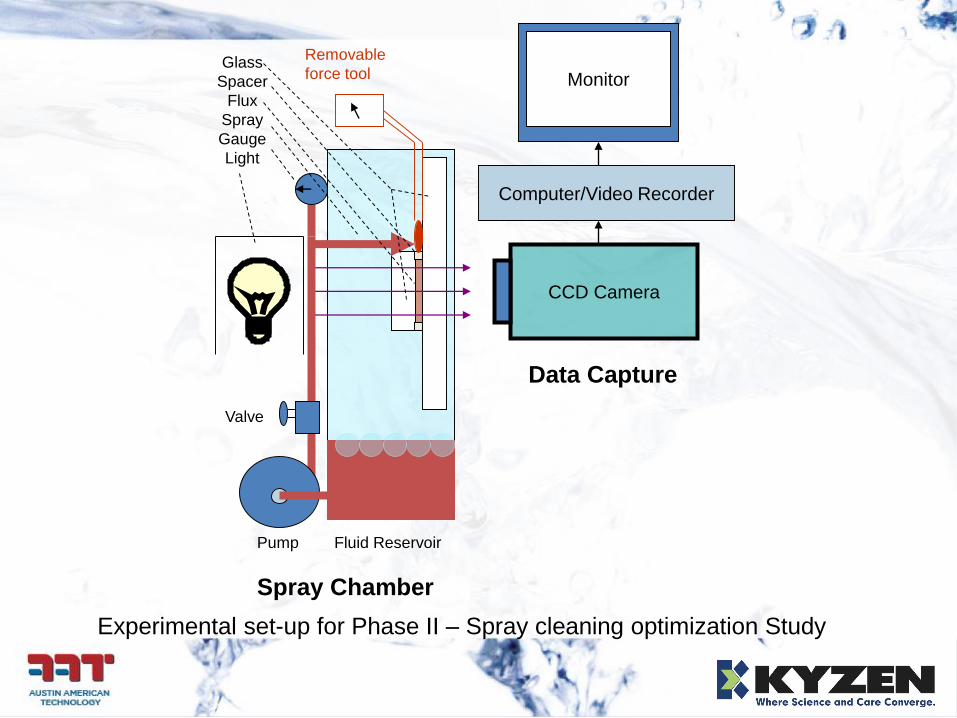
CCD Camera
Computer/Video Recorder
MonitorGlass
Spacer
Flux
Spray
Gauge
Light
Pump Fluid Reservoir
Valve
Spray Chamber
Removable
force tool
Data Capture
Experimental set-up for Phase II – Spray cleaning optimization Study
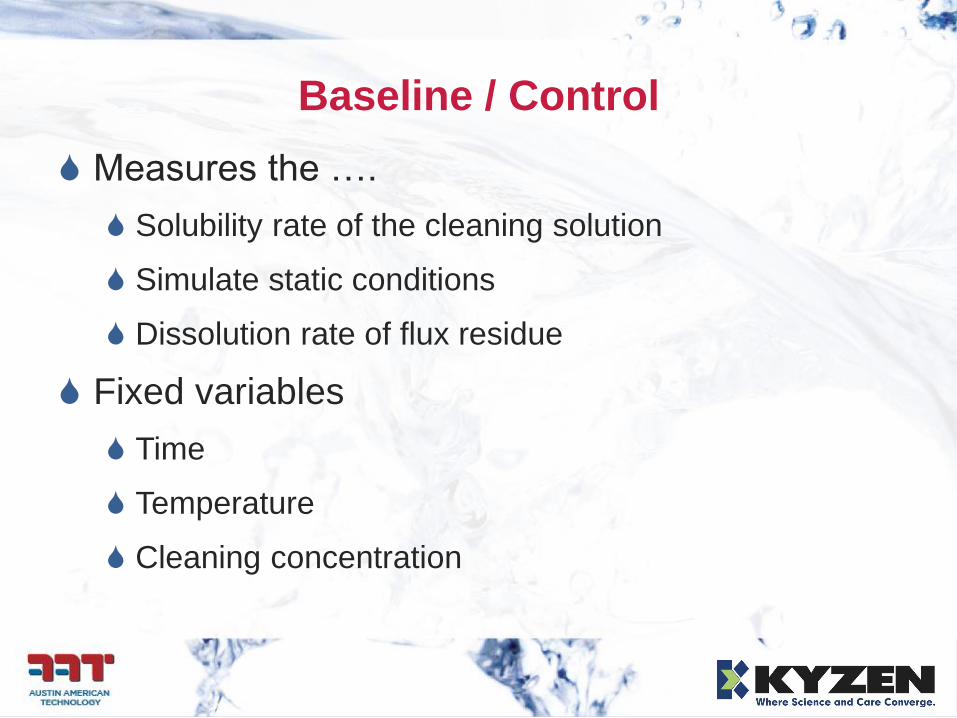
Baseline / Control
Measures the ….
Solubility rate of the cleaning solution
Simulate static conditions
Dissolution rate of flux residue
Fixed variables
Time
Temperature
Cleaning concentration
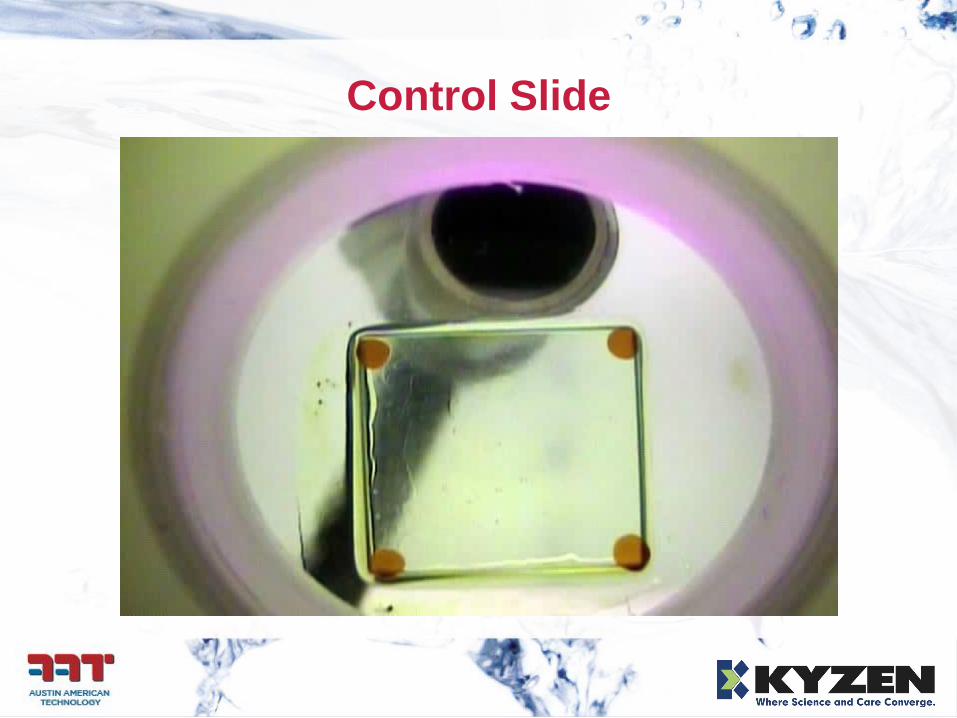
Control Slide
Testing the Research Question
What is the cleaning rate improvement by
applying physical energy?
Fixed
Time, 2 minutes
Nozzle, Coherent
Location of spray: Fixed, centered, adjacent
Component dimensions
Surface materials: glass
Eutectic Solder Paste
Variables
Solder Paste Flux: Indium SMQ 92J
Cleaning concentration: 10 & 15%
Reflow, Ramp to spike: 218ºC
Flux volume: Fill gap & excess around slide
Time between reflow & clean: 17, 1hr, 4 hr
Wash temperatures: 120 & 140ºF
Spray Impingement Pressure: 2, 4, 10 psi
Standoff Height: 3, 4, & 5 mil
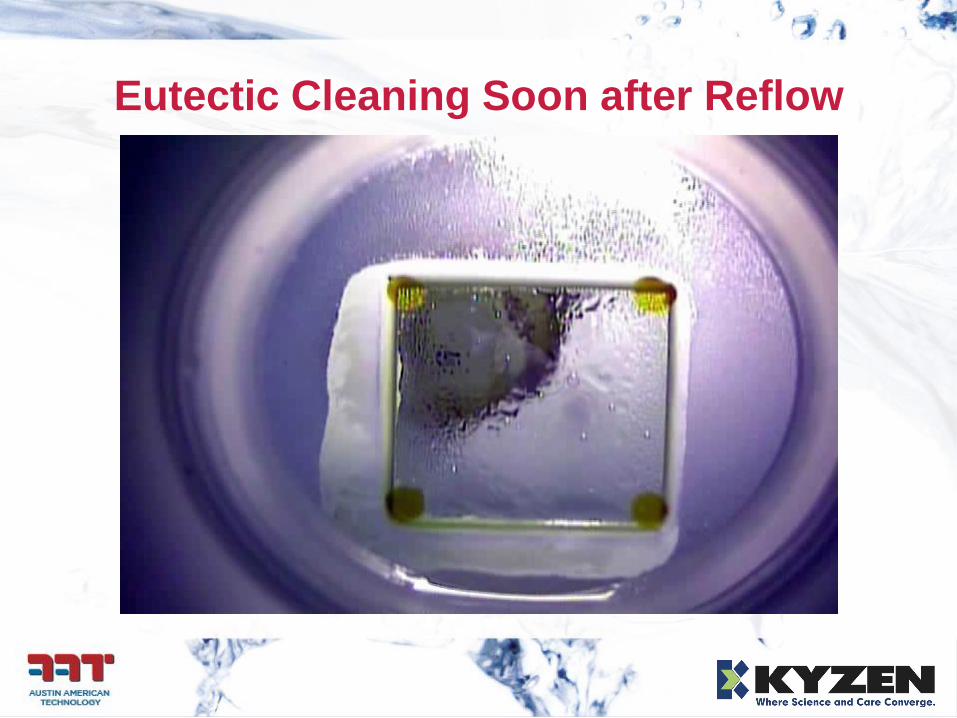
Eutectic Cleaning Soon after Reflow
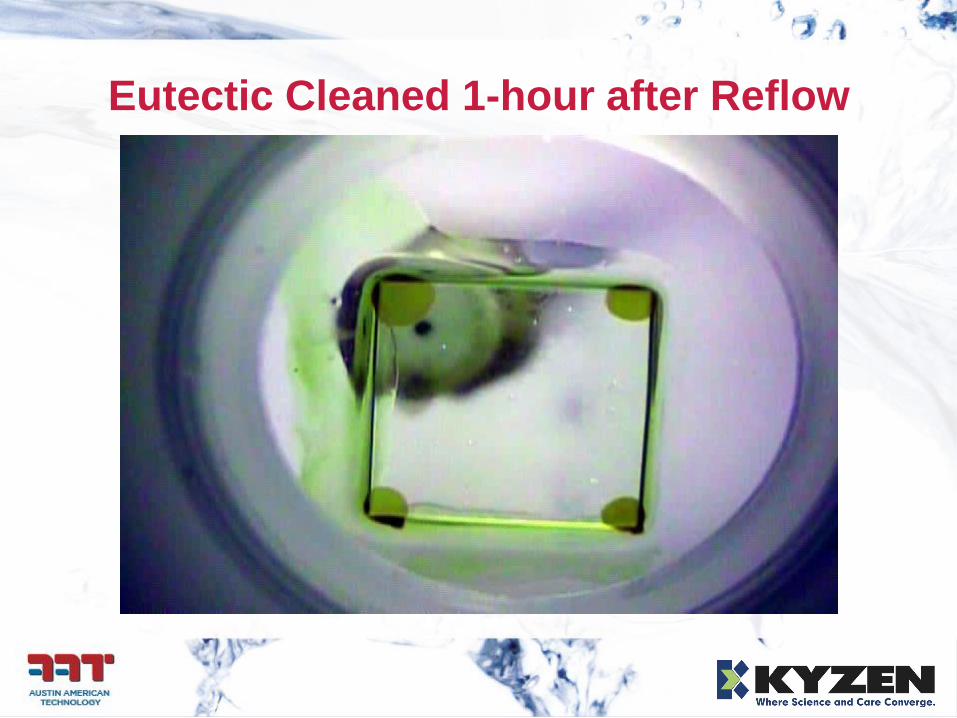
Eutectic Cleaned 1-hour after Reflow
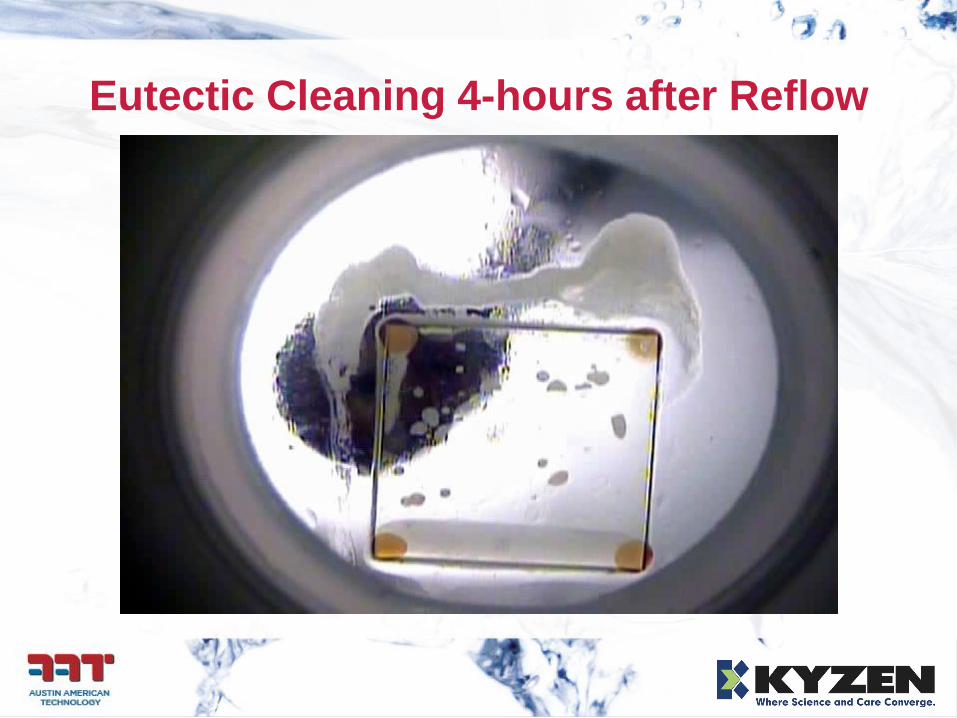
Eutectic Cleaning 4-hours after Reflow
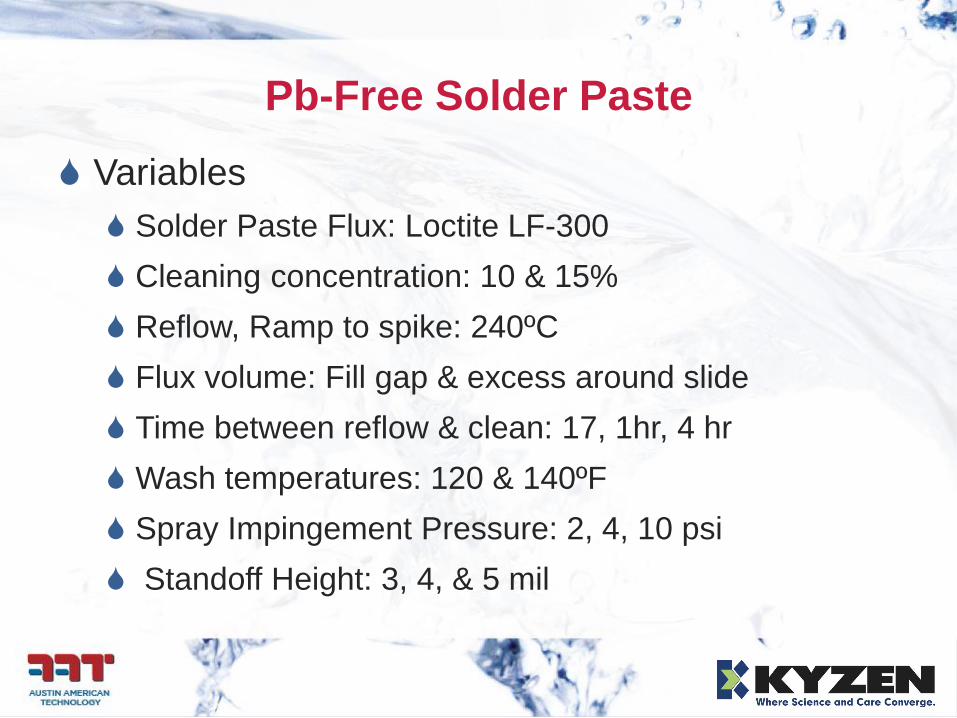
Pb-Free Solder Paste
Variables
Solder Paste Flux: Loctite LF-300
Cleaning concentration: 10 & 15%
Reflow, Ramp to spike: 240ºC
Flux volume: Fill gap & excess around slide
Time between reflow & clean: 17, 1hr, 4 hr
Wash temperatures: 120 & 140ºF
Spray Impingement Pressure: 2, 4, 10 psi
Standoff Height: 3, 4, & 5 mil
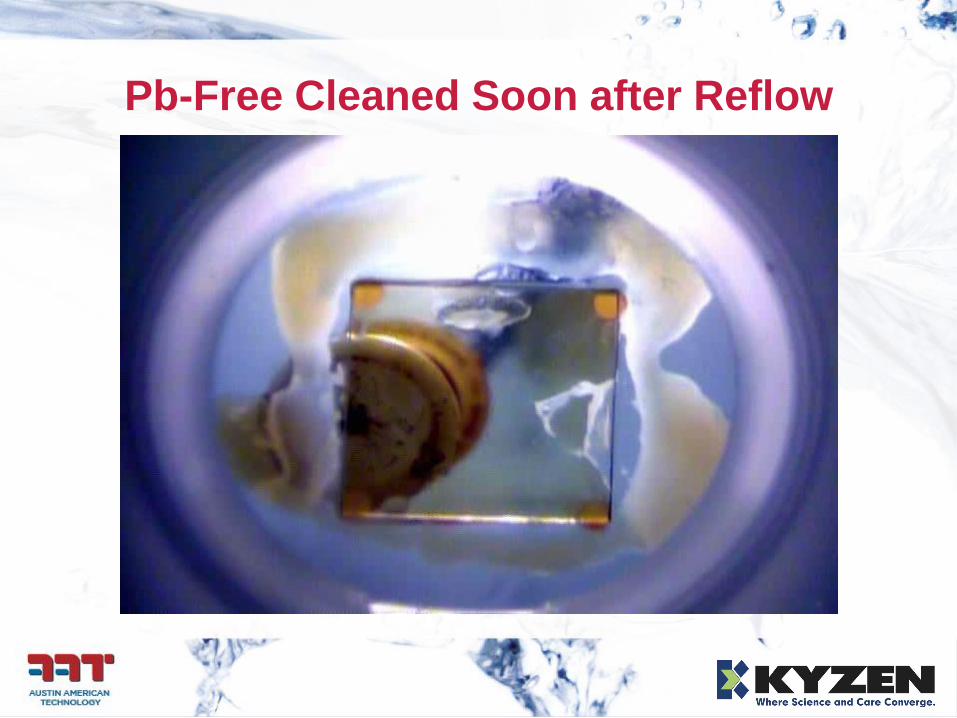
Pb-Free Cleaned Soon after Reflow
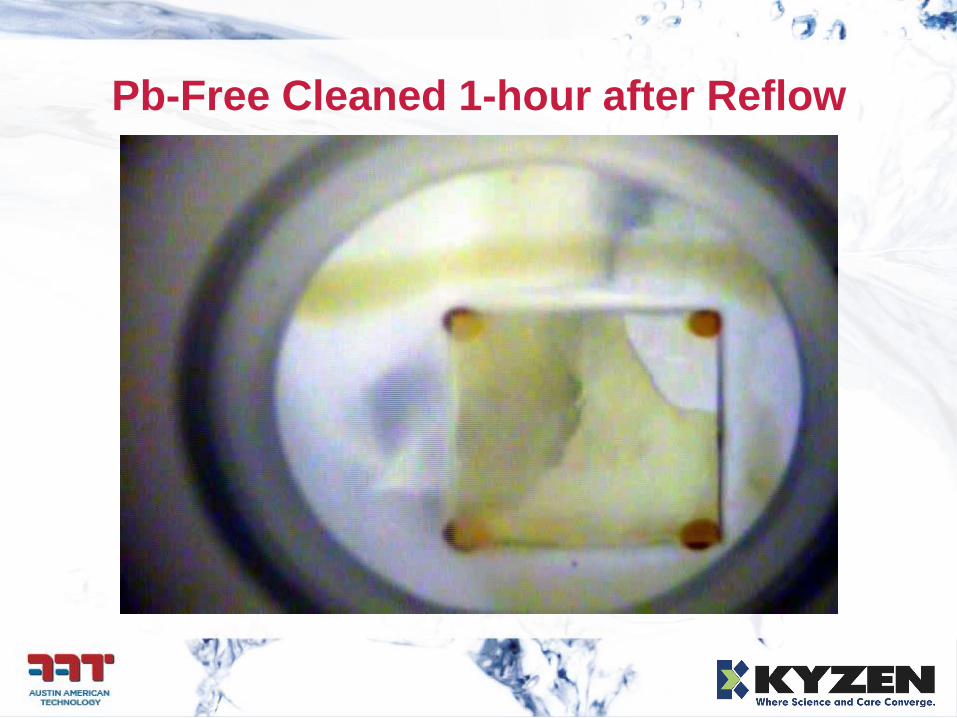
Pb-Free Cleaned 1-hour after Reflow
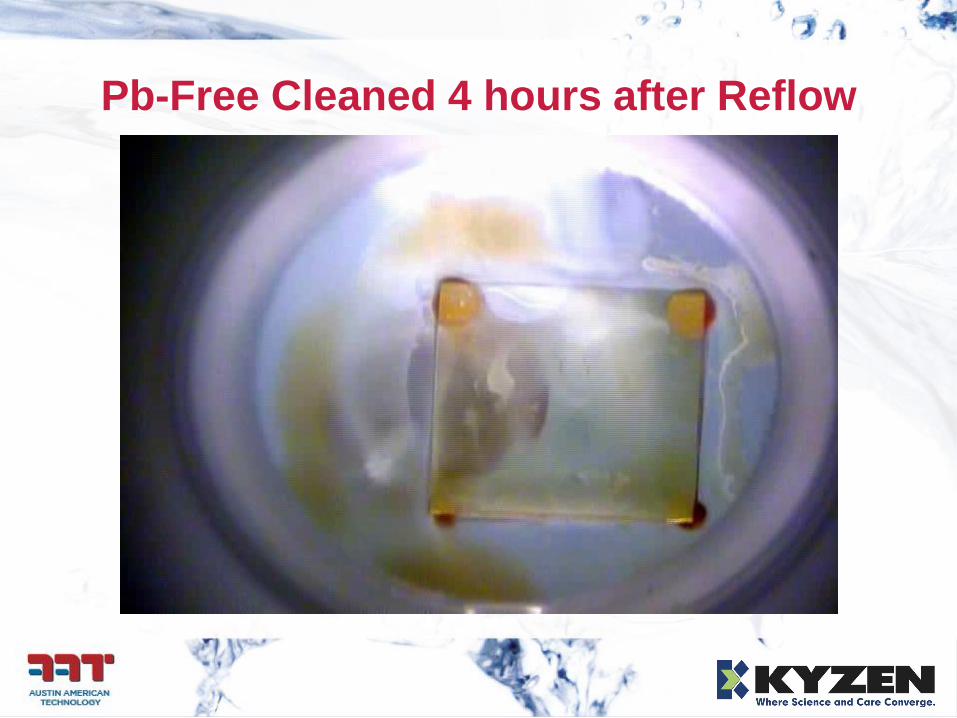
Pb-Free Cleaned 4 hours after Reflow
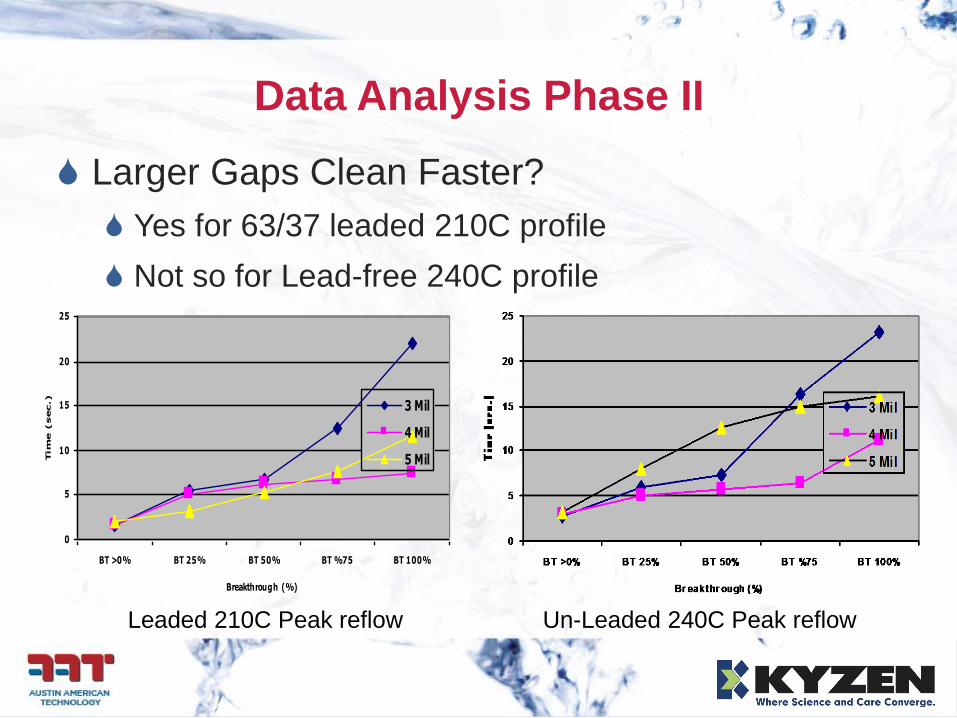
Data Analysis Phase II
Larger Gaps Clean Faster?
Yes for 63/37 leaded 210C profile
Not so for Lead-free 240C profile
Leaded 210C Peak reflow Un-Leaded 240C Peak reflow
0
5
10
15
20
25
BT >0% BT 25% BT 50% BT %75 BT 100%
Breakthrough (%)
Tim
e (sec.)
3 Mil
4 Mil
5 Mil
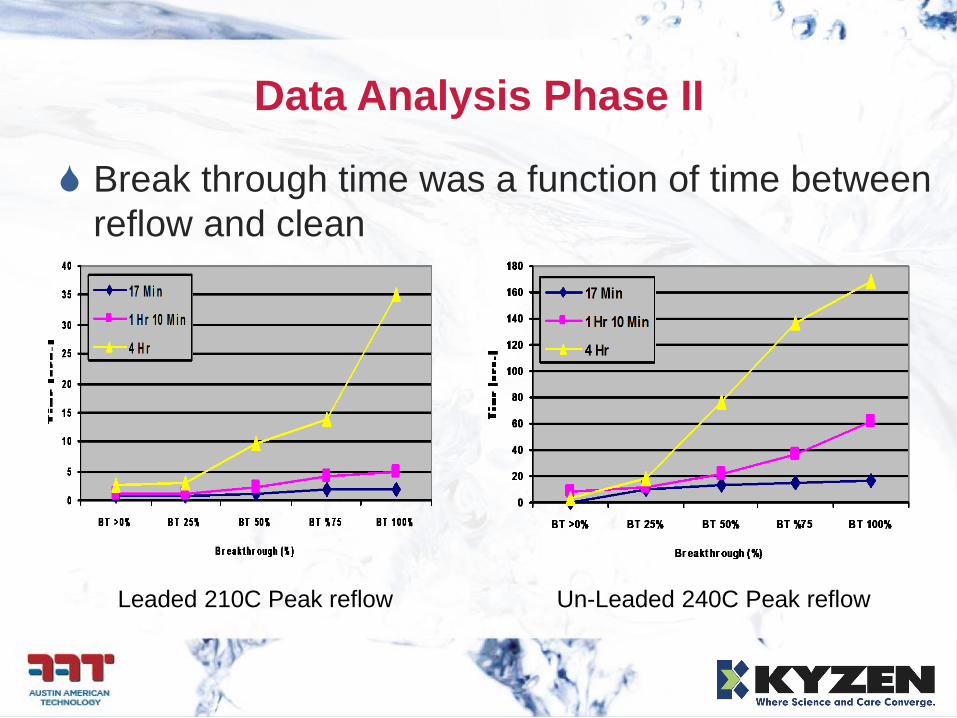
Data Analysis Phase II
Break through time was a function of time between
reflow and clean
Leaded 210C Peak reflow Un-Leaded 240C Peak reflow
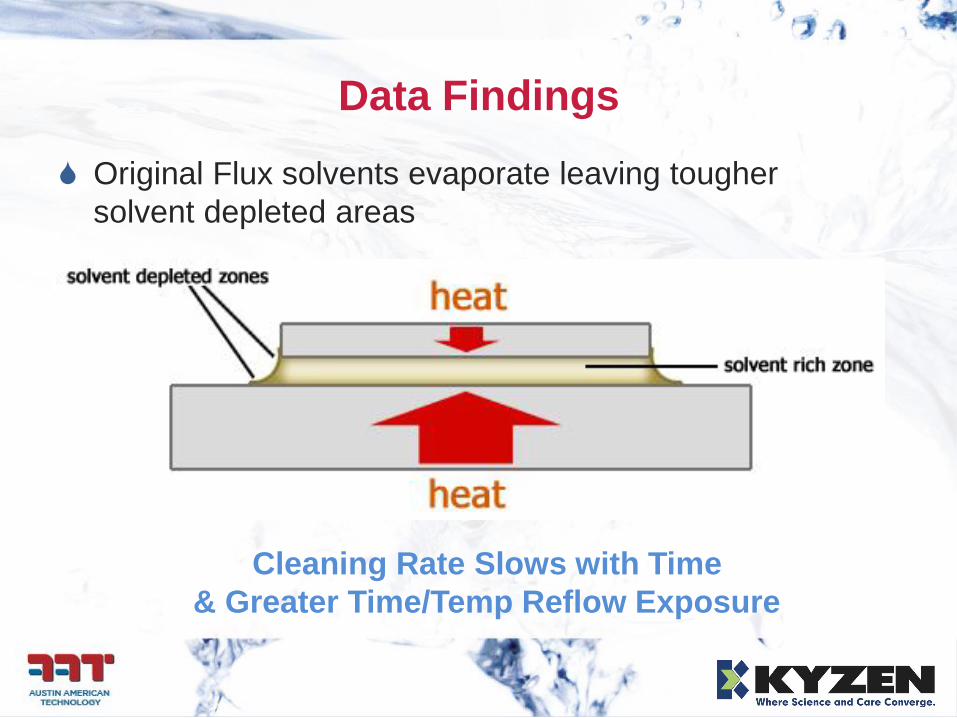
Data Findings
Cleaning Rate Slows with Time
& Greater Time/Temp Reflow Exposure
Original Flux solvents evaporate leaving tougher
solvent depleted areas
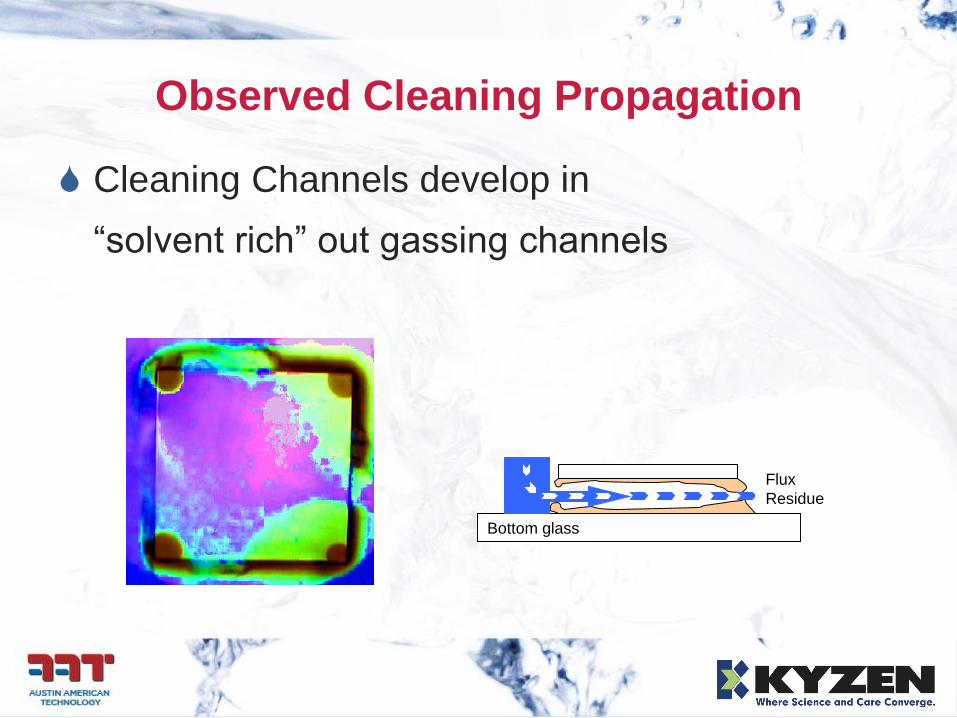
Observed Cleaning Propagation
Cleaning Channels develop in
“solvent rich” out gassing channels
Bottom glass
Jet
Flux
Residue
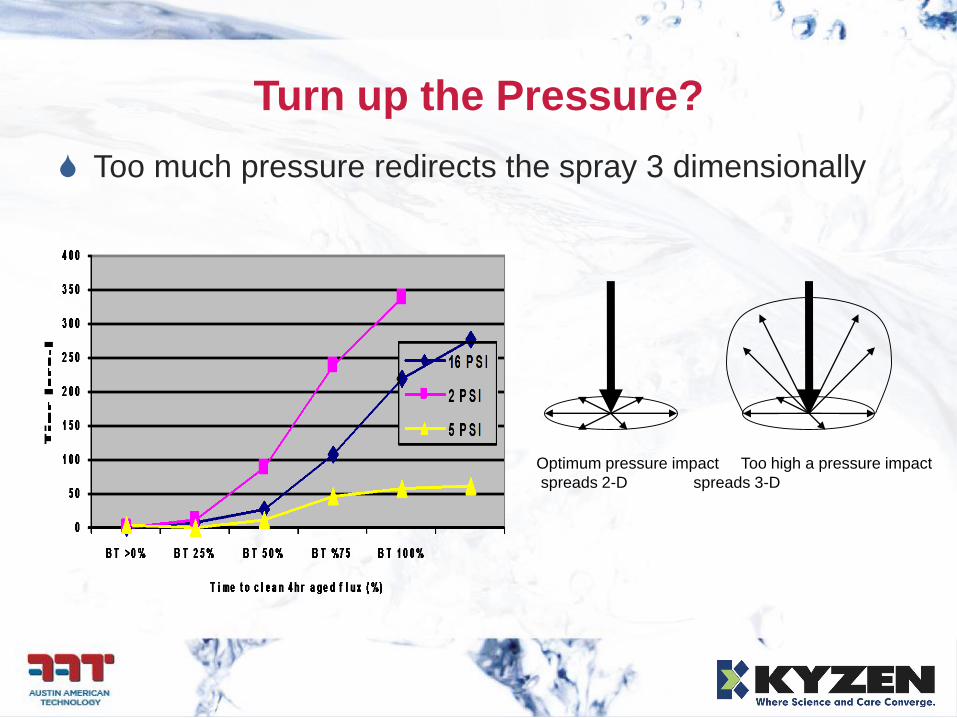
Turn up the Pressure?
Too much pressure redirects the spray 3 dimensionally
Optimum pressure impact Too high a pressure impact
spreads 2-D spreads 3-D
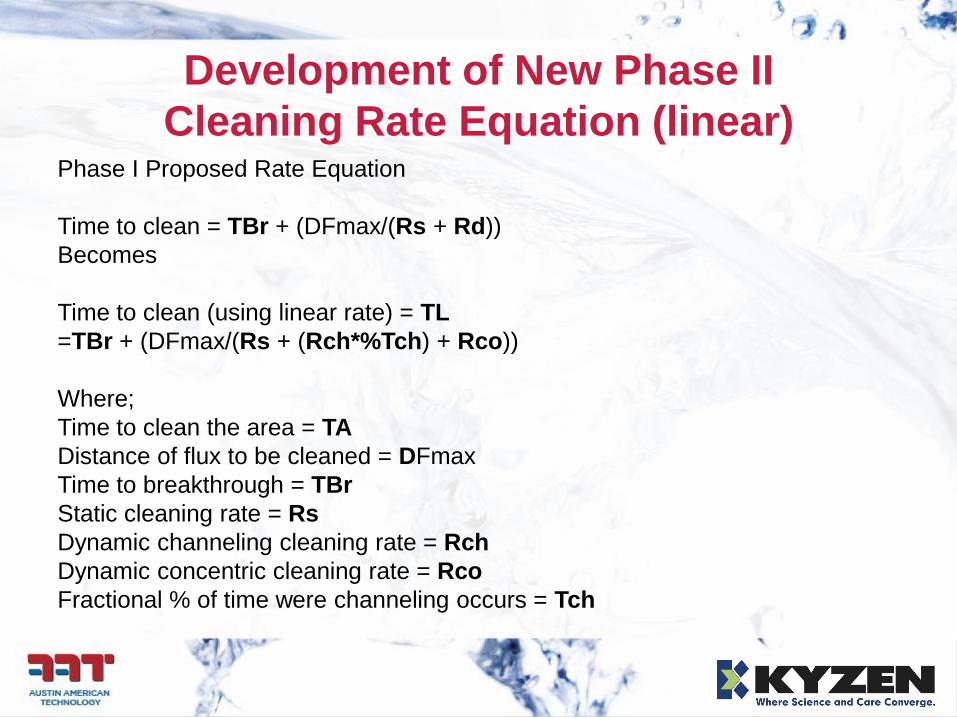
Development of New Phase II
Cleaning Rate Equation (linear)Phase I Proposed Rate Equation
Time to clean = TBr + (DFmax/(Rs + Rd))
Becomes
Time to clean (using linear rate) = TL
=TBr + (DFmax/(Rs + (Rch*%Tch) + Rco))
Where;
Time to clean the area = TA
Distance of flux to be cleaned = DFmax
Time to breakthrough = TBr
Static cleaning rate = Rs
Dynamic channeling cleaning rate = Rch
Dynamic concentric cleaning rate = Rco
Fractional % of time were channeling occurs = Tch
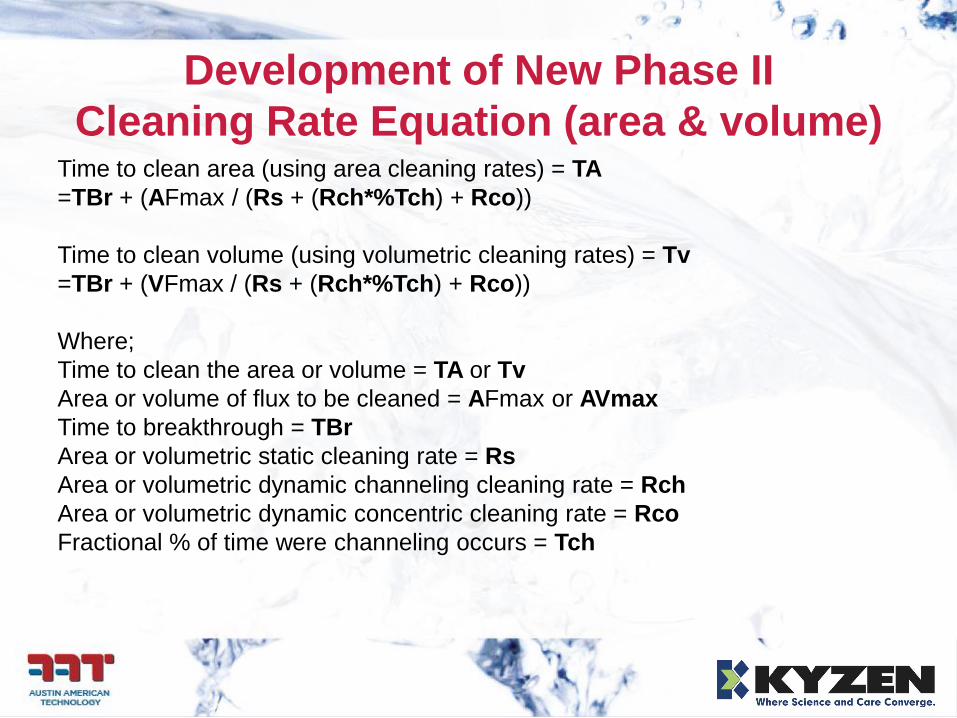
Development of New Phase II
Cleaning Rate Equation (area & volume)Time to clean area (using area cleaning rates) = TA
=TBr + (AFmax / (Rs + (Rch*%Tch) + Rco))
Time to clean volume (using volumetric cleaning rates) = Tv
=TBr + (VFmax / (Rs + (Rch*%Tch) + Rco))
Where;
Time to clean the area or volume = TA or Tv
Area or volume of flux to be cleaned = AFmax or AVmax
Time to breakthrough = TBr
Area or volumetric static cleaning rate = Rs
Area or volumetric dynamic channeling cleaning rate = Rch
Area or volumetric dynamic concentric cleaning rate = Rco
Fractional % of time were channeling occurs = Tch
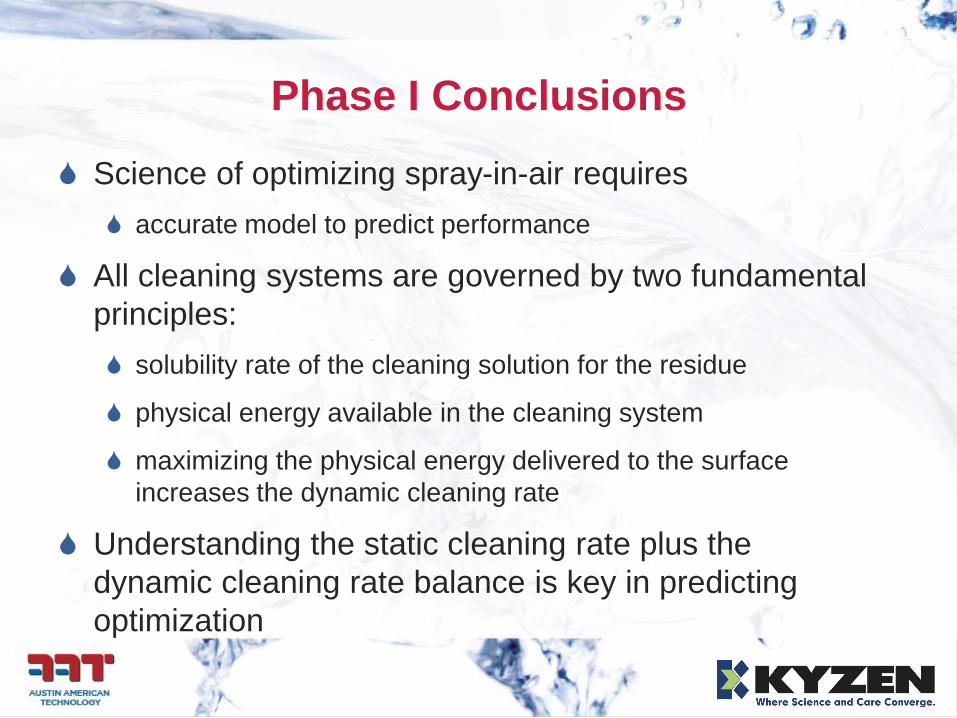
Phase I Conclusions
Science of optimizing spray-in-air requires
accurate model to predict performance
All cleaning systems are governed by two fundamental
principles:
solubility rate of the cleaning solution for the residue
physical energy available in the cleaning system
maximizing the physical energy delivered to the surface
increases the dynamic cleaning rate
Understanding the static cleaning rate plus the
dynamic cleaning rate balance is key in predicting
optimization
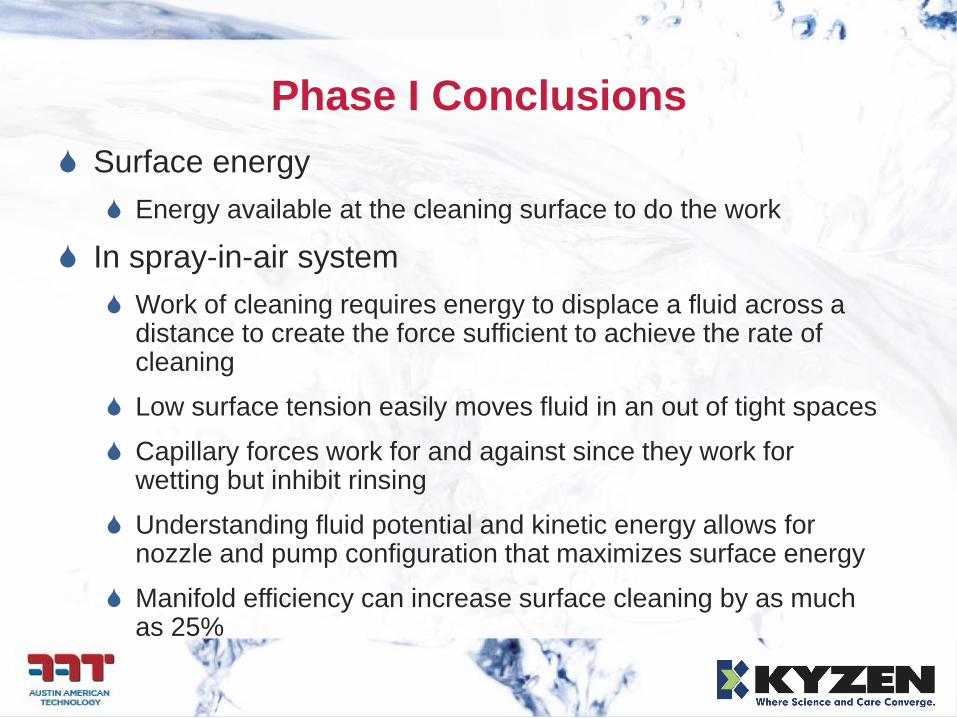
Phase I Conclusions
Surface energy
Energy available at the cleaning surface to do the work
In spray-in-air system
Work of cleaning requires energy to displace a fluid across a distance to create the force sufficient to achieve the rate of cleaning
Low surface tension easily moves fluid in an out of tight spaces
Capillary forces work for and against since they work for wetting but inhibit rinsing
Understanding fluid potential and kinetic energy allows for nozzle and pump configuration that maximizes surface energy
Manifold efficiency can increase surface cleaning by as much as 25%
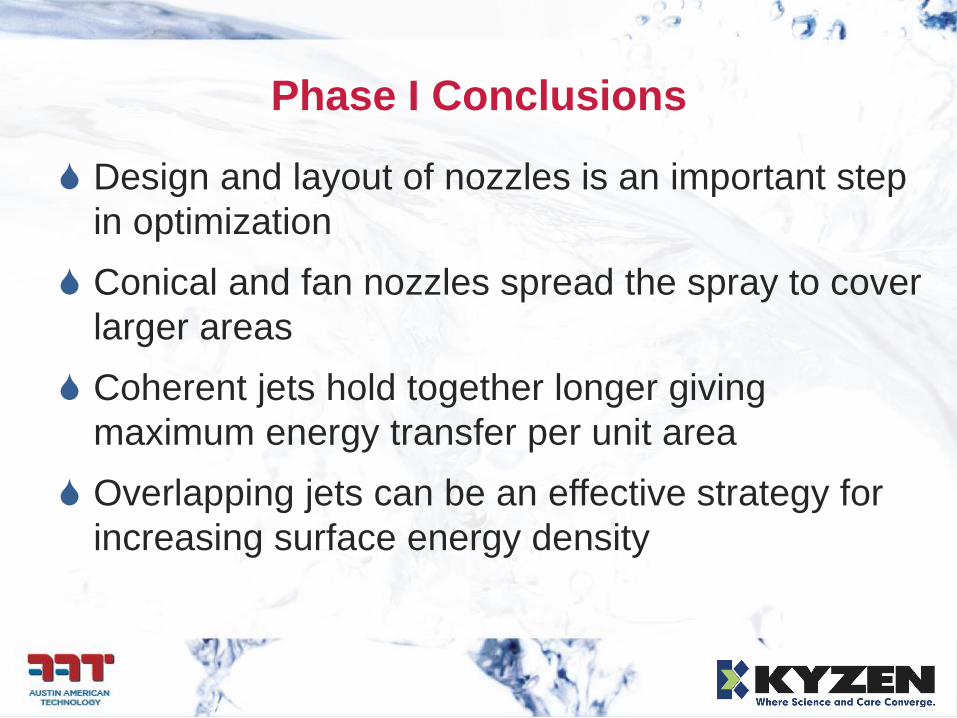
Phase I Conclusions
Design and layout of nozzles is an important step
in optimization
Conical and fan nozzles spread the spray to cover
larger areas
Coherent jets hold together longer giving
maximum energy transfer per unit area
Overlapping jets can be an effective strategy for
increasing surface energy density
Phase I Conclusions
Rate to chemical dissolution can be augmented
with various forms of physical assistance such
as heating, impingement, concentration and
time.
Contamination loading can slow the cleaning
process by shifting chemical equilibrium
Chemical dynamics steady state when make up
exceed soil load
Phase II Conclusions
The “CARL” tester provided excellent test bed to evaluate cleaning rates and mechanisms (30 captures per second)
There are two different dynamic cleaning mechanisms
Initial cleaning rates favored larger gaps
Rates beyond 0.5” under component varied depending on dynamic mechanism & redirection
Aging of the flux residue before clean significantly reduces the rate of cleaning for no-clean and lead-free
There is an optimal impingement pressure to clean a planar gap
The lead-free flux was harder to clean than the leaded no-clean
The phase I rate equation can be modified to include break-thru time, channeling and concentric cleaning mechanisms discovered in phase II testing
Follow on Research
Phase III will use the tools developed in Phase II to further
understand the “Lead-Free” cleaning process
New comparison of lead-free fluxes
(2)Water soluble & water +(2) chem. soluble
Evaluate affect of pre-soak on break-through time
Evaluate 1 & 2 mil gaps in “CARL”
New chemistries – Alkaline vs. Neutral pH vs. Water
Nozzle design evaluation
Characterize New Nozzle types in “CARL”
Wide angle fan, narrow angle fan, new coherent
Pressure vs. rate curves for different nozzle types
Special Thanks!
Matt Kincheloe, Robert Werkun - AAT
Ram Wissel - Kyzen Corporation
Indium Corp. & Multicore/Loctite for samples
Optimized Static and Dynamic Driving Forces for
Removing Flux Residue under Flush Mounted Chip Caps
SMTAI Technical Forum
Donald Stephens Convention Center
Rosemont, IL
September 24-28, 2006
Mike Bixenman, Kyzen Corporation
Steve Stach, Austin American Technology
Abstract
Removal of flux residue under highly dense chip caps
presents a difficult cleaning challenge. Chip caps are
flush mounted to the circuit card. Upon reflow, flux
residue fills the gap under the chip cap. Cleaning fluids
must wet, dissolve, penetrate the flux dam, and flow
under the component to adequately remove all flux
residues. Increased board density, miniaturization, and
Pb-free soldering magnify this problem. To address
this problem, process parameters in the form of
cleaning temperature, time, cleaning chemistry
concentration, and impingement energy must be
considered. This paper presents the results from a
designed experiment of an advanced cleaning fluid
combined with an optimized inline spray-cleaning
machine for removing flux residue under flush
mounted chip caps.
Introduction
An optimized cleaning process delivers the necessary
chemical and mechanical energy to clean the most
difficult and sensitive areas of the part being cleaned.
Understanding the balance between static chemical and
mechanical driving forces is fundamental to predicting
and optimizing process variables. The timing and
sequence of events in a cleaning process are critical.
Each section or step in the process requires careful
thought and understanding. As the gap from the board
surface to the bottom of the component decreases,
experience tells us that cleaning becomes more
difficult.
Cleaning under flush mounted chip caps, with narrow
spacing, represents a difficult cleaning challenge. Many
variables influence the process-cleaning rate. Research
data suggests four critical variables when cleaning
electronic circuit assemblies. Higher cleaning chemistry
concentration typically increases static cleaning (rate at
which the cleaning fluid dissolves flux residue without
agitation). Increased cleaning temperature typically
improves the dissolution rate. Increased time allows the
cleaning fluid to dissolve flux under tight standoffs until
break-through occurs, which allows the fluid to flow
under the part and dissolve remaining flux residue.
Mechanical impingement creates a driving force that
increases penetration rates and reduces the time needed
to clean under the component. A fifth variable must be
considered when cleaning under tight standoffs – surface
tension and capillary action. Lower surface tension
improves capillary action, which allows the cleaning
fluid to wet and penetrate at a faster rate. The purpose of
this designed experiment is to determine optimize
chemical and mechanical forces required to remove flux
residue under flush mounted chips caps.
Problem Statement
Chip caps, flush mounted to the board, create a flux dam
under the component during reflow. The flux dam seals
the underside of the component with a thick resinous
material that is difficult to completely remove. Devices
placed in tightly packed arrays further increase the
cleaning difficulty, as there is very limited access for the
cleaning fluid to reach the contaminant. This design
challenge requires both improved chemical and
mechanical technology. The chemical driving forces can
be improved by adding materials to increase the speed
of cleaning and by improving the wet-ability of the
material to penetrate under flush mounted devices.
The difficulty, some ingredients used to improve
cleaning speed can darken or etch solder joints or
affect part markings and labels. The mechanical
driving forces require optimization in nozzle design,
selection and positioning to address difficult cleaning
challenges on the board. Even with improved chemical
and mechanical forces, time is a critical factor. The
time the board is exposed to the cleaning material
(wash time), along with the time between re-flow and
cleaning (aging time) are very important variables.
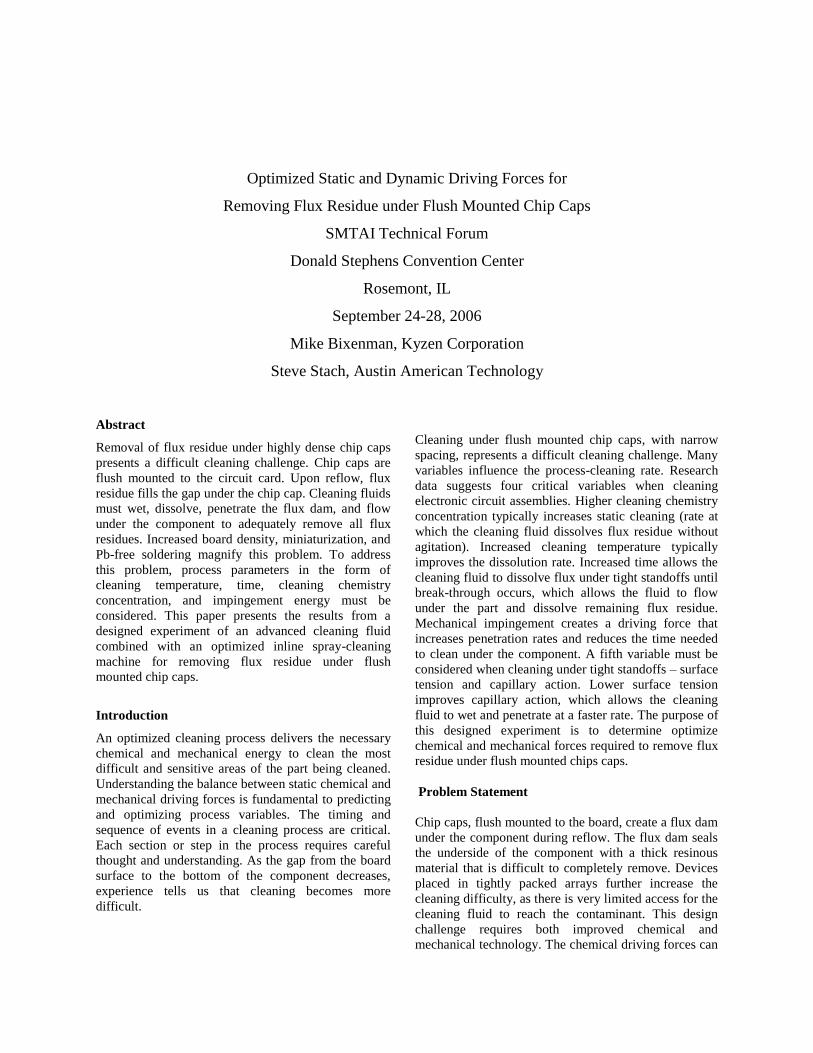
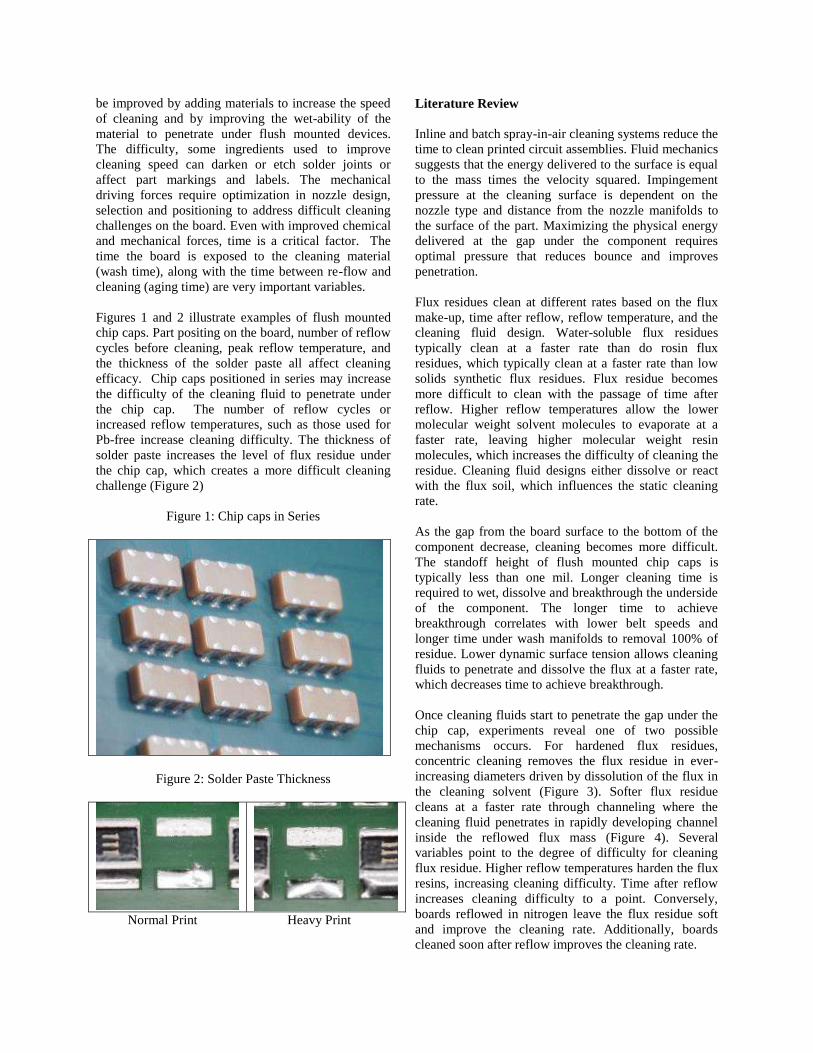
Figures 1 and 2 illustrate examples of flush mounted
chip caps. Part positing on the board, number of reflow
cycles before cleaning, peak reflow temperature, and
the thickness of the solder paste all affect cleaning
efficacy. Chip caps positioned in series may increase
the difficulty of the cleaning fluid to penetrate under
the chip cap. The number of reflow cycles or
increased reflow temperatures, such as those used for
Pb-free increase cleaning difficulty. The thickness of
solder paste increases the level of flux residue under
the chip cap, which creates a more difficult cleaning
challenge (Figure 2)
Figure 1: Chip caps in Series
Figure 2: Solder Paste Thickness
Normal Print Heavy Print
Literature Review
Inline and batch spray-in-air cleaning systems reduce the
time to clean printed circuit assemblies. Fluid mechanics
suggests that the energy delivered to the surface is equal
to the mass times the velocity squared. Impingement
pressure at the cleaning surface is dependent on the
nozzle type and distance from the nozzle manifolds to
the surface of the part. Maximizing the physical energy
delivered at the gap under the component requires
optimal pressure that reduces bounce and improves
penetration.
Flux residues clean at different rates based on the flux
make-up, time after reflow, reflow temperature, and the
cleaning fluid design. Water-soluble flux residues
typically clean at a faster rate than do rosin flux
residues, which typically clean at a faster rate than low
solids synthetic flux residues. Flux residue becomes
more difficult to clean with the passage of time after
reflow. Higher reflow temperatures allow the lower
molecular weight solvent molecules to evaporate at a
faster rate, leaving higher molecular weight resin
molecules, which increases the difficulty of cleaning the
residue. Cleaning fluid designs either dissolve or react
with the flux soil, which influences the static cleaning
rate.
As the gap from the board surface to the bottom of the
component decrease, cleaning becomes more difficult.
The standoff height of flush mounted chip caps is
typically less than one mil. Longer cleaning time is
required to wet, dissolve and breakthrough the underside
of the component. The longer time to achieve
breakthrough correlates with lower belt speeds and
longer time under wash manifolds to removal 100% of
residue. Lower dynamic surface tension allows cleaning
fluids to penetrate and dissolve the flux at a faster rate,
which decreases time to achieve breakthrough.
Once cleaning fluids start to penetrate the gap under the
chip cap, experiments reveal one of two possible
mechanisms occurs. For hardened flux residues,
concentric cleaning removes the flux residue in ever-
increasing diameters driven by dissolution of the flux in
the cleaning solvent (Figure 3). Softer flux residue
cleans at a faster rate through channeling where the
cleaning fluid penetrates in rapidly developing channel
inside the reflowed flux mass (Figure 4). Several
variables point to the degree of difficulty for cleaning
flux residue. Higher reflow temperatures harden the flux
resins, increasing cleaning difficulty. Time after reflow
increases cleaning difficulty to a point. Conversely,
boards reflowed in nitrogen leave the flux residue soft
and improve the cleaning rate. Additionally, boards
cleaned soon after reflow improves the cleaning rate.
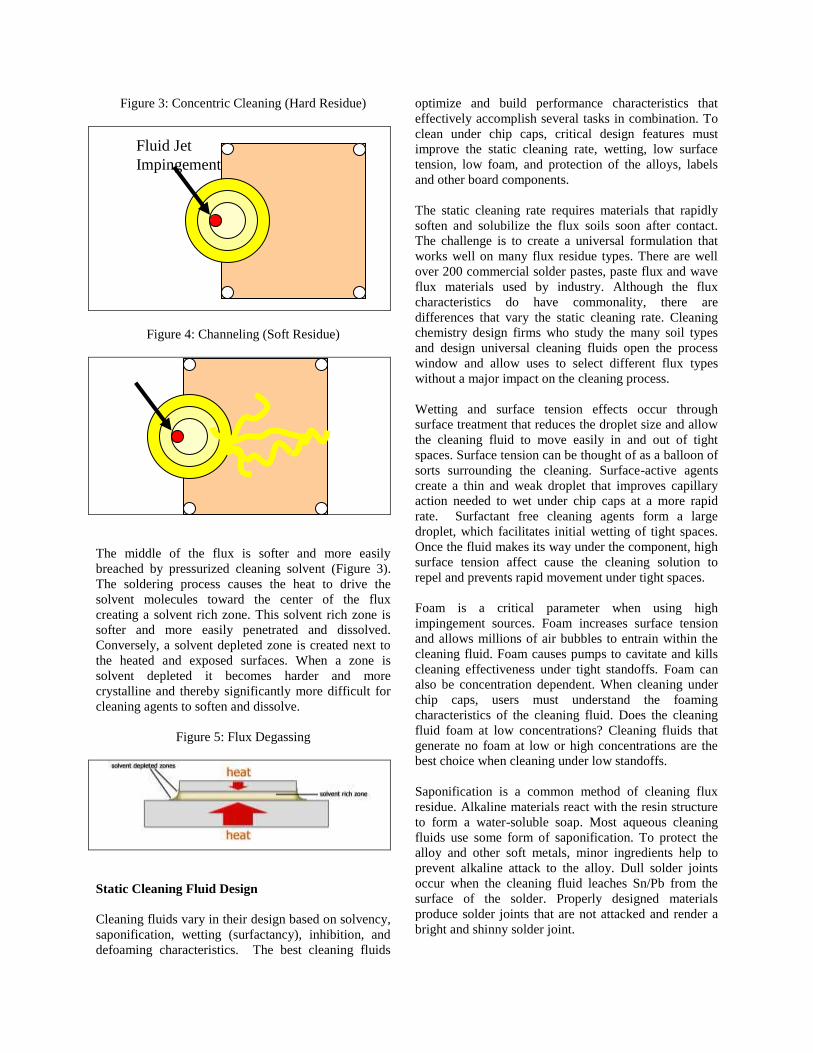
Figure 3: Concentric Cleaning (Hard Residue)
Figure 4: Channeling (Soft Residue)
The middle of the flux is softer and more easily
breached by pressurized cleaning solvent (Figure 3).
The soldering process causes the heat to drive the
solvent molecules toward the center of the flux
creating a solvent rich zone. This solvent rich zone is
softer and more easily penetrated and dissolved.
Conversely, a solvent depleted zone is created next to
the heated and exposed surfaces. When a zone is
solvent depleted it becomes harder and more
crystalline and thereby significantly more difficult for
cleaning agents to soften and dissolve.
Figure 5: Flux Degassing
Static Cleaning Fluid Design
Cleaning fluids vary in their design based on solvency,
saponification, wetting (surfactancy), inhibition, and
defoaming characteristics. The best cleaning fluids
optimize and build performance characteristics that
effectively accomplish several tasks in combination. To
clean under chip caps, critical design features must
improve the static cleaning rate, wetting, low surface
tension, low foam, and protection of the alloys, labels
and other board components.
The static cleaning rate requires materials that rapidly
soften and solubilize the flux soils soon after contact.
The challenge is to create a universal formulation that
works well on many flux residue types. There are well
over 200 commercial solder pastes, paste flux and wave
flux materials used by industry. Although the flux
characteristics do have commonality, there are
differences that vary the static cleaning rate. Cleaning
chemistry design firms who study the many soil types
and design universal cleaning fluids open the process
window and allow uses to select different flux types
without a major impact on the cleaning process.
Wetting and surface tension effects occur through
surface treatment that reduces the droplet size and allow
the cleaning fluid to move easily in and out of tight
spaces. Surface tension can be thought of as a balloon of
sorts surrounding the cleaning. Surface-active agents
create a thin and weak droplet that improves capillary
action needed to wet under chip caps at a more rapid
rate. Surfactant free cleaning agents form a large
droplet, which facilitates initial wetting of tight spaces.
Once the fluid makes its way under the component, high
surface tension affect cause the cleaning solution to
repel and prevents rapid movement under tight spaces.
Foam is a critical parameter when using high
impingement sources. Foam increases surface tension
and allows millions of air bubbles to entrain within the
cleaning fluid. Foam causes pumps to cavitate and kills
cleaning effectiveness under tight standoffs. Foam can
also be concentration dependent. When cleaning under
chip caps, users must understand the foaming
characteristics of the cleaning fluid. Does the cleaning
fluid foam at low concentrations? Cleaning fluids that
generate no foam at low or high concentrations are the
best choice when cleaning under low standoffs.
Saponification is a common method of cleaning flux
residue. Alkaline materials react with the resin structure
to form a water-soluble soap. Most aqueous cleaning
fluids use some form of saponification. To protect the
alloy and other soft metals, minor ingredients help to
prevent alkaline attack to the alloy. Dull solder joints
occur when the cleaning fluid leaches Sn/Pb from the
surface of the solder. Properly designed materials
produce solder joints that are not attacked and render a
bright and shinny solder joint.
Fluid Jet
Impingement
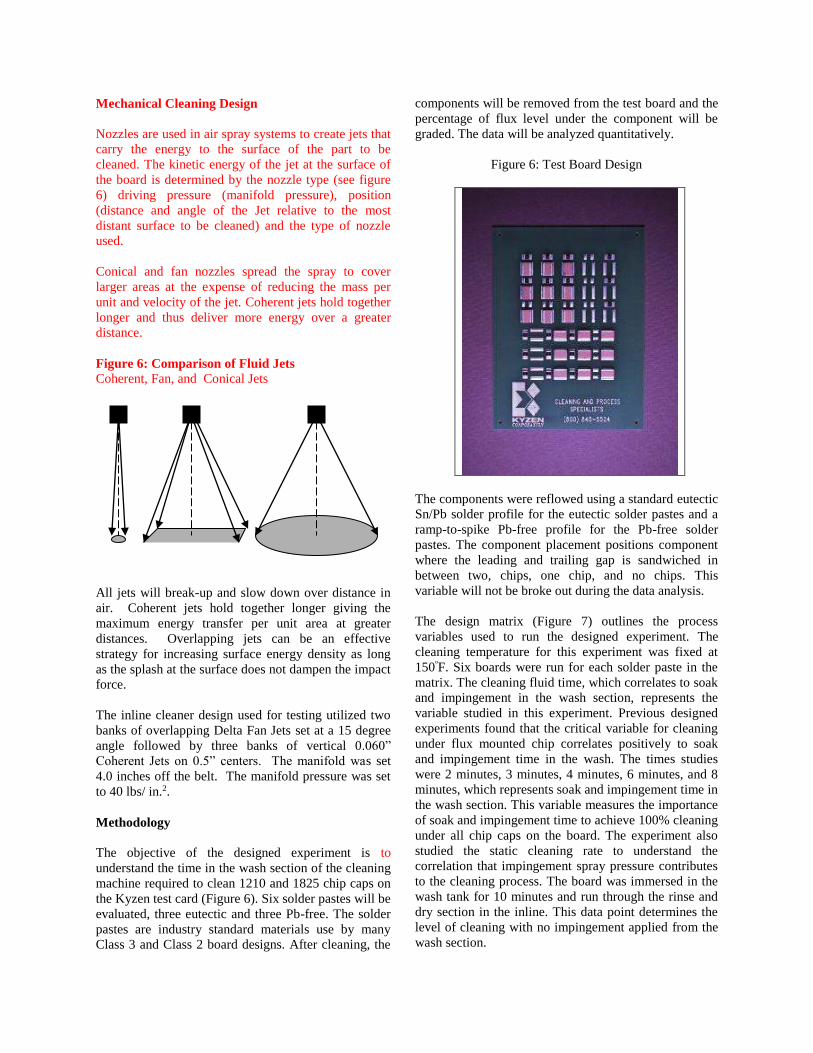
Mechanical Cleaning Design
Nozzles are used in air spray systems to create jets that
carry the energy to the surface of the part to be
cleaned. The kinetic energy of the jet at the surface of
the board is determined by the nozzle type (see figure
6) driving pressure (manifold pressure), position
(distance and angle of the Jet relative to the most
distant surface to be cleaned) and the type of nozzle
used.
Conical and fan nozzles spread the spray to cover
larger areas at the expense of reducing the mass per
unit and velocity of the jet. Coherent jets hold together
longer and thus deliver more energy over a greater
distance.
Figure 6: Comparison of Fluid Jets
Coherent, Fan, and Conical Jets
All jets will break-up and slow down over distance in
air. Coherent jets hold together longer giving the
maximum energy transfer per unit area at greater
distances. Overlapping jets can be an effective
strategy for increasing surface energy density as long
as the splash at the surface does not dampen the impact
force.
The inline cleaner design used for testing utilized two
banks of overlapping Delta Fan Jets set at a 15 degree
angle followed by three banks of vertical 0.060”
Coherent Jets on 0.5” centers. The manifold was set
4.0 inches off the belt. The manifold pressure was set
to 40 lbs/ in.2.
Methodology
The objective of the designed experiment is to
understand the time in the wash section of the cleaning
machine required to clean 1210 and 1825 chip caps on
the Kyzen test card (Figure 6). Six solder pastes will be
evaluated, three eutectic and three Pb-free. The solder
pastes are industry standard materials use by many
Class 3 and Class 2 board designs. After cleaning, the
components will be removed from the test board and the
percentage of flux level under the component will be
graded. The data will be analyzed quantitatively.
Figure 6: Test Board Design
The components were reflowed using a standard eutectic
Sn/Pb solder profile for the eutectic solder pastes and a
ramp-to-spike Pb-free profile for the Pb-free solder
pastes. The component placement positions component
where the leading and trailing gap is sandwiched in
between two, chips, one chip, and no chips. This
variable will not be broke out during the data analysis.
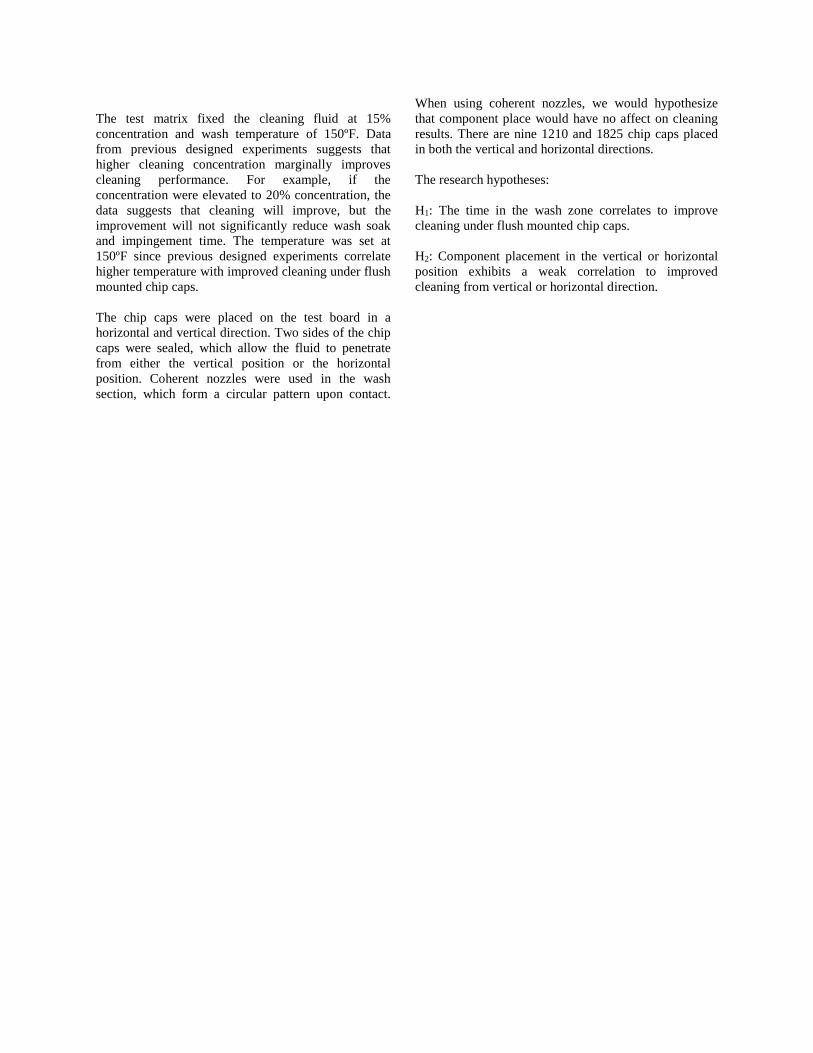
The design matrix (Figure 7) outlines the process
variables used to run the designed experiment. The
cleaning temperature for this experiment was fixed at
150ºF. Six boards were run for each solder paste in the
matrix. The cleaning fluid time, which correlates to soak
and impingement in the wash section, represents the
variable studied in this experiment. Previous designed
experiments found that the critical variable for cleaning
under flux mounted chip correlates positively to soak
and impingement time in the wash. The times studies
were 2 minutes, 3 minutes, 4 minutes, 6 minutes, and 8
minutes, which represents soak and impingement time in
the wash section. This variable measures the importance
of soak and impingement time to achieve 100% cleaning
under all chip caps on the board. The experiment also
studied the static cleaning rate to understand the
correlation that impingement spray pressure contributes
to the cleaning process. The board was immersed in the
wash tank for 10 minutes and run through the rinse and
dry section in the inline. This data point determines the
level of cleaning with no impingement applied from the
wash section.
The test matrix fixed the cleaning fluid at 15%
concentration and wash temperature of 150ºF. Data
from previous designed experiments suggests that
higher cleaning concentration marginally improves
cleaning performance. For example, if the
concentration were elevated to 20% concentration, the
data suggests that cleaning will improve, but the
improvement will not significantly reduce wash soak
and impingement time. The temperature was set at
150ºF since previous designed experiments correlate
higher temperature with improved cleaning under flush
mounted chip caps.
The chip caps were placed on the test board in a
horizontal and vertical direction. Two sides of the chip
caps were sealed, which allow the fluid to penetrate
from either the vertical position or the horizontal
position. Coherent nozzles were used in the wash
section, which form a circular pattern upon contact.
When using coherent nozzles, we would hypothesize
that component place would have no affect on cleaning
results. There are nine 1210 and 1825 chip caps placed
in both the vertical and horizontal directions.
The research hypotheses:
H1: The time in the wash zone correlates to improve
cleaning under flush mounted chip caps.
H2: Component placement in the vertical or horizontal
position exhibits a weak correlation to improved
cleaning from vertical or horizontal direction.
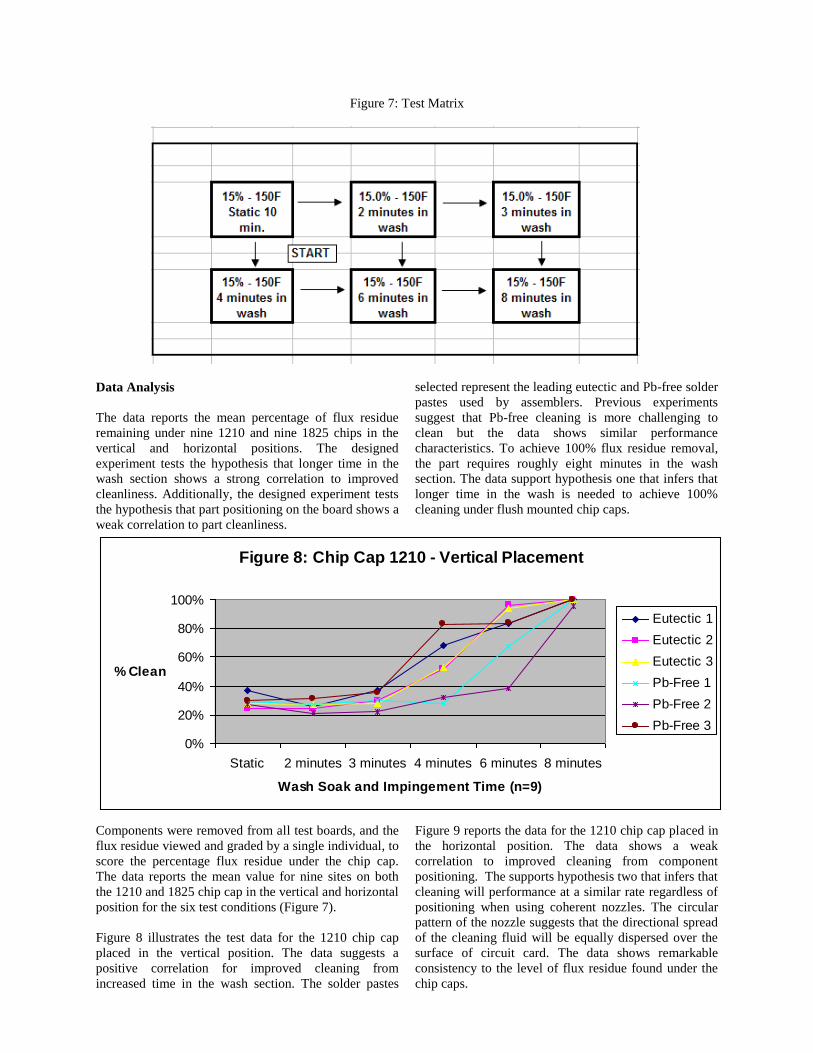
Figure 8: Chip Cap 1210 - Vertical Placement
0%
20%
40%
60%
80%
100%
Static 2 minutes 3 minutes 4 minutes 6 minutes 8 minutes
Wash Soak and Impingement Time (n=9)
% Clean
Eutectic 1
Eutectic 2
Eutectic 3
Pb-Free 1
Pb-Free 2
Pb-Free 3
Figure 7: Test Matrix
Data Analysis
The data reports the mean percentage of flux residue
remaining under nine 1210 and nine 1825 chips in the
vertical and horizontal positions. The designed
experiment tests the hypothesis that longer time in the
wash section shows a strong correlation to improved
cleanliness. Additionally, the designed experiment tests
the hypothesis that part positioning on the board shows a
weak correlation to part cleanliness.
Components were removed from all test boards, and the
flux residue viewed and graded by a single individual, to
score the percentage flux residue under the chip cap.
The data reports the mean value for nine sites on both
the 1210 and 1825 chip cap in the vertical and horizontal
position for the six test conditions (Figure 7).
Figure 8 illustrates the test data for the 1210 chip cap
placed in the vertical position. The data suggests a
positive correlation for improved cleaning from
increased time in the wash section. The solder pastes
selected represent the leading eutectic and Pb-free solder
pastes used by assemblers. Previous experiments
suggest that Pb-free cleaning is more challenging to
clean but the data shows similar performance
characteristics. To achieve 100% flux residue removal,
the part requires roughly eight minutes in the wash
section. The data support hypothesis one that infers that
longer time in the wash is needed to achieve 100%
cleaning under flush mounted chip caps.
Figure 9 reports the data for the 1210 chip cap placed in
the horizontal position. The data shows a weak
correlation to improved cleaning from component
positioning. The supports hypothesis two that infers that
cleaning will performance at a similar rate regardless of
positioning when using coherent nozzles. The circular
pattern of the nozzle suggests that the directional spread
of the cleaning fluid will be equally dispersed over the
surface of circuit card. The data shows remarkable
consistency to the level of flux residue found under the
chip caps.
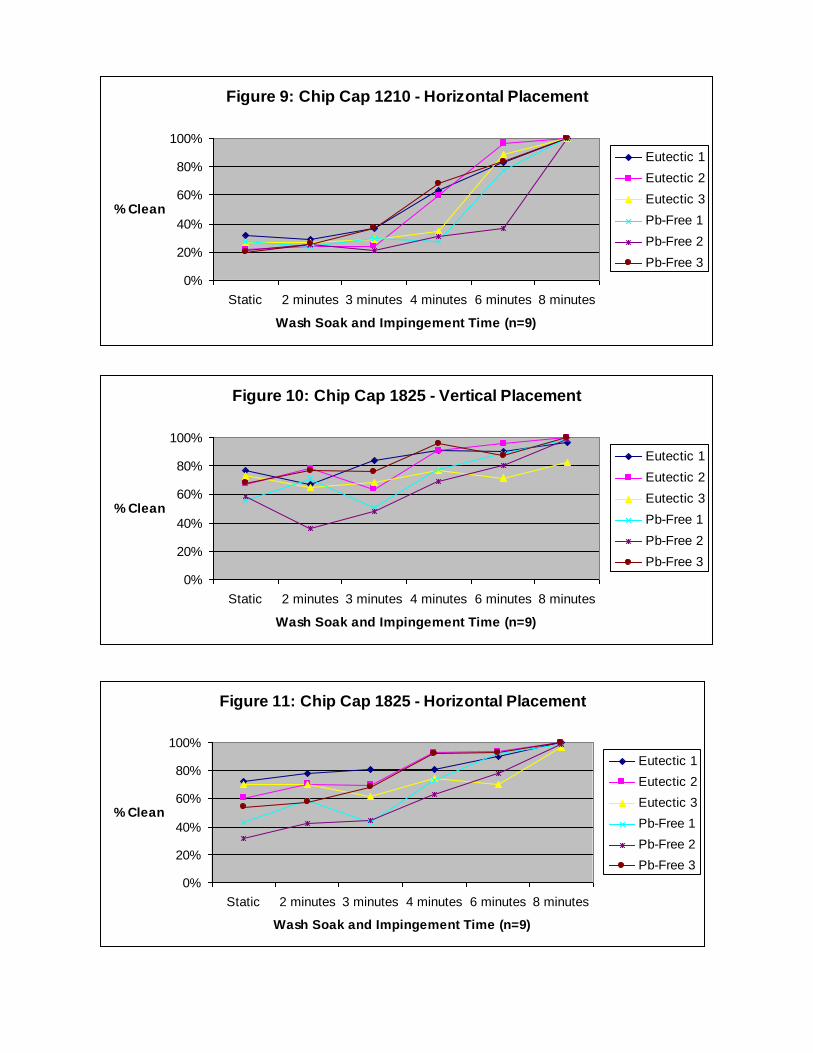
Figure 9: Chip Cap 1210 - Horizontal Placement
0%
20%
40%
60%
80%
100%
Static 2 minutes 3 minutes 4 minutes 6 minutes 8 minutes
Wash Soak and Impingement Time (n=9)
% Clean
Eutectic 1
Eutectic 2
Eutectic 3
Pb-Free 1
Pb-Free 2
Pb-Free 3
Figure 10: Chip Cap 1825 - Vertical Placement
0%
20%
40%
60%
80%
100%
Static 2 minutes 3 minutes 4 minutes 6 minutes 8 minutes
Wash Soak and Impingement Time (n=9)
% Clean
Eutectic 1
Eutectic 2
Eutectic 3
Pb-Free 1
Pb-Free 2
Pb-Free 3
Figure 11: Chip Cap 1825 - Horizontal Placement
0%
20%
40%
60%
80%
100%
Static 2 minutes 3 minutes 4 minutes 6 minutes 8 minutes
Wash Soak and Impingement Time (n=9)
% Clean
Eutectic 1
Eutectic 2
Eutectic 3
Pb-Free 1
Pb-Free 2
Pb-Free 3
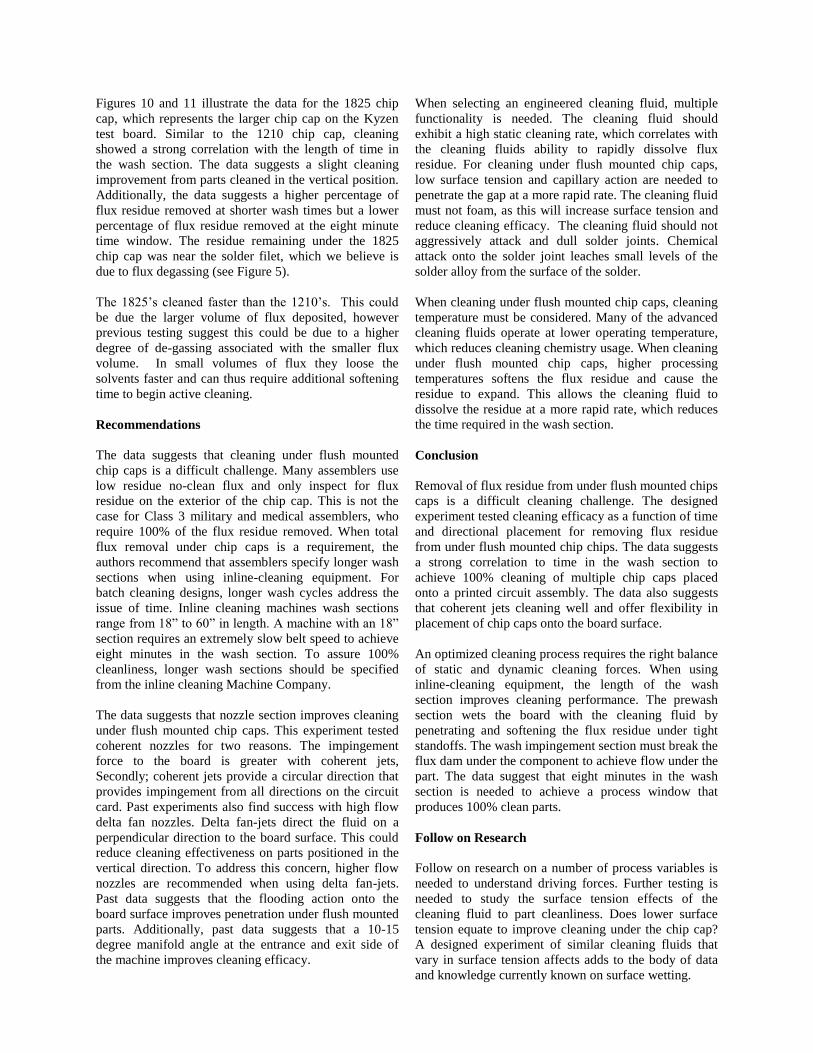
Figures 10 and 11 illustrate the data for the 1825 chip
cap, which represents the larger chip cap on the Kyzen
test board. Similar to the 1210 chip cap, cleaning
showed a strong correlation with the length of time in
the wash section. The data suggests a slight cleaning
improvement from parts cleaned in the vertical position.
Additionally, the data suggests a higher percentage of
flux residue removed at shorter wash times but a lower
percentage of flux residue removed at the eight minute
time window. The residue remaining under the 1825
chip cap was near the solder filet, which we believe is
due to flux degassing (see Figure 5).
The 1825’s cleaned faster than the 1210’s. This could
be due the larger volume of flux deposited, however
previous testing suggest this could be due to a higher
degree of de-gassing associated with the smaller flux
volume. In small volumes of flux they loose the
solvents faster and can thus require additional softening
time to begin active cleaning.
Recommendations
The data suggests that cleaning under flush mounted
chip caps is a difficult challenge. Many assemblers use
low residue no-clean flux and only inspect for flux
residue on the exterior of the chip cap. This is not the
case for Class 3 military and medical assemblers, who
require 100% of the flux residue removed. When total
flux removal under chip caps is a requirement, the
authors recommend that assemblers specify longer wash
sections when using inline-cleaning equipment. For
batch cleaning designs, longer wash cycles address the
issue of time. Inline cleaning machines wash sections
range from 18” to 60” in length. A machine with an 18”
section requires an extremely slow belt speed to achieve
eight minutes in the wash section. To assure 100%
cleanliness, longer wash sections should be specified
from the inline cleaning Machine Company.
The data suggests that nozzle section improves cleaning
under flush mounted chip caps. This experiment tested
coherent nozzles for two reasons. The impingement
force to the board is greater with coherent jets,
Secondly; coherent jets provide a circular direction that
provides impingement from all directions on the circuit
card. Past experiments also find success with high flow
delta fan nozzles. Delta fan-jets direct the fluid on a
perpendicular direction to the board surface. This could
reduce cleaning effectiveness on parts positioned in the
vertical direction. To address this concern, higher flow
nozzles are recommended when using delta fan-jets.
Past data suggests that the flooding action onto the
board surface improves penetration under flush mounted
parts. Additionally, past data suggests that a 10-15
degree manifold angle at the entrance and exit side of
the machine improves cleaning efficacy.
When selecting an engineered cleaning fluid, multiple
functionality is needed. The cleaning fluid should
exhibit a high static cleaning rate, which correlates with
the cleaning fluids ability to rapidly dissolve flux
residue. For cleaning under flush mounted chip caps,
low surface tension and capillary action are needed to
penetrate the gap at a more rapid rate. The cleaning fluid
must not foam, as this will increase surface tension and
reduce cleaning efficacy. The cleaning fluid should not
aggressively attack and dull solder joints. Chemical
attack onto the solder joint leaches small levels of the
solder alloy from the surface of the solder.
When cleaning under flush mounted chip caps, cleaning
temperature must be considered. Many of the advanced
cleaning fluids operate at lower operating temperature,
which reduces cleaning chemistry usage. When cleaning
under flush mounted chip caps, higher processing
temperatures softens the flux residue and cause the
residue to expand. This allows the cleaning fluid to
dissolve the residue at a more rapid rate, which reduces
the time required in the wash section.
Conclusion
Removal of flux residue from under flush mounted chips
caps is a difficult cleaning challenge. The designed
experiment tested cleaning efficacy as a function of time
and directional placement for removing flux residue
from under flush mounted chip chips. The data suggests
a strong correlation to time in the wash section to
achieve 100% cleaning of multiple chip caps placed
onto a printed circuit assembly. The data also suggests
that coherent jets cleaning well and offer flexibility in
placement of chip caps onto the board surface.
An optimized cleaning process requires the right balance
of static and dynamic cleaning forces. When using
inline-cleaning equipment, the length of the wash
section improves cleaning performance. The prewash
section wets the board with the cleaning fluid by
penetrating and softening the flux residue under tight
standoffs. The wash impingement section must break the
flux dam under the component to achieve flow under the
part. The data suggest that eight minutes in the wash
section is needed to achieve a process window that
produces 100% clean parts.
Follow on Research
Follow on research on a number of process variables is
needed to understand driving forces. Further testing is
needed to study the surface tension effects of the
cleaning fluid to part cleanliness. Does lower surface
tension equate to improve cleaning under the chip cap?
A designed experiment of similar cleaning fluids that
vary in surface tension affects adds to the body of data
and knowledge currently known on surface wetting.
Additional testing is needed to correlate part cleanliness
to the static cleaning rate holding the dynamic cleaning
rate constant. There are a number of engineered cleaning
fluids on the market, which complicate the user’s ability
to select the best product for the application. What are
the factors that make one cleaning fluid better than
competing offerings? Why do these materials offer
better cleaning under flush mounted chip caps?
Additional testing of temperature affects is needed to
determine the cleaning temperatures that remove 100%
of the flux residue under flush mounted chip caps. This
experiment fixed the temperature at 150ºF. Would a
lower temperature achieve similar results? This is an
important question since lower cleaning fluid
temperature improves cost of ownership.
Following on testing of nozzle design and flow is
needed. Does a Delta fan jet at high flow better than a
coherent jet? Do nozzle angles improve cleaning under
flush mounted chip caps? There is very little published
data studying this issue.
Authors
Mike Bixenman is the CTO of Kyzen Corporation.
Kyzen is the world market leader for engineered
cleaning targeted at electronic assembly and advanced
packaging process cleaning. Mr. Bixenman has over 16
years field experience in the design and processing of
cleaning fluids within high technology manufacturing
environments.
Steve Stach is the President and CEO of Austin
American Technology. AAT manufactures inline and
batch cleaning equipment targeted at electronic
assembly precision cleaning applications.
This paper is the third in a series of papers the studied
advanced processing of cleaning fluids. For copies of
previous submissions, please email either Kyzen
([email protected]) or Austin American
Technology ([email protected])