Phase Fluctuations and the Absence of Topological Defects ...
23
1 Phase Fluctuations and the Absence of Topological Defects in Photo-excited Charge Ordered Nickelate W. S. Lee 1† *, Y. D. Chuang 2† , R. G. Moore 1 , Y. Zhu 7 , L. Patthey 1,3 , M. Trigo 1,5 , D. H. Lu 4 , P. S. Kirchmann 1 , , O. Krupin 6,9 , M. Yi 1 ,M. Langner 7 , N. Huse 7,10 , J. S. Robinson 7 , Y. Chen 1 , S. Y. Zhou 2,7 , G. Coslovich 7 , B. Huber 7 , D. A. Reis 1,5 , R. A. Kaindl 7 , R. W. Schoenlein 2, 7 , D. Doering 8 , P. Denes 8 , W. F. Schlotter 9 , J. J. Turner 9 , S. L. Johnson 3 , M. Först 10 , T. Sasagawa 11 , Y. F. Kung 1 , A. P. Sorini 1 , A. F. Kemper 1 , B. Moritz 1 , T. P. Devereaux 1 , D.-H. Lee 12 , Z. X. Shen 1 *, and Z. Hussain 2 1 Stanford Institute for Materials and Energy Science, SLAC National Accelerator Laboratory and Stanford University, Menlo Park, CA 94025, USA 2 Advanced Light Source, Lawrence Berkeley National Laboratory, Berkeley, CA 94720, USA 3 Swiss Light Source, Paul Scherrer Institut, CH-5232 Villigen-PSI, Switzerland 4 Stanford Synchrotron Radiation Lightsource, SLAC National Accelerator Laboratory, Menlo Park, CA, 94025, USA 5 Stanford PULSE Institute for Ultrafast Energy Science, SLAC National Accelerator Laboratory, Menlo Park, CA 94025, USA 6 European XFEL, Hamburg, Germany 7 Materials Science Division, Lawrence Berkeley National Laboratory, Berkeley, CA 94720, USA 8 Engineering Division, Lawrence Berkeley National Laboratory, Berkeley, CA 94720, USA 9 Linac Coherent Light Source, SLAC National Accelerator Laboratory, Menlo Park, CA 94720, USA 10 Max-Planck Research Group for Structural Dynamics, University of Hamburg, CFEL, Germany 11 Materials and Structures Laboratory, Tokyo Institute of Technology, Kanagawa 226-8503, Japan 12 Department of Physics, University of California at Berkeley, Berkeley, CA 94720, USA † Y. D. Chuang and W. S. Lee led the project and have equal contribution to this work. *To whom correspondence should be addressed; e-mail: [email protected] and [email protected]. SLAC-PUB-15022 Division of Materials Sciences and Engineering, under contract DE-AC02-76SF00515 and BES.
Transcript of Phase Fluctuations and the Absence of Topological Defects ...

1
Phase Fluctuations and the Absence of Topological Defects in Photo-excited Charge Ordered Nickelate
W. S. Lee1†*, Y. D. Chuang2†, R. G. Moore1, Y. Zhu7, L. Patthey1,3, M. Trigo1,5, D. H. Lu4, P. S.
Kirchmann1, , O. Krupin6,9, M. Yi1,M. Langner7, N. Huse7,10, J. S. Robinson7, Y. Chen1, S. Y.
Zhou2,7, G. Coslovich7, B. Huber7, D. A. Reis1,5, R. A. Kaindl7, R. W. Schoenlein2, 7, D. Doering8,
P. Denes8, W. F. Schlotter9, J. J. Turner9, S. L. Johnson3, M. Först10, T. Sasagawa11, Y. F. Kung1,
A. P. Sorini1, A. F. Kemper1, B. Moritz1, T. P. Devereaux1, D.-H. Lee12, Z. X. Shen1*, and Z. Hussain2
1Stanford Institute for Materials and Energy Science, SLAC National Accelerator Laboratory and Stanford University, Menlo Park, CA 94025, USA
2Advanced Light Source, Lawrence Berkeley National Laboratory, Berkeley, CA 94720, USA 3Swiss Light Source, Paul Scherrer Institut, CH-5232 Villigen-PSI, Switzerland 4Stanford Synchrotron Radiation Lightsource, SLAC National Accelerator Laboratory, Menlo Park, CA, 94025, USA
5Stanford PULSE Institute for Ultrafast Energy Science, SLAC National Accelerator Laboratory, Menlo Park, CA 94025, USA
6European XFEL, Hamburg, Germany 7Materials Science Division, Lawrence Berkeley National Laboratory, Berkeley, CA 94720, USA 8Engineering Division, Lawrence Berkeley National Laboratory, Berkeley, CA 94720, USA 9Linac Coherent Light Source, SLAC National Accelerator Laboratory, Menlo Park, CA 94720, USA
10Max-Planck Research Group for Structural Dynamics, University of Hamburg, CFEL, Germany
11Materials and Structures Laboratory, Tokyo Institute of Technology, Kanagawa 226-8503, Japan
12Department of Physics, University of California at Berkeley, Berkeley, CA 94720, USA
†Y. D. Chuang and W. S. Lee led the project and have equal contribution to this work.
*To whom correspondence should be addressed; e-mail: [email protected] and
SLAC-PUB-15022
Division of Materials Sciences and Engineering, under contract DE-AC02-76SF00515 and BES.
2
The dynamics of an order parameter’s amplitude and phase determines the collective
behaviour of novel states emerged in complex materials1. Time- and momentum-resolved
pump-probe spectroscopy, by virtue of its ability to measure material properties at atomic
and electronic time scales2,3,4,5,6,7,8,9 and create excited states not accessible by the
conventional means can decouple entangled degrees of freedom by visualizing their
corresponding dynamics in the time domain. Here, combining time-resolved femotosecond
optical and resonant x-ray diffraction measurements on striped La1.75Sr0.25NiO4 , we reveal
unforeseen photo-induced phase fluctuations of the charge order parameter. Such
fluctuations preserve long-range order without creating topological defects, unlike thermal
phase fluctuations near the critical temperature in equilibrium10. Importantly, relaxation
of the phase fluctuations are found to be an order of magnitude slower than that of the
order parameter’s amplitude fluctuations, and thus limit charge order recovery. This
discovery of new aspect to phase fluctuation provides more holistic view for the importance
of phase in ordering phenomena of quantum matter.
In striped nickelates, charge (CO) and spin order (SO) coexist at low temperatures, where
doped charge carriers form one dimensional charge density waves, and spins align in spin order
with half the CO period (Fig. 1a).11,12,13,14,15,16 Similar stripe phases also have been found in
doped cuprates17,18, where they are thought to compete against high temperature
superconductivity. In the present work, both time-resolved optical reflectivity and resonant x-ray
diffraction19 (RXD) were used to reveal the dynamics of the CO order parameter. In particular,
RXD at the Ni L-edge primarily measures the Bragg scattering from the valence electron
modulation of Ni ions at the CO wave vector. The intensity is proportional to the CO order
parameter’s amplitude and a Debye-Waller like factor due to vibrations of the electronic CO20,21,
22 (i.e. the phase fluctuations). In addition, the correlation length of CO can be inferred from the
width of the CO diffraction peak. Therefore, the recent availability of the femtosecond x-ray free
electron laser (FEL) at Linac Coherent Light Source23 makes time-resolved RXD near the Ni L3-
3
edge an ideal probe (Fig. 1b) to measure the dynamics of electronic CO order parameters with
femtosecond resolution. A single bright x-ray FEL pulse can generate analyzable diffraction
patterns for the CO (Fig. 1c), allowing pulse-by-pulse data acquisition for correcting the x-ray
FEL timing and intensity jitter in the data analysis. The overall temporal resolution is ~ 0.4 ps
limited by the synchronization between the pump laser and x-ray FEL pulse24. Details of the
experimental setup are described in the Supplementary Information.
Fig. 2a shows the early dynamics of the integrated intensity of the CO diffraction peak for
two different pump excitation densities. Following the optical pump pulse at time zero, the
intensity drop sharply (region I), indicating a photo-induced suppression of CO. After reaching a
minimum, the intensity recovers toward its original value (region II). Fig. 2b displays the
evolution of the CO diffraction peak for a given excitation density. Within our experimental
accuracy, no variation of the peak position can be resolved in either region I or II, indicating that
the period of CO essentially remains unchanged in the photo-excited transient state. Importantly,
the width of the CO peak shows no sign of broadening in the investigated time range, suggesting
that the coherence length does not shorten due to photo-excitation despite a significant reduction
in the peak intensity. This is in sharp contrast to thermal evolution of the CO diffraction peak
near the equilibrium phase transition temperature where the dramatic decrease of the peak
intensity is accompanied by a width broadening12,13,14 ( Fig. 2c). Thus, in the photo-induced non-
equilibrium state, CO peak intensity can vary dramatically without changing the CO length
scales.
The time scales exhibited in the recovery reveal further information about the CO dynamics.
As demonstrated in Fig. 3a, the recovery of CO peak intensity (up to Δt = 25 ps) is characterized
by two recovery processes with distinct time scales, ~ 2 ps and ~ 60 ps, which differ

4
by more than one order of magnitude (see Supplementary Materials for fitting procedures).
Furthermore, the component of the slower dynamics is significant, which limits the recovery of
the CO peak intensity. To gain further insight into the origin of these two time scales, it is
informative to compare RXD data with optical reflectivity data, which is sensitive to the local
charge dynamics5,6. The recovery of photo-induced reflectivity change ΔR/R (Fig. 3b) is
similarly characterized by two recovery processes: a faster and dominant component of ∆ / ~
0.5 ps, plus a slower recovery of ∆ / ~2ps. Comparing the time scales deduced from the two
techniques, we found is similar to ∆ / ; however, the dynamics corresponding to
and ∆ / are not evident in the optical reflectivity and RXD data, respectively. These
observations are further confirmed by the pump excitation dependence summarized in Fig. 3c.
Clearly, three different dynamics are involved, and both and ∆ / are similar within the
range of investigated pump excitation density. Also, increases more pronounced than other
time scales as the pump excitation density increases, implying a different origin than that of
for long range CO recovery.
We note that Eichberger et al.4 have reported a similar observation by comparing recovery
time scales of optical reflectivity to those of femtosecond electron diffraction (FED) in TaS2.
Since FED is only sensitive to atomic positions, the distinct time scales have been attributed to
the distinction between electronic and lattice order parameters. In contrast, our time-resolved
RXD measurements provide hereto unforeseen behavior of the electronic order parameter
dynamics, as the CO diffraction peak at the Ni L3-edge in striped nickelates comes primarily
from light scattered by the Ni valence electron density modulation15. Therefore, the recovery
time scales deduced from the optical reflectivity and RXD are both of electronic origin, but

5
correspond to three different dynamics in the photo-induced non-equilibrium states. First, since
RXD is directly sensitive to the long range CO, the absence of the fastest dynamics, ∆ / ~ 0.5
ps, suggests that this kinetics is linked to microscopic relaxation processes of non-equilibrium
electronic states and is not directly linked to the restoration of long ranged CO. Second, the
similar time scales between and ∆ / suggests that they likely share a common origin. As
this dynamics is seen in both the charge distribution channel (ΔR/R) and the long range order
channel (XRD), it is reasonable to attribute this dynamics to the recovery of the magnitude of the
charge density modulation, i.e. the CO order parameter’s amplitude.
Most interestingly, the recovery of the order parameter’s amplitude does not occur
simultaneously with the recovery of the CO diffraction peak intensity and indicates the
importance of phase fluctuations in determining the recovery time of the CO itself. Phase
fluctuations could be viewed as vibrations of the electronic lattice (i.e. the periodic CO-related
charge density modulation), analogous to vibrations of the crystal lattice. Although the exact
functional form is somewhat debated, it has been demonstrated for charge density wave systems
that fluctuations of the order parameter’s phase can qualitatively give rise to a Debye-Waller
suppression of the CO diffraction peaks in addition to the lattice Debye-Waller factor20, 21, 22. As
the RXD signal is mostly sensitive to electronic CO scattering; only the phase Deybe-Waller
factor will be exclusively captured in our time-resolved XRD data. In accordance with our
results, the slower component of the CO peak intensity recovery ( ) is most likely dominated
by diminishing phase fluctuations of the CO order parameter. We note that phase excitations can
be produced, because the phase excitations are often gapless or acquire a small gap due to
pinning by the lattice or defects, and hence, require little energy to excite. In addition, since the
6
phase Debye-Waller factor exponentially suppresses the CO peak intensity scaling with the
square of average phase fluctuation, small amounts of phase fluctuation can significantly
suppress the CO peak intensity20.
Therefore, is a direct measure of how fast energy can be transferred out of phase
fluctuations and contains information about how strongly phase excitations (i.e. phasons) couple
to the lattice (i.e. phonons). In the limit of zero excitation density, the phase fluctuation
magnitude is infinitesimally small, thus can be thought to represent the intrinsic
equilibration phason-phonon coupling time scale, τφ-ph. By extrapolating to zero excitation
density in Fig. 3b, we estimate τφ-ph to be approximately 15 ps. We note that this is a lower bound
of the phason-phonon relaxation time scale. Pinning effects introduced by disorder that limits the
length scale of CO may also provide another mechanism for phason damping. High voltage
resistivity measurements suggest that these effects are non-negligible25. Nevertheless, τφ-ph is
more than one order of magnitude slower than the electron-phonon relaxation time, which is
estimated to be ~ 0.4 ps by extrapolating ∆ / to zero excitation density. This suggests that
phason-lattice coupling is still much weaker than electron-phonon coupling.
The dynamics of CO in the photo-excited transient state are summarized in Fig. 4a. At the
earliest times in region I, the electronic energy abruptly increases due to the absorption of
photons from the pump, causing the CO amplitude (Δ) suppression and generating phase (φ)
fluctuations. The excited electrons first decay rapidly, shedding energy e.g. into lattice relaxation
(~ 0.5 ps), and the CO amplitude recovers on a time scale of ~ 2 ps. In region II, the amplitude of
the CO order parameter has mostly recovered, but the phase continues to fluctuate, accounting
for most of the remaining excited electronic energy. It is found that the time scale for
7
equilibration between the phase fluctuation and the lattice is long ( > 15 ps), hence limiting the
recovery. In addition, CO remains long-ranged without changing its period in either region I or II;
this indicates that while the photo-induced transient state involves the amplitude and phase
fluctuations, topological defects are not created as it requires reconfiguring a large number of
spins and charges at a large energy cost. This is in stark contrast to the physics near the
equilibrium phase transition temperature (Fig. 4b), where low energy topological defects10
reduce the correlation length and the amplitude of the CO order parameter.
Finally, we remark that the physics described in our study should be generally applicable to
the recovery of complex order parameters in other systems, as long as the pump excitation
density is not strong enough to excite defects in the phase ordering and when the phase modes
are soft and couple weakly to the lattice. Photo-induced phase fluctuations may be crucial to
understanding the mechanism of photo-induced superconductivity in the striped cuprates2.
1. Dagotto, Elbio. Complexity in Strongly Correlated Electronic Systems. Science 309, 257-262
(2005).
2. Fausti, D. et al., Light-induced Superconductivity in a Stripe-Ordered Cuprate. Science 331,
189-191 (2011).
3. Rini Matteo et al., Control of the electronic phase of a manganite by mode-selective vibration
excitation. Nature 449, 72-72 (2007).
4. Eichberger, Maximilian et al., Snapshots of cooperative atomic motions in the optical
suppression of charge density waves. Nature 468, 799-802 (2010).
5. Giannetti, C. et al. Revealing the high-energy electric excitations underlying the onset of
high-temperature superconductivity in cuprates. Nature Commun. 2, 353 (2011).
8
6. Tomeljak, A., Schafer, H., Stadter, D., Beyer, M., Biljakovic, K. & Demsar, J. Dynamics of
photoinduced Charge density Wave-metal phase transition in K0.3MoO3. Phys. Rev. Lett. 102,
066404 (2009).
7. Schmitt, F. et al. Effect of the Amplitude Mode and the Transient Melting of the Charge
Density Wave on the Electronic Structure of TbTe3. Science 321, 1649 (2008).
8. Först, M. et al. Driving magnetic order in a manganite by ultrafast lattice excitation. Phys. Rev.
B 84, 241104 (2011).
9. Lindenberg, A. M. et al. Time-Resolved X-ray Diffraction from Coherent Phonons during a
Laser-Induced Phase Transition. Phys. Rev. Lett. 84, 111-114 (2000).
10. Nelson, D. R. & Halperin, B. I. Dislocation-mediated melting in two dimensions. Phys. Rev.
B 19, 2457 (1979).
11. Cava, R. J. et al. Magnetic and electrical properties of La2-xSrxNiO4. Phys. Rev. B 43, 1229
(1991).
12. Chen, C. H., Cheong, S.-W,& Cooper, A. S. Charge modulations in La2-xSrxNiO4+y:
Ordering of polarons. Phys. Rev. Lett. 71, 2461-2464 (1993).
13. Tranquada, J. M., Buttrey, D. J., Sachan, V., & Lorenzo, J. E. Simultaneous Ordering of
Holes and Spins in La2NiO4.125. Phys Rev. Lett. 73, 1003 (1994).
14. Vigliante, A. et al. Detection of charge scattering associated with stripe order in
La1.775Sr0.225NiO4. Phys. Rev. B 56, 8248-8251 (1997).
15. Schüssler-Langeheine, C. et al. Spectroscopy of Stripe Order in La1.8Sr0.2NiO4 Using
Resonant Soft X-Ray Diffraction. Phys. Rev. Lett. 95, 156402 (2005).
16. Cheong, S.-W. et al. Charge-ordered states in (La,Sr)2NiO4 for hole concentration nh = 1/3
and ½. Phys. Rev. B 49, 7088 (1994).

9
17. Tranquada, J. M. et al. Evidence for stripe correlations of spins and holes in copper oxide
superconductors. Nature 375, 561-563 (1995).
18. Abbamonte, P. et al. Spatially modulated ‘Mottness” in La2-xBaxCuO4. Nature Phys. 1,
155-158 (2004).
19. Doering, D. et al. Development of a compact fast CCD camera and resonant soft x-ray
scattering endstation for time-resolved pump-probe experiments. Rev. Sci. Instrum. 82,
073303 (2011).
20. Overhauser, A. W. Observability of Charge-Density Waves by Neutron Diffraction. Phys.
Rev. B 3, 3173-3182 (1971).
21. Axe, J. D. Debye-Waller factors for incommensurate structures. Phys. Rev. B 21, 4181-4190
(1980).
22. Chapman, L. D. & Colella, R. Experimental evidence from x-ray diffraction for phase
excitations in solids. Phys. Rev. Lett. 52, 652 (1984).
23. Emma, P. et al. First lasing and operation of an angstrom-wavelength free electron laser.
Nature Photonics 4, 641-647 (2010).
24. Glownia, J. M. et al. Time resolved pump-probe experiments at the LCLS. Optics Express 18,
17620 (2010).
25. Yamanouchi, S., Taguchi, T. & Tokura, Y. Dielectric Breakdown of the Insulating Charge-
Ordered State in La2-xSrxNiO4. Phys. Rev. Lett. 83, 5555 (1999).
Acknowledgements This research was supported by the U.S. Department of Energy, Office of Basic Energy
Sciences, Division of Materials Sciences and Engineering under Contract No. DE-AC02-76SF00515, SLAC
National Accelerator Laboratory (SLAC), Stanford Institute for Materials and Energy Science (W.S.L., R. M., L.P.,
M.T, Y.C., D.A.R, Y.F.K., A.P.S., A.F.K., B.M, T.P.D., Z.X.S), SLAC Stanford Synchrotron Radiation Lightsource

10
(D.H.L.), SLAC Stanford PULSE Institute (M.T., D.A.R.) and under contract number DE-AC02-05CH11231
Lawrence Berkeley National Laboratory (LBNL) Advanced Light Source (Y.D.C., Z.H.), LBNL Materials Sciences
Division (M.L., J.R., Y.Z., S.Z., G.C., B.H. R.A.K., R.W.S.), LBNL Chemical Science Division (N. H.), and LBNL
Engineering Division (D.D., P.D.). P.S.K acknowledges support by the Alexander-von-Humboldt Foundation
through a Feodor-Lynen scholarship. Y.F.K. was supported by the Department of Defense (DoD) through the
National Defense Science & Engineering Graduate Fellowship (NDSEG) Program. D.H.L acknowledges the support
by the DOE grant number DE-AC02-05CH11231. The SXR Instrument at LCLS is funded by a consortium whose
membership includes LCLS, Stanford University - SIMES, LBNL, University of Hamburg through the BMBF
priority program FSP 301, and the Center for Free Electron Laser Science (CFEL).
Author Contribution: W.S.L. and Y.D.C. conceived and led the project, and contributed equally to this work. T.S.
grew the single crystals for the experiments. Y.D.C. designed the RSXS endstation. For the experiment at LCLS,
Y.D.C., W.S.L., R.G.M., L.P., M.T., D.H.L., P.S.K., M.Y., O.K., W.F.S., J.J.T., D.D., P.D. setup RSXS endstation
and M.T. M.L., N.H., J.S.R., Z.Y., S.Y.C., D.A.R., R.A.K., R.W.S., S.L.J. setup the pump laser. Y.D.C., W.S.L.,
R.G.M., L.P., M.T., D.H.L., P.S.K., M.Y., O.K., W.F.S., J.J.T., D.D., P.D., Y.C., M.L., N.H., J.S.R., Z.Y., S.Y.C.,
D.A.R., R.A.K., R.W.S., M.F., Z.X.S., Z.H. participated the experiment at the LCLS. Y.Z., G.C., B.H. performed
optical reflectivity measurement. P.S.K. measured the sample reflectivity. R.G.M. and M.Y. composed computer
program for extracting images from data taken at the LCLS. R.G.M. and W.S.L. analyzed the data. D.H.L., Y.F.K.,
A.P.S., A.F.K., B.M., T.P.D. provided theoretical insight into the data interpretation and analysis.
11
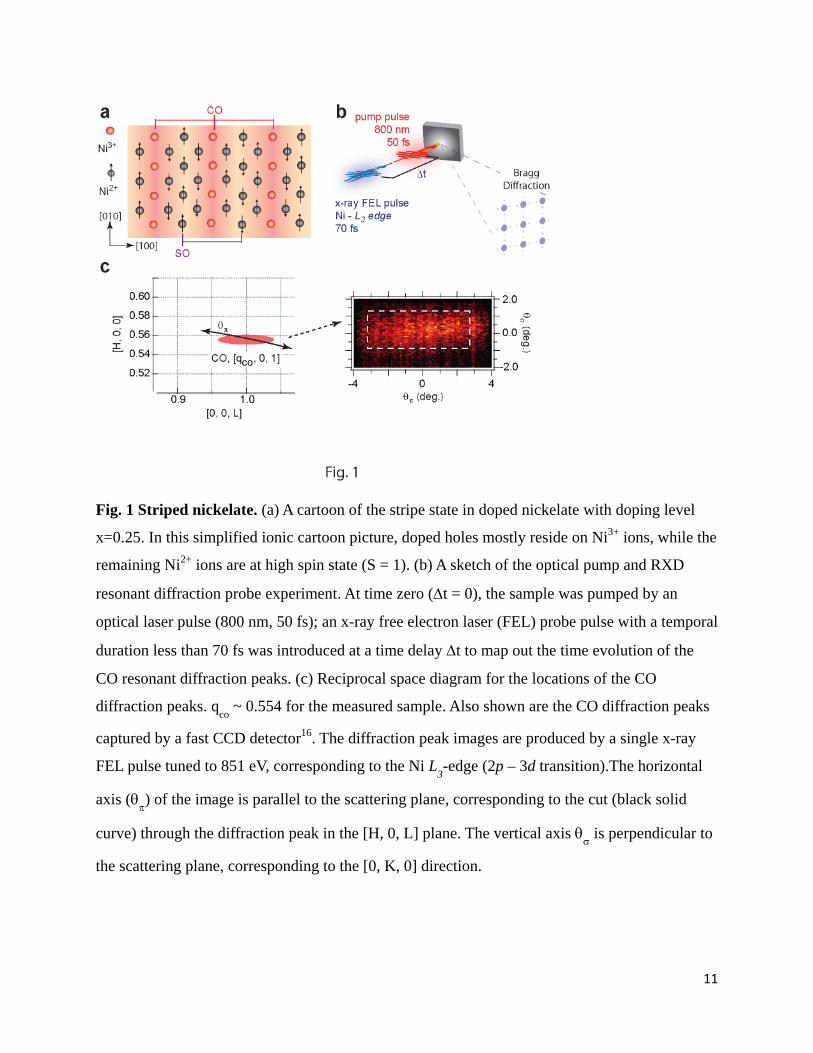
Fig. 1 Striped nickelate. (a) A cartoon of the stripe state in doped nickelate with doping level
x=0.25. In this simplified ionic cartoon picture, doped holes mostly reside on Ni3+ ions, while the
remaining Ni2+ ions are at high spin state (S = 1). (b) A sketch of the optical pump and RXD
resonant diffraction probe experiment. At time zero (Δt = 0), the sample was pumped by an
optical laser pulse (800 nm, 50 fs); an x-ray free electron laser (FEL) probe pulse with a temporal
duration less than 70 fs was introduced at a time delay Δt to map out the time evolution of the
CO resonant diffraction peaks. (c) Reciprocal space diagram for the locations of the CO
diffraction peaks. qco ~ 0.554 for the measured sample. Also shown are the CO diffraction peaks
captured by a fast CCD detector16. The diffraction peak images are produced by a single x-ray
FEL pulse tuned to 851 eV, corresponding to the Ni L3-edge (2p – 3d transition).The horizontal
axis (θπ) of the image is parallel to the scattering plane, corresponding to the cut (black solid
curve) through the diffraction peak in the [H, 0, L] plane. The vertical axis θσ is perpendicular to
the scattering plane, corresponding to the [0, K, 0] direction.

12
Fig. 2 Early dynamics of the charge order. (a) Integrated intensity within the region indicated
by the white-box in Fig. 1c plotted within the first 5 ps after time zero. The pump excitation
density is indicated by associated labels. (b) Evolution of the CO peak at the excitation density of
29 J/cm3 in regions I (upper row) and II (lower row). Images at representative time delays were
obtained from an average of approximately 30 – 40 x-ray FEL pulses. Below the images, peak-
intensity-normalized line-cuts along the dashed lines are plotted with different colors
corresponding to color-coded representative time delays. (c) Temperature dependence of the CO
resonant diffraction peak measured in thermal equilibrium conditions at a synchrotron light
source. The peak intensities are plotted in the upper panel. Lower panel displays peak-intensity-
normalized line-cuts along θσ at representative temperatures (indicated by color ticks in the
upper panel).
13
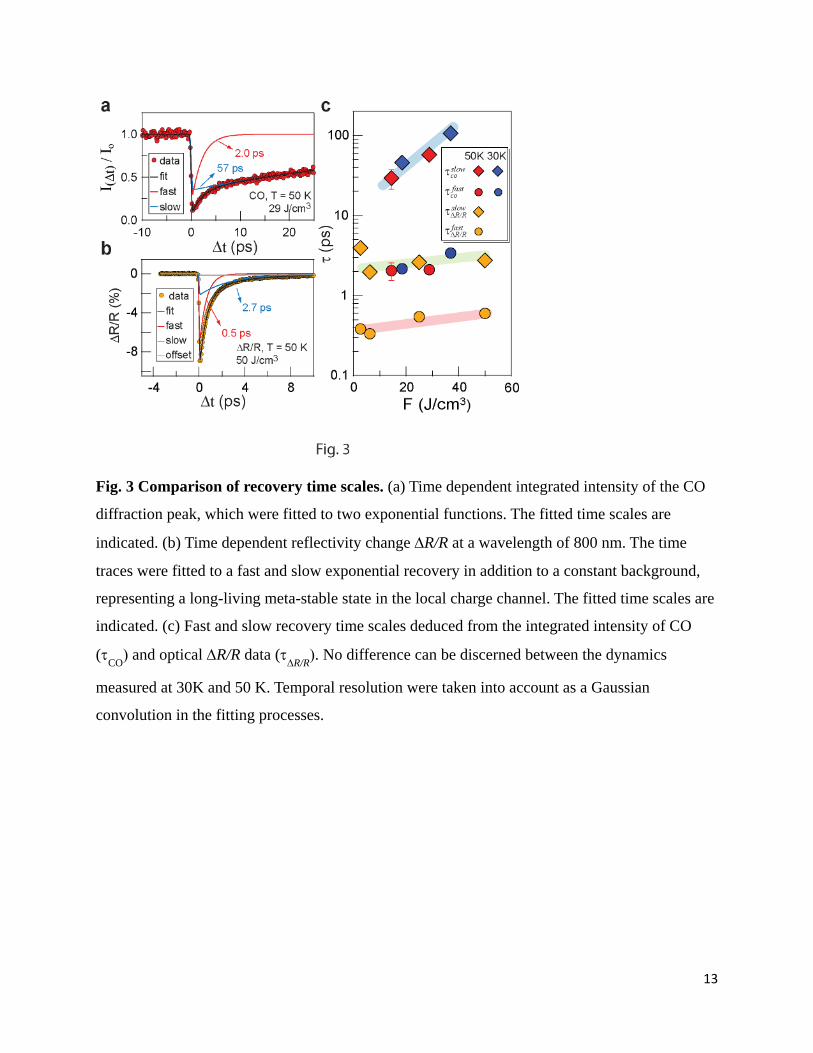
Fig. 3 Comparison of recovery time scales. (a) Time dependent integrated intensity of the CO
diffraction peak, which were fitted to two exponential functions. The fitted time scales are
indicated. (b) Time dependent reflectivity change ΔR/R at a wavelength of 800 nm. The time
traces were fitted to a fast and slow exponential recovery in addition to a constant background,
representing a long-living meta-stable state in the local charge channel. The fitted time scales are
indicated. (c) Fast and slow recovery time scales deduced from the integrated intensity of CO
(τCO) and optical ΔR/R data (τΔR/R). No difference can be discerned between the dynamics
measured at 30K and 50 K. Temporal resolution were taken into account as a Gaussian
convolution in the fitting processes.

14
Fig. 4 Illustration of CO order parameter dynamics. (a) The photo-excited CO dynamics. ΔE
is the energy difference with respect to the ground state energy. The grey shaded areas represent
the total ΔE in the long-ranged CO channel. The dissipation of ΔE through the coupling to the
lattice results in the recovery of the amplitude and phase of the CO order parameter. The order
parameter completely recovers when the absorbed energy eventually dissipates entirely to sample
environment. Sketches of order parameters at three representative temporal regions are also
shown. In each sketch, the red stripes illustrate the CO (i.e. the charge stripe) in real space whose
order parameter is symbolically drawn below as the red sinusoidal wave. The brightness of the
stripe also represents the amplitude of the order parameter. The dashed sinusoidal waves
illustrate the fluctuations of the phase of the CO order parameter. In these sketches, Δ, φ, and
ξ respectively represent the amplitude, phase, and the phase-phase correlation length of the CO
order parameter. (b) Sketches for CO evolution in thermal equilibrium. Near the phase transition
temperature TC, in addition to the Gaussian phase fluctuation, large phase fluctuations also occur

15
and create topological defects (black dot), reducing the coherence length and amplitude of the
CO order parameter.
16
Supplementary Information Materials and Methods
Materials: Single crystals of La1.75Sr0.25NiO4 were grown using the floating zone method. The crystals were first oriented using Laue diffraction and cut along the (1, 0, 0) surface. Orthorhombic notation was used to express the crystal structure were [1, 0, 0] is 45 degree to the Ni-O bond direction. The surface was then polished for experiments. The phase transition temperature for charge order is approximately 110 K.
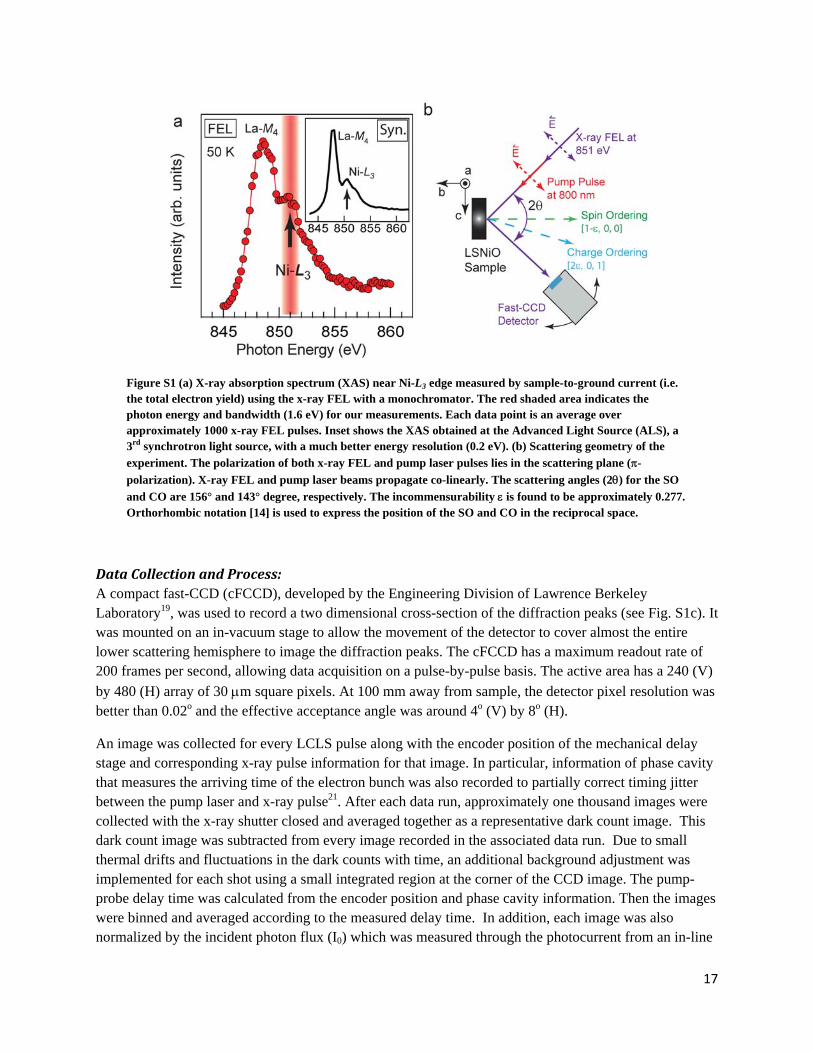
Xray FEL Configurations: Experiments were performed in the high charge mode (250 pC, 70 fs) of the LCLS at a repetition rate of 60 Hz. X-ray absorption spectrum (XAS) near the Ni L3-edge was first measured to calibrate the incident photon energy (Fig. S1a). Then, the incident photon energy was tuned to the Ni-L3 peak in XAS to perform resonant diffraction on SO and CO. The scattering geometry is sketched in Fig. S1b. The chosen band width of approximately 1.6 eV covers the energy range of the primary resonance of the CO/SO diffraction peaks15, yielding the maximal intensity. The transverse beam spot on the sample was 300 μm x 300 μm and the front-end N2 gas attenuator (set at approximately 10-30% transmission) was used to avoid radiation damage from the LCLS beam. The average FEL pulse energy was 0.5 mJ/pulse. With an estimated photon band pass associated with the selected resolution (16%) and the combined beamline efficiency (2.5%), we estimated the FEL fluence on sample surface to be approximately 0.6 mJ/cm2. The polarization of the FEL is in the scattering plane.
PumpProbe Configurations: Photoexcitation was achieved via laser pulses with central wavelength at 800 nm from a Ti:sapphire laser amplifier system. Spatial overlap between the pump laser and x-ray FEL was achieved using the x-ray induced fluorescence of an unpolished YAG crystal, viewed by three cameras from three different angles. To ensure a homogeneous excitation of the region probed by the x-ray FEL, the pump laser spot diameter (FWHM) was set at 720 μm, which is more than twice as large as the x-ray FEL spot. The pump fluence was varied with a combination of the neutral density filters and a wave-plate and polarizer. The excitation density was estimated by taking into account the projected area on the sample surface corresponding to the angle of incidence, the absorption coefficient determined by reflectivity measurements, and the optical penetration depth calculated from the measured complex index of refraction on the same sample (see next section). The direction of pump pulse polarization is the same as the x-ray FEL pulse, in the scattering plane.
Coarse temporal overlap between the optical laser-pump and the FEL-probe pulses was achieved by monitoring the photoelectric signal of the two beams when overlapped onto the tip of a coaxial cable inside the vacuum chamber. The signal from this coaxial cable was measured directly with a 13GHz bandwidth oscilloscope. By matching the rising edges of the time traces from the two signals, the temporal overlap could be determined with < 3ps accuracy. Once coarse timing was established, the pump-probe delay time was varied with a mechanical delay stage. The fine temporal overlap was determined directly by monitoring the sample diffraction signal vs time-delay. The time zero was defined to be the onset of pump-probe signal. The data were taken by randomly sampling the delay time within a given range.
17
Data Collection and Process: A compact fast-CCD (cFCCD), developed by the Engineering Division of Lawrence Berkeley Laboratory19, was used to record a two dimensional cross-section of the diffraction peaks (see Fig. S1c). It was mounted on an in-vacuum stage to allow the movement of the detector to cover almost the entire lower scattering hemisphere to image the diffraction peaks. The cFCCD has a maximum readout rate of 200 frames per second, allowing data acquisition on a pulse-by-pulse basis. The active area has a 240 (V) by 480 (H) array of 30 μm square pixels. At 100 mm away from sample, the detector pixel resolution was better than 0.02o and the effective acceptance angle was around 4o (V) by 8o (H).
An image was collected for every LCLS pulse along with the encoder position of the mechanical delay stage and corresponding x-ray pulse information for that image. In particular, information of phase cavity that measures the arriving time of the electron bunch was also recorded to partially correct timing jitter between the pump laser and x-ray pulse21. After each data run, approximately one thousand images were collected with the x-ray shutter closed and averaged together as a representative dark count image. This dark count image was subtracted from every image recorded in the associated data run. Due to small thermal drifts and fluctuations in the dark counts with time, an additional background adjustment was implemented for each shot using a small integrated region at the corner of the CCD image. The pump-probe delay time was calculated from the encoder position and phase cavity information. Then the images were binned and averaged according to the measured delay time. In addition, each image was also normalized by the incident photon flux (I0) which was measured through the photocurrent from an in-line
Figure S1 (a) X-ray absorption spectrum (XAS) near Ni-L3 edge measured by sample-to-ground current (i.e. the total electron yield) using the x-ray FEL with a monochromator. The red shaded area indicates the photon energy and bandwidth (1.6 eV) for our measurements. Each data point is an average over approximately 1000 x-ray FEL pulses. Inset shows the XAS obtained at the Advanced Light Source (ALS), a 3rd synchrotron light source, with a much better energy resolution (0.2 eV). (b) Scattering geometry of the experiment. The polarization of both x-ray FEL and pump laser pulses lies in the scattering plane (π-polarization). X-ray FEL and pump laser beams propagate co-linearly. The scattering angles (2θ) for the SO and CO are 156° and 143° degree, respectively. The incommensurability ε is found to be approximately 0.277. Orthorhombic notation [14] is used to express the position of the SO and CO in the reciprocal space.
18
aluminum foil. Due to the LCLS energy and intensity fluctuations, some of the images contained very weak signals due to low x-ray intensity while still having similar thermal noise inherent to the CCD array. Thus an I0 threshold was used to eliminate the images from the weaker LCLS pulses to maximize the signal-to-noise ratio. The I0 threshold was set to eliminate approximately half of the collected images.
The cFCCD has inherent gain and offset variations amongst the different active arrays, causing the stripe-like feature on the collected images. After the images were normalized, binned and averaged, a ten pixel wide region at the edge of the image, away from the peak, was used to generate an instrument transmission function. The image intensities were then adjusted according to this transmission function and were processed through a low pass filter to yield a smoother image. A region of interest was chosen to measure the integrated peak intensity (white boxes in Fig. 1c of the main text) from the processed average image representing the different delay times. We note that the integrated intensity is rather insensitive to the image processing we have applied.
Optical Pumpprobe Reflectivity Measurement: The ultrafast optical reflectivity change was measured by a pump-probe experimental setup based on a femtosecond Ti:Sapphire laser system. Ultrafast laser pulses at kilo-hertz repetition rate can be generated from this system with 100 fs pulse duration, 800 nm center wavelength, and 0.5 mJ per pulse energy. The pulses were split into pump and probe arm and then recombined onto the nickelate sample surface. The probe pulse reflected from the sample was detected by a photo diode detector and its reflectivity change due to the pump pulse was measured by a standard lock-in detection scheme. The sample was kept in a closed-cycle helium cryostat, where the temperature can be controlled from room temperature to 20K. The measurement geometry is similar to Fig. S1b, except the angle of incident is approximately 5 degree. The polarization of the pump is in the plane of incidence (b-c plane of the nickelate), while the polarization of probe is perpendicular to the plane of incidence (a-b plane of the nickelate).

19
Figure S2 Reflectivity of La1.75Sr0.25NiO4 measured at a wavelength of 800 nm. The solid lines represent a global fit of the Fresnel formula for a uniaxial birefringent material [3]. Together with the optical conductivity along the a/b- and c-axis, a global fit yields complex refractive indices of nab = 1.677 + i 0.536 and of nc = 2.102 + i 0.143.
Estimation of the Excitation Density The excitation density ρ(θAOI) is estimated by
,
Where Fabs is the absorbed fluence, and δ(θAOI) is the intensity penetration depth of the pump pulse.
In order to calculate Fabs and δ as function of θAOI we have characterized the complex refractive indices nab and nc of La1.75Sr0.25NiO4 along the a/b and c-axis. The reflectivity R as function of θAOI was measured employing a modelocked Ti:sapphire oscillator system operating at the same central wavelength of 800

20
nm used in pump-probe time-resolved diffraction experiments. The incident beam is focused to ~ 100 μm spot size resulting in an incident fluences of 16 μJ/cm2 at normal incidence. We recorded the reflectivity as function of θAOI and polarization for a plane of incidence being parallel to the b- and c-axis, respectively.
Fig. S2 shows the measured reflectivity R as a function of θAOI for all four investigated high-symmetry geometries. The solid lines depict the results of a global fit of a set of Fresnel formulas for a uniaxially anisotropic material3. The imaginary part of the refractive index, deduced from optical conductivity data and the real part of the refractive index, has been used as an additional constraint in the global fitting process. According to the literatures1,2, the optical conductivity for the doping level corresponding to our sample are σab = 3.75 x 10⁴ Ω-1m-1 and σb = 1.25 x 10⁴ Ω-1m-1 along a/b- and c-axis, respectively. We obtained the complex refractive indices of nab = 1.677 + i 0.536 and of nc = 2.102 + i 0.143. The error bars are estimated to be ±10%.
For the same geometry used for the pump-probe experiment (plane of incidence along c-axis, p-polarization), we observe that R is approximately 4% for θAOI = 55° (CO geometry). Together with the projected beam footprint on sample, the absorbed fluence can be evaluated. Assuming that the absorption process is linear, the optical intensity penetration depth δ for the diffraction geometry of CO is calculated to be 260 nm, using the index ellipsoid of a uniaxial material with estimated nab and nc. For the optical pump-probe experiment, the θAOI is approximately 5°, where R is approximately 15% and the penetration depth is estimated to be 440 nm.
21
Estimation of x-ray Probe Depth and its Comparison to the Optical Intensity Penetration depth It is also important to estimate the probe depth of the x-rays and compare that to the penetration depth of the optical pump laser. The x-ray penetration depth was estimated using the web tool provided on the website of the Center of X-ray Optics (CXRO), Lawrence Berkeley Lab (http://henke.lbl.gov/optical_constants/atten2.html). We used La1.75Sr0.25NiO4 as the chemical formula, and calculate the angle dependence of the penetration depth at the Ni L3-edge. It is found that the x-ray penetration depth at the Ni L3-edge is approximately 80 nm for the scattering geometries used for measuring CO. Since the diffraction measurements were performed using reflection geometry, the x-ray probe depth can be estimated as the half the penetration depth. Thus, the probe depth of the x-ray pulse at Ni L3-edge is estimated to be 40 nm for the scattering geometries of CO. We note that the x-ray probe depth is significantly smaller than the penetration depth of pump laser pulse for CO scattering geometries. Therefore, the x-ray probe volume is significantly smaller than the pump excited volume. This suggests that the spatiotemporal transport effect could be neglected in our discussion.
22
Two Time Scale Model for Fitting The CO resonant diffraction peak intensity could be written as
phasewCO eI −Δ= 2 ,
Where Δ is the order parameter’s amplitude and wphase is the Debye-Waller factor due to order parameter’s phase excitations. Therefore, we assume the recovery of the CO intensity as the product of two exponentially recovery processes corresponding to the amplitude and phase restorations, respectively. Namely, the time dependent CO normalized diffraction peak intensity can be expressed as:
)11(//// 1)1()1(~)( papapa tpa
tp
ta
tp
taCO eAAeAeAeAeAtI ττττττ +−−−−− +⋅−−=⋅−⋅⋅− . (1)
Aa is the amount of suppression of the amplitude part (i.e. |Δ|2) of the CO peak intensity, while Ap is the
suppression of the phase part (i.e. phasewe− ) of the CO peak intensity. τa and τa are the recovery time for CO peak intensity contributed from the order parameter’s amplitude and phase, respectively.
We note that we have also fit the data to the commonly used two-time-scale model:
pa tp
taCO eAeAtI ττ //1~)( −− ⋅−− . (2)
The time scales obtained using this model are essentially identical to those fitted from the model first described. However, the Ap and Ap obtained are not accurate, since the product terms is not included in Eqn. (2).
For fitting the optical reflectivity data, the fit function is
.1~)( 21 /2
/1 ConsteAeAtR tt +⋅−− −− ττ
A1 and A2 are the magnitude of the suppression of the two dynamical processes, while τ1 and τ2 are their corresponding time scales. The constant term represents a long-living meta-stable state that is only observed in the optical data, but not in the resonant x-ray diffraction data. Thus, it is not directly related to the formation of long range CO. We note that this constant term can be either positive or negative, depending on the pump excitation density and temperature.
In the fitting process, time resolution is taken into account by a Gaussian convolution with corresponding FWHM, which is 0.4 ps and 0.1 ps for the resonant x-ray diffraction and optical reflectivity measurements, respectively.
Supplementary References: 1. Eisaki, H. & Uchida, S. Optical Study of High-Tc Superconductor and Related Oxides, J. Phys.
Chem. Solids 56, 1811-1814 (1995). 2. Ido, T., Magoshi, K., Eisaki, H. & Uchida, Optical study of the La2-xSrxNiO4 system: Effect of hole
doping on the electronic structure of NiO2 plane, Phys. Rev. B 44, 12094 (1991).

23
3. Fujiwara, H. Spectroscopic ellipsometry; principles and applications (Wiley, Chichester, England, 2007).


![MAGNETIC WORMHOLES AND TOPOLOGICAL SYMMETRY*theory.caltech.edu/~preskill/pubs/preskill-1990-magnetic.pdf · Introduction The proposal [1-3] that fluctuations in the topology of space-time](https://static.fdocuments.net/doc/165x107/5f039b267e708231d409e194/magnetic-wormholes-and-topological-symmetry-preskillpubspreskill-1990-magneticpdf.jpg)