Phase Evolution in Yttria-Stabilized Zirconia Thermal...
17
1 Phase Evolution in Yttria-Stabilized Zirconia Thermal Barrier Coatings Studied by Rietveld Refinement of X-Ray Powder Diffraction Patterns * Grégoire Witz † , Valery Shklover, and Walter Steurer Laboratory of Crystallography, Department of Materials, ETH Zurich, 8093 Zurich, Switzerland Sharath Bachegowda and Hans-Peter Bossmann Alstom (Schweiz) AG, 5401 Baden, Switzerland Abstract The failure mechanism of thermal barrier coatings composed of yttria-stabilized zirconia has been proposed to be caused by the transformation of the tetragonal phase of yttria-stabilized zirconia into its monoclinic. Normally, Studies of phase evolution are performed by X-ray diffraction and evaluating the intensities of a few diffraction peaks for each phase. However, this method misses some important information that can be obtained with the Rietveld method. Using Rietveld refinement of X-ray diffraction patterns, we observe, upon annealing of YSZ coatings an increase of cubic phase content, a lowering of as-deposited tetragonal phase content and the appearance of a new tetragonal phase having a lower yttria content that coexists with the as-deposited tetragonal phase of YSZ. Introduction * Supported by the Innovation Promotion Agency, Federal Office for Professional Education and Technology, Switzerland under Grant Nr. 7820.3 EPRP-IW. † Author to whom correspondence should be addressed. e-mail: [email protected]
Transcript of Phase Evolution in Yttria-Stabilized Zirconia Thermal...
1
Phase Evolution in Yttria-Stabilized Zirconia Thermal Barrier
Coatings Studied by Rietveld Refinement of X-Ray Powder
Diffraction Patterns*
Grégoire Witz †, Valery Shklover, and Walter Steurer
Laboratory of Crystallography, Department of Materials, ETH Zurich, 8093 Zurich, Switzerland
Sharath Bachegowda and Hans-Peter Bossmann
Alstom (Schweiz) AG, 5401 Baden, Switzerland
Abstract
The failure mechanism of thermal barrier coatings composed of yttria-stabilized zirconia has been proposed to be
caused by the transformation of the tetragonal phase of yttria-stabilized zirconia into its monoclinic. Normally,
Studies of phase evolution are performed by X-ray diffraction and evaluating the intensities of a few diffraction
peaks for each phase. However, this method misses some important information that can be obtained with the
Rietveld method. Using Rietveld refinement of X-ray diffraction patterns, we observe, upon annealing of YSZ
coatings an increase of cubic phase content, a lowering of as-deposited tetragonal phase content and the appearance
of a new tetragonal phase having a lower yttria content that coexists with the as-deposited tetragonal phase of YSZ.
Introduction
*Supported by the Innovation Promotion Agency, Federal Office for Professional Education and Technology, Switzerland under Grant Nr. 7820.3 EPRP-IW. †Author to whom correspondence should be addressed. e-mail: [email protected]
2
Thermal barrier coatings (TBCs) are used in the cooled parts of gas turbines to reduce the temperature of
blades and hot engine components, allowing higher operating temperatures and yielding increased efficiency. The
most commonly used material for plasma-sprayed TBCs is yttria-stabilized zirconia (YSZ), which is produced as a
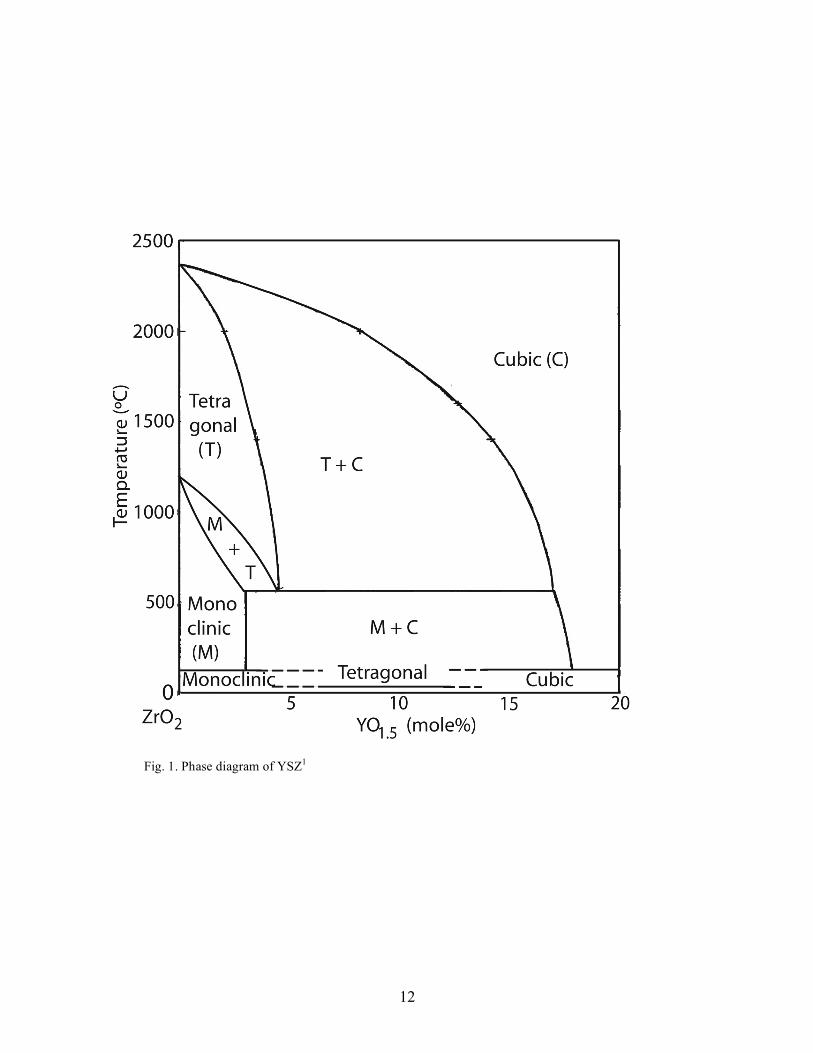
tetragonal metastable polymorph containing around 7-8 % weight of yttria. As shown in Figure 1, other polymorphs
of YSZ can be obtained by varying the yttria content.1 YSZ is stabilized into its cubic form by high yttria content;
monoclinic YSZ, on the other hand, forms with low yttria contents. The monoclinic polymorph is stable only at low
temperatures and undergoes a martensitic transformation to a tetragonal phase around 1000 ºC. The monoclinic-to-
tetragonal transformation causes a volume change in the unit cell by about 4%, which can result in cracking and
coating failure. For this reason it is commonly believed that the monoclinic phase in coatings should be avoided.
It is expected that engine efficiency will improve and operating costs will decrease with increased operating
temperatures and more frequent maintenance.2 Both of these aims require a better understanding of the failure
mechanisms of YSZ coatings. The decomposition of the metastable tetragonal polymorph of YSZ into cubic and
monoclinic polymorphs has been discussed as a mechanism for coating failure.3 For example, the spinodal
decomposition model proposed by Katamura et al. suggests diffusion of yttrium and zirconium forming domains
with a cubic structure as well as yttria-depleted tetragonal domains.4 At some point in the decomposition process,
part of the coating can become sufficiently depleted in yttrium to allow the martensitic tetragonal-monoclinic
transition upon cooling, leading to volume change of the coating and failure.
Rietveld refinement and X-ray diffraction together are efficient techniques to determine microstructural
parameters and phase content of a multiphase compound. However, Rietveld refinement of multiphase systems can
be difficult if there are overlapping peaks, as is the case for YSZ polymorphs, in spite of using a monochromatic
radiation that generally decreases the noise of the collected spectra and reduces the peak overlaps. Rietveld
refinement of peak shape parameters can give information about microstructural parameters like crystallite size and
strains. Since zirconium and yttrium are separated in the periodic table by only one atomic number, their X-rays
scattering factors are close and it is not possible to determine their relative content in the unit cell. Since the lattice
parameters of the tetragonal and cubic phases depend on the yttria content, it is possible to determine the yttria
concentration of both phases and study its evolution.
A previous neutron scattering study of the phase evolution in plasma sprayed YSZ coatings during
annealing, by Ilavsky et al., has shown that metastable tetragonal YSZ decomposes into monoclinic and cubic
3
phases as the yttria content of the tetragonal phase is reduced.5 XRD studies on plasma-sprayed coatings by Brandon
and Taylor and on EB-PVD coatings by Schulz indicate that between 1300 and 1400 ºC the metastable tetragonal
phase decomposes into a low-yttria tetragonal phase and a high-yttria cubic or tetragonal phase.6,7 Computer
simulations, combined with TEM studies, have shown that the domain boundaries have a cubic-like structure and a
relatively high concentration of yttrium ions.4
In the present work, we investigate the microstructure evolution in plasma sprayed YSZ-TBC during
annealing at 1100-1400 ºC . The lattice parameters, phase content, strains and crystallite size of as sprayed and
annealed coatings have been determined using Rietveld refinement of XRD patterns.
Experimental Procedure
YSZ coatings were produced with an atmospheric plasma spraying system (APS). The feedstock material
was zirconia with 7.8 wt% yttria powder (204NS, Sulzer-Metco, Westbury, NY). Samples were mechanically
removed from the substrate before annealing.
XRD patterns were collected using an X-ray powder diffractometer (X’Pert Pro, PANalytical, Almelo, the
Netherlands) with monochromatic CuKα1 radiation. Diffraction patterns were obtained within 2θ = 20 to 100º range
in 0.01º steps using standard θ–2θ Bragg–Brentano geometry. Rietveld refinement was performed using the General
Structure Analysis System (GSAS) package and the EXPGUI interface.8,9 The Rietveld refinement was processed
following the Rietveld refinement guidelines formulated by the International Union of Crystallography Commission
on Powder Diffraction.10 The background was fitted using Chebyschev polynomials and the peak profiles were fitted
using a convolution of a pseudo-Voigt and asymmetry function together with the microstrain broadening description
of P. Stephens.11-13 The pseudo-Voigt is defined as a linear combination of a Lorentzian and a Gaussian. The
Gaussian variance of the peak, σ2, varies with 2θ as:
!2=U tan
2" +V tan" +W + P
cos2"
(1)
4
where U, V and W are the coefficients described by Cagliotti et al. and P is the Scherrer coefficient for Gaussian
broadening.14 The Lorentzian coefficient, γ, varies as:
! =X
cos"+Y tan" (2)
The P and X coefficients are related to the Scherrer broadening and gives information about crystallite dimensions.
The U and Y coefficients are related to the strain broadening and allow estimating microstrain within crystallites:
!G(%) =
"
1808 ln2(U #U
i) (3)
!L(%) =
"
180(Y #Y
i) (4)
The surface roughness of the coating leads to absorption and reduction of the diffracted intensities at low angles. If
this effect is not taken into account during Rietveld refinement, the atomic displacement parameters are reduced and
can even become negative, having no physical meaning. To take into account the absorption effect, we used a
normalized form of the function described by Pitschke et al.15 Atomic displacement parameters and absorption
factors modify the profile intensities with a similar 2θ dependency, and refining all of them together usually leads to
unrealistic results. We have therefore fixed the atomic displacement parameters to standard values for each atom and
have refined only the absorption factors. The number of refined parameters during the last step of the refinement
process and Rp factors indicating the quality of the fit compared to the experimental XRD pattern are listed in Table
1, and the Rp values were calculated after removal of the background contribution
Four YSZ phases were used for interpretation of the XRD patterns: two tetragonal phases with different
unit cell dimensions corresponding to different yttria content of 7-8 wt% (t´-YSZ) and 4-5 wt% (t-YSZ), one
monoclinic (m-YSZ) and one cubic phase having 13-15 wt% yttria (c-YSZ). For the coatings annealed at 1400 ºC,
the pattern of the phase with high yttria content (11-13 wt% yttria) was fitted using the tetragonal phase with a low
c/a ratio. In this paper we will refer to this phase as c-YSZ to be consistent with the phase definitions used for lower
annealing temperatures. For some of the collected patterns, the intensities of peaks of some phases are too low to
5
allow a structural refinement. In such cases, the unit cell dimensions are fixed by setting them to correspond to a
chosen yttria content. Either the peak shape parameters were then fixed, or the number of refined parameters is
reduced to 1 or 2. The yttria content of the cubic phase is calculated using the formula
YO1.5 (mol%) = (a ! 5.1159) / 0.001547 (5)
derived by Ilavsky5 from Scott’s data on phase analysis of YZ powders with different yttria content1, where a is the
unit cell dimension in angstroms. The yttria content of the tetragonal phase is calculated using the formula
YO1.5 (mol%) =
1.0225 !c
a 2
0.0016
(6)
where a and c are the unit cell dimensions expressed in angstroms. This formula was derived from Scott’s data1 and
empirically corrected by Ilavsky16 to obtain a better fit with data for a wide range of samples.
Results and discussion
XRD patterns of the YSZ coating annealed at 1300 ºC for various times are given in Figure 2. The pattern
of the as-deposited coating contains only the peaks of the tetragonal t´-YSZ phase. After 10 hours of annealing,
shoulders appear at lower angles for the (004) peak and at higher angles for the (220) peak. These shoulders
correspond to the presence of low peaks belonging to a tetragonal t-YSZ phase having a higher c/a ratio. A new
peak also appears between the (004) and (220) peaks of the tetragonal phases indicating the presence of the cubic c-
YSZ phase. After 100 hours of heat treatment peaks of the t-YSZ and c-YSZ continue to grow while those of the t´-
YSZ became smaller. After 1000 hours of annealing, the t´-YSZ peaks completely disappeared and were replaced by
those of the c-YSZ and t-YSZ.
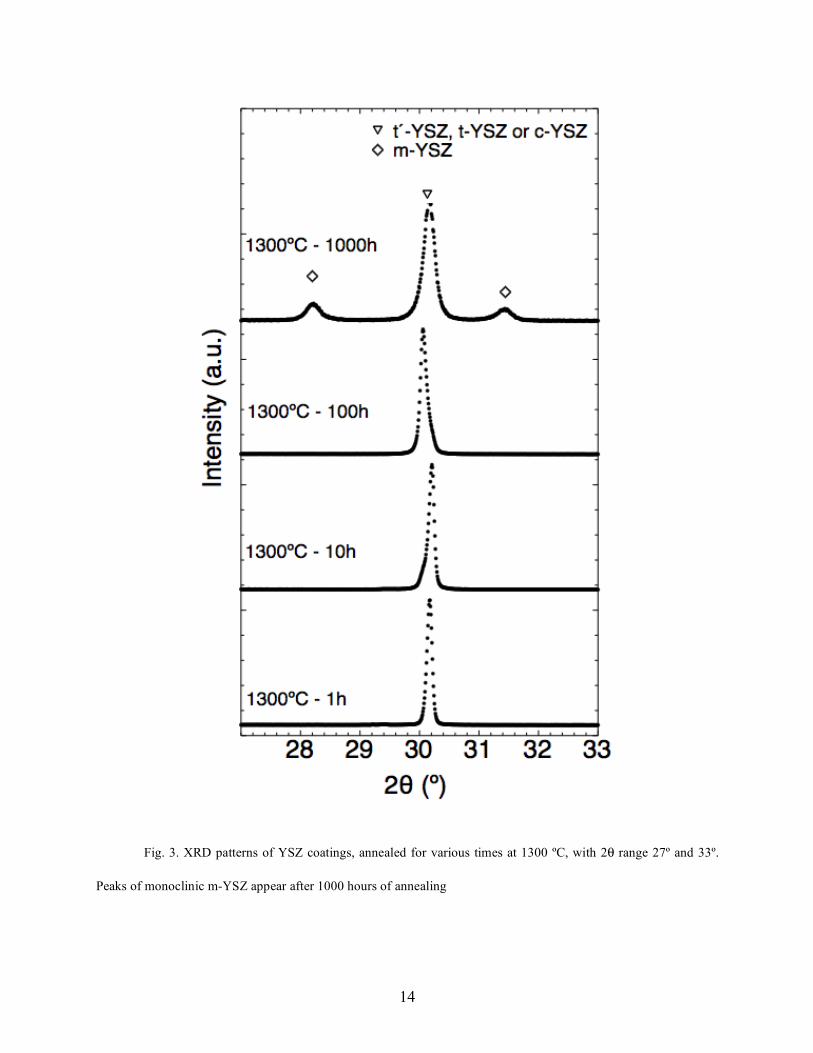
After 1000 hours of annealing peaks attributed to the monoclinic m-YSZ phase appear, as shown in Figure
3. The peak present at 2θ = 30.2º can come from the (101) peaks of both tetragonal YSZ phases and the (111) peak
of the c-YSZ. For t´-YSZ, this peak appears at a higher angle than that of t-YSZ and for c-YSZ it appears at the
6
lowest angle. Depending on the annealing time this peak has different shapes due to the presence of different
proportions of these three phases.
These observations show that fitting XRD patterns using a combination of two tetragonal YSZ phases
having different yttria content and unit cell dimensions is a good way to obtain a realistic description of the YSZ
sample composition. Using only one unique tetragonal YSZ phase is not a good solution because, as shown in
Figure 2, peaks of the tetragonal phase are no longer symmetric and do not shift due to a steady loss of yttria during
annealing; instead, a new set of peaks appears and the peaks of the as-deposited YSZ disappear. From this it appears
that no phases with an intermediate yttria content can be seen. Instead, only the as-deposited phase or the
decomposition products can be observed, as reported by Brandon and Taylor in coatings annealed at 1300 ºC and
higher.6
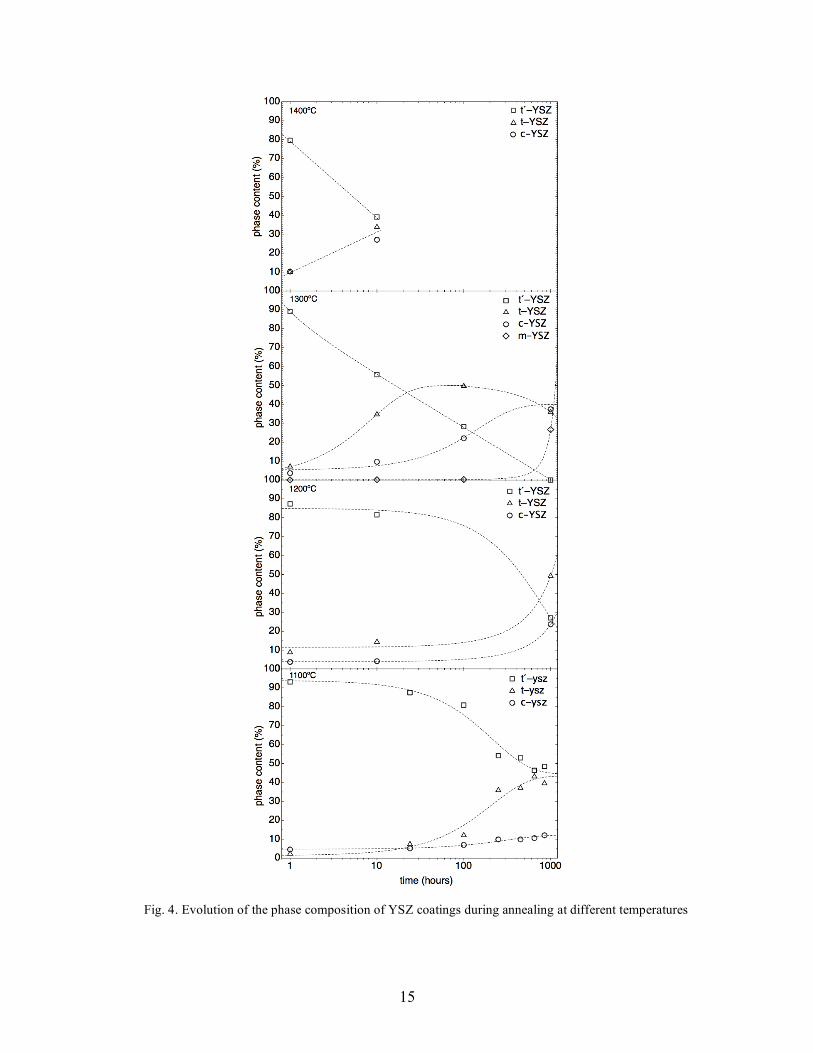
Evolution of the phase composition of the coatings during annealing at different temperatures is displayed
in Figure 4 and the phase composition, cell parameters, and yttria content of each phase are listed in Table 2. At all
temperatures, there is a decrease in the t´-YSZ content and an increase in the amounts of c-YSZ and t-YSZ. This
means that the main difference between the results of the heat treatment temperature is the decomposition rate of the
t´-YSZ.
The decomposition rate of the t´-YSZ increases by about one order of magnitude as the temperature is
increased by 100 ºC. For instance, the phase composition after a 1000 hour anneal at 1200 ºC is very close to the
composition after an anneal of 100 hours at 1300 ºC as well as 10 hours at 1400 ºC. After 1000 hours of annealing at
1300 ºC the m-YSZ appears. At the same time the t´-YSZ peaks are no longer visible and the amount of the t-YSZ
begins to decrease.
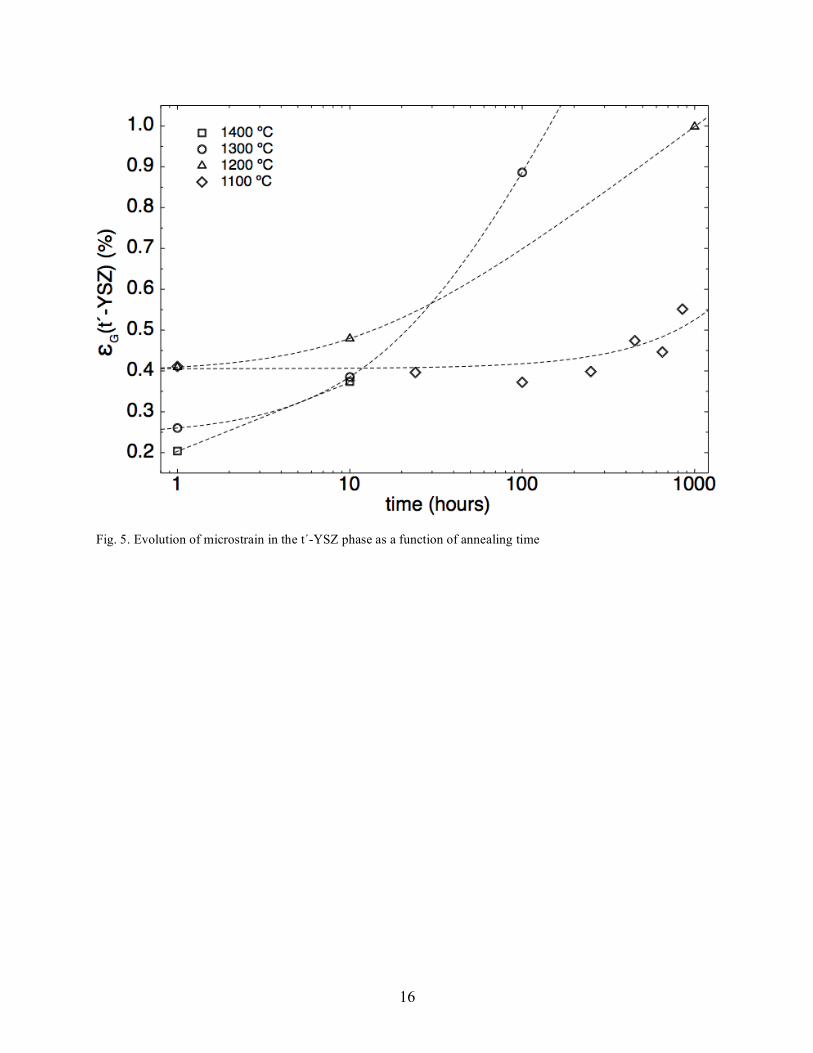
Information about microstrain and grain size was extracted from the function describing the Gaussian part
of the diffraction peak shape. This function shows that the peak broadening is mainly governed by microstrain
within the crystallites. The microstrain level in the as-deposited t´-YSZ is around 0.2-0.4% and can increase up to
1% upon annealing, as can be seen in Figure 5. After one hour of annealing at 1300 ºC or 1400 ºC the microstrain in
the coatings is lower than in the coating annealed at lower temperatures. This can be explained by the high level
(0.48%) of microstrain in the as-deposited coating that is released during annealing at high temperature. The general
subsequent increase in microstrain can be related to the reduction in t´-YSZ phase content leading to an increase in
straining due to the other phases present in the coating. In the c-YSZ and t-YSZ phases, microstrain varies between
7
0.4% and 0.7% and decrease upon annealing. The microstrain level that is reached in the t´-YSZ phase upon
annealing at high temperature is high enough to allow cracks to nucleate and propagate. The microstrain levels can
be overestimated because the microstrain broadening is described by a distribution of cell dimensions; in the case of
YSZ, this distribution can also come from a non-homogeneous yttria distribution within the grains or between the
grains. Therefore, the increase of the observed microstrain can also be interpreted as an effect of yttria diffusion,
which leads to a broader distribution of the yttria content within t´-YSZ crystallites.
The absence of t´-YSZ undergoing the decomposition process indicates that the diffusion of yttrium is
relatively fast. This observation, together with the diffraction peak profiles showing that the broadening comes
mainly from a high level of strains or a non-homogeneous yttria distribution in the particles, are in agreement with
previous TEM studies by Shibata et al.17 and the spinodal decomposition model proposed by Katamura et al.4 This
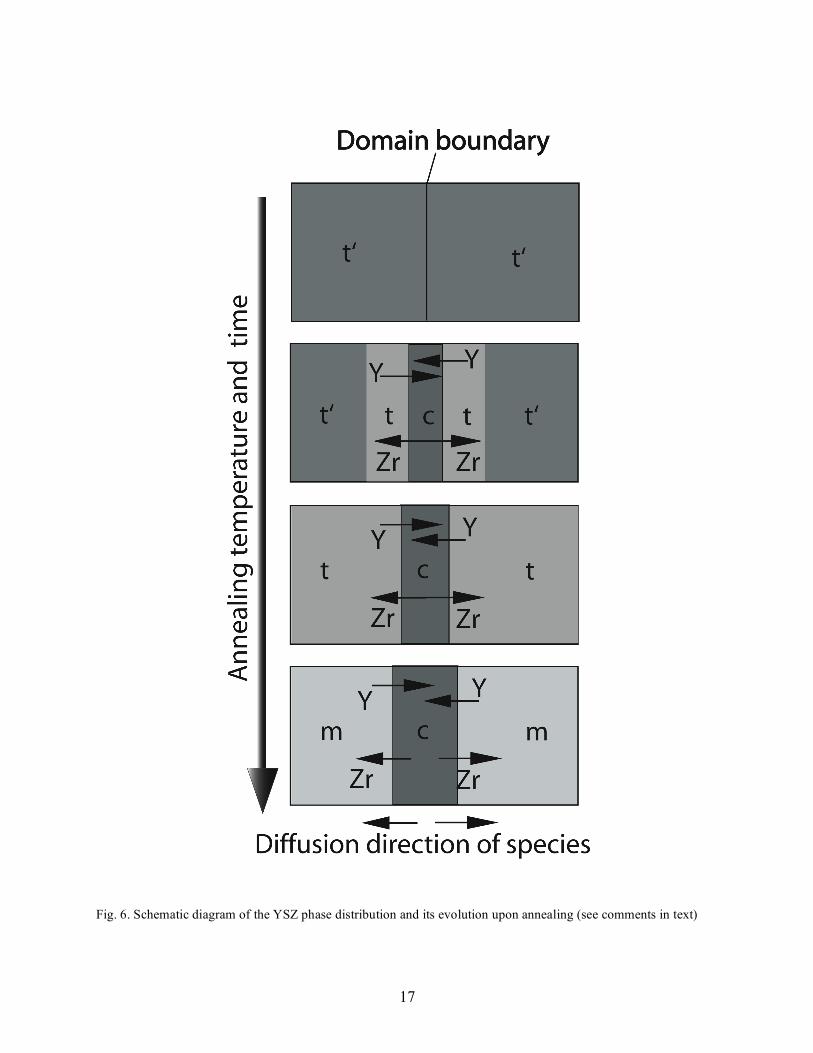
allows the formulation of the following model for decomposition of the metastable t´-YSZ, which is schematically
presented in Figure 6. According to this model, yttrium segregates at domain boundaries, yielding grains having a
modulated structure composed of cubic, high-yttria domains and tetragonal, low-yttria domains.. Only when the size
of yttria-depleted domains reaches a critical size do they undergo martensitic transformation to a monoclinic YSZ
structure.18 The decomposition process can thus be written as:
t´-YSZ → t-YSZ + c-YSZ → m-YSZ + c-YSZ
It is still not clear if the remaining traces of t-YSZ come from grains having a slower decomposition rate or if they
are equally distributed in the grains undergoing the decomposition process. It is also not apparent if the m-YSZ only
forms after the t-YSZ is fully decomposed. The answers to these questions will suggest whether t´-YSZ is stabilized
by the presence of the t-YSZ, or if the transformation from tetragonal into monoclinic YSZ is governed by another
mechanism.
Conclusions
The XRD study, combined with Rietveld refinement of full patterns, allows monitoring of the evolution of
phase composition in YSZ plasma-sprayed coatings. First, at annealing temperatures between 1100 ºC and 1300 ºC
8
the as-deposited tetragonal metastable YSZ phase, decomposes into two phases: a high yttria content cubic YSZ
phase and a new low yttria content tetragonal YSZ phase. The low yttria content tetragonal YSZ transforms into a
monoclinic polymorph upon further annealing. In the coating annealed at 1400 ºC, the as-deposited tetragonal
metastable YSZ phase decomposes into a high yttria content tetragonal YSZ phase and another low yttria content
tetragonal YSZ phase. The kinetics of the phase transformation depend on the annealing temperature and proceeds
around one order of magnitude faster when the temperature is increased by 100 ºC. The decomposition of the as-
deposited metastable YSZ phase comes together with an increase of its microstrain having values high enough to
initiate cracks that after propagation lead to the coating failure.
9
References
1 H. G. Scott, “Phase relationships in the zirconia-yttria system”, J. Mater. Sci., 10, 1527-35 (1975)
2 D. R. Clarke and C. G. Levi, “Material Design for the Next Generation Thermal Barrier Coatings”, Annu.
Rev. Mater. Res., 33, 383-417 (2003)
3 R. A. Miller, J. L. Smialek, and R. G. Garlick, “Phase Stability in Plasma-Sprayed, Partially Stabilized
Zirconia–Yttria”; pp. 241–53 in Advances in Ceramics, Vol. 3, Science and Technology of Zirconia I.
Edited by A. H. Heuer and L. W. Hobbs. American Ceramic Society, Columbus, OH, 1981
4 J. Katamura and T. Sakuma, “Computer Simulation of the Microstructural Evolution during the
Diffusionless Cubic-to-Tetragonal Transition in the System ZrO2-Y2O3”, Acta mater., 46 [5], 1569-75 (1998)
5 J. Ilavsky, J. K. Stalick, and J. Wallace, “Thermal Spray Yttria-stabilized Zirconia Phase Changes during
Annealing”, J. Therm. Spray Technol., 10 [3], 497-501 (2001)
6 J. R. Brandon and R. Taylor, “Phase stability of zirconia-based thermal barrier coatings Part I, Zirconia-
yttria alloys”, Surf. Coat. Technol., 46, 75-90 (1991)
7 U. Schulz, “Phase Transformation in EB-PVD Yttria Partially Stabilized Zirconia Thermal Barrier
Coatings during Annealing”, J. Am. Ceram. Soc., 83 [4], 904 –10 (2000)
8 A. C. Larson and R. B. Von Dreele, “General Structure Analysis System (GSAS)”, Los Alamos National
Laboratory Report LAUR 86-748 (2000)
9 B. H. Toby, “EXPGUI, a graphical user interface for GSAS”, J. Appl. Cryst., 34, 210-13 (2001)
10 L. B. McCusker, R. B. Von Dreele, D. E. Cox, D. Louër, and P. Scardi, “Rietveld refinement guidelines”, J.
Appl. Cryst. 32, 36-50 (1999)
11 P. Thompson, D. E. Cox and J. B. Hastings, J. Appl. Cryst., ”Rietveld refinement of Debye-Scherrer
synchrotron X-ray data from Al2O3”, J. Appl. Cryst., 20, 79-83 (1987)
12 L. W. Finger, D. E. Cox and A. P. Jephcoat, “A correction for powder diffraction peak asymmetry due to
axial divergence”, J. Appl. Cryst., 27, 892-900 (1994)
13 P. Stephens, “Phenomenological model of anisotropic peak broadening in powder diffraction”, J. Appl.
Cryst., 32, 281-89 (1999).
10
14 G. Caglioti, A. Paoletti and F. P. Ricci, “Choice of collimators for a crystal spectrometer for neutron
diffraction”, Nucl. Instrum., 3, 223-28 (1958)
15 W. Pitschke, H. Hermann, and N. Mattern – “The influence of surface roughness on diffracted X-ray
intensities in Bragg-Brentano geometry and its effect on the structure determination by means of Rietveld
analysis”, Powder Diffr., 8, 74-83 (1993)
16 J. Ilavsky and J. K. Stalick, “Phase composition and its changes during annealing of plasma-sprayed YSZ”,
Surf. Coat. Technol., 127 [2-3], 120-29 (2000)
17 N. Shibata, J. Katamura, A. Kuwabara, Y. Ikuhara, T. Sakuma, “The instability and resulting phase
transition of cubic zirconia”, Mater. Sci. Eng. A312, 90–8 (2001)
18 T. K. Gupta, F. F. Lange, J. H. Bechtold, “Effect of stress-induced phase transformation on the properties of
polycrystalline zirconia containing metastable tetragonal phase”, J. Mat. Sci. 13, 1464-70 (1978)
11
Figure captions
Fig. 1. Phase diagram of YSZ1
Fig. 2. XRD patterns of YSZ coatings, annealed for various times at 1300 ºC, with 2θ between 72º and 76º. The
intensity of the peaks of the t-YSZ decrease with annealing time, while new peaks of cubic c-YSZ phase and
tetragonal t-YSZ phase appear having a low yttria content.
Fig. 3. XRD patterns of YSZ coatings, annealed for various times at 1300 ºC, with 2θ range 27º and 33º. Peaks of
monoclinic m-YSZ appear after 1000 hours of annealing
Fig. 4. Evolution of the phase composition of YSZ coatings during annealing at different temperatures
Fig. 5. Evolution of microstrain in the t´-YSZ phase as a function of annealing time
Fig. 6. Schematic diagram of the YSZ phase distribution and its evolution upon annealing (see comments in text)
12
Fig. 1. Phase diagram of YSZ1

13
Fig. 2. XRD patterns of YSZ coatings, annealed for various times at 1300 ºC, with 2θ between 72º and 76º.
The intensity of the peaks of the t-YSZ decrease with annealing time, while new peaks of cubic c-YSZ phase and
tetragonal t-YSZ phase appear having a low yttria content.
14
Fig. 3. XRD patterns of YSZ coatings, annealed for various times at 1300 ºC, with 2θ range 27º and 33º.
Peaks of monoclinic m-YSZ appear after 1000 hours of annealing
15
Fig. 4. Evolution of the phase composition of YSZ coatings during annealing at different temperatures
16
Fig. 5. Evolution of microstrain in the t´-YSZ phase as a function of annealing time
17
Fig. 6. Schematic diagram of the YSZ phase distribution and its evolution upon annealing (see comments in text)