Phase Characteristics of Subwavelength Antenna … Williams,PhasecharofantennaTHzfreqmmw...Phase...
14
Phase Characteristics of Subwavelength Antenna Elements for Efficient Design of Terahertz Frequency and Millimeter Wave Metasurfaces Richard J. Williams a , Andrew J. Gatesman a , Robert H. Giles a , and William E. Nixon b a Submillimeter-Wave Technology Laboratory, University of Massachusetts Lowell, Lowell, MA, USA 01854 b US Army National Ground Intelligence Center, Charlottesville, VA, USA 22911 ABSTRACT In this paper the effects of subwavelength antenna resonator element dimensions on the anomalous reflection properties of metasurfaces operating in the millimeter wave and terahertz frequency regions are investigated. Such two- dimensional structures are finding uses as flat optics in a variety of applications including beam steerers, reflectarrays, and broadband, polarization-independent radar absorbers. Numerical simulations were performed to characterize the reflection phase of square resonators of varying dimensions for several metasurface and reflectarray designs. A simple empirical model is developed for efficient characterization of metasurface phase characteristics in lieu of expensive numerical simulation software. Keywords: Metasurfaces, terahertz, millimeter wave, reflectarrays, numerical simulations, phase shift, flat optics, beam steering, wave-front engineering, phased arrays. 1. INTRODUCTION Metamaterials are a class of engineered materials that exhibit non-natural bulk electromagnetic properties. Such materials can be engineered to exhibit negative refraction [1-7], anomalous reflection [8-10], and decreased angular sensitivity [11]. Metamaterials have also shown useful in developing transformation optics [12-15]. A metasurface is the two-dimensional analogue of a metamaterial, consisting of a distribution of subwavelength elements (generally metallic) on a substrate that introduce a spatially variant phase response across the surface. Such two-dimensional structures can also exhibit anomalous reflection and refraction [16-20] and have applications in a variety of areas including beam steerering [16,17,21,22], reflectarrays [16,17,23], and quarter-wave plates and polarization converters [24,25]. This paper shows how complex simulations of metasurface element phase behavior using commercial electromagnetic simulation software packages such as HFSS can be efficiently modeled with a generalized logistic function. The scalability of the generalized logistic model to the infrared is shown and the accuracy in predicting the phase response is analyzed. The effect of metasurface element dimensions on the reflection phase is also discussed. 2. METASURFACES AND REFLECTARRAYS 2.1 Metasurfaces If the surface of a material exhibits no spatial variation in its phase response to incident electromagnetic radiation, then the reflected and refracted waves obey the well-known law of reflection and Snell’s law. However, for a plane wave incident upon a material with a spatially dependent phase response across its surface (i.e. a metasurface), the wave obeys generalized laws of reflection and refraction (Eqs. 1, 2) [26]. For an electromagnetic wave incident upon a surface with spatial phase variation "#, at angle " i and free-space wavelength " 0 , at the interface between two media of refractive
Transcript of Phase Characteristics of Subwavelength Antenna … Williams,PhasecharofantennaTHzfreqmmw...Phase...
Phase Characteristics of Subwavelength Antenna Elements for Efficient Design of Terahertz Frequency and Millimeter Wave
Metasurfaces
Richard J. Williamsa, Andrew J. Gatesmana, Robert H. Gilesa, and William E. Nixonb
aSubmillimeter-Wave Technology Laboratory, University of Massachusetts Lowell, Lowell, MA, USA 01854
bUS Army National Ground Intelligence Center, Charlottesville, VA, USA 22911
ABSTRACT
In this paper the effects of subwavelength antenna resonator element dimensions on the anomalous reflection properties of metasurfaces operating in the millimeter wave and terahertz frequency regions are investigated. Such two-dimensional structures are finding uses as flat optics in a variety of applications including beam steerers, reflectarrays, and broadband, polarization-independent radar absorbers. Numerical simulations were performed to characterize the reflection phase of square resonators of varying dimensions for several metasurface and reflectarray designs. A simple empirical model is developed for efficient characterization of metasurface phase characteristics in lieu of expensive numerical simulation software. Keywords: Metasurfaces, terahertz, millimeter wave, reflectarrays, numerical simulations, phase shift, flat optics, beam steering, wave-front engineering, phased arrays.
1. INTRODUCTION
Metamaterials are a class of engineered materials that exhibit non-natural bulk electromagnetic properties. Such materials can be engineered to exhibit negative refraction [1-7], anomalous reflection [8-10], and decreased angular sensitivity [11]. Metamaterials have also shown useful in developing transformation optics [12-15]. A metasurface is the two-dimensional analogue of a metamaterial, consisting of a distribution of subwavelength elements (generally metallic) on a substrate that introduce a spatially variant phase response across the surface. Such two-dimensional structures can also exhibit anomalous reflection and refraction [16-20] and have applications in a variety of areas including beam steerering [16,17,21,22], reflectarrays [16,17,23], and quarter-wave plates and polarization converters [24,25]. This paper shows how complex simulations of metasurface element phase behavior using commercial electromagnetic simulation software packages such as HFSS can be efficiently modeled with a generalized logistic function. The scalability of the generalized logistic model to the infrared is shown and the accuracy in predicting the phase response is analyzed. The effect of metasurface element dimensions on the reflection phase is also discussed.
2. METASURFACES AND REFLECTARRAYS
2.1 Metasurfaces If the surface of a material exhibits no spatial variation in its phase response to incident electromagnetic radiation, then the reflected and refracted waves obey the well-known law of reflection and Snell’s law. However, for a plane wave incident upon a material with a spatially dependent phase response across its surface (i.e. a metasurface), the wave obeys generalized laws of reflection and refraction (Eqs. 1, 2) [26]. For an electromagnetic wave incident upon a surface with spatial phase variation
!
"#, at angle
!
" i and free-space wavelength
!
"0, at the interface between two media of refractive
indices ni (incident medium) and nt (transmitted medium), the two-dimensional (generalized) laws of reflection and refraction are:
!
Sin(" r) # Sin(" i) =$02%ni
d&dx
, (1)
!
ntSin(" t ) # niSin(" i) =$02%
d&dx
, (2)
where
!
" r and
!
" t are the in-plane reflection and refraction angles. Metasurfaces are therefore capable of engineered reflection and refraction through the formulation of a spatially variant phase (
!
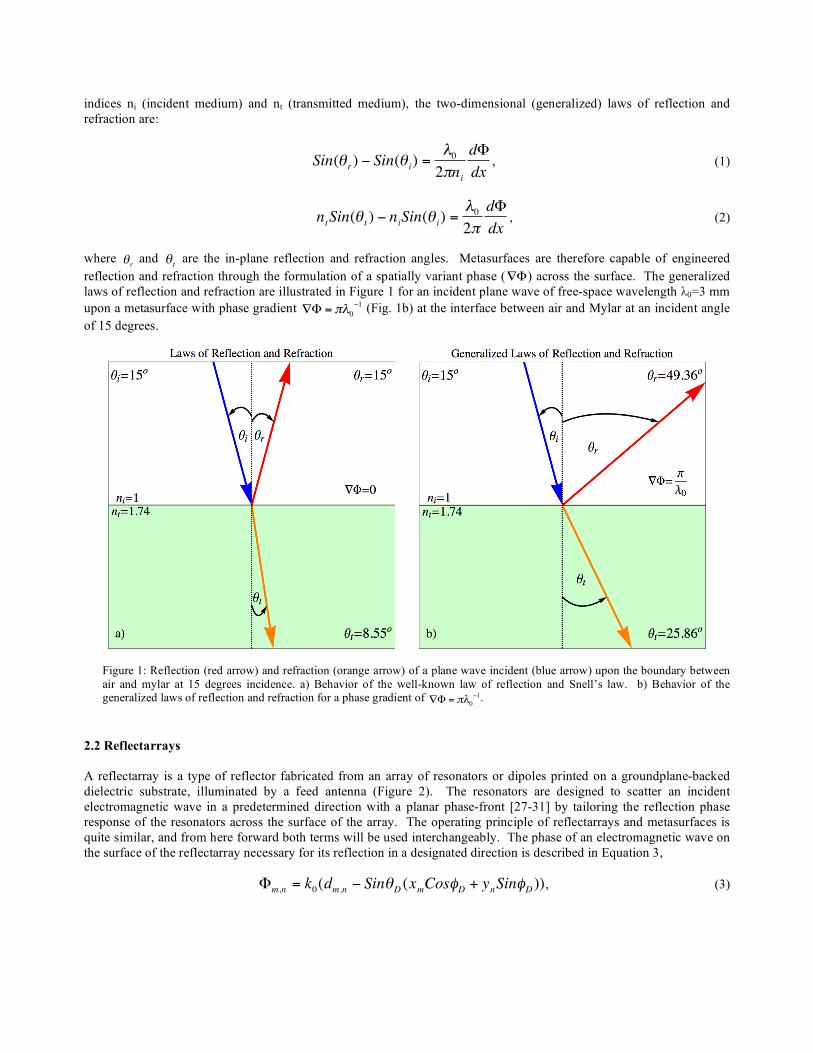
"#) across the surface. The generalized laws of reflection and refraction are illustrated in Figure 1 for an incident plane wave of free-space wavelength λ0=3 mm upon a metasurface with phase gradient
!
"# = $%0&1 (Fig. 1b) at the interface between air and Mylar at an incident angle
of 15 degrees.
Figure 1: Reflection (red arrow) and refraction (orange arrow) of a plane wave incident (blue arrow) upon the boundary between air and mylar at 15 degrees incidence. a) Behavior of the well-known law of reflection and Snell’s law. b) Behavior of the generalized laws of reflection and refraction for a phase gradient of
!
"# = $%0&1.
2.2 Reflectarrays A reflectarray is a type of reflector fabricated from an array of resonators or dipoles printed on a groundplane-backed dielectric substrate, illuminated by a feed antenna (Figure 2). The resonators are designed to scatter an incident electromagnetic wave in a predetermined direction with a planar phase-front [27-31] by tailoring the reflection phase response of the resonators across the surface of the array. The operating principle of reflectarrays and metasurfaces is quite similar, and from here forward both terms will be used interchangeably. The phase of an electromagnetic wave on the surface of the reflectarray necessary for its reflection in a designated direction is described in Equation 3,
!
"m,n = k0(dm,n # Sin$D (xmCos%D + ynSin%D )), (3)

where k0 is the free-space wavenumber,
!
"D and
!
"D are the angles of the reflected beam, and dm,n is the distance from the feed antenna to an individual resonator element located at
!
(xm ,yn ) on the reflectarray’s surface in relation to the phase-zero of the feed antenna. For the case of a simple flat metallic surface, Equation 3 should reduce to the well-known law of reflection. For a plane wave incident upon a flat metallic surface at incident angle
!
" i , the phase difference between two adjacent points (for
!
"D = 0 ) is:
!
"2 #"1 = k0($d # $xSin%D ) , (4) where
!
"i is the phase at point i,
!
"d = d2 # d1, where di is the distance from the feed to point i, and
!
"x is the distance between the two points on the metasurface. From simple geometry it is determined that
!
"d = "xSin# i, and for a continuous metallic surface with no phase variation (
!
"2 #"1 = 0), then
!
"D = " i and the law of reflection is recovered.
Figure 2: Three-dimensional schematic of a groundplane-backed reflectarray deflecting an incident electromagnetic wave (blue) into the direction defined by
!
"D and
!
"D (red).
3. NUMERICAL SIMULATIONS OF REFLECTARRAYS 3.1 Numerical Simulation Setup and Parameterization The phase response of a square-resonator reflectarray element was determined by simulating arrays of identical square-patch resonators with ANSYS HFSS commercial software [32]. The structure simulated was a reflectarray with metallic subwavelength resonator elements of varying size on an aluminum-backed mylar substrate (εr=3.04). The master-slave boundary method was used in conjunction with floquet port excitation to obtain the reflection phase as a function of the size of the square patches, as depicted in Figure 3. The boundary conditions of the master boundary are imposed on the slave boundary to achieve periodic boundary conditions. Simulations were performed for metallic patch thicknesses (t) of 0.3 um, 1 um, 10 um, and 30 um; substrate heights (h) of 25.4 um, 76.2 um, and 127 um; unit cell periodicities (P) of 312.3 um, 624.6 um, and 936.88 um; for 90 GHz, 100 GHz, 160 GHz, 240 GHz, and 350 GHz; and variable patch resonator side lengths (L). As an example of the phase simulations provided by HFSS, the phase response of a square-patch reflectarray with a unit cell periodicity of 936.88 um, a substrate height of 127 um, square patch thickness of 0.3 um, and simulation frequency

160 GHz is shown in Figure 4. It is evident from Figure 4 that the phase response is highly nonlinear with respect to patch side length and also displays asymptotic behavior as the patch side length L approaches 0 and the periodicity P.
Figure 3: HFSS master-slave simulation setup of a reflectarray consisting of an aluminum backed mylar substrate of height h, square unit cell periodicity P, and aluminum patch side length L. The floquet port is placed at the top of an air box (light blue), a master boundary (green) is shown on the x-axis, and a slave boundary (pink) is shown at y=P. A corresponding set of master-slave boundaries are also employed along the y-axis (master) and at x=P (slave) as shown in the inset.
Figure 4: Example HFSS phase response of a square patch reflectarray as a function of the patch side length L. The simulation parameters are: unit cell periodicity P=936.88 um; patch thickness t=0.3 um; substrate height h=127 um, and simulation frequency 160 GHz.

4. GENERALIZED LOGISTIC FUNCTION MODEL OF PHASE RESPONSE 4.1 Generalized Logistic Function Model In this section an empirical model is introduced for fast characterization of the phase response of metallic square resonators as a function of the resonator side length to be used in lieu of expensive computational software. The reflection phase of the square resonators (Figure 4) shows a nonlinear response with variations in the patch side length. This nonlinear behavior can be modeled with generalized logistic functions, commonly used in nonlinear growth models of forestation and plant growth [33-35], biological growth [36], tumor growth [37], as well as in economics [38]. Until now, the generalized logistic function has not been used to model the phase response of metasurfaces or reflectarrays. The generalized logistic function is given in Equation 5 where K is the upper asymptote, A is the lower asymptote, B is the growth/decay rate (B>0/B<0), Q is a constant factor, and ν is an asymmetry parameter. The dynamic range of the generalized logistic function is the maximum variation in the function as defined in Equation 6.
!
"(x) = A +K # A
(1+Qe#B (x#x0 ))1v
(5)
!
"# = K $ A (6) The generalized logistic function (with B<0) is shown in Figure 5 for three cases: the symmetric case (ν=1); an asymmetric case (ν>1) showing faster decay towards the upper asymptote K, and another asymmetric case (ν<1) showing faster decay towards the lower asymptote A. Three regions can be defined for the logistic function; the upper asymptotic region where
!
"#K , the lower asymptotic region where
!
"#A, and the decay region about the inflection point x0.
Figure 5: Three cases of the generalized logistic function. The symmetric case (blue, ν=1), an asymmetric case showing faster decay towards the upper asymptote (orange, ν=5), and the asymmetric case of faster decay towards the lower asymptote (red, ν=0.2). All three plots have the common parameters: K=1, A=-1, Q=1, x0=0.5, and B=-30. The inflection point x0 has been labeled for the symmetric case (blue).
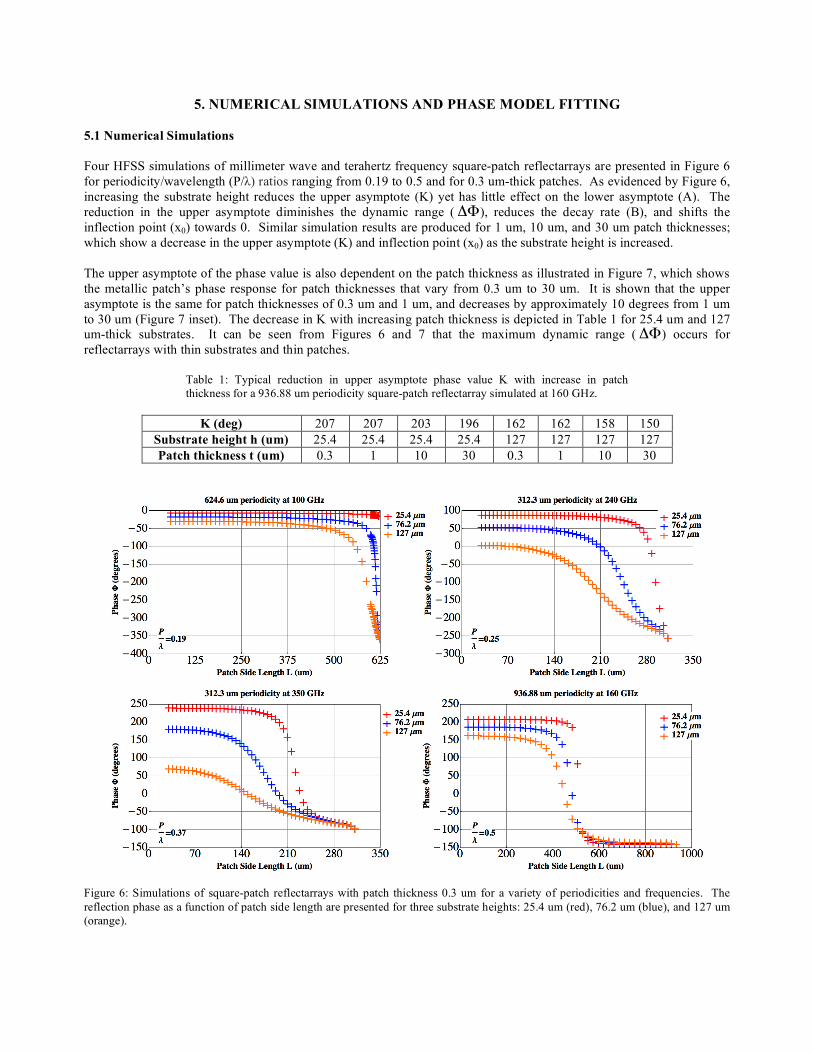
5. NUMERICAL SIMULATIONS AND PHASE MODEL FITTING 5.1 Numerical Simulations Four HFSS simulations of millimeter wave and terahertz frequency square-patch reflectarrays are presented in Figure 6 for periodicity/wavelength (P/λ) ratios ranging from 0.19 to 0.5 and for 0.3 um-thick patches. As evidenced by Figure 6, increasing the substrate height reduces the upper asymptote (K) yet has little effect on the lower asymptote (A). The reduction in the upper asymptote diminishes the dynamic range (
!
"#), reduces the decay rate (B), and shifts the inflection point (x0) towards 0. Similar simulation results are produced for 1 um, 10 um, and 30 um patch thicknesses; which show a decrease in the upper asymptote (K) and inflection point (x0) as the substrate height is increased. The upper asymptote of the phase value is also dependent on the patch thickness as illustrated in Figure 7, which shows the metallic patch’s phase response for patch thicknesses that vary from 0.3 um to 30 um. It is shown that the upper asymptote is the same for patch thicknesses of 0.3 um and 1 um, and decreases by approximately 10 degrees from 1 um to 30 um (Figure 7 inset). The decrease in K with increasing patch thickness is depicted in Table 1 for 25.4 um and 127 um-thick substrates. It can be seen from Figures 6 and 7 that the maximum dynamic range (
!
"#) occurs for reflectarrays with thin substrates and thin patches.
Table 1: Typical reduction in upper asymptote phase value K with increase in patch thickness for a 936.88 um periodicity square-patch reflectarray simulated at 160 GHz.
K (deg) 207 207 203 196 162 162 158 150
Substrate height h (um) 25.4 25.4 25.4 25.4 127 127 127 127 Patch thickness t (um) 0.3 1 10 30 0.3 1 10 30
Figure 6: Simulations of square-patch reflectarrays with patch thickness 0.3 um for a variety of periodicities and frequencies. The reflection phase as a function of patch side length are presented for three substrate heights: 25.4 um (red), 76.2 um (blue), and 127 um (orange).

Figure 7: Square-patch reflectarray simulation showing effects of patch thickness on the upper asymptote (K). Simulation performed for 936.88 um periodicity and 76.2 um substrate at 160 GHz for patch thicknesses 0.3 um (red), 1 um (blue), 10 um (orange), and 30 um (purple). Inset shows a reduction of approximately 10 degrees in the upper asymptote (K) between patch thicknesses of 1 um (blue) and 30 um (purple). 5.2 Generalized Logistic Function Model Fitting 5.2.1 Example Phase Model Fit Parameters The symmetric form of the logistic function is chosen to model the HFSS simulation results and is justified by the appearance of symmetry in the phase response leading into and out of the inflect point x0 in Figures 4, 6, and 7. The logistic function model is applied to the 160 GHz simulations of a square-patch reflectarray with 936.88 um periodicity in Figures 8-10, for the 25.4 um substrate, 76.2 um substrate, and 127 um substrate, respectively. The three substrate heights along with the logistic function parameters from Figures 8-10 are summarized in Table 2.
Figure 8: Logistic function model fit (purple line) to numerical simulation (red cross) of a square-patch reflectarray with patch thickness 0.3 um, substrate height 25.4 um, and 936.88 um periodicity for 160 GHz. Fit parameters are given in lower left corner.

Figure 9: Logistic function model fit (purple line) to numerical simulation (blue cross) of a square-patch reflectarray with patch thickness 0.3 um, substrate height 76.2 um, and 936.88 um periodicity for 160 GHz. Fit parameters are given in lower left corner.
Figure 10: Logistic function model fit (purple line) to numerical simulation (orange cross) of a square-patch reflectarray with patch thickness 0.3 um, substrate height 127 um, and 936.88 um periodicity for 160 GHz. Fit parameters are given in lower left corner.
Table 2: Logistic function fit parameters for three square-patch reflectarrays with patch thickness 0.3 um, periodicity 936.88 um, simulated at 160 GHz, for substrate heights of 25.4 um, 76.2 um, and 127 um (Figures 8-10).
h (um) K (deg) A (deg) B (um-1) x0 (um) Q ν B*h
25.4 205.48 -140 -0.1433 512.42 1 1 -3.64 76.2 183.45 -140 -0.0478 477.49 1 1 -3.64 127 158.62 -135 -0.0287 445.91 1 1 -3.64
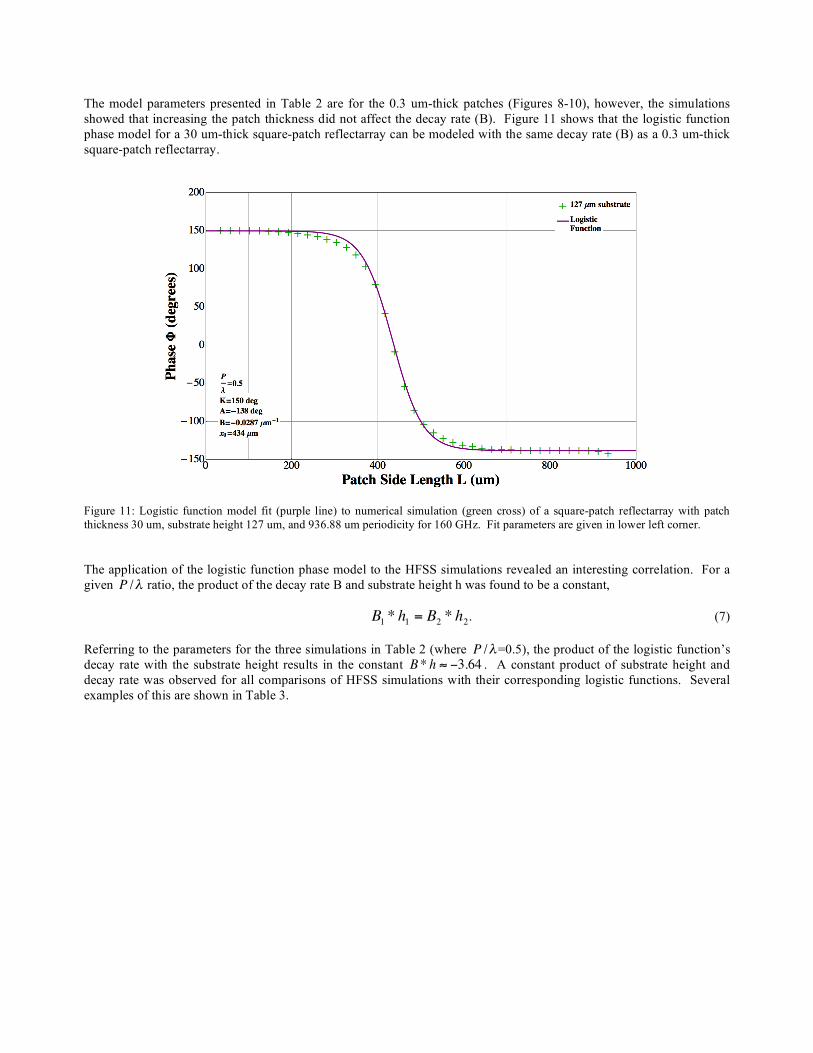
The model parameters presented in Table 2 are for the 0.3 um-thick patches (Figures 8-10), however, the simulations showed that increasing the patch thickness did not affect the decay rate (B). Figure 11 shows that the logistic function phase model for a 30 um-thick square-patch reflectarray can be modeled with the same decay rate (B) as a 0.3 um-thick square-patch reflectarray.
Figure 11: Logistic function model fit (purple line) to numerical simulation (green cross) of a square-patch reflectarray with patch thickness 30 um, substrate height 127 um, and 936.88 um periodicity for 160 GHz. Fit parameters are given in lower left corner. The application of the logistic function phase model to the HFSS simulations revealed an interesting correlation. For a given
!
P /" ratio, the product of the decay rate B and substrate height h was found to be a constant,
!
B1 * h1 = B2 * h2. (7) Referring to the parameters for the three simulations in Table 2 (where
!
P /"=0.5), the product of the logistic function’s decay rate with the substrate height results in the constant
!
B* h " #3.64 . A constant product of substrate height and decay rate was observed for all comparisons of HFSS simulations with their corresponding logistic functions. Several examples of this are shown in Table 3.

Table 3: Summary of decay rates B multiplied by substrate heights h for simulations modeled by the generalized logistic function, ordered by increasing
!
P /" . All simulations with a given
!
P /" where found to have the same B*h value.
P/λ Freq (GHz) Period P (um) Patch Thickness t (um)
Substrate Height h (um)
B (um-1) B*h
25.4 -0.2008 -5.1 76.2 -0.06693 -5.1
0.15 160 281.06 0.3
127 -0.04016 -5.1 25.4 -0.18898 -4.8 76.2 -0.062992 -4.8
0.21 100 624.6 0.3
127 -0.037795 -4.8 25.4 -0.18898 -4.8 76.2 -0.062992 -4.8
0.21 350 179.88 0.3
127 -0.037795 -4.8 25.4 -0.14685 -3.73 76.2 -0.04895 -3.73
0.25 240 312.4 0.3
127 -0.02932 -3.73 25.4 -0.14685 -3.73 76.2 -0.04895 -3.73
0.25 100 749.5 0.3
127 -0.02932 -3.73 25.4 -0.1433 -3.64 76.2 -0.0478 -3.64
0.5 160 936.88 0.3
127 -0.0287 -3.64 25.4 -0.1433 -3.64 76.2 -0.0478 -3.64
0.5 240 624.6 0.3
127 -0.0287 -3.64 As is evident from Figures 8 – 11, the logistic function model provides an accurate prediction model for the phase variation of square-patch reflectarrays. The logistic function model shows some slight deviation from the simulated data in the regions leading into and out of the inflection point x0. For the phase variation simulation in Figure 10, the deviation of the logistic function model from the simulated data was between 2 – 10 degrees. The prediction model deviates from the simulated data by up to 2 degrees in the asymptotic regions (L<200 um and L>700 um) and by up to 5 degrees in the decay region (400 um<L<500 um). Leading into the decay region from the upper asymptote (200 um<L<400 um) the logistic function model exhibits the largest deviation from the simulated data, with the model varying by 3 – 10 degrees from the data. Leading out of the decay region towards the lower asymptote (500 um<L<700 um), the model variation is within 6 degrees of the simulated data. 5.2.2 Application of Logistic Function Model to the Infrared Section 5.2.1 demonstrated that the product of the logistic function’s decay rate B and the substrate height h was a constant for a given
!
P /" ratio. This essentially says that the product B*h is scale invariant. To test this scale invariance, phase response from an infrared reflectarray metasurface was modeled with a generalized logistic function. Reference [16] designed and built an infrared (
!
" = 8.06um) reflectarray based on 50 nm thick rectangular gold patches with a unit cell periodicity of 1.2 um and a substrate height of 300 nm (Fig. 12a) resulting in a
!
P /" ratio of 0.15. Their phase response data as a function of patch size is given in Figure 12b.
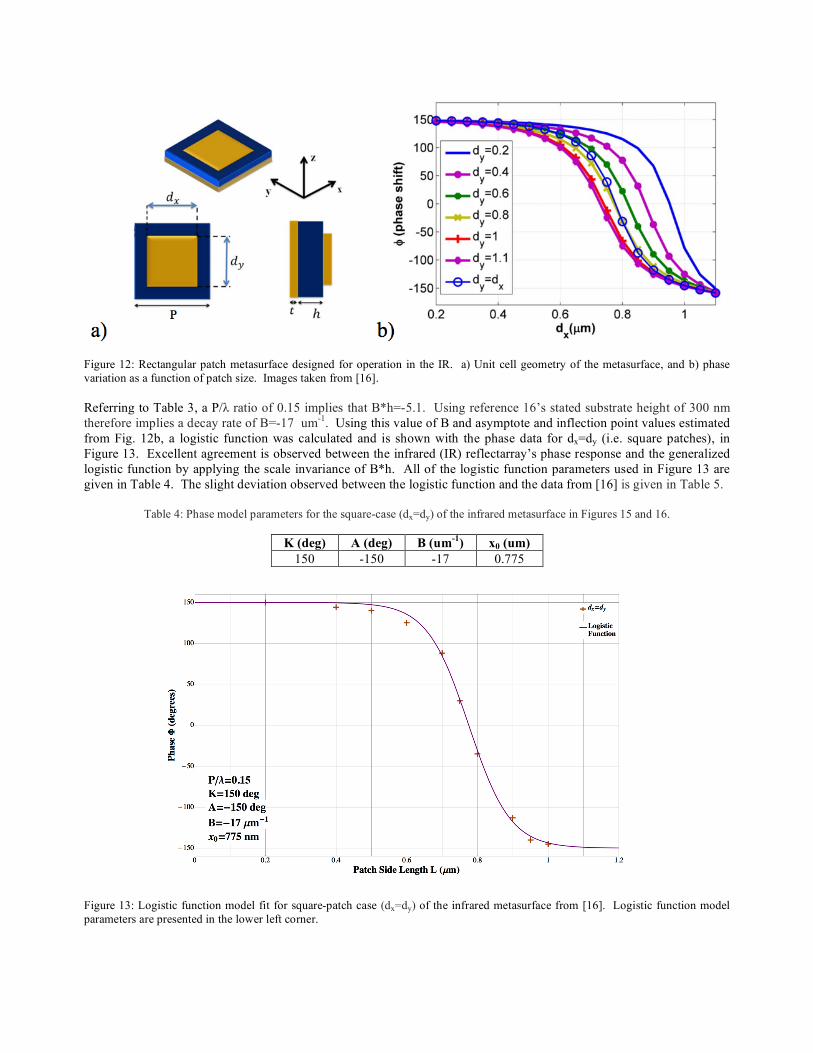
Figure 12: Rectangular patch metasurface designed for operation in the IR. a) Unit cell geometry of the metasurface, and b) phase variation as a function of patch size. Images taken from [16]. Referring to Table 3, a P/λ ratio of 0.15 implies that B*h=-5.1. Using reference 16’s stated substrate height of 300 nm therefore implies a decay rate of B=-17 um-1. Using this value of B and asymptote and inflection point values estimated from Fig. 12b, a logistic function was calculated and is shown with the phase data for dx=dy (i.e. square patches), in Figure 13. Excellent agreement is observed between the infrared (IR) reflectarray’s phase response and the generalized logistic function by applying the scale invariance of B*h. All of the logistic function parameters used in Figure 13 are given in Table 4. The slight deviation observed between the logistic function and the data from [16] is given in Table 5.
Table 4: Phase model parameters for the square-case (dx=dy) of the infrared metasurface in Figures 15 and 16.
K (deg) A (deg) B (um-1) x0 (um) 150 -150 -17 0.775
Figure 13: Logistic function model fit for square-patch case (dx=dy) of the infrared metasurface from [16]. Logistic function model parameters are presented in the lower left corner.

Table 5: Deviation of logistic function phase model from infrared metasurface data. Device phase values are taken from square case (dx=dy) in Figure 12b.
Patch Size (um) 0.2 0.4 0.5 0.6 0.7 0.75 0.8 0.9 0.95 1.0 Device Phase (deg) 150 144 140 125 88 30 -35 -113 -140 -145 Model Phase (deg) 149.99 149.49 147.23 135.43 84.48 31.4 -31.4 -117.99 -135.43 -143.59
Deviation (deg) -0.01 -5.49 -7.23 -10.43 3.52 -1.4 3.6 4.99 4.57 1.41
6. DISCUSSION It has been shown that the symmetric form of a generalized logistic function provides an accurate model for the phase variation of square-patch reflectarrays. The symmetric form of the logistic function was chosen due to apparent symmetry in the phase simulations of millimeter wave and terahertz frequency reflectarrays. As shown in Figures 8 – 11, the logistic function provides an accurate model of the phase variation of a square reflectarray resonator with a maximum error of up to approximately 10 degrees. For the asymptotic regions and the decay region, the logistic function model predicts the phase of a square resonator to within approximately 6 degrees of the simulated data. The largest error in prediction is seen in the transitions between the asymptotic and decay regions, which may indicate the need to use an asymmetric logistic function. Although the model was formulated in the millimeter wave and terahertz frequency regions, successful application of the model to the infrared has been shown. As the product of the logistic function’s decay rate B and the substrate height h was determined to be a constant for a given P/λ ratio, the phase model can be scaled to other frequency regions as shown by the successful application to the infrared in Figure 13. The application of the logistic function phase model to the infrared metasurface from [16] also produced some phase error in the transitions between the asymptotic regions and the decay region. In these transitions the model deviation increased to approximately 11 degrees, while the asymptotic and decay regions deviated by less than 6 degrees.
7. CONCLUSION A logistic function model has been formulated to efficiently characterize the phase response of square-patch reflectarray elements at millimeter wave and terahertz frequencies. Agreement between the proposed model and numerical simulations has been shown to within 10 degrees. It was observed that the product of the decay rate (B) and the substrate height (h) was a constant for a given P/λ ratio. This allows the model to be applied to other frequency regions, such as the infrared to provide accurate predictions for square resonator reflectarray. Due to its accuracy and scalability, this model can be used in lieu of expensive numerical software to aid in the fast and efficient design of reflectarrays based on metallic square patch resonators.
CITATIONS [1] Smith, D. R., Pendry, J. B., and Wiltshire, M. C. K., “Metamaterials and Negative Refractive Index,” Science
Magazine, 305 (5685), 788-792 (2004). [2] Shalaev, V. M., Cai, W., Chettiar, U. K., Yuan, H-K., Sarychev, A. K., Drachev, V. P., and Kildishev, A. V.,
“Negative Index of Refraction in Optical Metamaterials,” Optics Letters 30(24), 3356-3358 (2005). [3] Agranovish, V. M., Shen, Y. R., Baughman, R. H., and Zakhidov, A. A., “Linear and Nonlinear Wave
Propagation in Negative Refraction Metamaterials,” Lawrence Berkeley National Laboratory. Berkeley, CA. (2003).
[4] Pendry, J. B., “Negative Refraction Makes a Perfect Lens,” Phys. Rev. Lett. 85(18), 3966-3969 (2000). [5] Parimi, P. V., Lu, W. T., Vodo, P., Sokoloff, J., Derov, J. S., and Sridhar, S., “Negative Refraction and Left-
Handed Electromagnetism in Microwave Photonic Crystals,” Phys. Rev. Lett. 92(12), 127401-1 – 127401-4 (2004).

[6] Grbic, A. and Eleftheriades, G. V., “Experimental Verification of Backward-Wave Radiation from a Negative Refractive Index Metamaterial,” Journal of Applied Physics 92(10), 5930-5935 (2002).
[7] Aydin, K., Guven, K., Soukoulis, C. M., and Ozbay, E., “Observations of Negative Refraction and Negative Phase Velocity in Left-Handed Metamaterials,” Applied Physics Letters 86, 124102-1 – 124102-3 (2005).
[8] Wei, Z., Li, H., Wu, C., Cao, Y., Ren, J., Hang, Z., Chen, H., Zhang, D., and Chan, C. T., “Anomalous Reflection from Hybrid Metamaterial Slab,” Optics Express 18(12), 12119-12126 (2010).
[9] Feng, Y., Teng, X., Zhao, J., Chen, Y., and Jiang, T., “Anomalous Reflection and Refraction in Anisotropic Metamaterial Realized by Periodically Loaded Transmission Line Network,” Journal of Applied Physics 100, 114901-1 – 114901-7 (2006).
[10] Brodin, G., Marklund, M., Stenflo, L., and Shukla, P. K., “Anomalous Reflection and Excitation of Surface Waves in Metamaterials,” Physics Letters A 367, 233-236 (2007).
[11] Wells, B. M., Roberts, C. M., and Podolskiy, V. A., “Metamaterials-based Salisbury Screens with Reduced Angular Sensitivity,” Applied Physics Letters 105, 161105-1 – 161105-4 (2014).
[12] Kildishev, A. V. and Shalaev, V. M., “Transformation Optics and Metamaterials,” Physics-Uspekhi 54(1), 53-63 (2011).
[13] Shin, D., Urzhumov, Y., Lim, D. Kim, K., and Smith, D. R., “A Versatile Smart Transformation Optics Device with Auxetic Eleasto-Electromagnetic Metamaterials,” Scientific Reports 4, 4084 1-8 (2014).
[14] Quach, J. Q., Su, C-H., and Greentree, A. D., “Transformation Optics for Cavity Array Metamaterials,” Optics Express 21(5), 5575-5581 (2013).
[15] Castaldi, G., Savoia, S., Galdi, V., Alu, A., and Enghetta, N., “Metamaterials via Complex-Coordinate Transformation Optics,” Phys. Rev. Lett. 110, 173901-1 – 173901-5 (2013).
[16] Farmahini-Farahani, M. and Mosallaei, H., “Birefringent Reflectarray Metasurface for Beam Engineering in Infrared,” Optics Letters 38(4), 462-464 (2013).
[17] Sun, S., Yang, K-Y., Wang, C-M., Juan, T-K., Chen, W. T., Liao, C. Y., He, Q., Xiao, S., Kung, W-T., Guo, G-Y., Zhou, L., and Tsai, D. P., “High-Efficiency Broadband Anomalous Reflection by Gradient Metasurfaces,” Nano Letters 12(12), 6223-6229 (2012).
[18] Li, Z., Palacios, E., Butun, S., and Aydin, K., “Visible-Frequency Metasurfaces for Broadband Anomalous Reflection and High-Efficiency Spectrum Splitting,” Nano Letters 15(3), 1615-1621 (2015).
[19] Shi, H., Li, J., Zhang, A., Jiang, Y., Wang, J., Xu, Z., and Xia, S., “Gradient Metasurface with Both Polarization-Controlled Directional Surface Wave Coupling and Anomalous Reflection,” IEEE Antennas and Wireless Propagation Letters 14, 104-107 (2015).
[20] Belardini, A., Pannone, F., Leahu, G., Larciprete, M. C., Centini, M., Sibilia, C., Martella, C., Giordano, M., Chiappe, D., and Buatier de Mongeot, F., “Asymmetric Transmission and Anomalous Refraction in Metal Nanowires Metasurface,” Journal of the European Optical Society 7, 12051-1 – 12051-5 (2012).
[21] Wei, Z., Cao, Y., Su, X., Gong, Z., Long, Y., and Li, H., “Highly Efficient Beam Steering with a Transparent Metasurface,” Optics Express 12(9), 10739-10745 (2013).
[22] Ali, T., Popescu, A-S., Bendoym, I., Bikorimana, S., Dorinsville, R., Marchese, L., Bergeron, A., Terroux, M., Golovin, A. B., and Crouse, D. T., “Non-Mechanical Beam Steering with a Dynamic Lithography of Tunable Metasurface,” Systems, Applications and Technology Conference (LISAT), Farmingdale, NY (2014).
[23] Veysi, M., Guclu, C., Boyraz, O., and Capolino, F., “Infrared Polarizing Reflectarray Metasurface,” Antennas and Propagation Society International Symposium (APSURSI), Memphis, TN (2014).
[24] Yu, N., Aieta, F., Genevet, P., Kats, M. A., Gaburro, Z., and Capasso, F., “A Broadband, Background-Free Quarter-Wave Plate Based on Plasmonic Metasurfaces,” Nano Letters 12(12), 6328-6333 (2012).
[25] Yang, Y., Wang, W., Moitra, P., Kravchenko, I. I., Briggs, D. P., and Valentine, J., “Dielectric Meta-Reflectarray for Broadband Linear Polarization Conversion and Optical Vortex Generation,” Nano Letters 14(14), 1394-1399 (2014).
[26] Yu, N., Genevet, P., Kats, M. A., Aieta, F., Tetienne, J-P., Capasso, F., and Gaburro, A., “Light Propagation with Phase Discontinuities: Generalized Laws of Reflection and Refraction,” Science Magazine 334, 333-337 (2011).
[27] Huang, J., and Encinar, J. A., [Reflectarray Antennas], John Wiley and Sons, New Jersey, 1-6 (2007). [28] Bhattacharyya, A., [Phased Array Antennas: Floquet Analysis, Synthesis, BFNs, and Active Array Systems],
John Wiley and Sons, New York, 312-325 (2006). [29] Pozar, D. M., Targonski, D., and Syrigos, H. D., “Design of Millimeter Wave Microstrip Reflectarrays,” IEEE
Transactions on Antennas and Propagation 45(2), 287-296 (1997).

[30] Lenin, N., and Rao, P. H., “Evaluation of the Reflected Phase of a Patch Using Waveguide Simulator for Reflectarray Design,” Microwave and Optical Technology Letters 45(6), 528-531 (2005).
[31] Encinar, J.A., “Analysis, Design and Applications of Reflectarrays,” VI Iberian Meeting on Computational Electromagnetism, Chiclana, es (2008).
[32] ANSYS HFSS, <http://www.ansys.com/>. [33] Fekedulegn, D., MacSiurtain, M. P., and Colbert, J. J., “Parameter Estimation of Nonlinear Growth Models in
Forestry,” Silva Fennica 33(4), 327-336 (1999). [34] Acevedo, M. A., Marcano, M., Fletcher Jr., R. J., “A Diffusive Logistic Growth Model to Describe Forest
Recovery,” Ecological Modeling 244, 13-19 (2012). [35] Yin, X., Goudriaan, J., Lantinga, E. A., Vos, J., and Spiertz, H. J., A Flexible Sigmoid Function of Determinate
Growth,” Annals of Botany 91, 361-371 (2003). [36] Koya, P. R. and Goshu, A. T., “Generalized Mathematical Model for Biological Growths,” Open Journal of
Modeling and Simulation 1(4), 42-53 (2013). [37] Forys, U., and Marciniak-Czochra, A., “Logistic Equations in Tumor Growth Modeling,” Int. J. Appl. Math.
Comp. Sci. 13(3), 317-325 (2003). [38] Enz, R., “The S-Curve Relation Between Per-Capita Income and Insurance Penetration,” The Geneva Papers on
Risk and Insurance 25(3), 396-406 (2000).