Phase Behavior of Liquids - KSU
17
Properties of Reservoir Fluids ( PGE 362 ) Phase Behavior of Liquids BY DR. MOHAMMED A. KHAMIS 8-3-2015
Transcript of Phase Behavior of Liquids - KSU

Properties of Reservoir Fluids (PGE 362)
Phase Behavior of LiquidsBY
DR. MOHAMMED A. KHAMIS8-3-2015
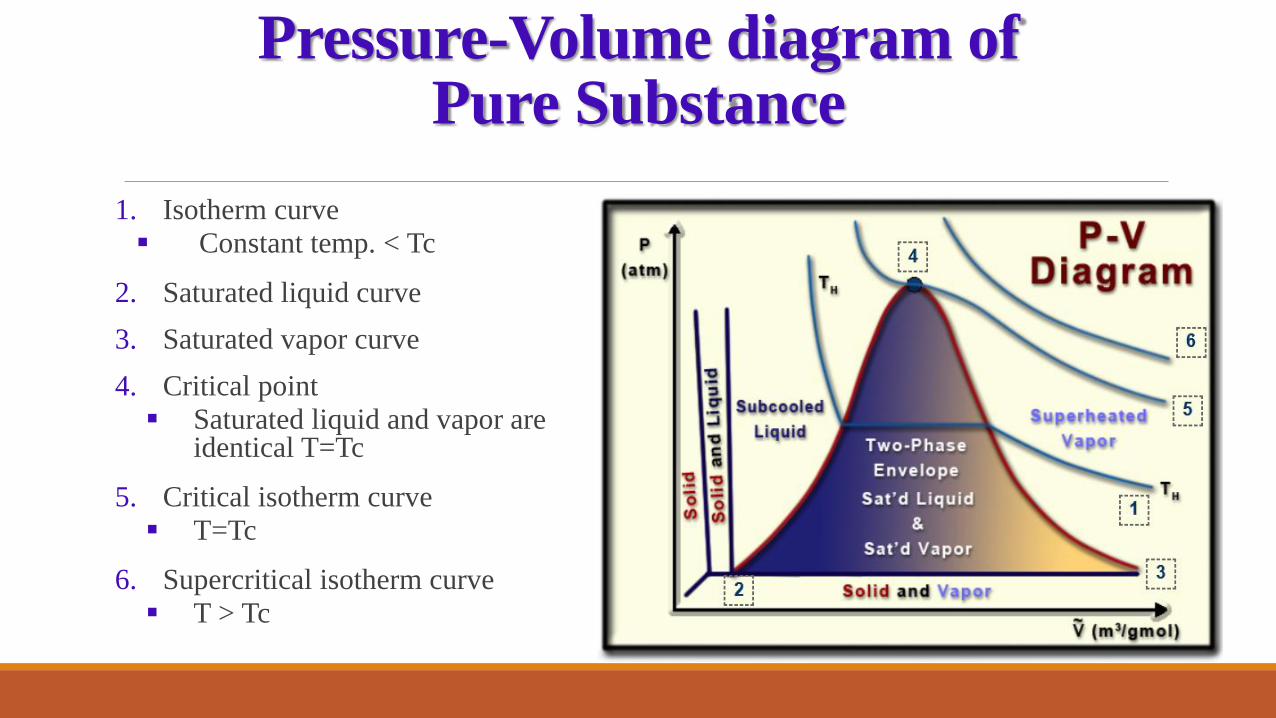
Pressure-Volume diagram ofPure Substance
1. Isotherm curve
Constant temp. < Tc
2. Saturated liquid curve
3. Saturated vapor curve
4. Critical point
Saturated liquid and vapor are identical T=Tc
5. Critical isotherm curve
T=Tc
6. Supercritical isotherm curve
T > Tc

Pressure-Volume diagram ofTwo Component System
1. Vapor phase
2. Liquid phase
3. Two phase region1. Different from “isotherm of pure
substance”

Pressure-Volume diagram ofTwo Component System
1. At dew pointa. Composition of the vapor = composition
of the system.
b. Infinitesimal (tiny) amount of liquid that condense is richer in the less volatile component.
2. At bubble pointa. Infinitesimal amount of vapor remaining
is richer in the more volatile component than the system as a whole.

Pressure-Volume diagram ofTwo Component System
1. Isotherm curves (n-pentane 52 w-% , n-heptane system)
2. Critical point?a. The vapor can exist at P > Pc
b. Liquid can exist at T > Tc.

Pressure-Temperature diagram ofTwo Component System

Pressure-Temperature diagram ofTwo Component System
1. AC: Bubble point
2. BC: Dew point
3. C: Critical point
4. L: Cricondenbar (Pcb)?
• Cricondenbar temperature (Tcb).
5. N: Cricondentherm (Tct)?
• Cricondertherm pressure (Pct).

Pressure-Temperature diagram ofTwo Component System
Retrograde phenomenon:
D-E: isothermal retrograde vaporization.
E-D: isothermal retrograde condensation
H-G: isobaric retrograde condensation
G-H: isobaric retrograde vaporization

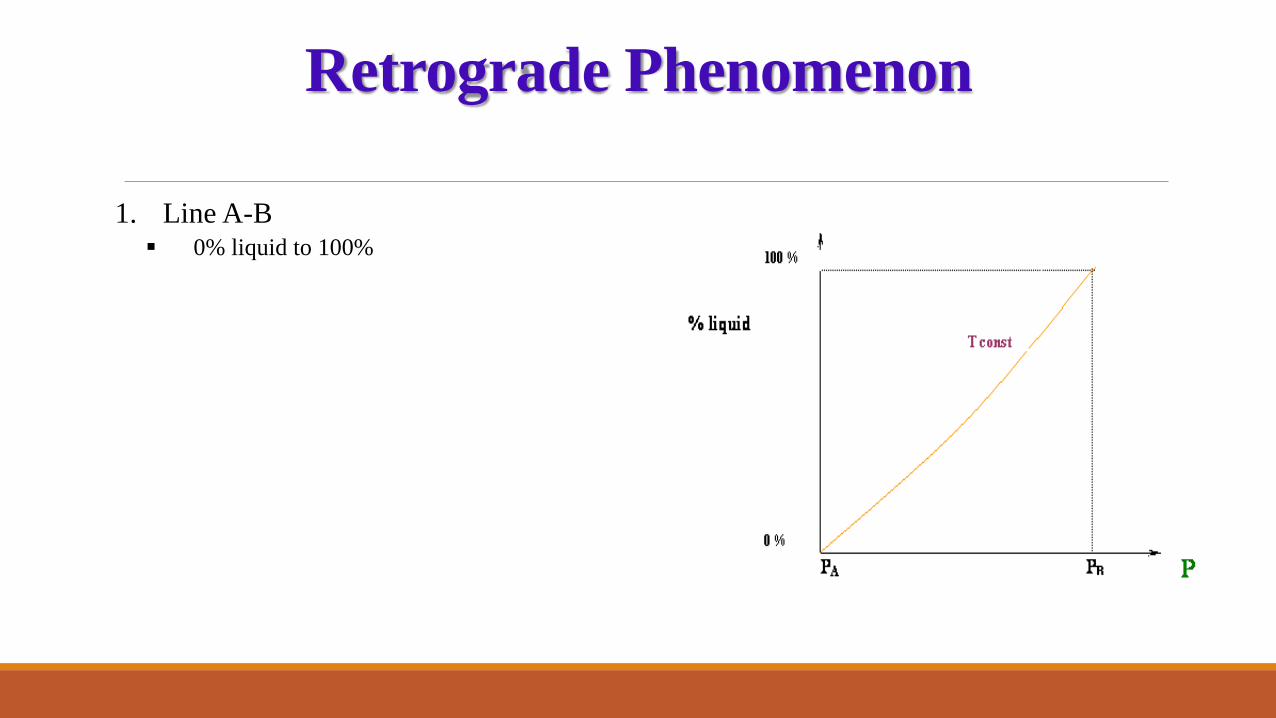
Retrograde Phenomenon
Pc
Pcc
Tc
Tcc

Retrograde Phenomenon
1. Line A-B @ T1 (T1 <Tc)
2. Line C-C’-D @ T2 (T2 >Tc)
Retrograde Phenomenon
1. Line A-B 0% liquid to 100%

Retrograde Phenomenon
2. Line C-C’-D 0% liquid to Max. Yield

The Composite P-T diagram ofmethane & ethane
1. Eight mixtures of methane-ethane
2. Vapor pressure lines of pure methaneand pure ethane.
3. Critical pressure of the mixtures lieabove the critical pressures of thepure components.
4. Critical temperature?
5. The effect of the mixtures similaritiesor dissimilarities on the critical locuscurve?

The Composite P-T diagram ofn-paraffin mixtures
1. The critical pressures of mixtures arehigher tan those of the components ofthe mixtures
2. Higher difference in molecular size ofthe components cause the mixtures tohave very large critical pressures.

Examples
1. Gas condensate

Examples
2. Oil

Examples
3. Three reservoir types