PHARMENA - Initiating Coverage · (PLNm) 185.58 Market cap. (EURm) 43.70 52-weeks range PLN 25.33 /...
35
PHARMENA S.A. (PHR) is a leading Polish cosmetics and biotech company. It was founded in 2002 by Polish scientists from the Medical and Technical Universities in Lodz in order to commercialize their discovery of the active substance 1-MNA. PHR owns 85 patents for all oral and dermatological applications of 1-MNA in Europe, North America and Asia, which are valid until 2025/26. PHR’s main area of activity are dermocosmetics, where the company generates EBITDA margins of >20%. PHR is market leader in Poland when it comes to unit sales of hair care products and is expanding abroad (especially to the Middle East and Asia). New 1-MNA-based products, on which the company is working, include a dietary supplement and drug, which target the segment of dyslipidemia. While the dietary supplement received a positive opinion by the London-based Food Standards Agency (FSA) on 7 October and is expected to be approved for sale in the EU in Q1/16, the 1-MNA drug (also called TRIA-662) completed Phase II of research on 30 October. So far, clinical studies have shown that the drug may be as effective in improving cholesterol levels as similar therapies especially niacins, however does not cause serious side effects e.g. flushing, skin burning. While the global market for dermocosmestics is worth >USD 20bn, the segment of dietary supplements is valued at >USD 100bn and is expected to grow at a CAGR of 6-7% in the near future. The global market for drugs against dyslipidemia is forecast to grow by 9.4% on average to USD 37.9bn in 2023E. All major drugs against dyslipidemia will soon be without patent protection. Thus, we are optimistic that PHR will find a buyer for its 1-MNA drug if results of Phase II in Q1/16 are positive. Our 12-months fair value for PHR’s shares of PLN 32 is based on a Sum-of-the-Parts model, whereby we have valued the dermocosmetics & dietary supplements segment with a DCF (PLN 10.66) and the 1-MNA drug with a NAV (PLN 18.28). We see two main growth triggers in the area of dermocosmetics and dietary supplements: (1) introduction of new products and (2) expansion of the distribution network especially in the Middle East and Asia. If results of Phase II are positive, we forecast that the total cash flow from sale of the drug will reach >USD 250m. in PLNm 2009 2010 2011 2012 2013 2014 Net sales 6.38 7.70 7.40 9.13 14.14 14.13 EBITDA 0.65 0.05 -2.29 -2.87 -1.19 -3.60 EBIT 0.52 -0.07 -2.41 -3.01 -1.34 -3.79 Net income 0.77 0.12 -2.90 -4.10 -2.84 -4.09 EPS 0.12 0.02 -0.46 -0.58 -0.32 -0.46 DPS 0.00 0.01 0.05 0.10 0.11 0.11 Dividend yield 0.00% 0.05% 0.24% 0.47% 0.52% 0.52% RoE 4.83% 0.77% -23.74% -46.93% -21.04% -26.25% Net gearing -54.00% -19.98% -33.68% -34.12% -60.68% -30.37% EV/Sales 29.38x 24.33x 25.34x 20.53x 13.26x 13.27x EV/EBITDA 288.86x 3537.34x neg neg neg neg P/E 175.83x 1055.00x neg neg neg neg Company profile PHARMENA is a leading Polish cosmetics and biotech company. Its products contain the 1-MNA substance, for which PHR has secured patent protection on the most important global markets until 2025/26. Website www.pharmena.com.pl Sector Biotechnology Country Poland ISIN PLPHRMN00011 Reuters PHR.WA Bloomberg PHR PW Share information Last price 21.10 Number of shares (m) 8.80 Market cap. (PLNm) 185.58 Market cap. (EURm) 43.70 52-weeks range PLN 25.33 / PLN 7.14 Average volume 1,423 Performance 4-weeks 7.93% 13-weeks 15.93% 26-weeks 14.67% 52-weeks 118.43% YTD 107.07% Shareholder structure Pelion S.A. 45.89% Jerzy Gebicki 9.73% KI Polskiej Farmacji Sp. z o.o. 6.91% Konrad Palka 6.29% Max Welt Holdings Ltd. 5.29% Robert Bozyk 5.01% Free float 20.88% Financial calendar Q4/15 results (exp.) February 15, 2016 Analyst Adrian Kowollik [email protected] PHARMENA S.A. Fair value: PLN 32 Initiating Coverage Rating: n.a.
Transcript of PHARMENA - Initiating Coverage · (PLNm) 185.58 Market cap. (EURm) 43.70 52-weeks range PLN 25.33 /...

PHARMENA S.A. (PHR) is a leading Polish cosmetics and biotech
company. It was founded in 2002 by Polish scientists from the Medical and Technical Universities in Lodz in order to commercialize
their discovery of the active substance 1-MNA. PHR owns 85 patents for
all oral and dermatological applications of 1-MNA in Europe, North America and Asia, which are valid until 2025/26.
PHR’s main area of activity are dermocosmetics, where the company
generates EBITDA margins of >20%. PHR is market leader in Poland when it comes to unit sales of hair care products and is expanding abroad
(especially to the Middle East and Asia). New 1-MNA-based products, on which the company is working, include a dietary supplement and drug, which target
the segment of dyslipidemia. While the dietary supplement received a positive
opinion by the London-based Food Standards Agency (FSA) on 7 October and is expected to be approved for sale in the EU in Q1/16, the 1-MNA drug (also
called TRIA-662) completed Phase II of research on 30 October. So far, clinical studies have shown that the drug may be as effective in improving cholesterol
levels as similar therapies especially niacins, however does not cause serious
side effects e.g. flushing, skin burning.
While the global market for dermocosmestics is worth >USD 20bn,
the segment of dietary supplements is valued at >USD 100bn and is
expected to grow at a CAGR of 6-7% in the near future. The global market for drugs against dyslipidemia is forecast to grow by 9.4% on
average to USD 37.9bn in 2023E. All major drugs against dyslipidemia will soon be without patent protection. Thus, we are optimistic that PHR will find a
buyer for its 1-MNA drug if results of Phase II in Q1/16 are positive.
Our 12-months fair value for PHR’s shares of PLN 32 is based on a Sum-of-the-Parts model, whereby we have valued the
dermocosmetics & dietary supplements segment with a DCF (PLN
10.66) and the 1-MNA drug with a NAV (PLN 18.28). We see two main growth triggers in the area of dermocosmetics and dietary supplements: (1)
introduction of new products and (2) expansion of the distribution network especially in the Middle East and Asia. If results of Phase II are positive, we
forecast that the total cash flow from sale of the drug will reach >USD 250m.
in PLNm 2009 2010 2011 2012 2013 2014
Net sales 6.38 7.70 7.40 9.13 14.14 14.13
EBITDA 0.65 0.05 -2.29 -2.87 -1.19 -3.60
EBIT 0.52 -0.07 -2.41 -3.01 -1.34 -3.79
Net income 0.77 0.12 -2.90 -4.10 -2.84 -4.09
EPS 0.12 0.02 -0.46 -0.58 -0.32 -0.46
DPS 0.00 0.01 0.05 0.10 0.11 0.11
Dividend yield 0.00% 0.05% 0.24% 0.47% 0.52% 0.52%
RoE 4.83% 0.77% -23.74% -46.93% -21.04% -26.25%
Net gearing -54.00% -19.98% -33.68% -34.12% -60.68% -30.37%
EV/Sales 29.38x 24.33x 25.34x 20.53x 13.26x 13.27x
EV/EBITDA 288.86x 3537.34x neg neg neg neg
P/E 175.83x 1055.00x neg neg neg neg
Company profile
PHARMENA is a leading Polish cosmetics
and biotech company. Its products contain
the 1-MNA substance, for which PHR has
secured patent protection on the most
important global markets until 2025/26.
Website www.pharmena.com.pl
Sector Biotechnology
Country Poland
ISIN PLPHRMN00011
Reuters PHR.WA
Bloomberg PHR PW
Share information
Last price 21.10
Number of shares (m) 8.80
Market cap. (PLNm) 185.58
Market cap. (EURm) 43.70
52-weeks range PLN 25.33 / PLN 7.14
Average volume 1,423
Performance
4-weeks 7.93%
13-weeks 15.93%
26-weeks 14.67%
52-weeks 118.43%
YTD 107.07%
Shareholder structure
Pelion S.A. 45.89%
Jerzy Gebicki 9.73%
KI Polskiej Farmacji Sp. z o.o. 6.91%
Konrad Palka 6.29%
Max Welt Holdings Ltd. 5.29%
Robert Bozyk 5.01%
Free float 20.88%
Financial calendar
Q4/15 results (exp.) February 15, 2016
Analyst
Adrian Kowollik
PHARMENA S.A.
Fair value: PLN 32 Initiating Coverage
Rating: n.a.

PHARMENA S.A. | Initiating Coverage | November 2015
1
Content
Investment Case ......................................................................................................... 2
Valuation ..................................................................................................................... 4
Recent results ........................................................................................................... 10
Financial forecasts .................................................................................................... 11
Business description ................................................................................................. 13
Market environment ................................................................................................. 23
Profit and loss statement ......................................................................................... 29
Balance Sheet ........................................................................................................... 30
Cash Flow Statement ................................................................................................ 31
Financial ratios ......................................................................................................... 32
Disclaimer ................................................................................................................. 33

PHARMENA S.A. | Initiating Coverage | November 2015
2
Investment Case
PHARMENA S.A. (PHR) is a leading Polish cosmetics and biotech company. It was
founded in 2002 by scientists from the Technical and Medical Universities in Lodz in
order to commercialize their discovery of the active substance 1-MNA (a niacin
metabolite). PHR owns 85 patents for all oral and dermatological applications of 1-MNA
in Europe, North America and Asia, which are valid until 2025/26.
PHARMENA’s main business area is the production of dermocosmetics, which is
profitable on all levels. In the Hair Care segment, the company is market leader in
Poland when it comes to unit sales. Other 1-MNA-based products, on which PHR is
working, are a dietary supplement and a drug (called TRIA-662), which both target the
segment of dyslipidemia. The objective of the dietary supplement, which has already
received a positive opinion as novel food from the London-based FSA and will likely be
approved for sale in the EU in Q1/16, is to offset the lack of 1-MNA in the body, which
stimulates the production of prostacycline, and thus reduce the risk of atherosclerosis.
In contrast to niacins, the drug, which completed Phase II of research on 30 October
2015, aims to lower triglycerides and increase good cholesterol, but with no serious side
effects e.g. flushing, skin burning.
The global market dermocosmetics is estimated at >USD 20bn. In Poland, it is worth
PLN 1.2bn and is expected to grow at a CAGR 14-20E of 7.1%. The segment for dietary
supplements is worth >USD 100bn worldwide and forecast to increase at a CAGR of 6-
7%. By 2023E, the global market for dyslipidemia drugs is forecast to grow at a CAGR of
9.4% to USD 37.9bn. As all major drugs in the segment will soon loose patent
protection, global pharma companies are keen to buy new innovative therapies. Thus,
we expect that if results of Phase II in Q1/16 are positive, PHR will quickly find a buyer
for its 1-MNA drug.
In 9M/15, PHR’s dermocosmetics business generated revenues of PLN 12.5m (+25.4%
y-o-y), however EBITDA increased only by 13.7% y-o-y to PLN 2.8m due to investments
in marketing. The 1-MNA drug and dietary supplement contributed an EBITDA of PLN
-3.6m (9M/14: PLN -5m). For full-year 2015, we expect that PHR will generate sales
from dermocosmetics of PLN 16.7m at an EBITDA margin of 23%. For 2016E, we
forecast total sales of PLN 26.6m, thereof PLN 5.3m from the 1-MNA dietary
supplement. After high launch costs in 2016E, we believe that the dietary supplement
will generate EBITDA margins of >25% in the long run.
Our 12-months fair value for PHR’ shares of PLN 32 is based on a Sum-of-the-Parts
model. While we have valued dermocosmetics & dietary supplements with PLN 10.66
per share, the NAV-based fair value of the 1-MNA drug is PLN 18.28. We expect that the
main growth driver in the segment of dermocosmetics will be the planned introduction
of 50 new products by 2017E and stronger diversification of sales channels especially in
the Middle East and Asia, where PHR recently signed first distribution agreements with
local partners. We reckon that the total cash flow from sale of the drug will be >USD
250m. In our view, PHR could receive 19.4% of the proceeds immediately after signing,
with the rest payable upon reaching certain milestones e.g. registration in US and EU.

PHARMENA S.A. | Initiating Coverage | November 2015
3
SWOT Analysis
Strengths Weaknesses
- Pharmena is a leading Polish cosmetics and biotech com- - Pharmena is financially too weak to be able to commercia-
pany; its products are the only ones on the market with the lize its drug alone
1-MNA substance - PHR is listed in the illiquid and intransparent NewConnect
- Patents in Europe, North America and Asia, which are valid segment
until 2025/26; they cover all oral and dermocosmetical - In 2015, the five largest distributors accounted for 94.1%
applications of 1-MNA of the company's sales; all revenues stemmed from Poland
- In October 2015, PHR's dietary supplement received a posi- - As until 2010 Pharmena had co-shareholders at Cortria
tive opinion as novel food by FSA and its drug completed Corp. (Domain Associated, MVM Science), it will have to
Phase II of research pay them c. 9% (EVRe) of all cash flows from the sale
- PHR is a leader on the Polish market for dermocosmetic of its 1-MNA drug
Hair Care products in terms of volumes sold; the high-qua- - Pharmena does not directly control the manufacturing
lity products are offered at attractive prices process of its products; moreover, the Group outsources
- Flexible cost structure; c. 65% of costs are variable auditing, logistics, warehousing and R&D
Opportunities Threats
- According to articles in the prestigious Nature Chemical Bio- - Unsatisfactory results from Phase II of drug research
logy magazine from 2013, 1-MNA supplementation can play - Risks relating to disruptions of the production process
a major role in prolonging human lives - Risks relating to protection of patents and intellectual
- The global dermocosmetics market is estimated at >USD property rights
20bn; in PL, it is expected to grow at a CAGR 14-20E of - Competition in the area of dermocosmetics and dietary
7.1% to PLN 1.8bn; by 2017E, PHR plans to introduce 50 supplements
new dermocosmetic products and diversify its distribution - Change of regulations
channels both in Poland and abroad - Loss of key employees
- The global market for dietary supplements is estimated at
>USD 100bn and forecast to grow at a CAGR of 6-7%; in
Poland, it is forecast to increase at a CAGR of 6.8% to PLN
5bn in 2020E
- The global market for dyslipidemia is expected to grow at
a CAGR of 9.4% to USD 37.9bn in 2023E; all major drugs
against dyslipidemia will soon be without patent protection
- Significant dividends to shareholders if the 1-MNA drug
was to be sold to one of the "BIG PHARMA" companies; this
will likely happen if results of Phase II research are positive

PHARMENA S.A. | Initiating Coverage | November 2015
4
Valuation
Our 12-months fair value for PHARMENA’s shares of PLN 32 is based on a Sum-of-the-Parts.
Due to the characteristics of the company’s business model we have not accounted for a
peer group in our valuation.
DCF model (Dermocosmetics & dietary supplements) in PLNm 2015E 2016E 2017E 2018E 2019E 2020E 2021E 2022E 2023E
Net sales 16.68 26.60 34.90 40.35 46.77 53.60 58.45 62.80 67.49
(y-o-y change) 18.0% 59.5% 31.2% 15.6% 15.9% 14.6% 9.1% 7.4% 7.5%
EBIT 3.62 3.89 7.47 9.14 11.42 13.02 14.12 15.09 16.13
(EBIT margin) 21.7% 14.6% 21.4% 22.6% 24.4% 24.3% 24.2% 24.0% 23.9%
NOPLAT 2.93 3.15 6.05 7.40 9.25 10.55 11.44 12.22 13.06
+ Depreciation & amortisation 0.22 0.35 0.45 0.52 0.61 0.70 0.76 0.82 0.88
= Net operating cash flow 3.15 3.50 6.50 7.93 9.86 11.24 12.20 13.04 13.94
- Total investments (Capex and WC) -1.73 -2.71 -3.52 -4.05 -4.68 -5.35 -5.83 -6.25 -6.71
Capital expenditure -0.32 -0.45 -0.55 -0.62 -0.71 -0.80 -0.86 -0.92 -0.98
Working capital -1.42 -2.26 -2.97 -3.43 -3.98 -4.56 -4.97 -5.34 -5.74
= Free cash flow (FCF) 1.41 0.79 2.98 3.87 5.18 5.89 6.37 6.78 7.23
PV of FCF's 1.40 0.71 2.41 2.83 3.43 3.53 3.45 3.32 3.20
PV of FCFs in explicit period 24.28
PV of FCFs in terminal period 71.39
Enterprise value (EV) 95.68
+ Net cash / - net debt (PHR excl. Cortria) -1.88
Shareholder value 93.80
Number of shares outstanding (m) 8.80 Terminal EBIT margin
WACC 10.5% 20.9% 21.9% 22.9% 23.9% 24.9% 25.9% 26.9%
Cost of equity 10.5% 6.5% 25.62 26.81 28.01 29.20 30.40 31.59 32.79
Pre-tax cost of debt 8.0% 7.5% 19.30 20.16 21.03 21.89 22.75 23.62 24.48
Normal tax rate 19.0% 8.5% 15.29 15.95 16.61 17.26 17.92 18.58 19.24
After-tax cost of debt 6.5% 9.5% 12.54 13.06 13.57 11.79 14.61 15.12 15.64
Share of equity 100.0% 10.5% 10.54 10.96 11.37 11.79 12.20 12.62 13.04
Share of debt 0.0% 11.5% 9.03 9.37 9.71 10.05 10.39 10.73 11.07
Fair value per share in PLN (today) 10.66 12.5% 7.84 8.13 8.41 8.69 8.98 9.26 9.55
Fair value per share in PLN (in 12 months) 11.79
WA
CC
Source: East Value Research GmbH
NAV model (1-MNA drug)
We have estimated the value of drug 1-MNA (TRIA-662), which completed Phase II of
research on 30 October 2015, with the NPV method, which accounts for project-related
CAPEX in 2015 and 2016E of USD 1.5m and USD 0.5m respectively. Based on the
IMAP/Industry Report 2011, we have assumed there is a 43.3% chance that results of Phase
II, which will be published in Q1/16, will be positive. If this is the case, we believe that with
a 70% probability PHR will sell the 1-MNA drug already in 2016E as all similar drugs will soon
be without patent protection and global pharma companies are looking for new promising
therapies.
We have conservatively estimated that PHR will sell the drug for in total USD 250m, which is
less than half of the median value of benchmark deals (USD 523m) between 2009 and 2015.
We have assumed that the company will receive 19.4% of the total sum as initial payment
and the rest if certain milestones are reached. The probabilities of the milestones are based
on IMAP/Industry Report 2011.
PHARMENA S.A. | Initiating Coverage | November 2015
5
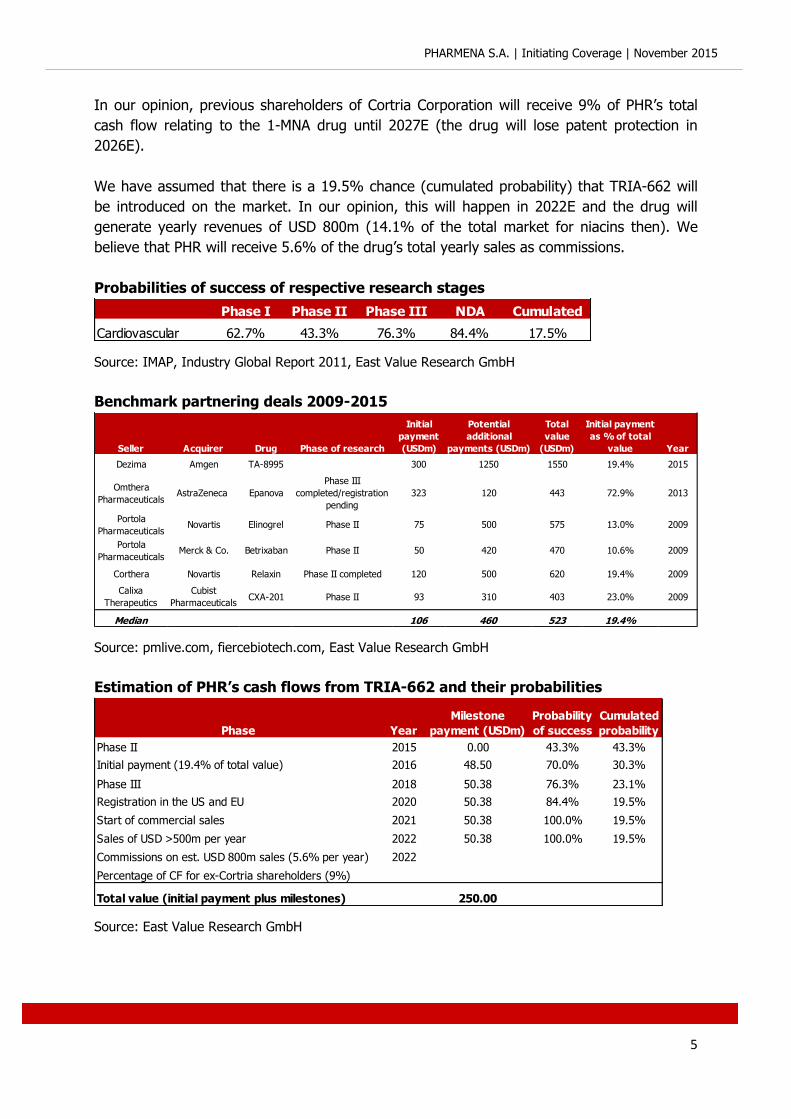
In our opinion, previous shareholders of Cortria Corporation will receive 9% of PHR’s total
cash flow relating to the 1-MNA drug until 2027E (the drug will lose patent protection in
2026E).
We have assumed that there is a 19.5% chance (cumulated probability) that TRIA-662 will
be introduced on the market. In our opinion, this will happen in 2022E and the drug will
generate yearly revenues of USD 800m (14.1% of the total market for niacins then). We
believe that PHR will receive 5.6% of the drug’s total yearly sales as commissions.
Probabilities of success of respective research stages
Phase I Phase II Phase III NDA Cumulated
Cardiovascular 62.7% 43.3% 76.3% 84.4% 17.5%
Source: IMAP, Industry Global Report 2011, East Value Research GmbH
Benchmark partnering deals 2009-2015
Seller Acquirer Drug Phase of research
Initial
payment
(USDm)
Potential
additional
payments (USDm)
Total
value
(USDm)
Initial payment
as % of total
value Year
Dezima Amgen TA-8995 300 1250 1550 19.4% 2015
Omthera
PharmaceuticalsAstraZeneca Epanova
Phase III
completed/registration
pending
323 120 443 72.9% 2013
Portola
PharmaceuticalsNovartis Elinogrel Phase II 75 500 575 13.0% 2009
Portola
PharmaceuticalsMerck & Co. Betrixaban Phase II 50 420 470 10.6% 2009
Corthera Novartis Relaxin Phase II completed 120 500 620 19.4% 2009
Calixa
Therapeutics
Cubist
PharmaceuticalsCXA-201 Phase II 93 310 403 23.0% 2009
Median 106 460 523 19.4%
Source: pmlive.com, fiercebiotech.com, East Value Research GmbH
Estimation of PHR’s cash flows from TRIA-662 and their probabilities
Phase Year
Milestone
payment (USDm)
Probability
of success
Cumulated
probability
Phase II 2015 0.00 43.3% 43.3%
Initial payment (19.4% of total value) 2016 48.50 70.0% 30.3%
Phase III 2018 50.38 76.3% 23.1%
Registration in the US and EU 2020 50.38 84.4% 19.5%
Start of commercial sales 2021 50.38 100.0% 19.5%
Sales of USD >500m per year 2022 50.38 100.0% 19.5%
Commissions on est. USD 800m sales (5.6% per year) 2022
Percentage of CF for ex-Cortria shareholders (9%)
Total value (initial payment plus milestones) 250.00
Source: East Value Research GmbH

PHARMENA S.A. | Initiating Coverage | November 2015
6
NPV model of TRIA-662
2015E 2016E 2017E 2018E 2019E 2020E 2021E 2022E 2023E 2024E 2025E 2026E 2027E
CF before probabilities, investments and taxes (USDm) 0.00 48.50 0.00 50.38 0.00 50.38 50.38 95.18 44.80 44.80 44.80 44.80 44.80
CF accounting for probabilities (USDm) 0.00 14.70 0.00 11.65 0.00 9.83 9.83 18.58 8.74 8.74 8.74 8.74 8.74
9% share in CF for ex-Cortria shareholders (USDm) 0.00 -1.32 0.00 -1.05 0.00 -0.88 -0.88 -1.67 -0.79 -0.79 -0.79 -0.79 -0.79
CF accounting for probabilities and payments to ex-
Cortria shareholders (USDm)0.00 13.38 0.00 10.60 0.00 8.95 8.95 16.91 7.96 7.96 7.96 7.96 7.96
Investments in the 1-MNA project (USDm) -1.50 -0.50 0.00 0.00 0.00 0.00 0.00 0.00 0.00 0.00 0.00 0.00 0.00
CF after accounting for probabilities, payments to ex-
Cortria shareholders and investments (USDm)-1.50 12.88 0.00 10.60 0.00 8.95 8.95 16.91 7.96 7.96 7.96 7.96 7.96
PLN-USD rate 3.93 3.93 3.93 3.93 3.93 3.93 3.93 3.93 3.93 3.93 3.93 3.93 3.93
CF accounting for probabilities, payments to ex-Cortria
shareholders and investments (PLNm)-5.89 50.61 0.00 41.66 0.00 35.16 35.16 66.44 31.27 31.27 31.27 31.27 31.27
Tax rate 0.0% 19.0% 19.0% 19.0% 19.0% 19.0% 19.0% 19.0% 19.0% 19.0% 19.0% 19.0% 19.0%
CF accounting for probabilities, payments to ex-Cortria
shareholders, investments and taxes (PLNm)-5.89 40.99 0.00 33.75 0.00 28.48 28.48 53.81 25.33 25.33 25.33 25.33 25.33
Discount factor 1.01 1.12 1.24 1.37 1.51 1.67 1.85 2.04 2.26 2.49 2.76 3.05 3.37
Discounted CF accounting for probabilities, payments to
ex-Cortria shareholders, investments and taxes (PLNm)-5.83 36.65 0.00 24.69 0.00 17.05 15.43 26.37 11.23 10.16 9.19 8.31 7.52
NPV (PLN m) 160.78
Number of PHR's shares 8.80
NPV per share (PLN) 18.28
Source: East Value Research GmbH
Sum-of-the-Parts calculation
Sum-of-the-Parts Fair value
Dermocosmetics and dietary supplements 10.66
1-MNA drug / TRIA-662 18.28
Implied equity value per share (today) 28.95
In 12-months (PV * (1+WACC)) 32.00
Source: East Value Research GmbH
Peer Group Analysis
We have created two peer groups: One with manufacturers of pharmaceuticals and/or
dietary supplements and one with producers of cosmetics:
Drugs and dietary supplements:
(1) Neptune Technologies & Bioressources Inc.: Neptune, which is based in Laval/Canada, is
a pioneer in the research, development and commercialization of natural omega-3
phospholipid products, derived from marine biomass, for the nutraceutical and
pharmaceutical markets. Its subsidiaries, Acasti Pharma Inc. and NeuroBioPharm Inc.
operate in the medical food and pharmaceutical markets focusing on the treatment of
cardiometabolic and neurological conditions respectively. In fiscal-year 2014/15,
Neptune generated revenues of CAD 15.1m.
(2) Perrigo Company PLC: Perrigo Company, which is headquartered in Dublin/Ireland, is a
healthcare supplier that develops, manufactures and distributes OTC and generic
prescription pharmaceuticals, infant formulas, nutritional products, animal health, dietary
supplements, active pharmaceutical ingredients and medical diagnostic products.
Moreover, the company receives royalties from multiple sclerosis drug Tysabri. In fiscal-
year 2014/15, Perrigo generated revenues of USD 4.6bn.

PHARMENA S.A. | Initiating Coverage | November 2015
7
(3) Abbott Laboratories Inc.: Abbott, which is based in Abbott Park/US, is a global
healthcare company. In 2014, it generated revenues of USD 20.2bn, thereof 34%
stemmed from nutritional and 15% from established pharmaceutical products. Its drugs
against dyslipidemia are Tricor, Niaspan and Advicor.
(4) Merck & Co Inc.: Merck, which is based in Kenilworth/US, offers health solutions through
its prescription medicines, vaccines, biologic therapies and animal health products. In
2014, it generated revenues of USD 42.2bn. The company’s three drugs for reduction of
bad (LDL) cholesterol are Zocor, Zetia and Vytorin (combination of Zocor and Zetia in a
single tablet).
(5) Pfizer Inc.: Pfizer, which is headquartered in New York/US, offers medicines and
vaccines as well as many well-known consumer healthcare products. Its drug Lipitor is
the most successful drug for lowering bad cholesterol to date. In 2014, Pfizer had
revenues of USD 49.6bn.
(6) Bristol-Myers Squibb Corp.: BMS, which is based in New York/US, is engaged in the
discovery, development, licensing, manufacturing, marketing, distribution and sale of
biopharmaceutical. Its anti-atherosclerosis drug is Pravachol. In 2014, BMS generated
total sales of USD 15.9bn, thereof 86% stemmed from pharmaceuticals and 14% from
nutritionals.
(7) AstraZeneca PLC: AstraZeneca, which is headquartered in London/UK, discovers,
develops and commercializes biopharmaceuticals. Its drug for managing cholesterol
levels is Crestor. In 2014, AstraZeneca had revenues of USD 26.1bn.
(8) Amgen Inc.: Amgen, which is based in Thousand Oaks/US, is a biotechnology company.
In 2014, it had revenues of USD 20.1bn. Amgen’s primary drug against bad cholesterol
(LDL) is Repatha. Moreover, in September 2015 it bought Dutch company Dezima,
which owns the midstage drug TA-8995, an oral CETP (Cholesterylester Transfer
Protein) inhibitor that has shown the ability to slash LDL by up to 48%, while
simultaneously boosting HDL (good cholesterol). Amgen will pay Dezima USD 300m
upfront and min. USD 1.25bn in milestones depending on the registration and
commercialization progress of the drug.

PHARMENA S.A. | Initiating Coverage | November 2015
8
EBITDA margin Net gearing P/BVPS
Company 2015E 2016E 2015E 2016E 2015E 2016E 2014 Latest Latest
Neptune Technol. & Bioress. Inc. (USD) 6.74x 3.46x n.a 11.27x n.a 39.00x n.a 23.40% 2.35x
Perrigo Company PLC (USD) 5.05x 4.39x 16.35x 13.96x 87.56x 26.47x 24.10% 45.21% 2.09x
Abbott Laboratories Inc. (USD) 3.34x 3.18x 13.51x 12.44x 21.11x 20.68x 21.30% 8.91% 3.16x
Merck & Co Inc. (USD) 4.16x 4.06x 8.07x 7.99x 30.89x 20.86x 53.30% 32.18% 3.29x
Pfizer Inc. (USD) 4.59x 4.18x 10.02x 9.49x 22.56x 16.52x 40.70% 27.76% 3.04x
Bristol-Myers Squibb Inc. (USD) 6.83x 6.51x 27.06x 23.46x 52.04x 53.22x 28.60% 13.63% 7.27x
AstraZeneca PLC (GBP) 2.52x 2.61x 7.42x 7.59x 19.93x 18.12x 29.90% 36.83% 3.17x
Amgen Inc. (USD) 5.52x 5.36x 10.62x 9.73x 18.78x 17.34x 43.20% 2.29% 4.25x
Median 4.82x 4.12x 10.62x 10.50x 22.56x 20.77x 29.90% 25.58% 3.17x
P/EEV/Sales EV/EBITDA
Source: Thomson Reuters Eikon, East Value Research GmbH
Dermocosmetics:
(9) Beiersdorf AG: Beiersdorf, which is based in Hamburg/Germany, manufactures cosmetic
products. It operates under the brands NIVEA, Eucerin, Labello, La Prairie, Hansaplast,
Florena, 8x4, tesa, atrix and SLEK. In 2014, Beiersdorf generated revenues of EUR
6.3bn.
(10) L’Oreal SA: L’Oreal, which is based in Clichy/France, is a cosmetics company. Its
Professional Products division offers beauty products used and sold in hair salons. The
Consumer Products division offers products sold in mass-market retail channels. L'Oreal
Luxe division offers products sold in selective retail outlets e.g. department stores,
perfumeries, the Group's own boutiques and certain online stores. Active Cosmetics
division offers products for borderline complexions, while the Body Shop unit offers
natural cosmetics and toiletry products. In 2014, L’Oreal generated total sales of EUR
22.5bn.
L’Oreal’s subsidiary Vichy, a premium brand of skincare, bodycare, make-up and anti-
aging products, owns the product line Dercos, which is No 1 on the Polish market for
hair care dermocosmetics in terms of revenues.
(11) Estee Lauder Companies Inc.: Estee Lauder, which is based in New York/US, is a
manufacturer and marketer of skin care, makeup, fragrance and hair care products. The
company’s products are sold in over 150 countries under such brand names as Estee
Lauder, Aramis, Clinique, Origins, Le Labo, M.A.C, Bobbi Brown, La Mer and Aveda. It is
also the global licensee for fragrances and/or cosmetics sold under e.g. Tommy Hilfiger,
Donna Karan, Michael Kors, Tom Ford and Coach. In fiscal-year 2014/15, Estee Lauder
had revenues of USD 10.8bn.
(12) Shiseido Co Ltd.: Shiseido, which is based in Chuo-Ku/Japan, is engaged in the
manufacture and sale of cosmetics, toiletries, beauty products, health foods, beauty
foods and pharmaceuticals. In fiscal-year 2014/15, Shiseido had total sales of JPY
777.7bn.

PHARMENA S.A. | Initiating Coverage | November 2015
9
(13) Procter & Gamble Corp.: Procter & Gamble, which is headquartered in Cincinnati/US,
provides consumer packaged goods, which are sold in over 180 countries. It operates in
five segments: Beauty, Grooming, Health Care, Fabric Care and Home Care as well as
Baby Feminine and Family Care. In fiscal-year 2014/15, Procter & Gamble generated
revenues of USD 76.3bn.
(14) Coty Inc.: Coty, which is based in New York/US, manufactures and markets beauty
products in the Fragrances, Color Cosmetics and Skin & Body Care segments with
distribution in over 130 countries. In fiscal-year 2014/15, it had revenues of USD 4.4bn.
(15) Aflofarm Farmacja Polska Sp. z.o.o: Aflofarm, which is based in Pabianice, is a privately-
owned Polish manufacturer of pharmaceuticals, dietary supplements and cosmetics. Its
label DX2 is No 3 on the Polish market for hair care dermocosmetics.
(16) ZIAJA Ltd Zaklad Produkcji Lekow sp. z o.o: ZIAJA is a privately-owned Polish
manufacturer of dermocosmetics with headquarters in Gdansk. It was founded in 1989.
Apart from Poland, its products are available in 12 European countries, selected Asian
markets and Chile.
EBITDA margin Net gearing P/BVPS
Company 2015E 2016E 2015E 2016E 2015E 2016E 2014 Latest Latest
Beiersdorf AG (EUR) 2.76x 2.66x 16.76x 15.70x 31.35x 28.98x 16.70% -39.87% 4.99x
L'Oreal SA (EUR) 3.82x 3.67x 18.01x 17.05x 27.76x 25.85x 20.10% 6.10% 4.12x
Estee Lauder Comp. Inc. (USD) 2.78x 2.62x 14.27x 13.00x 25.78x 22.75x 18.70% 28.61% 8.68x
Shiseido Co Ltd. (JPY) 1.46x 1.25x 15.68x 13.11x 79.99x 39.30x 11.50% -2.03% 2.81x
Procter & Gamble Inc. (USD) 3.38x 3.28x 13.00x 12.33x 20.13x 16.66x 20.90% 31.49% 3.28x
Coty Inc. (USD) 2.72x 2.63x 14.74x 13.56x 27.07x 26.93x 19.60% 283.56% 10.52x
Median 2.77x 2.64x 15.21x 13.33x 27.42x 26.39x 19.15% 17.35% 4.56x
P/EEV/Sales EV/EBITDA
Source: Thomson Reuters Eikon, East Value Research GmbH

PHARMENA S.A. | Initiating Coverage | November 2015
10
Recent results
Revenues and Profitability
In 9M/15, PHARMENA generated consolidated revenues of PLN 12.6m compared to PLN 10m
last year, which corresponded to a growth rate of 25.4% y-o-y. The reason were significantly
higher sales of Dermena and Allerco product lines, especially due to promotional campaigns
in pharmacies. Moreover, in August 2015 PHR extended its co-operation with the drugstore
chain Rossmann, which will sell Dermena products in 1,050 stores Poland-wide in the future
(instead of 214 before).
Consolidated results of PHARMENA
in PLNm 9M/15 9M/14
change
(%)
Net sales 12.55 10.01 25.4%
EBITDA -0.74 -2.48 -70.3%
EBITDA margin -5.9% -24.8%
EBIT -0.89 -2.61 -65.8%
EBIT margin -7.1% -26.1%
Net income -1.50 -2.89 -48.2%
Net margin -11.9% -28.9%
Source: Company information, East Value Research GmbH
Results of PHR’s dermocosmetics segment
in PLNm 9M/15 9M/14
change
(%)
Net sales 12.54 10.01 25.4%
EBITDA 2.82 2.48 13.7%
EBITDA margin 22.5% 24.8%
EBIT 2.68 2.36 13.6%
EBIT margin 21.4% 23.6%
Source: Company information, East Value Research GmbH
Although the share of distribution costs (50.3% vs. 47.5% in 9M/14) increased strongly due
to promotional campaigns and preparations of new products, which will be introduced on the
market in Q4/15, PHR’s EBIT and net income improved significantly y-o-y. The main reason
were lower costs relating to the 1-MNA drug and dietary supplement.

PHARMENA S.A. | Initiating Coverage | November 2015
11
Balance sheet and Cash flow
At the end of September 2015, PHARMENA had consolidated equity of PLN 10.8m (60.6%
ratio). Fixed assets equaled PLN 0.2m (30/09/2014: PLN 0.2m), while intangible assets
amounted to PLN 0.8m (PLN 0.7m). We estimate that working capital was worth PLN 8.3m
(PLN 8.2m). As of 30 September 2015, PHARMENA had interest-bearing debt of PLN 4m
(PLN 2m).
Between January and September 2015, PHARMENA generated an operating cash flow of PLN
-1.3m compared to PLN -5.2m in 9M/14. The main reason for the improvement were
significantly lower investments in working capital (PLN -0.6m vs. PLN -2.8m in 9M/14). While
cash flow from investing was PLN -0.1m (9M/14: PLN -0.1m), cash flow from financing
amounted to PLN 1.7m (PLN 0.8m) as the company raised new debt. In 9M/15, PHARMENA’s
consolidated cash position increased by PLN 0.3m to PLN 5.5m.
Financial forecasts
Revenues and Profitability
We have calculated detailed revenue and EBITDA estimates for PHARMENA’s segments “Hair
Care”, “Skin Care” and “Dietary supplement 1-MNA”.
Hair Care: For the Hair Care segment, which also includes sales of the dietary supplement
Dermena Complex against hair loss (based on vitamins; does not contain 1-MNA), we have
assumed that in full-year 2015 PHARMENA will sell 682k packages at an average price of
PLN 22, which should remain stable in the future. By 2023E, the segment’s revenues should
increase at a CAGR of 12.9% and generate EBITDA margins of >25%. While sales in Poland
should continue to develop well due to strong brand recognition of PHR’s cosmetics, we
believe that PHR will strongly increase its exports. In September and October 2015, the
company signed new contracts with partners in the United Arab Emirates, Oman, Kuwait and
South Korea.
Skin Care: In case of the Skin Care segment, we have forecast that PHARMENA will sell 76k
packages at an average price of PLN 22 in full-year 2015. In the following years, the
segment should however grow at a higher CAGR than Hair Care of 13.5%, which is due to
the planned introduction of 50 new products in 2016E and 2017E and increasing export
sales. Like in case of the Hair Care segment, we estimate that the EBITDA margin will
remain at >25% in the future.

PHARMENA S.A. | Initiating Coverage | November 2015
12
Dietary supplement 1-MNA: We have assumed first sales of the new dietary supplement in
2016E (150k packages at PLN 35 on average), however believe that the EBITDA margin will
be significantly negative in that year due to costs relating to launch of production. In our
view, PHARMENA will target the product at clients in Poland and abroad from the start. In
the following years, the number of sold packages should increase at a CAGR of 25.2% and
constant prices, resulting in revenues in 2023E of PLN 25.3m. We have forecast that in the
long run the dietary supplement will generate an EBITDA margin of >25%.
in PLNm 2015E 2016E 2017E 2018E
Hair Care 15.00 19.21 22.66 25.38
(% of net sales) 90.0% 72.2% 64.9% 62.9%
Number of packages sold per year 682,000 872,960 1,030,093 1,153,704
Average price in PLN 22 22 22 22
EBITDA margin 23.0% 26.0% 25.9% 25.7%
Skin Care 1.67 2.14 2.53 2.83
(% of net sales) 10.0% 8.0% 7.2% 7.0%
Number of packages sold per year 76,000 97,280 114,790 128,565
Average price in PLN 22 22 22 22
EBITDA margin 23.0% 26.0% 25.9% 25.7%
Dietary supplement 1-MNA 0.00 5.25 9.71 12.14
(% of net sales) 0.0% 19.7% 27.8% 30.1%
Number of packages sold per year 0 150,000 277,500 346,875
Average price in PLN 35 35 35 35
EBITDA margin 0.0% -25.0% 14.5% 19.8%
Total net sales 16.68 26.60 34.90 40.35
(change y-o-y) 18.0% 59.5% 31.2% 15.6%
Source: East Value Research GmbH
in PLNm Q1/13 Q2/13 Q3/13 Q4/13 2013
Net sales 3.13 3.83 3.79 3.39 14.14
y-o-y change 51.9% 93.2% 48.6% 33.6% 54.9%
EBITDA -0.10 -0.57 0.19 -0.70 -1.19
EBITDA margin -3.3% -15.0% 5.0% -20.5% -8.4%
EBIT -0.14 -0.61 0.15 -0.74 -1.34
EBIT margin -4.6% -16.0% 3.9% -21.7% -9.5%
Net income -0.48 -0.81 -0.41 -1.15 -2.84
Net margin -15.2% -21.2% -10.9% -33.8% -20.1%
in PLNm Q1/14 Q2/14 Q3/14 Q4/14 2014 Q1/15 Q2/15 Q3/15
Net sales 3.96 2.58 3.47 4.12 14.13 4.03 3.81 4.72
y-o-y change 26.4% -32.5% -8.5% 21.6% -0.1% 1.7% 47.6% 35.8%
EBITDA -1.33 -0.80 -0.35 -1.12 -3.60 -0.52 -0.42 0.20
EBITDA margin -33.6% -30.9% -10.1% -27.3% -25.5% -12.9% -10.9% 4.2%
EBIT -1.37 -0.84 -0.40 -1.17 -3.79 -0.57 -0.46 0.14
EBIT margin -34.6% -32.7% -11.5% -28.4% -26.8% -14.1% -12.1% 2.9%
Net income -1.59 -1.05 -0.26 -1.19 -4.09 -0.69 -0.72 -0.09
Net margin -40.1% -40.6% -7.5% -29.0% -28.9% -17.1% -19.0% -1.9%
Source: Company information (consolidated figures), East Value Research GmbH

PHARMENA S.A. | Initiating Coverage | November 2015
13
CAPEX and Working capital
We have assumed that in the dermocosmetics and dietary supplement business PHARMENA
will have a yearly net CAPEX of PLN 100k in the future. In our view, the company will invest
8.5% of its annual sales in working capital.
Business description
PHARMENA S.A., which is based in Lodz, is a leading Polish cosmetics and biotech company.
The company concentrates on research and commercialization of innovative
dermocosmetics, dietary supplements and anti-atherosclerotic drug, which contain the
physiological and natural active substance 1-MNA (1-metylonikotynamid). 1-MNA, which is
mainly produced in the liver, is a metabolite and chemical equivalent of niacin. It is anti-
inflammatory and also stimulates the production of endogenous prostacyclin, which prevents
among others strokes. PHARMENA owns 85 patents in Europe, North America and Asia,
which are valid until 2025/26. The company has been listed in the NewConnect segment of
the Warsaw Stock Exchange since 2008.
Currently, PHARMENA employs 21 people, thereof 13 sales representatives and 8 office
clerks. The company subcontracts most activities e.g. production, warehousing, logistics and
accounting to external entities, which is why most of its operating costs are variable.
Organizational structure
PHARMENA S.A. –
Dermocosmetics & dietary supplements
CORTRIA CORPORATION (100%) –
In charge of commercialisation of an innovative 1-MNA drug against
atheriosclerosis
Source: Company information, East Value Research GmbH

PHARMENA S.A. | Initiating Coverage | November 2015
14
Company history
2002: Foundation of PHARMENA Sp. z.o.o by scientists from the Technical and Medical
Universities in Lodz. Based on a license agreement, the company receives an
exclusive right for commercialization of products.
2003: PHARMENA introduces first products on the Polish market: Dermena shampoo, the
curing-easing skin gel Thermi and the gel against acne Accos.
Polska Grupa Farmaceutyczna S.A. acquires 47% of the shares in PHARMENA for PLN
1m, which allows the company to initiate export sales to selected Eastern markets in
2004.
2005: Acquisition of patents and patent applications from the Technical University in Lodz
relating to the application of 1-MNA in dermatology.
PHARMENA establishes Pharmena North America Inc. (now Cortria Corporation) with
headquarter in Boston, which is supposed to conduct clinical studies in the US and
Canada.
Introduction of a new product line called Allerco for sensitive skin.
2006: PHARMENA introduces new products under the brands Dermena, Accos and Allerco.
2007: Initiation of clinical studies in the US and Canada on the anti-atherosclerotic drug 1-
MNA.
2008: PHARMENA becomes a joint-stock company. The company conducts an IPO in the
NewConnect segment of the Warsaw Stock Exchange, which is accompanied by a
capital increase of PLN 13.6m (524.3k new shares at PLN 26 per share). The
proceeds are used for R&D activities relating to the 1-MNA drug.
2009: Patent for the 1-MNA drug in Russia and Mexico.
2010: Patent for the 1-MNA drug in Canada, Australia and China.
2011: Patent for the 1-MNA drug in Europe and the US.
Determination of specific aspects of functioning of the substance 1-MNA and
estimation of doses for further studies.
Signing of a consulting agreement with Torreya Partners (Top 5 consultant worldwide
in the pharma industry) for commercialization of 1-MNA drug.
2012: Patent for the 1-MNA drug in Japan. Start of co-operation with the drugstore chains
Rossmann and Hebe.
Market introduction of the dietary supplement Dermena Complex, which limits the
fallout of hair.

PHARMENA S.A. | Initiating Coverage | November 2015
15
Issuance of 781k new shares at PLN 6.50 per share (PLN 5.1m).
2013: Issuance of 1.8m new shares at PLN 7.50 per share (PLN 13.2m).
Application for authorization of 1-MNA as a novel food at the FSA in London.
FSA asks for additional 90 days of toxicological research on animals. It also requests
additional information on the impact of the supplement on the niacin metabolism.
2014: Start of co-operation with the pharmacy chains Dr. Max (101 pharmacies in Poland),
Mediq Apteka (190 own pharmacies, 79 franchised ones), Ziko Apteka (40 drugstores
and pharmacies) and Euro-Apteka (65 pharmacies).
Completion of 90-day toxicological research on animals. The final report shows a very
good tolerance and safety of the 1-MNA supplement.
2015: ACNFP asks PHARMENA for an additional risk analysis of the 1-MNA supplement
relating to its impact on the niacin metabolism. PHARMENA amends the application
form as requested.
1-MNA is being officially authorized as a novel food.
Signing of a framework agreement with a distributor in Monaco for production of
dermocosmetics under the distributor’s brand. First order with realization date in
September amounts to EUR 86.8k.
Successful completion of Phase II studies on the 1-MNA drug. A final report is
expected in Q1/16.
Business segments
Hair Care: This segment comprises the results of the Dermena product line including the
dietary supplement Dermena Complex, which target customers with excessive fallout of hair
and dandruff. In 2014, it generated revenues of PLN 12.8m (90.4% of PHR’s total sales).
Below is a description of the different Dermena products:

PHARMENA S.A. | Initiating Coverage | November 2015
16
Dermena
Product line comprises a shampoo, gel and conditioner. They strengthen hair bellows, limit
psiosis and stimulate the recovery of hair.
Dermena Plus
The product is for treatment of excessive hair fallout with dandruff. It
contains (1) pirokton olamine, which positively affects microflora
balance of epidermis and protects against excessive development of
dandruff and (2) 1-MNA, which strengthens hair bellows and improves
their nourishing.
Dermena Complex
Dietary supplement in the form of capsules with substances that
are responsible for proper hair growth as well as healthy
appearance of skin and nails.
Dermena Lash
T

PHARMENA S.A. | Initiating Coverage | November 2015
17
The conditioner with 1-MNA slows down the fallout of eyebrows/lashes and improves the
nutrition of the hair bellow. It strengthens eyebrows/lashes and improves their condition,
thus is recommended e.g. after a completed chemotherapy. The conditioner is
complemented by mascara dermena lash, which also contains 1-MNA and can be used by
women with sensitive eyes and contact lenses.
Dermena Repair
Product for dry and destroyed hair, which tends to fall out. The
shampoo strengthens, moisturizes and regenerates the hair. It is also
recommended after a completed chemotherapy.
Dermena Men
The product targets men, who have weak hair and suffer from excessive hair fallout. It is
especially recommended if there are first signs of men-typical baldness. Dermena Men
comprises active ingredients (H-VIT and 1-MNA), which limit the miniaturization of the hair
bellow due to DHT (dihydrotestosteronu).
Skin Care: This segment comprises the results of the product lines Allerco, Dermena
Seboline, Thermi and Dermena Vitaline, which are targeted at customers with skin problems.
In 2014, it accounted for 9.6% of PHR’s total sales or PLN 1.4m.
Allerco
For dry, sensitive skin, which is prone to irritation; does
not contain any odoriferous substances and artificial
dyes; product line consists of emollient creme (a
greasing and moisturizing one), body lotion, shampoo,
washing gel, washing cube and bath emulsion.
.

PHARMENA S.A. | Initiating Coverage | November 2015
18
Dermena Seboline
The product line Dermena Seboline comprises a gel against acne, washing liquid, clearing
tonic, creme and washing cube; it was developed as a reaction to issues relating to greasy
and mixed skin, which is prone to acne.
Thermi
Curing-easing gel for skin, which is exposed to thermic and solar
irritations; 1-MNA component protects against arising initiations,
reduces rubefaction and regenerates epidermis.
Dermena Vitaline
Innovative treatment against wrinkles for +40 years olds; it comprises a revitalizing day
creme, regenerating night creme and an eye creme.

PHARMENA S.A. | Initiating Coverage | November 2015
19
Dietary supplement 1-MNA: The 1-MNA is a dietary supplement with the ability to impact
heart and dish risk biomarkers. Moreover, it is able to stimulate the production of
endogenous prostacyclin, whose lack increases the risk of atherosclerosis. Scientific research
has shown that the concentration of endogenous prostacyclin in the human organism
decreases with age. The 1-MNA dietary supplement can be sold independently or support
other anti-atherosclerotic therapies.
In May 2013, PHARMENA filed for EU-wide registration of its 1-MNA dietary supplement as a
novel food at the Food Standards Agency (FSA) in London. The objective was to prove the
safety of the 1-MNA dietary supplement in proposed dosis. On 7 October 2015, the company
announced that the FSA and ACNFP (Advisory Committee on Novel Foods and Processes)
were going to issue a positive opinion for 1-MNA as novel food. After receiving the final
authorization by the EU, which we expect in Q1/16, PHARMENA will start selling its product.
In foreign markets, it will work with licensed contractors, who will sell the dietary
supplement themselves and distribute it under PHARMENA’s brand. The patents, which
PHARMENA owns for its dietary supplement in Europe and USA, are valid until 2025/26.
1-MNA drug: In 2007, PHARMENA initiated research on a new drug against dyslipidemia
(abnormal amount of lipids e.g. good cholesterol (High-Density Lipoprotein) and/or fat in the
blood), which causes atherosclerosis (walls in arteries that carry blood). PHR’s drug targets
especially two types of dyslipidemia called hypertryglicerides and mixed hyperlipidemia.
Currently, the main types of drugs against dyslipidemia are statins, ezetimibes, fibrants and
niacins.
So far, PHARMENA has spent USD 17.7m on the drug, however these investments also
resulted in the development of the 1-MNA dietary supplement. PHR decided to conduct the
research through its US-subsidiary Cortria Corporation as North America is the largest and
most important market for the pharma industry worldwide. Cortria Corporation (previously
Pharmena North America Inc.) was founded by PHR in 2005. Until 2010, when it decided to
increase its stake from previously 22.3% to 100% in the subsidiary in order to secure all the
rights associated with the 1-MNA drug project, the company had co-shareholders in Cortria
(Domain Associates and MVM Life Sciences). As part of the deal, the parties agreed that
PHARMENA will pay a one-off fee of USD 1.3m plus a certain percentage of future milestones
and royalties from the sale or licensing of the 1-MNA drug to a strategic investor.

PHARMENA S.A. | Initiating Coverage | November 2015
20
The objective of the clinical research on the 1-MNA drug (also called TRIA-662) is to prove
that it increases good (High-Density Lipoproteins) cholesterol and reduces triglycerides with
no side effect. Results of clinical trials with animals have shown that PHARMENA’s 1-MNA
drug affects cardiovascular risk biomarkers and due to its ability to stimulate the production
of endogenous prostacyclin (PGI2) shows anti-thrombotic effects, enhances endothelial
functional and protects against gastric injury. Moreover, in contrast to drugs, which contain
niacin, it does not lead to skin rubefaction and burn (so-called “flushing”).
On 30 October 2015, PHARMENA announced the successful completion of Phase II of
research on its 1-MNA drug (so-called “Proof of concept”). The study took almost two years
and was monitored by the leading clinical center in Canada Montreal Heart Institute. It was
conducted in 17 hospitals throughout North America and included 64 patients. Each patient
received pre-determined doses of the 1-MNA drug three times a day for 14 weeks. The
objective of the study was to analyze certain parameters relating to lipidemia (e.g. HDL and
LDL cholesterol, triglycerides) and safety of the drug (e.g. level of glucose, results of the
electro-cardiogram). We expect the publication of results of the Phase II study in Q1/16.
After that, PHARMENA’s management plan to present them to all the largest pharma
companies worldwide as it is too small to be able to complete the registration and
commercialization of the drug alone.
Period Phase of research on 1-MNA drug
2005-2007 Initiation of research with 270mg dosis
2006-2008 Completion of clinical studies on animals
2007-2010Successful completion of Phase I; Phase II was not successful as it
did not show any difference between 1-MNA and placebo
2010-2012 Initiation of research with 1000mg dosis
2011-2013 Completion of clinical studies on animals
2012-2014 Successful completion of Phase I and bioavailability study (describes
the speed and level of absorption of healing substance by general
circulation after one-time application. 20 patients and two trial
groups: 1-MNA vs. niacin)
2013-Oct 2015 Phase II research
Source: Company information, East Value Research GmbH

PHARMENA S.A. | Initiating Coverage | November 2015
21
Production
PHARMENA outsources production to external partners. With regard to the manufacturing of
the 1-MNA substance, it co-operates with IFOTAM Sp. z o.o. in Lodz and Pabianickie Zakłady
Farmaceutyczne Polfa S.A. in Pabianice. Its dermocosmetics are produced by Laboratorium
Galenowe Olsztyn Sp. z o.o. in Dywity, Betasoap Sp. z o.o. in Warsaw and Capitol Sp. z o.o.
in Lodz, while the dietary supplement Dermena Complex is manufactured e.g. by Master
Pharm Polska Sp. z o.o. in Lodz. The ready-for-sale products are stored at warehouses of
Pharmalink Sp. z o.o. in Lodz. PHARMENA owns the rights relating to the products as well as
the manufacturing process.
Distribution
In Poland, PHARMENA distributes its products through pharma wholesalers (PGF, Farmacol,
Neuca, Slawex, Lubfarm etc.), pharmacy chains (DOZ, Super Pharm, Dr. Max Polska, Mediq
Apteka, Euro-Apteka, Ziko Apteka) and drugstores (Rossmann, Hebe). The five largest
pharma wholesalers still account for >90% of the company’s domestic sales, which is risky in
our view. However, PHARMENA plans to diversify its distribution channels by concentrating
especially on drugstores.
In foreign markets, management’s strategy is based on two pillars: (1) the co-operation with
local partners, who are in charge of marketing and distribution of PHR’s products on an
exclusive basis, and/or (2) licensing production and distribution to specialized companies.
Distribution structure in 2014
PGF;
40.5%
Neuca;
33.4%
Farmacol;
16.2%
Slawex;
3.9%
Others;
6.0%
Source: Company information, East Value Research GmbH
PHARMENA S.A. | Initiating Coverage | November 2015
22
Management
Konrad Palka (CEO): Mr Palka has been CEO and Managing Director of Pharmena since the
company’s inception in 2002. He is also CEO of the company’s subsidiary Cortria Corporation.
Previously, Mr Palka worked as Sales Director at the mutual fund company Skarbiec TFI and
pension fund manager PTE DOM. He was also Branch Manager Private Banking at
Creditanstalt Securities (now Unicredit Group). Mr Palka graduated with a Master’s degree in
Finance and Banking from the University in Lodz.
Marzena Wieczorkowska (Vice President of the Management Board): Mrs Wieczorkowska
has been with Pharmena since the company’s foundation in 2002. Before 2008, when she
was promoted to Vice President of the Board, she was Member of the Board and Director of
R&D. From 1998 to 2003, she was a researcher at the Inter-departmental Institute for
Radiation Technology of the Technical University in Lodz. She graduated with a Master’s
degree in Chemistry and also owns a PhD.
Anna Zwolinska (Vice President of the Management Board): Mrs Zwolinska has been with
Pharmena since 2005, first in the R&D department. From 2008, she worked in the sales &
marketing department and in 2010 was promoted to Director. Between 1998 and 2004, she
was researcher and lecturer at the Institute for General and Ecological Chemistry of the
Technical University in Lodz. She graduated with a Master’s degree in Chemistry and also
owns a PhD.

PHARMENA S.A. | Initiating Coverage | November 2015
23
Market environment
The market for dermocosmetics
According to Research and Markets, the global cosmetic market was worth USD 460bn in
2014 and is estimated to reach USD 675bn by 2020E (CAGR 14-20E of 6.4%). Asia/Pacific
region accounted for 35% of the market followed by Western Europe and North America. It
is also expected to grow the fastest in the future due to the fact that Asian customers are
very beauty conscious. According to Statista.com, the segments Skin Care and Hair Care
accounted for 58.6% of the market in 2014.
Dermocosmetics are an expanding area of the global beauty market according to L’Oreal.
Between 1998 and 2013, they have doubled their share from 2.2% to 4.4%, with Western
Europe accounting for 60% of its total value. The largest markets for dermocosmetics are
France, Italy, Germany and Spain, however countries such as Brazil and China are becoming
increasingly important. Pharmacies and parapharmacies are a key distribution channel for
dermocosmetics in Western Europe accounting for 25% of all skincare products sold. In the
US, Brazil or China, drugstores, shopping malls and department stores play a much more
important role.
In Poland, the market for dermocosmetics is estimated at PLN 1.2bn or c. 8% of the total
cosmetics market, which is one of the most dynamic in Europe. Skin Care and Hair Care
products account for c. 35% of the market (Source: Forbes.pl). PMR estimates that the
dermocosmetics market will increase to PLN 1.8bn by 2020E (CAGR of 7.1%). The segment
is growing at a fast pace as dermocosmetics do not contain artificial ingredients, which could
whet skin, have a stronger effect than traditional beauty products and are considered a
much cheaper alternative to esthetic medicine. At the same time, they are becoming more
and more interesting for pharmacies as they generate gross margins of up to 30-40% and
thus offset the negative consequences of the Polish drug refund law. According to PMR, sales
of dermocosmetics are subject to seasonality effects, with the highest occurring in the
summer months and shortly before Christmas.

PHARMENA S.A. | Initiating Coverage | November 2015
24
Share in the Hair segment in Poland in H1/15 (units sold – left / revenues – right)
Dermena;27.0%
Dercos (Vichy);
9.0%DX2 (Aflofarm);
18.0%
Others;46.0%
Dermena;19.0%
Dercos (Vichy); 27.0%
DX2 (Aflofarm;
13.0%
Others;41.0%
Source: IMS Health, East Value Research GmbH
Top 5 market players in the Skin segment in Poland
L'Oreal;16.2%
Cederroth AB;
7.4%
Avon Products
Inc.;
6.9%
Beiersdorf AG;
6.5%
Dr. Irena Eris S.A.;
5.9%
Source: Euromonitor International 2014, Avon, East Value Research GmbH
The market for dietary supplements
According to the Nutrition Business Journal report, the global nutrition and supplements
market was worth approx. USD 104bn in 2013. Over the last 10-15 years, sales have seen
an unprecedented spike and many new players stepped in. In the coming years, the CAGR of
the segment is expected at 6-7%, with developing markets such as Asia/Pacific and Latin
America growing at an above-average rate. In 2013, functional foods constituted over 30%
of the global nutrition and supplements market. Another major category was natural and
organic food, however there is a shift towards preventative/proactive nutrition and
supplement products e.g. for ageing populations that face a higher risk of chronic disease.

PHARMENA S.A. | Initiating Coverage | November 2015
25
In Poland, PMR expects the market for dietary supplements to grow by 6.6% to PLN 3.6bn in
2015 and at a CAGR of 6.8% until 2020E, when it is forecast to reach PLN 5bn. Due to less
stringent regulations sales in drugstores, shops and department stores are expected to
develop better than those in pharmacies. The main growth drivers should be increasing
incomes and higher consumption.
The global pharmaceuticals market and the segment of dyslipidemia
According to IMS Institute for Healthcare Informatics, the global pharmaceuticals market
(biopharmaceuticals incl. biologics, OTC drugs, traditional medicines) is worth USD 1.1tr in
2015 and is expected to increase at 4-7% y-o-y over the next five years. While the share of
the US and Europe in the global pharma market has been declining in the last years,
emerging markets such as China have become much more important. Also, generic drugs
account for an increasing share in total pharma spending (39% in 2015 vs. 20% in 2005).
Together with overall strong economic growth and governments’ commitment to expand
healthcare access, they are expected to lead to above-average growth in emerging markets
in the future. Oncology, diabetes and respiratory drugs are the three largest therapy areas of
the global pharma market.
Growth of the global pharma market in 2008-2020E
0
200
400
600
800
1000
1200
1400
1600
2008 2013 2015 2018 2020
USD 989bn
USD 1.3tr
USD 795bn
USD 1.1tr
USD 1.4tr
Source: IMS Health, East Value Research GmbH
PHARMENA S.A. | Initiating Coverage | November 2015
26
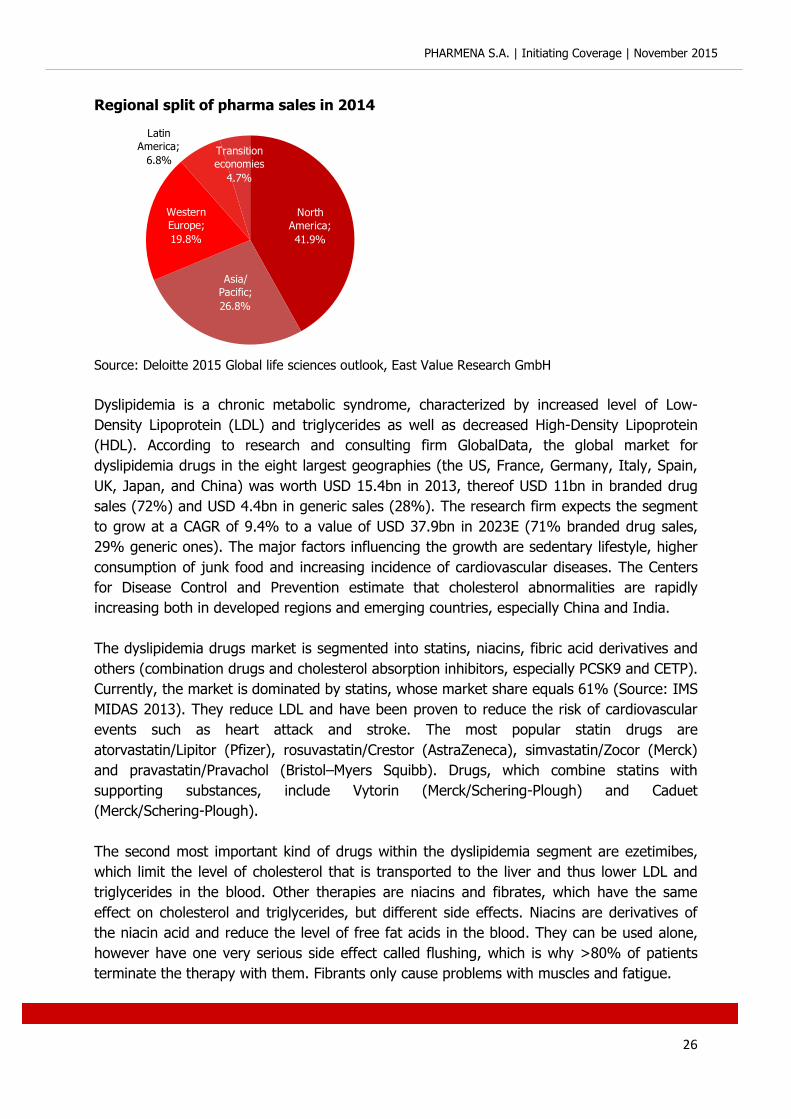
Regional split of pharma sales in 2014
North
America;
41.9%
Asia/
Pacific;
26.8%
Western
Europe;
19.8%
Latin
America;
6.8%Transition
economies
4.7%
Source: Deloitte 2015 Global life sciences outlook, East Value Research GmbH
Dyslipidemia is a chronic metabolic syndrome, characterized by increased level of Low-
Density Lipoprotein (LDL) and triglycerides as well as decreased High-Density Lipoprotein
(HDL). According to research and consulting firm GlobalData, the global market for
dyslipidemia drugs in the eight largest geographies (the US, France, Germany, Italy, Spain,
UK, Japan, and China) was worth USD 15.4bn in 2013, thereof USD 11bn in branded drug
sales (72%) and USD 4.4bn in generic sales (28%). The research firm expects the segment
to grow at a CAGR of 9.4% to a value of USD 37.9bn in 2023E (71% branded drug sales,
29% generic ones). The major factors influencing the growth are sedentary lifestyle, higher
consumption of junk food and increasing incidence of cardiovascular diseases. The Centers
for Disease Control and Prevention estimate that cholesterol abnormalities are rapidly
increasing both in developed regions and emerging countries, especially China and India.
The dyslipidemia drugs market is segmented into statins, niacins, fibric acid derivatives and
others (combination drugs and cholesterol absorption inhibitors, especially PCSK9 and CETP).
Currently, the market is dominated by statins, whose market share equals 61% (Source: IMS
MIDAS 2013). They reduce LDL and have been proven to reduce the risk of cardiovascular
events such as heart attack and stroke. The most popular statin drugs are
atorvastatin/Lipitor (Pfizer), rosuvastatin/Crestor (AstraZeneca), simvastatin/Zocor (Merck)
and pravastatin/Pravachol (Bristol–Myers Squibb). Drugs, which combine statins with
supporting substances, include Vytorin (Merck/Schering-Plough) and Caduet
(Merck/Schering-Plough).
The second most important kind of drugs within the dyslipidemia segment are ezetimibes,
which limit the level of cholesterol that is transported to the liver and thus lower LDL and
triglycerides in the blood. Other therapies are niacins and fibrates, which have the same
effect on cholesterol and triglycerides, but different side effects. Niacins are derivatives of
the niacin acid and reduce the level of free fat acids in the blood. They can be used alone,
however have one very serious side effect called flushing, which is why >80% of patients
terminate the therapy with them. Fibrants only cause problems with muscles and fatigue.

PHARMENA S.A. | Initiating Coverage | November 2015
27
While statins will likely remain the largest therapy area within the dyslipidemia segment, the
most promising therapies according to GlobalData are convertase subtilisin/kexin type 9
(PCSK9) and ester transfer protein (CETP) inhibitors. PCSK9 inhibitors deactivate respective
proteins by reducing the level of LDL cholesterol being transported to the liver and its level in
the blood. There are already two registered drugs, Repatha/Amgen and Praluent/Sanofi-
Aventis, which however can only be injected. CETP inhibitors are still being researched and
are supposed to inhibit cholesterylester transfer protein (CETP), which normally transfers
cholesterol from HDL to Very Low Density or Low Density Lipoproteins (VLDL or LDL) leading
to higher HDL and lower LDL cholesterol. In September 2015, Amgen announced a
significant deal over in total USD 1.55bn with Dutch Dezima Pharma, which works on a CETP
inhibitor called TA-8995. In contrast to Pfizer or Roche, which flopped with their CETP
inhibitors, Dezima’s drug has so far demonstrated the ability to lower both LDL significantly
as well as to increase HDL levels.
Estimated share of therapies against dyslipidemia
Ezetimibes;
16%
Statins;
61%
Fibrants;
8%
Niacins &
others;
15%
Source: IMS MIDAS 2013, East Value Research GmbH

PHARMENA S.A. | Initiating Coverage | November 2015
28
Overview over the most important drugs against dyslipidemia
Drug Manufacturer
Patent
valid
Exclusivity
valid Drug category
Zocor Merck No No Statins
Pravachol Bristol-Myers Squibb No No Statins
Lipitor Pfizer Yes No Statins
Tricor Abbott Laboratories Yes No Fibrates
Crestor AstraZeneca Yes No Statins
Zetia Merck/Schering-Plough Yes No Ezetimibes
Vytorin Merck/Schering-Plough Yes No Ezetimibes & Statins
Niaspan Abbott Laboratories Yes No Niacins
Niacor Upsher-Smith Laboratories No No Niacins
Advicor Abbott Laboratories Yes No Statins & Niacins
Lipofen Cipher Pharms Inc. No No Fibrates
Fenoglide Santarus Inc./Valeant Pharma Yes No Fibrates
Source: FDA Orange Book, company websites, East Value Research GmbH

PHARMENA S.A. | Initiating Coverage | November 2015
29
Profit and loss statement
in PLNm 2009 2010 2011 2012 2013 2014
Net sales 6.38 7.70 7.40 9.13 14.14 14.13
Cost of goods sold -2.02 -2.58 -2.57 -2.84 -4.11 -4.06
Gross profit 4.36 5.13 4.82 6.29 10.03 10.07
Other operating income 0.00 0.00 0.02 0.03 0.02 0.02
Distribution costs -1.25 -2.45 -2.37 -2.40 -5.89 -6.56
Administration costs -2.45 -2.61 -4.74 -6.75 -5.27 -7.04
Other operating expenses -0.01 -0.01 -0.03 -0.04 -0.07 -0.09
EBITDA 0.65 0.05 -2.29 -2.87 -1.19 -3.60
Depreciation & Amortization -0.12 -0.12 -0.12 -0.14 -0.16 -0.18
EBIT 0.52 -0.07 -2.41 -3.01 -1.34 -3.79
Net financial results 0.44 0.26 0.19 -0.18 -0.49 0.84
Write-down of negative goodwill 0.00 0.00 -0.52 -0.52 -0.52 -0.52
EBT 0.97 0.19 -2.74 -3.71 -2.35 -3.46
Income taxes -0.20 -0.07 -0.15 -0.39 -0.50 -0.62
Net income / loss 0.77 0.12 -2.90 -4.10 -2.84 -4.09
EPS 0.12 0.02 -0.46 -0.58 -0.32 -0.46
DPS 0.00 0.01 0.05 0.10 0.11 0.11
Share in total sales
Net sales 100.00 % 100.00 % 100.00 % 100.00 % 100.00 % 100.00 %
Cost of goods sold -31.62 % -33.47 % -34.80 % -31.08 % -29.06 % -28.76 %
Gross profit 68.38 % 66.53 % 65.20 % 68.92 % 70.94 % 71.24 %
Other operating income 0.03 % 0.01 % 0.20 % 0.32 % 0.13 % 0.15 %
Distribution costs -19.64 % -31.81 % -31.97 % -26.33 % -41.66 % -46.44 %
Administration costs -38.48 % -33.88 % -64.01 % -73.95 % -37.30 % -49.81 %
Other operating expenses -0.12 % -0.17 % -0.39 % -0.43 % -0.50 % -0.64 %
EBITDA 10.17 % 0.69 % -30.97 % -31.48 % -8.38 % -25.50 %
Depreciation & Amortization -1.95 % -1.56 % -1.66 % -1.52 % -1.12 % -1.29 %
EBIT 8.22 % -0.87 % -32.63 % -33.00 % -9.51 % -26.79 %
Net financial results 6.94 % 3.33 % 2.51 % -2.00 % -3.44 % 5.92 %
Write-down of negative goodwill 0.00 % 0.00 % -6.98 % -5.65 % -3.65 % -3.65 %
EBT 15.16 % 2.46 % -37.10 % -40.66 % -16.59 % -24.52 %
Income taxes -3.07 % -0.86 % -2.07 % -4.25 % -3.52 % -4.40 %
Net income / loss 12.09 % 1.61 % -39.16 % -44.91 % -20.11 % -28.92 %

PHARMENA S.A. | Initiating Coverage | November 2015
30
Balance Sheet
in PLNm 2009 2010 2011 2012 2013 2014 Assets
Cash and cash equivalents 8.76 3.31 3.00 3.20 11.15 5.22
Inventories 0.92 1.35 1.10 1.40 2.09 2.91
Trade accounts and notes receivables 2.36 2.60 1.89 2.86 3.83 5.28
Other financial assets 0.00 0.00 0.00 0.00 0.00 0.00
Other current assets 0.11 0.38 0.48 0.80 0.76 0.87
Current assets 12.15 7.64 6.47 8.26 17.84 14.27 Property, plant and equipment 0.07 0.15 0.15 0.16 0.11 0.16
Other intangible assets 0.74 0.67 0.63 0.78 0.67 0.73
Goodwill 0.00 0.00 1.89 1.38 0.86 0.34
Long-term financial assets 3.60 7.56 0.05 0.05 0.05 0.05
Other long-term assets 0.50 0.76 0.96 0.90 0.85 1.20
Deferred tax assets 0.04 0.04 0.05 0.07 0.18 0.10
Non-current assets 4.95 9.18 3.72 3.33 2.72 2.59
Total assets 17.09 16.82 10.19 11.59 20.56 16.86
Liabilities
Trade payables 0.38 0.29 0.88 1.64 1.32 1.36
Other liabilities 0.42 0.37 0.57 0.73 0.90 1.09
Short-term financial debt 0.03 0.05 0.05 0.06 0.02 1.00
Pension provisions 0.00 0.00 0.03 0.03 0.16 0.18
Current liabilities 0.82 0.71 1.53 2.47 2.40 3.64
Long-term financial debt 0.01 0.08 0.06 0.04 0.02 0.07
Deferred tax liabilities 0.10 0.12 0.11 0.10 0.09 0.08
Long-term liabilities 0.11 0.20 0.17 0.14 0.11 0.14
Total liabilities 0.93 0.91 1.69 2.61 2.51 3.78
Shareholders equity 16.16 15.91 8.50 8.98 18.05 13.08
Minority interests 0.00 0.00 0.00 0.00 0.00 0.00
Total liabilities and equity 17.09 16.82 10.19 11.59 20.56 16.86

PHARMENA S.A. | Initiating Coverage | November 2015
31
Cash Flow Statement
in PLNm 2009 2010 2011 2012 2013 2014
Net income / loss 0.77 0.12 -2.90 -4.10 -2.84 -4.09
Depreciation 0.12 0.12 0.12 0.14 0.16 0.18
Change of working capital -1.08 -1.05 0.34 -0.50 -1.85 -2.45
Others 0.00 -0.28 0.72 0.41 0.70 0.60
Net operating cash flow -0.18 -1.08 -1.71 -4.05 -3.84 -5.75
Cash flow from investing -2.35 -3.97 -0.05 -0.22 -0.01 -0.09
Free cash flow -2.53 -5.05 -1.76 -4.27 -3.85 -5.84
Cash flow from financing -0.42 -0.40 -0.13 4.48 11.81 -0.09
Change of cash -2.95 -5.45 -1.84 0.06 7.96 -5.72
Cash at the beginning of the period 11.72 8.76 3.31 3.00 3.20 11.15
Cash at the end of the period 8.76 3.31 3.00 3.20 11.15 5.22

PHARMENA S.A. | Initiating Coverage | November 2015
32
Financial ratios
Fiscal year 2009 2010 2011 2012 2013 2014
Profitability and balance sheet quality
Gross margin 68.38% 66.53% 65.20% 68.92% 70.94% 71.24%
EBITDA margin 10.17% 0.69% -30.97% -31.48% -8.38% -25.50%
EBIT margin 8.22% -0.87% -32.63% -33.00% -9.51% -26.79%
Net margin 12.09% 1.61% -39.16% -44.91% -20.11% -28.92%
Return on equity (ROE) 4.83% 0.77% -23.74% -46.93% -21.04% -26.25%
Return on assets (ROA) 1.96% -0.78% -22.83% -35.98% -14.66% -26.31%
Return on capital employed (ROCE) 2.57% -0.27% -29.43% -36.48% -8.97% -33.75%
Net debt (in PLNm) -8.72 -3.18 -2.86 -3.06 -10.95 -3.97
Net gearing -54.00% -19.98% -33.68% -34.12% -60.68% -30.37%
Equity ratio 94.53% 94.57% 83.40% 77.48% 87.81% 77.59%
Current ratio 14.73 10.79 4.24 3.35 7.44 3.93
Quick ratio 13.49 8.35 3.20 2.46 6.26 2.89
Net interest cover -1.19 0.26 12.98 -16.46 -2.77 4.52
Net debt/EBITDA -13.44 -59.96 1.25 1.07 9.24 1.10
Tangible BVPS 2.41 2.37 1.05 1.08 1.95 1.45
CAPEX/Sales -0.78% -1.69% -26.61% 2.34% 3.61% 1.56%
Working capital/Sales 48.39% 57.51% 40.31% 39.32% 37.64% 55.19%
Cash Conversion Cycle (in days) 232 273 125 83 168 275
Trading multiples
EV/Sales 29.38 24.33 25.34 20.53 13.26 13.27
EV/EBITDA 288.86 3537.34 -81.82 -65.23 -158.19 -52.03
EV/EBIT 357.31 -2798.68 -77.66 -62.22 -139.48 -49.53
P/Tangible BVPS 8.75 8.89 20.12 19.54 10.80 14.57
P/E 175.83 1055.00 -45.87 -36.38 -65.94 -45.87
P/FCF -73.41 -36.75 -105.26 -43.42 -48.23 -31.75

PHARMENA S.A. | Initiating Coverage | November 2015
33
Disclaimer
This document does neither constitute an offer nor a request to buy or sell any securities. It
only serves informational purposes. This document only contains a non-binding opinion on
the mentioned securities and market conditions at the time of its publication. Due to the
general character of its content this document does not replace investment advice.
Moreover, in contrast to especially approved prospectuses, it does not provide information,
which is necessary for taking investment decisions.
All information, which have been used in this document, and the statements that have been
made, are based on sources, which we think are reliable. However, we do not guarantee
their correctness or completeness. The expressions of opinion, which it contains, show the
author’s personal view at a given moment. These opinions can be changed at any time and
without further notice.
A liability of the analyst or of the institution, which has mandated him, should be excluded
from both direct and indirect damages.
This confidential study has only been made available to a limited number of recipients. A
disclosure or distribution to third-parties is only allowed with East Value Research’ approval.
All valid capital market rules, which relate to the preparation, content as well as distribution
of research in different countries, should be applied and respected by both the supplier and
recipient.
Distribution in the United Kingdom: In the UK this document shall only be distributed to
persons who are described in Section 11 (3) of the Financial Services Act 1986 (Investment
Advertisements) (Exemptions) Order 1996 (as amended). This research may not be
distributed and forwarded directly or indirectly to any other group of individuals. The
distribution of this document in other international jurisdictions may be restricted by law and
individuals who possess this study should inform themselves about any existing restrictions
and comply with them.
Neither this document nor any copy of it may be taken or sent to the United States of
America, Canada, Japan or Australia or distributed, directly or indirectly, in the United States
of America, Canada, Japan or Australia or to any resident thereof. Any failure to comply with
these restrictions may constitute a violation of United States, Canadian, Japanese or
Australian securities laws or the law of any other jurisdiction.
Declaration according to § 34b WpHG and FinAnV on potential conflicts of interest (As of
July 24, 2013): East Value Research has been commissioned to prepare this report by
PHARMENA S.A.

PHARMENA S.A. | Initiating Coverage | November 2015
34
Declaration according to § 34b WpHG and FinAnV on additional disclosures (As of July 24,
2013):
It is the sole decision of East Value Research GmbH whether and when a potential update of
this research will be made.
Relevant basis and measures of the valuations, which are included in this document:
The valuations, which are the basis for East Value Research‘ investment recommendations,
are based on generally-accepted and widely-used methods of fundamental analysis such as
the Discounted-Cash-Flow method, Peer Group comparison, or Sum-of-the-Parts models.
The meaning of investment ratings:
Buy: Based on our analysis, we expect the stock to appreciate and generate a total return of
more than 10% over the next twelve months
Add: Based on our analysis, we expect the stock to appreciate and generate a total return
between 0% and 10% over the next twelve months
Reduce: Based on our analysis, we expect the stock to cause a negative return between 0%
and -10% over the next twelve months
Sell: Based on our analysis, we expect the stock to cause a negative return exceeding -10%
over the next twelve months
The respective supervisory authority is:
Bundesanstalt für Finanzdienstleistungsaufsicht
Lurgiallee 12
60439 Frankfurt


![II. DODATKOWE INFORMACJE I OBJAŚNIENIA DO ......Struk-[PLN]: [w PLN]: [w PLN]: [w PLN]: [w PLN]: tura: - W tym Lp. Pozycja bilansowa: Wartość USD Struk-tura: EUR Struk-tura: GBP](https://static.fdocuments.net/doc/165x107/60ad945b6f07f82471767448/ii-dodatkowe-informacje-i-objanienia-do-struk-pln-w-pln-w-pln.jpg)