Pharmacy Benefit Managers (PBMs): Generating Savings … · PBMs: Generating Savings for Plan...
19
Pharmacy Benefit Managers (PBMs): Generating Savings for Plan Sponsors and Consumers Prepared for September 2011
Transcript of Pharmacy Benefit Managers (PBMs): Generating Savings … · PBMs: Generating Savings for Plan...
Pharmacy Benefit Managers (PBMs):
Generating Savings for Plan Sponsors and Consumers
Prepared for
September 2011
PBMs: Generating Savings for Plan Sponsors and Consumers
2
Table of Contents
I. Executive Summary.............................................................................................. 3
II. Discussion ............................................................................................................. 4
PBM Tools Focus on Five Key Savings Categories ..................................................................4
Plan-Sponsor Decisions Determine PBM Savings ....................................................................4
Factors Limiting the Use of PBM Tools ....................................................................................6
PBM Savings Help Employers Preserve and Create Jobs .........................................................6
III. Methodology ....................................................................................................... 7
Deriving Baseline Drug Expenditures Managed by PBMs .......................................................7
Developing a Model of PBM Savings .......................................................................................9
Evidence and Estimates .............................................................................................................9
Manufacturer Price Concessions and Pharmacy Discounts .................................................9
PBM Impact on Use of Generics and Preferred Brands ....................................................11
Utilization Management and Adherence Programs ...........................................................13
Administrative Efficiencies ...............................................................................................16
Projecting Limited/Average/Best-Practice PBM Savings ....................................................17
Estimating the Cost of Jobs Covered by PBM Savings ........................................................18
IV. Conclusion ........................................................................................................ 19
PBMs: Generating Savings for Plan Sponsors and Consumers
3
I. Executive Summary
Pharmacy Benefit Managers (PBMs) implement prescription drug benefits for more than 215
million Americans, who have health insurance from a variety of sponsors: commercial health
plans1, self-insured employer plans, union plans, Medicare Part D plans, the Federal Employees
Health Benefits Program (FEHBP), state government employee plans, and others. Working
under contract to these plan sponsors, PBMs use advanced tools to manage drug benefit
programs that give consumers more efficient and affordable access to medications. Visante was
commissioned by the Pharmaceutical Care Management Association (PCMA) to estimate the
savings that these PBM tools generate for plan sponsors and consumers.
Major Findings:
Average PBM Savings: From 2012 to 2021, PBMs will save plan sponsors and consumers
almost $2 trillion, or about 35%, compared with drug expenditures made without pharmacy
benefit management. Of the $2 trillion, commercial plan sponsors and their members will
save $1.3 trillion; Medicare Part D and its beneficiaries, $700 billion.2
Range of PBM Savings: Available PBM savings for individual plan sponsors can range
from 20% for those that make limited use of PBM tools to 50% for those that adopt best
practices recommended by PBMs.
Additional Savings with Best Practices: If all plan sponsors adopt PBM-recommended best
practices, projected prescription drug expenditures could fall by an additional $550 billion
over the next decade. Of the $550 billion in additional PBM savings, commercial plan
sponsors and their members could save $360 billion; Medicare Part D and its beneficiaries,
$190 billion.
Lost Savings if PBM Tools are Limited: Limiting PBM tools could increase projected
prescription drug costs by more than $550 billion over the next decade. Drug costs could rise
by more than $360 billion in the commercial sector and more than $190 billion in Medicare
Part D.
PBM Savings and Jobs: Annual savings generated by PBMs for the commercial sector will
cover the cost of more than 700,000 jobs in 2012. By adopting PBM-recommended best
practices, commercial plan sponsors could cover the cost of more than 200,000 additional
jobs next year. If PBM tools are limited, lost savings to the commercial sector could equal
the cost of more than 200,000 jobs. Put another way, each 1% decrease in prescription drug
expenditures covers the cost of 20,000 jobs nationwide.
1 For the purposes of calculating PBM dollar savings, Medicaid managed care plans are included in the commercial sector. For
calculations related to jobs, Medicaid managed care plans are excluded. 2 Average PBM savings represents current practice and is reflected in the government’s baseline projections for national health
expenditures and Medicare Part D.
PBMs: Generating Savings for Plan Sponsors and Consumers
4
II. Discussion
PBM Tools Focus on Five Key Savings Categories
Over the past 20 years, the share of the health care dollar spent on pharmaceuticals has nearly
doubled, from roughly 5% to 10%. New medications and broader insurance coverage have
increased drug expenditures—now approximately $300 billion annually—and the need for
pharmacy benefits management. PBMs have a difficult mission: to increase prescription-drug
access while reducing cost growth.
PBM tools focus on five primary categories that reduce drug trend:
1. Negotiating Rebates from Drug Manufacturers: PBMs negotiate rebates from
manufacturers of brand drugs that compete with therapeutically similar brands and
generics. Manufacturers typically provide a rebate if their product is ―preferred,‖ which
means it is assigned a copay lower than competing products.
2. Negotiating Discounts from Drugstores: Retail pharmacies provide discounts to be
included in a plan’s pharmacy network. The more selective the network, the greater the
discount, since each pharmacy will gain business.
3. Offering More Affordable Pharmacy Channels: Mail-service and specialty pharmacy
channels typically give plan sponsors deeper discounts than do retail pharmacies. These
channels also help encourage the use of preferred products for additional savings.
4. Encouraging Use of Generics and Affordable Brands: PBMs use several tools to
encourage the use of generic drugs and preferred brands. These include: formularies and
tiered cost sharing, prior authorization and step therapy protocols, generic incentives,
consumer education, and physician outreach. As PBMs and plan sponsors strive for
greater savings, drug mix becomes even more important.
5. Reducing Waste and Improving Adherence: PBMs use Drug Utilization Review
(DUR) to reduce waste such as polypharmacy and implement patient adherence programs
to help patients stick to their prescription regimens. Both programs improve clinical
outcomes and influence prescription volume and expenditures.
Plan-Sponsor Decisions Determine PBM Savings
Plan sponsors guide how actively pharmacy benefits are managed. They also determine
formulary coverage, copayment tiers, utilization management, and pharmacy channel options. In
making these choices, plan sponsors weigh many factors, including clinical quality, cost, and
member satisfaction.
For example, while nearly 80% of employer-sponsored plans used three, four, or more copay
tiers in 2010, 5% were apparently less concerned about managing prescription-drug costs and
applied the same copay (an average of $13) for every medication.3
3 Kaiser Family Foundation, HRET Employer Health Benefits Survey, 2010.
PBMs: Generating Savings for Plan Sponsors and Consumers
5
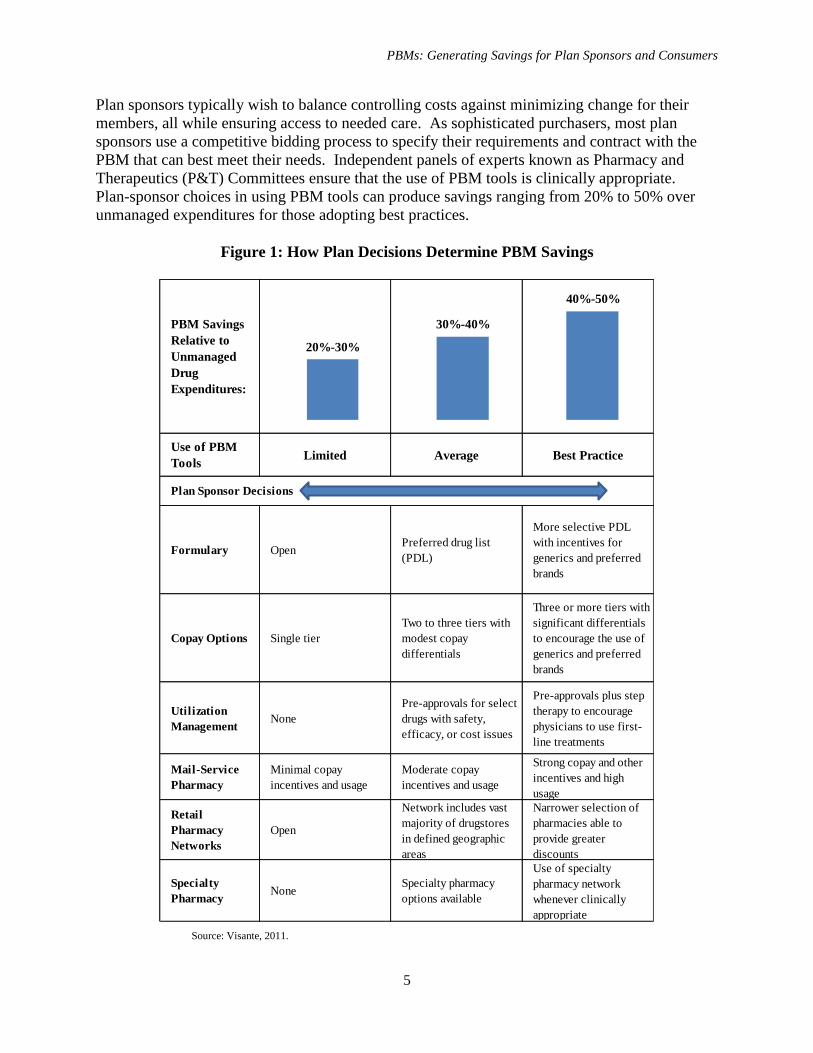
Plan sponsors typically wish to balance controlling costs against minimizing change for their
members, all while ensuring access to needed care. As sophisticated purchasers, most plan
sponsors use a competitive bidding process to specify their requirements and contract with the
PBM that can best meet their needs. Independent panels of experts known as Pharmacy and
Therapeutics (P&T) Committees ensure that the use of PBM tools is clinically appropriate.
Plan-sponsor choices in using PBM tools can produce savings ranging from 20% to 50% over
unmanaged expenditures for those adopting best practices.
Figure 1: How Plan Decisions Determine PBM Savings
Source: Visante, 2011.
PBM Savings
Relative to
Unmanaged
Drug
Expenditures:
Use of PBM
ToolsLimited Average Best Practice
Formulary OpenPreferred drug list
(PDL)
More selective PDL
with incentives for
generics and preferred
brands
Copay Options Single tier
Two to three tiers with
modest copay
differentials
Three or more tiers with
significant differentials
to encourage the use of
generics and preferred
brands
Utilization
ManagementNone
Pre-approvals for select
drugs with safety,
efficacy, or cost issues
Pre-approvals plus step
therapy to encourage
physicians to use first-
line treatments
Mail-Service
Pharmacy
Minimal copay
incentives and usage
Moderate copay
incentives and usage
Strong copay and other
incentives and high
usage
Retail
Pharmacy
Networks
Open
Network includes vast
majority of drugstores
in defined geographic
areas
Narrower selection of
pharmacies able to
provide greater
discounts
Specialty
PharmacyNone
Specialty pharmacy
options available
Use of specialty
pharmacy network
whenever clinically
appropriate
Plan Sponsor Decisions
20%-30%
30%-40%
40%-50%
PBMs: Generating Savings for Plan Sponsors and Consumers
6
Factors Limiting the Use of PBM Tools
In the commercial sector, large employers, unions, state governments, and other plan sponsors
have a range of goals, budgets, and philosophies. PBM savings are limited by benefit design
decisions made by individual plans. The wide range of PBM savings observed from plan to plan
in the commercial sector reflects this.
PBM savings in Medicare Part D are limited by the need for stand-alone prescription drug plans
to attract and retain enrollees and by governmental restrictions placed on the use of certain PBM
tools. Because Part D plans have similar goals and limits, PBM savings are fairly consistent
across these plans.
Faced with rising health costs, plan sponsors do not typically place limits on PBM tools that have
already been integrated into a plan. Looking forward, then, the main factor that could limit the
use of PBM tools is restrictive government policy.
If enacted, state and federal proposals that mandate coverage of brand name drugs, increase
pharmacy reimbursement levels, restrict the use of mail-service pharmacies, and force the
disclosure of proprietary contract information could all serve to limit the use of PBM tools. If
such policies decreased the current average PBM savings of approximately 35% to the 25% level
typical of plans with limited use of PBM tools, drug costs could rise by hundreds of billions of
dollars over the next decade.
PBM Savings Help Employers Preserve and Create Jobs
Employers bear a large portion of health costs in the United States, and studies suggest that
rising costs can lead to a decline in employment.4,5
The savings generated by PBMs provide
employers with funds to preserve and create jobs. Based on data produced by the Bureau of
Labor Statistics, Visante projects total compensation costs for a full-time equivalent private
industry worker at nearly $60,000 in 2012.6 In economic terms, this represents the approximate
opportunity cost of a job. With private-insurance drug expenditures projected at $122 billion in
2012,7 a 1% increase in that figure equals the opportunity cost of more than 20,000 jobs in the
―commercial‖ sector, defined to include both private-sector workers and government employees
receiving health benefits through private insurance. We discuss our calculations in more detail in
the methodology.
4 Baicker, K., et al., ―The Labor Market Effects of Rising Health Insurance Premiums,‖ Journal of Labor Economics, 24(3): 609-
634, July 2006. 5 Cutler, D., et al., ―Labor Market Responses to Rising Health Insurance Costs: Evidence on Hours Worked,‖ The Rand Journal
of Economics, 29(3), 1998. 6 Bureau of Labor Statistics, ―Employer Costs for Employee Compensation,‖ June 2011. 7 Centers for Medicare and Medicaid Services, National Health Expenditure Data, NHE Historical and Projections, 1965-2020.
PBMs: Generating Savings for Plan Sponsors and Consumers
7
III. Methodology
Visante’s model for projected PBM savings draws on data from: the Centers for Medicare and
Medicaid Services (CMS), Government Accountability Office (GAO), Federal Trade
Commission (FTC), Congressional Budget Office (CBO), PBM financial filings with the
Securities and Exchange Commission (SEC), PBM drug trend reports, structured interviews with
PBM industry experts, peer reviewed studies, and commercial third-party drug claims data.
Deriving Baseline Drug Expenditures Managed by PBMs
To derive baseline drug expenditures managed using PBM tools, Visante began with CMS
National Health Expenditure (NHE) projections for outpatient prescription drug expenditures
from 2011 to 2020. By these estimates, spending on outpatient prescription drugs will grow from
$276 billion in 2011 to $513 billion in 2020, for a total of $3.8 trillion over the 10-year period.8,9
The projections reflect CMS assumptions concerning the impact of health reform, manufacturer
price inflation, patent expirations, new drug introductions, follow-on biologics, and other factors.
Our model incorporates these assumptions.
CMS outpatient drug expenditure projections reflect net costs to payers, including plan sponsors
and consumers. Manufacturer and pharmacy discounts are reflected in CMS figures. Outpatient
prescription drug expenditures account for about 75% of the nation’s drug bill, and nearly all
PBM management activities focus on outpatient prescription drugs.
CMS segments outpatient prescription drug expenditures by payer, including private insurance,
Medicare, Medicaid, and other government programs. Visante assumes that nearly all private-
insurer expenditures and nearly all Medicare Part D expenditures are associated with the use of
PBM tools. We have excluded the approximately 73% of Medicaid prescription costs that still
occur in state fee-for-service programs.10
Prescription expenditures in the Veterans
Administration (VA), Indian Health Service, and DoD/TriCare direct services also were
excluded. DoD/TriCare expenditures on prescriptions outside military treatment facilities,
however, were included.11
Visante next estimated the share of consumer out-of-pocket expenditures arising from
copayments/cost sharing for prescriptions associated with PBMs and PBM tools. We started by
projecting the average cost sharing per prescription based on survey data for commercial plan
sponsors reported by the Kaiser Family Foundation12
and for Medicare Part D plans as reported
by CBO.13
We then multiplied average cost sharing by the estimated number of prescriptions
each year that were managed with PBM tools.
8 Centers for Medicare and Medicaid Services, National Health Expenditure Data, NHE Historical and Projections, 1965-2020. 9 The National Health Accounts do not include projections for 2021. The 2021 value was projected assuming the 2017-20 growth
rate held for the following years. 10 The Lewin Group, Potential Federal and State-by-State Savings if Medicaid Pharmacy Programs were Optimally Managed,
February 2011. 11 TriCare drug spend under ―purchased services‖ is estimated at $2.8b for 2010, according to The Evaluation of the TRICARE
Program: Fiscal Year 2011 Report to Congress, February 2011. 12 Kaiser Family Foundation, HRET Employer Health Benefits Survey, 2010. 13 Congressional Budget Office, Effects of Using Generic Drugs on Medicare’s Prescription Drug Spending, September 2010.
PBMs: Generating Savings for Plan Sponsors and Consumers
8
Visante estimated the prescriptions associated with PBM tools based on data published by IMS
Health. In 2010, approximately 3.7 billion prescriptions were filled at chain pharmacies,
independent pharmacies, food stores, mail-service pharmacies, and specialty pharmacies. That
year, approximately 20% of prescriptions were filled at mail-service pharmacies. The mail figure
reflects our estimates of ―normalized mail-service prescriptions.‖ That is, one mail-service
prescription for a 90-day supply is adjusted to become three ―normalized prescriptions‖ for a 30-
day supply.
After these calculations, we estimate that 2012 outpatient prescription drug expenditures
associated with PBM tools, including plan sponsor and consumer payments, are approximately
$165 billion for the commercial market and $85 billion for Medicare Part D. Over the 2012-2021
period, these figures are $2.3 trillion for the commercial sector and $1.2 trillion for Medicare
Part D. Note that more PBMs are playing a management role in physician-administered drugs
covered by Medicare Part B and that our baseline or savings estimates don’t reflect such activity.
As discussed, CMS’s 10-year projections reflect many assumptions regarding marketplace
trends. We believe that CMS estimates reasonably capture these trends and reflect the current
savings that PBMs achieve in the marketplace. CMS does not publish the detailed factors
underlying its model, so we estimated the factor inputs necessary to model PBM savings and
then applied them to baseline expenditures derived from CMS data.
We used data from IMS Health14
to separate drug trend into key sub-components such as the
number of prescriptions, the generic dispensing rate (GDR), the mail-service pharmacy
penetration rate, and other measures, all detailed below. We also estimated trends in these
components based on data published in PBM drug trend reports15
and other sources.
We assume that over the 10-year projection period:
Total prescription utilization will grow by 2% to 3% annually
The generic dispensing rate (GDR) will exceed 80% by 2015
Brand prices will increase 5% to 10% per year while generic prices will remain relatively
flat
The specialty pharmacy market will grow much more rapidly than the market for
traditional prescription drugs, expanding from an estimated $35 billion in 2010 to $160
billion in 2021
Again, we assume that these trends are similarly captured in the CMS projections.
14 IMS Health, The Use of Medicines in the United States: Review of 2010, April 2011; IMS Health, Channel Distribution by
Prescriptions, April 2011. 15 CVS Caremark, Insights 2011, 2011; Express Scripts, Drug Trend Report, 2011; Medco, Drug Trend Report, 2011.
PBMs: Generating Savings for Plan Sponsors and Consumers
9
Developing a Model of PBM Savings
Using the 10-year projections described above, we then developed an economic model to
determine ranges of PBM savings relative to unmanaged drug expenditures. We did this by
adjusting key variables to reflect potential changes in the level of PBM management. These
ranges let us estimate the average savings that PBMs have generated—as well as both limited
and best-practice savings estimates depending on the approach of different plan sponsors. For
our savings model, we assume that the NHE projections reflect the ―average‖ level of PBM
savings.
Our economic model is based on a review of the evidence associated with broad savings
categories. These include manufacturer price concessions and pharmacy discounts, use of
generics and preferred brands, and utilization management and adherence programs.
Evidence and Estimates of Manufacturer Price Concessions and Pharmacy Discounts
The broad category of price concessions and pharmacy discounts comprises pharmacy network
discounts, mail-service pharmacy discounts, specialty pharmacy discounts, and manufacturer
rebates.
Pharmacy Network Discounts: In 2003 the GAO reported that the average price PBMs
negotiated for retail-pharmacy drugs was about 18% below the average retail-pharmacy
cash price for brand drugs and 47% below for generic drugs.16
Moreover, in 2005 the
FTC reported that customers without insurance paid 15% more for brand-name drugs
than did customers with insurance.17
Average Wholesale Price (AWP) discounts for
brand drugs were approximately 15% from 2002 to 2004, so the AWP discount correlates
well with savings below unmanaged cash prices. Meanwhile, the AWP discounts in
pharmacy network contracts have increased to 17% to 18%.18
But for generic drugs, the
discount programs many pharmacies have introduced during the past five years have
substantially narrowed the gap between retail cash prices and the network discount prices
that PBMs have negotiated.
Mail-Service Pharmacy Discounts: Mail-service pharmacies offer significant discounts
over retail pharmacies. According to the GAO, ―With deeper discounts and no dispensing
fees, mail-order/home-delivery prices are 27% and 53% below the average cash price
customers would pay at a retail pharmacy for brand name and generic drugs,
respectively.‖19
A survey of PBM clients finds mail-service discounts of 23.3% off AWP
for brand drugs (6 points better than retail) and 53.5% for generics (7 points better than
retail).20
Another survey of managed care organizations has similar results, with mail-
service discounts 6 points better than retail networks.21
What’s more, 79% of surveyed
16 Government Accountability Office, Federal Employees’ Health Benefits: Effects of Using Pharmacy Benefit Managers on
Health Plans, Enrollees, and Pharmacies, January 2003. 17 Federal Trade Commission, Pharmacy Benefit Managers: Ownership of Mail-Order Pharmacies, 2005. 18 Pharmacy Benefit Management Institute, Prescription Drug Benefit Cost and Plan Design Report, 2010-2011. 19 Government Accountability Office, op. cit. 20 Pharmacy Benefit Management Institute, op. cit. 21 Novartis, ―Pharmacy Benefit Report: 2010/2011 Facts, Figures, & Forecasts,‖ 2011.
PBMs: Generating Savings for Plan Sponsors and Consumers
10
PBM clients pay no dispensing fees,22
which adds 1 percentage point of savings for
brands and 4 points for generics. However, mail-service penetration is also a crucial
variable in predicting mail-service savings. While IMS data suggest that about 20% of
prescriptions are filled at mail23
(adjusted so that one 90-day prescription is normalized to
three 30-day prescriptions), PBM drug trend reports indicate that plan sponsors can
achieve mail-service penetration of up to 50% or more.24
Manufacturer Discounts and Rebates: PBMs negotiate price concessions with
pharmaceutical manufacturers on selected brand-name drugs. A CBO analysis published
in 2010 notes that rebates for Medicare Part D are approximately 14%25
; the investment
research firm Sector & Sovereign Research estimates that in 2009, rebates for private
plan sponsors averaged 14.3% of brand prescription costs.26
Since brand costs account for
almost 75% of the total, this translates to an overall discount on total drug spend of more
than 10%. An OIG report published in March 2011 supports this estimate, with rebates of
approximately 10 percent of total gross Part D drug costs.27
Most recently, the OIG
estimated Medicare Part D rebates for just the top 100 brands at 19%.28
However, other
sources estimate slightly lower rebates. A 2005 Federal Trade Commission report
estimated rebates of 7.5% on average brand prescription costs for 2003.29
Specialty Pharmacy: PBMI reports that specialty pharmacy discounts are
approximately 1 percentage point higher than those for retail, with an average 18.7%
discount off AWP.30
Since the average PBM savings is included in the base economic model projections, the savings
compared to unmanaged drug expenditures are easily calculated. We simply remove all
discounts associated with pharmacy network contracts, mail-service pharmacies, and specialty
pharmacies—and remove all manufacturer rebates—to determine drug expenditures based on
undiscounted prices.
We base assumptions for retail/mail/specialty discounts on PBMI reported values for limited,
average, and best-practice in each channel.31
Mail-service penetration is estimated at a minimum
of 0% in plans with no mail-service benefit, 20% (measured as normalized prescriptions) for
average plans, and up to 50% for plans with high mail-service-pharmacy use. Rebates for
average plans were estimated at 11% of expenditures on brand drugs.
22 Pharmacy Benefit Management Institute, op. cit. 23 IMS Health, Channel Distribution by Prescriptions, April 2011. 24 CVS Caremark, op. cit. 25 Congressional Budget Office, op. cit. 26 ―Drug Prices Rise Despite Calls for Cuts,‖ The Wall Street Journal, March 17, 2011. 27 Department of Health and Human Services, Office of Inspector General, ―Concerns With Rebates in the Medicare Part D
Program,‖ March, 2011. 28 Department of Health and Human Services, Office of Inspector General, ―Higher Rebates For Brand-Name Drugs Result In
Lower Costs for Medicaid Compared to Medicare Part D,‖ August 2011. 29 Federal Trade Commission, op. cit. 30 Pharmacy Benefit Management Institute, op. cit. 31 Ibid.
PBMs: Generating Savings for Plan Sponsors and Consumers
11
The September 2009 change in published AWP has altered the technical calculations of contract
discounts and pharmacy prices. We assume, however, that the fundamental market dynamics
remain unchanged, with approximately the same net discounts off pharmacy cash price.
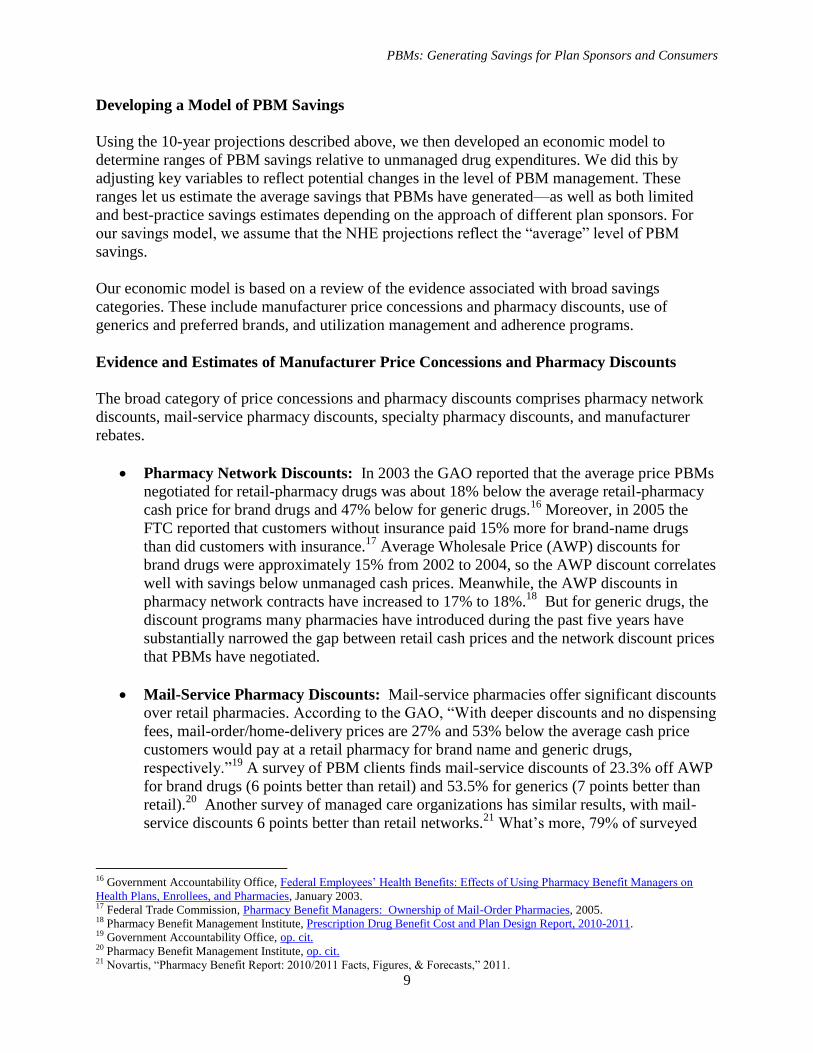
Based on this evidence and methodology, Visante calculates the following savings from price
concessions and discounts:
Figure 2: Range of Possible PBM Savings vs. Unmanaged Expenditures
Through Manufacturer Price Concessions and Pharmacy Discounts
Limited Average Best-practice
16% to 22% 22% to 28% 28% to 32%
Source: Visante, 2011.
Evidence and Estimates of PBM Impact on Use of Generics and Preferred Brands
PBMs implement a variety of tools and techniques to promote generics and more-affordable
brands. These tools include formularies, tiered copays, prior authorization, step therapy
programs, generic incentives, and consumer education. GAO reported that plan savings for these
PBM intervention techniques ranged from 1% to 9% of total spending on prescription drug
benefits.32
According to IMS Health, approximately 75% of all drug prescriptions in 2010 were filled with
generics, but brands still accounted for almost 75% of drug expenditures.33
Generic dispensing
rates (GDR) have increased significantly during the past few years, due to patent expirations for
blockbuster brands and PBM strategies to maximize the new generics. Indeed, while most plans
report GDRs of 70% to 75%, some have reported close to 80%34
or above.35
Key data on how
PBM tools can shift drug mix toward more affordable products includes the following:
Generic Substitution: Most plans now require generic substitution whenever possible.
A survey of health plans indicates that generic substitution rates (i.e., how often a generic
product is dispensed when available as a brand alternative) are more than 96% for
commercial plans.36
PBM research has suggested that plans can save from 6% to 10%
when requiring clinically appropriate generic substitution.37
A peer-reviewed study
showed that mandatory generic substitution in a two-tier plan cut drug spending by 8%.38
Other data suggest that mail-service pharmacies increase generic substitution. Within the
first week of the introduction of generic zolpidem, one mail-service pharmacy achieved a
32 Government Accountability Office, op. cit. 33 IMS Health, op. cit. 34 CVS Caremark, op. cit. 35 Pharmacy Benefit Management Institute, op. cit. 36 Novartis, ―Pharmacy Benefit Report: 2010/2011 Facts, Figures, & Forecasts,‖ 2011. 37 Kaiser Family Foundation, ―Cost Containment Strategies for Prescription Drugs: Assessing the Evidence in the Literature,‖
March 2005. 38 Joyce, et al., ―Employer Drug Benefit Plans and Spending on Prescription Drugs,‖ JAMA, 288:1733-1739, 2002.
PBMs: Generating Savings for Plan Sponsors and Consumers
12
generic substitution rate of 97%, compared with a 77% substitution rate over the same
period at retail pharmacies.39
Formularies and Therapeutic Interchange: CBO examined potential substitution for
seven therapeutic classes identified by Medicare. It concluded that if generics rather than
single-source brand-name prescriptions had been used, prescription drug costs in 2007
would have fallen by $4 billion—or 7% of total payments to plans and pharmacies that
year.40
PBM research suggests savings of 1% to 5% through therapeutic substitution.41
Step Therapy: These programs apply clinical guidelines to encourage use of a preferred,
first-line drug before a more expensive, second-line drug. Many plans report using step-
therapy programs in 2009-10, and more plans—91% of commercial (up from 86% in
2009) and 83% of stand-alone PDPs (up from 75% in 2009)—forecast using such
programs in 2011.42
One study examined step-therapy for three classes: proton pump
inhibitors (for ulcers), selective serotonin reuptake inhibitors (for depression), and
nonsteroidal anti-inflammatory drugs (for pain). The plan sponsor experienced a
decrease in net cost after implementing step therapy, while the comparison group had an
increase. This translated to a savings of approximately 2.3% of total drug spend.
43
Another study evaluated step therapy for antihypertensive drugs, and found that drug
costs were 13% lower for the patients in the step therapy intervention group.44
Copay Tiers: During the past 5 to 10 years, plan sponsors have dramatically increased
the use of 3-tier copay structures to encourage greater use of generics and preferred
brands. The implementation of tiered copays has created more aligned incentives for
consumers. One study examined the addition of a three-tier copay, with relatively modest
copays of $8/$15/$25. Payer costs dropped 17%, with 10% attributed to the absolute
increase in copayments and 7% to the utilization and lower cost of substituted drugs.45
Another peer-reviewed study demonstrated that adding a third copayment of $30 for non-
preferred brand drugs to a two-tier plan ($10 generics, $20 brand) lowered overall drug
spending by 4%.46
Consumer Education: PBMs deliver various educational materials to increase
consumer understanding of their pharmacy benefit. PBMs may include additional
incentives in their pharmacy network contracts to achieve improved formulary
compliance and use of generic alternatives. A PBM study estimated that it can save up to
4% from generic incentives and education.47
39 Medco, op. cit. 40 Congressional Budget Office, op. cit. 41 Kaiser Family Foundation, op. cit. 42 Novartis Pharmacy Benefit Report: 2010/2011 Facts, Figures, & Forecasts 43 Motheral, et al., ―Plan-Sponsor Savings and Member Experience With Point-of-Service Prescription Step Therapy,‖ AJMC,
July 2004. 44 Yokoyama, et al., ―Effects of a step therapy program for angiotensin receptor blockers on antihypertensive medication
utilization patterns and cost of drug therapy,‖ J Manag Care Pharm 2007 Apr;13(3):235-44. 45 Motheral, et al., ―Effect of Three-Tier Prescription Copay on Pharmaceutical and Other Medical Utilization,‖ Medical Care,
39(12): 1293-1304, December 2001. 46 Joyce, et al., op. cit. 47 Medco, op. cit.
PBMs: Generating Savings for Plan Sponsors and Consumers
13
Specialty Pharmacy: While this segment currently offers limited opportunities to
promote generics, managing specialty drug mix is still important. Specialty drug
categories in which formulary-preferred brands are most often selected include: growth
hormone, multiple sclerosis, rheumatoid arthritis, blood modifiers, and hepatitis C. In
one plan, a specialty pharmacy increased market share of the formulary-preferred human
growth hormone from 27% to 82% within 12 months, generating savings of 20% in this
expensive category.48
In our model, we adjusted drug mix to reflect a higher or lower dispensing of cheaper alternative
drugs, primarily generics and preferred brands.
To calculate the additional cost associated with unmanaged drug mix, we reduced the generic
dispensing rate (GDR) in the current projections by 8 points (based on lower GDRs observed in
plans with limited management, as well as fee-for-service Medicaid). We also assumed greater
use of higher-cost brands in an unmanaged environment. The net result indicates that drug mix
delivers 11% to 16% of savings for the average PBM-managed plan vs. unmanaged drug
expenditures.
To model a best-practice-savings scenario, we estimate that lower-cost drug alternatives could be
used in place of 30% of brand prescriptions in an average savings environment. Of these lower
cost alternatives, approximately two-thirds could be generics and one-third formulary-preferred
brands. A high-performing plan could increase GDR by 5 percentage points, which correlates to
best practice GDRs reported by PBMs.49
Similarly, limited PBM management will reduce GDR
by approximately 5 percentage points.
Based on this evidence and methodology, Visante calculates the following savings from
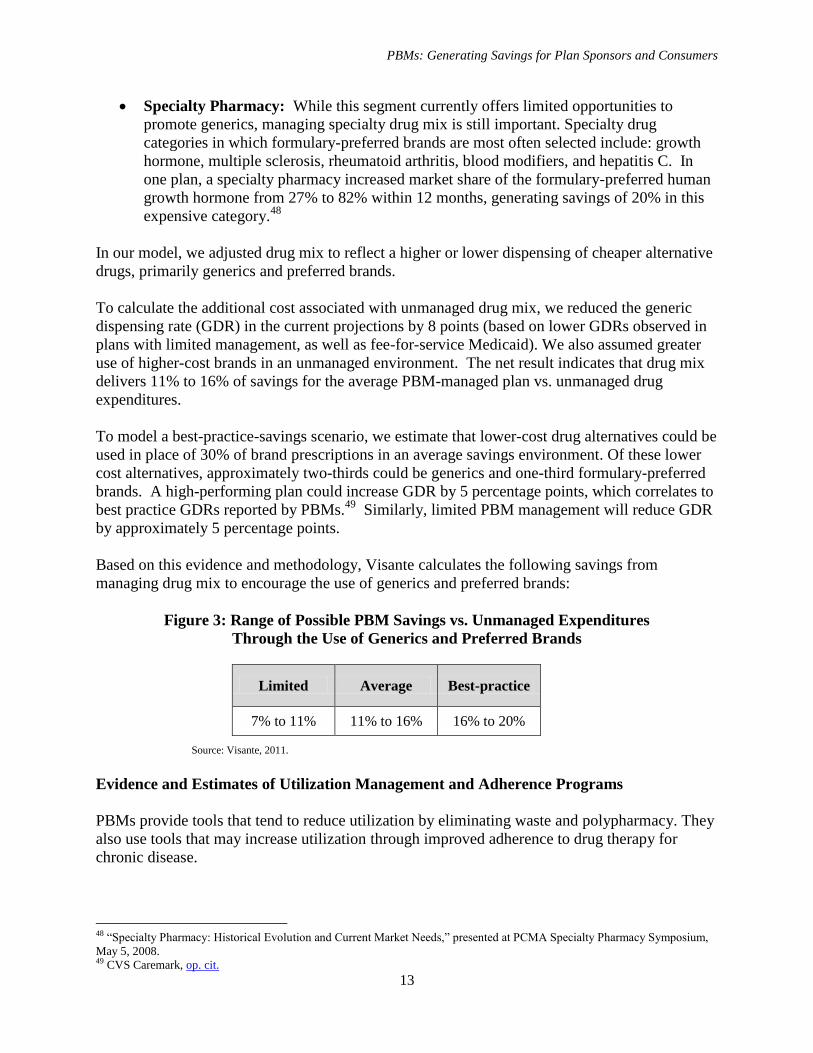
managing drug mix to encourage the use of generics and preferred brands:
Figure 3: Range of Possible PBM Savings vs. Unmanaged Expenditures
Through the Use of Generics and Preferred Brands
Limited Average Best-practice
7% to 11% 11% to 16% 16% to 20%
Source: Visante, 2011.
Evidence and Estimates of Utilization Management and Adherence Programs
PBMs provide tools that tend to reduce utilization by eliminating waste and polypharmacy. They
also use tools that may increase utilization through improved adherence to drug therapy for
chronic disease.
48 ―Specialty Pharmacy: Historical Evolution and Current Market Needs,‖ presented at PCMA Specialty Pharmacy Symposium,
May 5, 2008. 49 CVS Caremark, op. cit.
PBMs: Generating Savings for Plan Sponsors and Consumers
14
Utilization Management: Drug utilization review (DUR) programs improve quality and
safety by preventing drug duplication, drug interactions, and polypharmacy. Such
programs also reduce dangerous over-utilization of prescription drugs. Numerous studies
have documented drug cost savings associated with DUR programs. One peer-reviewed
study examined DUR programs and found average savings of 6.9% on total drug spend.50
Other PBM tools that help reduce excess utilization include:
Refill Too Soon: According to one survey, the most common plan-sponsor tool—
used by 89%51
—is a ―refill too soon supply edit.‖ Such an edit triggers if, say, a
pharmacy dispenses a 30-day supply of medication and the patient tries to refill it 10
days later.
Quantity Limits: Managed care organizations report using quantity limits more than
50% of the time for the top 19 drug categories.52
PBM research notes that plan
exclusions, including specific drug limits and general limitations, can save up to 1%
of drug spend.53
Prior Authorization: Prior authorization (PA) ensures that a prescription drug meets
clinical guidelines before it is dispensed. One study looked at 22 states that
implemented prior authorization programs for Cox-2 inhibitors, non-steroidal anti-
inflammatory drugs (NSAID). With nearly 18 million NSAID prescriptions covered
by Medicaid in 2003, PA reduced the annual cost of these prescriptions by $185
million, lowering total drug spend by 0.6% in this drug category alone.54
Patient Adherence: PBM tools for increasing clinical quality and patient health may
increase the numbers of prescriptions. This can occur in the PBM programs focused on
ensuring that patients adhere to prescribed drug therapies for such chronic diseases as
diabetes, hypertension, and heart failure. Numerous studies have demonstrated that
improved patient adherence delivers improved clinical outcomes and greater value. A
recent study quantified savings for adherent patients with congestive heart failure, high
blood pressure, diabetes, and high cholesterol, indicating that they may save the health
care system as much as $7,800 per patient annually.55
(Note that modeling non-drug
medical savings was beyond the scope of this study.) Research has shown that 90-day
supplies filled via mail-service, with lower copays—combined with refill reminders,
auto-refills, patient education, and other adherence strategies—can improve adherence by
approximately 8 percentage points.56,57
Adherence programs have historically focused on
mail-service pharmacy, however some evidence suggests that adherence can also be
50 Moore, et al., ―Systemwide Effects of Medicaid Retrospective Drug Utilization Review Programs,‖ Journal of Health Politics,
Policy and Law, Volume 25, Number 4, August 2000, pp. 653–688. 51 Pharmacy Benefit Management Institute, op. cit. 52 Novartis Pharmacy Benefit Report: 2010/2011 Facts, Figures, & Forecasts 53 Medco, op. cit. 54 Fischer, et al., ―Medicaid Prior-Authorization Programs and the Use of Cyclooxygenase-2 Inhibitors,‖ New England Journal of
Medicine, 2004; 351:2187-2194, November 18, 2004. 55 Roebuck, et al., ―Medication Adherence Leads To Lower Health Care Use And Costs Despite Increased Drug Spending,‖
Health Affairs, 30(1), 2011. 56 Express Scripts, ―Is Compliance Really Better in Home Delivery? Evidence Across Three Chronic Therapy Classes,‖ 2008. 57 Duru, et al., ―Mail-Order Pharmacy Use and Adherence to Diabetes-Related Medications,‖ Am J Managed Care,16(1):33-40,
2010.
PBMs: Generating Savings for Plan Sponsors and Consumers
15
improved using similar strategies at retail pharmacies,58
particularly with 90-day-at-retail
prescriptions increasingly being incorporated into pharmacy benefit designs. The
fulfillment of a 90-day supply of drugs from network retail pharmacies was offered in
2009 by 58% of commercial plans and by more than 90% of stand-alone Medicare PDPs.
An additional 9% of surveyed plans intended to introduce it in 2010 or 2011.59
Specialty Pharmacy: Utilization management and patient adherence programs play an
important role in specialty pharmacy. One specialty pharmacy, for instance, identified
inappropriate utilization according to nationally recognized clinical guidelines for six
therapy categories. Applying these clinical guidelines with 52 clients cut costs by 24% in
these categories.60
Specialty pharmacies can also reduce product waste by eliminating
excessive quantities of expensive pharmaceuticals. One specialty pharmacy demonstrated
that hemophilia assay management and waste reduction reduce expenditures 7.7%, that
Revlimid dose optimization saves 6.6%, and that a Synagis waste reduction program
saves 1%.61
Patient adherence is often crucial to successful therapy in diseases related to
specialty pharmacy (e.g., multiple sclerosis, hepatitis C). Patients taking hepatitis C
medications delivered through a specialty pharmacy were significantly more adherent
(90%) to therapy than were patients receiving medications through a retail pharmacy
(49%), as measured by their prescription refill rate.62
Visante estimates that for a plan with average use of PBM tools, utilization management
programs reduce prescription volume by approximately 1% to 2%, while typical adherence
programs increase prescription volume by 1% to 2%. The programs each offset the other in drug
costs but improve clinical quality and potentially cut non-drug medical costs.
Because pharmacies and pharmaceutical manufacturers have an economic incentive to promote
patient adherence in order to increase prescription volume, we assume that half the adherence
impact would be present for an unmanaged benefit, yielding a potential net 2% to 3% increase in
utilization for adherence programs in a managed environment.
The use of PBM drug-utilization tools depends on plan-sponsor goals. Plan sponsors that focus
primarily on prescription cost management may choose utilization management programs
without adherence programs, thereby cutting utilization by up to 2%. Other plan sponsors may
be more interested in improving patient adherence. We know of no plan sponsors that have
implemented maximum adherence with no utilization management, so the lower range is defined
by maximum adherence (an approximately 2% to 3% increase) combined with maximum
utilization management (an approximately 1% to 2% decrease). Based on this evidence and
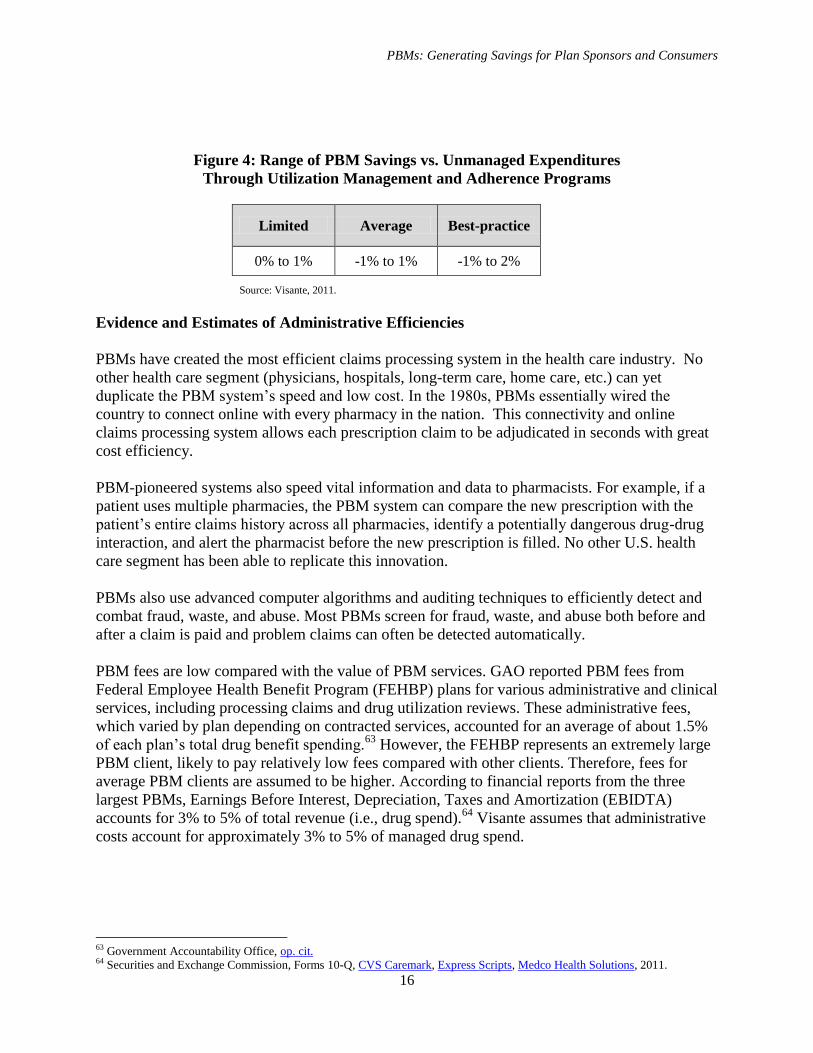
methodology, Visante calculates the following savings from utilization management:
58 Cutrona, et al., ―Modes of Delivery for Interventions to Improve Cardiovascular Medication Adherence,‖ Am J Managed Care,
2010, 16(12):929-94, 2010. 59 Novartis, ―Pharmacy Benefit Report: 2010/2011 Facts, Figures, & Forecasts,‖ 2011. 60 Specialty Pharmacy… Needs,‖ op. cit. 61 Ibid 62 McDermott, et al., ―Adherence to Hepatitis Treatment Based on Refill Rates, A Comparison between Curascript and Retail
Pharmacy,‖ Poster Presentation AMCP Spring 2005 Annual Meeting, 2005.
PBMs: Generating Savings for Plan Sponsors and Consumers
16
Figure 4: Range of PBM Savings vs. Unmanaged Expenditures
Through Utilization Management and Adherence Programs
Limited Average Best-practice
0% to 1% -1% to 1% -1% to 2%
Source: Visante, 2011.
Evidence and Estimates of Administrative Efficiencies
PBMs have created the most efficient claims processing system in the health care industry. No
other health care segment (physicians, hospitals, long-term care, home care, etc.) can yet
duplicate the PBM system’s speed and low cost. In the 1980s, PBMs essentially wired the
country to connect online with every pharmacy in the nation. This connectivity and online
claims processing system allows each prescription claim to be adjudicated in seconds with great
cost efficiency.
PBM-pioneered systems also speed vital information and data to pharmacists. For example, if a
patient uses multiple pharmacies, the PBM system can compare the new prescription with the
patient’s entire claims history across all pharmacies, identify a potentially dangerous drug-drug
interaction, and alert the pharmacist before the new prescription is filled. No other U.S. health
care segment has been able to replicate this innovation.
PBMs also use advanced computer algorithms and auditing techniques to efficiently detect and
combat fraud, waste, and abuse. Most PBMs screen for fraud, waste, and abuse both before and
after a claim is paid and problem claims can often be detected automatically.
PBM fees are low compared with the value of PBM services. GAO reported PBM fees from
Federal Employee Health Benefit Program (FEHBP) plans for various administrative and clinical
services, including processing claims and drug utilization reviews. These administrative fees,
which varied by plan depending on contracted services, accounted for an average of about 1.5%
of each plan’s total drug benefit spending.63
However, the FEHBP represents an extremely large
PBM client, likely to pay relatively low fees compared with other clients. Therefore, fees for
average PBM clients are assumed to be higher. According to financial reports from the three
largest PBMs, Earnings Before Interest, Depreciation, Taxes and Amortization (EBIDTA)
accounts for 3% to 5% of total revenue (i.e., drug spend).64
Visante assumes that administrative
costs account for approximately 3% to 5% of managed drug spend.
63 Government Accountability Office, op. cit. 64 Securities and Exchange Commission, Forms 10-Q, CVS Caremark, Express Scripts, Medco Health Solutions, 2011.
PBMs: Generating Savings for Plan Sponsors and Consumers
17
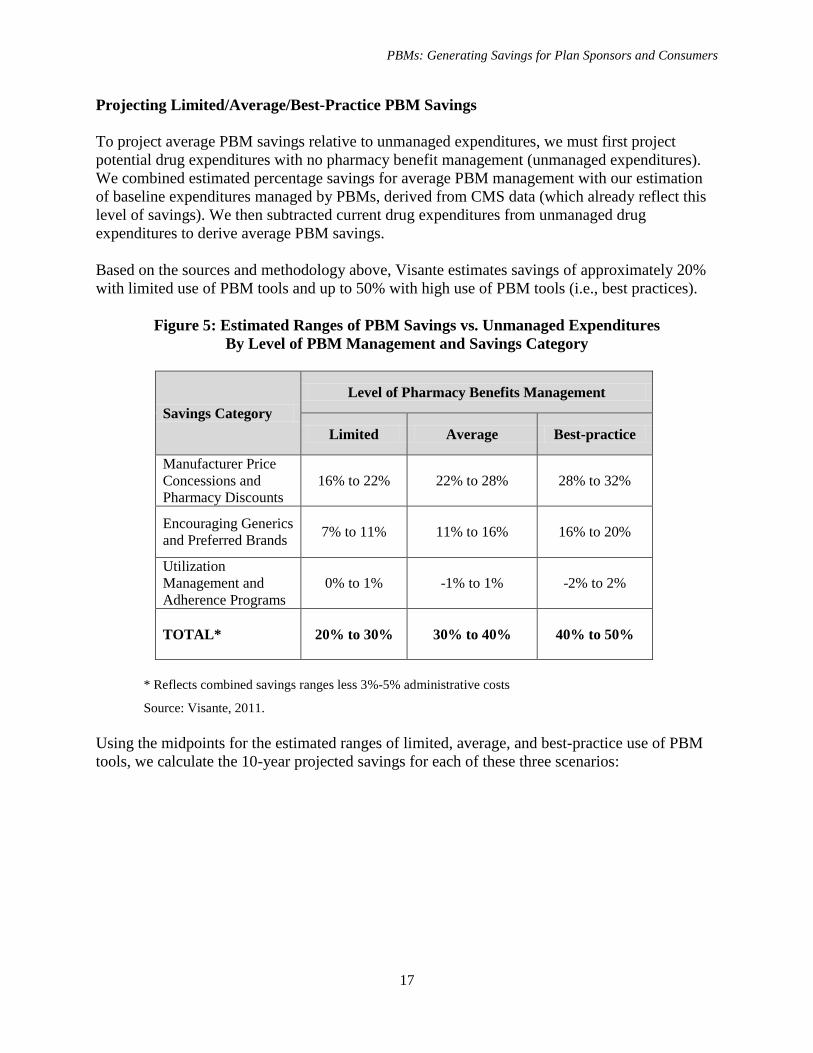
Projecting Limited/Average/Best-Practice PBM Savings
To project average PBM savings relative to unmanaged expenditures, we must first project
potential drug expenditures with no pharmacy benefit management (unmanaged expenditures).
We combined estimated percentage savings for average PBM management with our estimation
of baseline expenditures managed by PBMs, derived from CMS data (which already reflect this
level of savings). We then subtracted current drug expenditures from unmanaged drug
expenditures to derive average PBM savings.
Based on the sources and methodology above, Visante estimates savings of approximately 20%
with limited use of PBM tools and up to 50% with high use of PBM tools (i.e., best practices).
Figure 5: Estimated Ranges of PBM Savings vs. Unmanaged Expenditures
By Level of PBM Management and Savings Category
Savings Category
Level of Pharmacy Benefits Management
Limited Average Best-practice
Manufacturer Price
Concessions and
Pharmacy Discounts
16% to 22% 22% to 28% 28% to 32%
Encouraging Generics
and Preferred Brands 7% to 11% 11% to 16% 16% to 20%
Utilization
Management and
Adherence Programs
0% to 1% -1% to 1% -2% to 2%
TOTAL* 20% to 30% 30% to 40% 40% to 50%
* Reflects combined savings ranges less 3%-5% administrative costs
Source: Visante, 2011.
Using the midpoints for the estimated ranges of limited, average, and best-practice use of PBM
tools, we calculate the 10-year projected savings for each of these three scenarios:
PBMs: Generating Savings for Plan Sponsors and Consumers
18
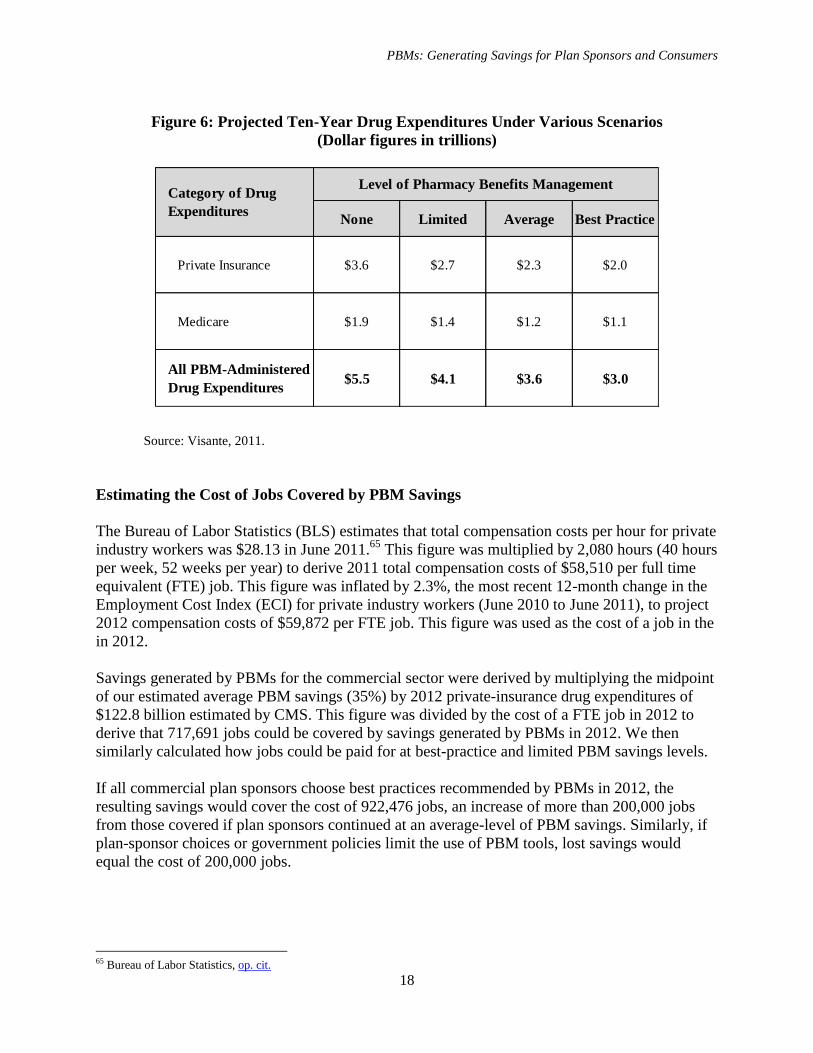
Figure 6: Projected Ten-Year Drug Expenditures Under Various Scenarios
(Dollar figures in trillions)
Source: Visante, 2011.
Estimating the Cost of Jobs Covered by PBM Savings
The Bureau of Labor Statistics (BLS) estimates that total compensation costs per hour for private
industry workers was $28.13 in June 2011.65
This figure was multiplied by 2,080 hours (40 hours
per week, 52 weeks per year) to derive 2011 total compensation costs of $58,510 per full time
equivalent (FTE) job. This figure was inflated by 2.3%, the most recent 12-month change in the
Employment Cost Index (ECI) for private industry workers (June 2010 to June 2011), to project
2012 compensation costs of $59,872 per FTE job. This figure was used as the cost of a job in the
in 2012.
Savings generated by PBMs for the commercial sector were derived by multiplying the midpoint
of our estimated average PBM savings (35%) by 2012 private-insurance drug expenditures of
$122.8 billion estimated by CMS. This figure was divided by the cost of a FTE job in 2012 to
derive that 717,691 jobs could be covered by savings generated by PBMs in 2012. We then
similarly calculated how jobs could be paid for at best-practice and limited PBM savings levels.
If all commercial plan sponsors choose best practices recommended by PBMs in 2012, the
resulting savings would cover the cost of 922,476 jobs, an increase of more than 200,000 jobs
from those covered if plan sponsors continued at an average-level of PBM savings. Similarly, if
plan-sponsor choices or government policies limit the use of PBM tools, lost savings would
equal the cost of 200,000 jobs.
65 Bureau of Labor Statistics, op. cit.
None Limited Average Best Practice
Private Insurance $3.6 $2.7 $2.3 $2.0
Medicare $1.9 $1.4 $1.2 $1.1
All PBM-Administered
Drug Expenditures$5.5 $4.1 $3.6 $3.0
Level of Pharmacy Benefits ManagementCategory of Drug
Expenditures
PBMs: Generating Savings for Plan Sponsors and Consumers
19
IV. Conclusion
PBM tools provide substantial savings to plan sponsors and consumers. Plan sponsors balance
controlling costs against minimizing change for their members, all while ensuring access to
needed care. Savings can range from 20% with limited use of PBM tools to 50% with best
practices. At current use, PBM tools will save almost $2 trillion over the next decade. In addition
to these expected savings, an additional $550 billion could be saved if all plan sponsors adopted
best practices. Likewise, $550 billion could be lost if PBM tools are limited by government
policies or other factors. Much is at stake, as PBM savings could help employers to preserve
hundreds of thousands of jobs over the next 10 years.