
Pharmacokinetic variability of phenobarbital: a systematic ...
19
REVIEW Pharmacokinetic variability of phenobarbital: a systematic review of population pharmacokinetic analysis Janthima Methaneethorn 1,2 & Nattawut Leelakanok 3 Received: 17 April 2020 /Accepted: 1 October 2020 # Springer-Verlag GmbH Germany, part of Springer Nature 2020 Abstract Aims and background Population pharmacokinetics with Bayesian forecasting provides for an effective approach when indi- vidualized drug dosing, while phenobarbital is a narrow therapeutic index drug that requires therapeutic drug monitoring. To date, several population pharmacokinetic models have been developed for phenobarbital, these showing a number of significant predictors of phenobarbital clearance and volume of distribution. We have therefore conducted a systematic review to summarize how these predictors affect phenobarbital pharmacokinetics as well as their relationships with pharmacokinetic parameters. Method A systematic search for studies of phenobarbital population pharmacokinetics that were carried out in humans and that employed a nonlinear mixed-effect approaches was made using the PubMed, Scopus, CINAHL Complete, and ScienceDirect databases. The search covered the period from these databases’ inception to March 2020. Results Eighteen studies were included in this review, all of which used a one-compartment structure. The estimated phenobar- bital clearance and volume of distribution ranged from 0.0034 to 0.0104 L/h/kg and 0.37 to 1.21 L/kg, respectively, with body weight, age, and concomitant antiepileptic drugs being the three most frequently identified predictors of clearance. Most models were validated through the use of an advanced internal approach. Conclusion Phenobarbital clearance may be predicted from previously developed population pharmacokinetic models and their significant covariate-parameter relationships along with Bayesian forecasting. However, when applying these models in a target population, an external evaluation of these models using the target population is warranted, and it is recommended that future research be conducted to investigate the link between population pharmacokinetics and pharmacodynamics. Keywords Phenobarbitone . Phenobarbital . Population pharmacokinetics . Systematic review . Nonlinear mixed-effect Background Phenobarbital, a conventional antiepileptic drug (AED), is commonly used for the treatment of generalized and partial seizures, and though its use has declined in favor of the new generation of AEDs, phenobarbital is still widely used for the treatment of neonatal seizures [1], as well as the prevention of neonatal hyperbilirubinemia [2]. In the past, it was also widely used for the prophylaxis of febrile convulsion [3]. Phenobarbital can be administered through a number of different routes including oral, intravenous, intramuscular, or rectal administration [3]. The rate of phenobarbital absorption may be influenced by drugs or diseases that affect gastroin- testinal motility [4] but following oral or rectal dosing, ap- proximately 90% of phenobarbital is bioavailable [4–6]. Phenobarbital distributes to all body tissues, and the volume of distribution (V d ) ranges from 0.5 to 1 L/kg [4]. Newborns have slightly higher V d (0.9 L/kg) [3, 7] than children and adults (0.7 L/kg) [8]. Brain concentrations are well correlated with those of the plasma, and these have ratios ranging from 0.7 to 1 [9, 10]. Phenobarbital primarily binds to albumin, with a differential degree of binding depending on age [4], Electronic supplementary material The online version of this article (https://doi.org/10.1007/s00228-020-03011-x) contains supplementary material, which is available to authorized users. * Janthima Methaneethorn [email protected] 1 Pharmacokinetic Research Unit, Department of Pharmacy Practice, Faculty of Pharmaceutical Sciences, Naresuan University, Phitsanulok 65000, Thailand 2 Center of Excellence for Environmental Health and Toxicology, Naresuan University, Phitsanulok, Thailand 3 Department of Clinical Pharmacy, Faculty of Pharmaceutical Sciences, Burapha University, Chonburi, Thailand European Journal of Clinical Pharmacology https://doi.org/10.1007/s00228-020-03011-x
Transcript of Pharmacokinetic variability of phenobarbital: a systematic ...

REVIEW
Pharmacokinetic variability of phenobarbital: a systematic reviewof population pharmacokinetic analysis
Janthima Methaneethorn1,2& Nattawut Leelakanok3
Received: 17 April 2020 /Accepted: 1 October 2020# Springer-Verlag GmbH Germany, part of Springer Nature 2020
AbstractAims and background Population pharmacokinetics with Bayesian forecasting provides for an effective approach when indi-vidualized drug dosing, while phenobarbital is a narrow therapeutic index drug that requires therapeutic drug monitoring. Todate, several population pharmacokinetic models have been developed for phenobarbital, these showing a number of significantpredictors of phenobarbital clearance and volume of distribution. We have therefore conducted a systematic review to summarizehow these predictors affect phenobarbital pharmacokinetics as well as their relationships with pharmacokinetic parameters.Method A systematic search for studies of phenobarbital population pharmacokinetics that were carried out in humans and thatemployed a nonlinear mixed-effect approaches was made using the PubMed, Scopus, CINAHL Complete, and ScienceDirectdatabases. The search covered the period from these databases’ inception to March 2020.Results Eighteen studies were included in this review, all of which used a one-compartment structure. The estimated phenobar-bital clearance and volume of distribution ranged from 0.0034 to 0.0104 L/h/kg and 0.37 to 1.21 L/kg, respectively, with bodyweight, age, and concomitant antiepileptic drugs being the three most frequently identified predictors of clearance. Most modelswere validated through the use of an advanced internal approach.Conclusion Phenobarbital clearance may be predicted from previously developed population pharmacokinetic models and theirsignificant covariate-parameter relationships along with Bayesian forecasting. However, when applying these models in a targetpopulation, an external evaluation of these models using the target population is warranted, and it is recommended that futureresearch be conducted to investigate the link between population pharmacokinetics and pharmacodynamics.
Keywords Phenobarbitone . Phenobarbital . Population pharmacokinetics . Systematic review . Nonlinear mixed-effect
Background
Phenobarbital, a conventional antiepileptic drug (AED), iscommonly used for the treatment of generalized and partial
seizures, and though its use has declined in favor of the newgeneration of AEDs, phenobarbital is still widely used for thetreatment of neonatal seizures [1], as well as the prevention ofneonatal hyperbilirubinemia [2]. In the past, it was also widelyused for the prophylaxis of febrile convulsion [3].
Phenobarbital can be administered through a number ofdifferent routes including oral, intravenous, intramuscular, orrectal administration [3]. The rate of phenobarbital absorptionmay be influenced by drugs or diseases that affect gastroin-testinal motility [4] but following oral or rectal dosing, ap-proximately 90% of phenobarbital is bioavailable [4–6].Phenobarbital distributes to all body tissues, and the volumeof distribution (Vd) ranges from 0.5 to 1 L/kg [4]. Newbornshave slightly higher Vd (0.9 L/kg) [3, 7] than children andadults (0.7 L/kg) [8]. Brain concentrations are well correlatedwith those of the plasma, and these have ratios ranging from0.7 to 1 [9, 10]. Phenobarbital primarily binds to albumin,with a differential degree of binding depending on age [4],
Electronic supplementary material The online version of this article(https://doi.org/10.1007/s00228-020-03011-x) contains supplementarymaterial, which is available to authorized users.
* Janthima [email protected]
1 Pharmacokinetic Research Unit, Department of Pharmacy Practice,Faculty of Pharmaceutical Sciences, Naresuan University,Phitsanulok 65000, Thailand
2 Center of Excellence for Environmental Health and Toxicology,Naresuan University, Phitsanulok, Thailand
3 Department of Clinical Pharmacy, Faculty of PharmaceuticalSciences, Burapha University, Chonburi, Thailand
European Journal of Clinical Pharmacologyhttps://doi.org/10.1007/s00228-020-03011-x
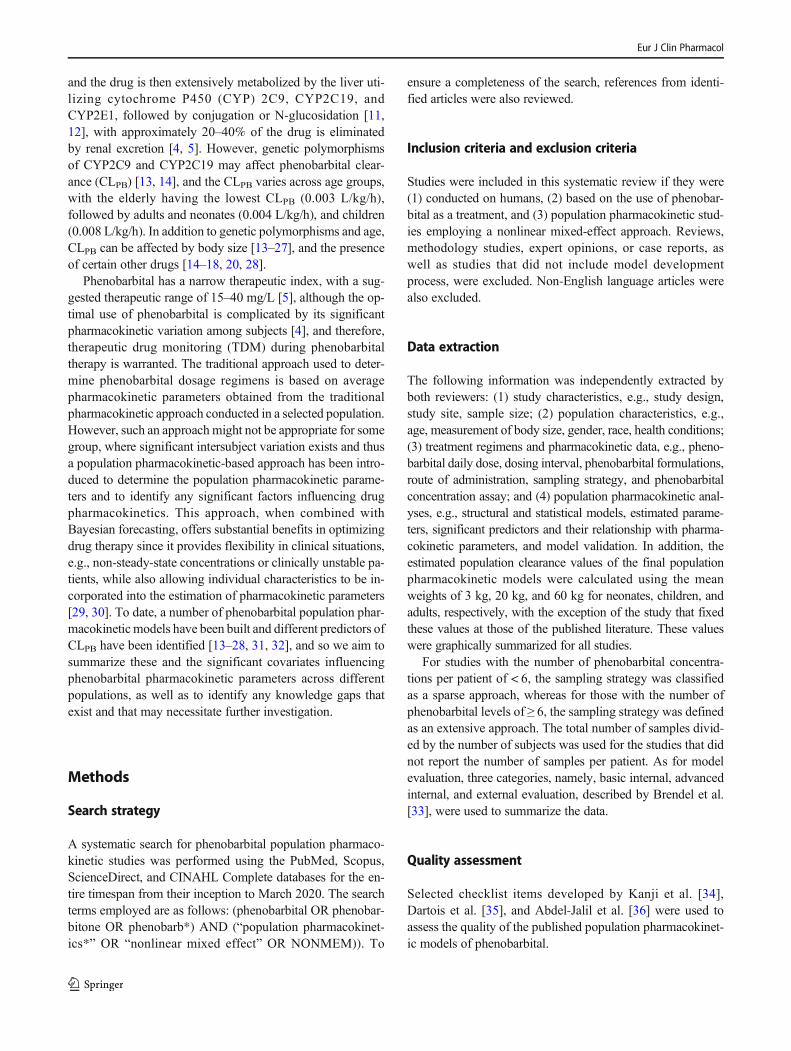
and the drug is then extensively metabolized by the liver uti-lizing cytochrome P450 (CYP) 2C9, CYP2C19, andCYP2E1, followed by conjugation or N-glucosidation [11,12], with approximately 20–40% of the drug is eliminatedby renal excretion [4, 5]. However, genetic polymorphismsof CYP2C9 and CYP2C19 may affect phenobarbital clear-ance (CLPB) [13, 14], and the CLPB varies across age groups,with the elderly having the lowest CLPB (0.003 L/kg/h),followed by adults and neonates (0.004 L/kg/h), and children(0.008 L/kg/h). In addition to genetic polymorphisms and age,CLPB can be affected by body size [13–27], and the presenceof certain other drugs [14–18, 20, 28].
Phenobarbital has a narrow therapeutic index, with a sug-gested therapeutic range of 15–40 mg/L [5], although the op-timal use of phenobarbital is complicated by its significantpharmacokinetic variation among subjects [4], and therefore,therapeutic drug monitoring (TDM) during phenobarbitaltherapy is warranted. The traditional approach used to deter-mine phenobarbital dosage regimens is based on averagepharmacokinetic parameters obtained from the traditionalpharmacokinetic approach conducted in a selected population.However, such an approachmight not be appropriate for somegroup, where significant intersubject variation exists and thusa population pharmacokinetic-based approach has been intro-duced to determine the population pharmacokinetic parame-ters and to identify any significant factors influencing drugpharmacokinetics. This approach, when combined withBayesian forecasting, offers substantial benefits in optimizingdrug therapy since it provides flexibility in clinical situations,e.g., non-steady-state concentrations or clinically unstable pa-tients, while also allowing individual characteristics to be in-corporated into the estimation of pharmacokinetic parameters[29, 30]. To date, a number of phenobarbital population phar-macokinetic models have been built and different predictors ofCLPB have been identified [13–28, 31, 32], and so we aim tosummarize these and the significant covariates influencingphenobarbital pharmacokinetic parameters across differentpopulations, as well as to identify any knowledge gaps thatexist and that may necessitate further investigation.
Methods
Search strategy
A systematic search for phenobarbital population pharmaco-kinetic studies was performed using the PubMed, Scopus,ScienceDirect, and CINAHL Complete databases for the en-tire timespan from their inception to March 2020. The searchterms employed are as follows: (phenobarbital OR phenobar-bitone OR phenobarb*) AND (“population pharmacokinet-ics*” OR “nonlinear mixed effect” OR NONMEM)). To
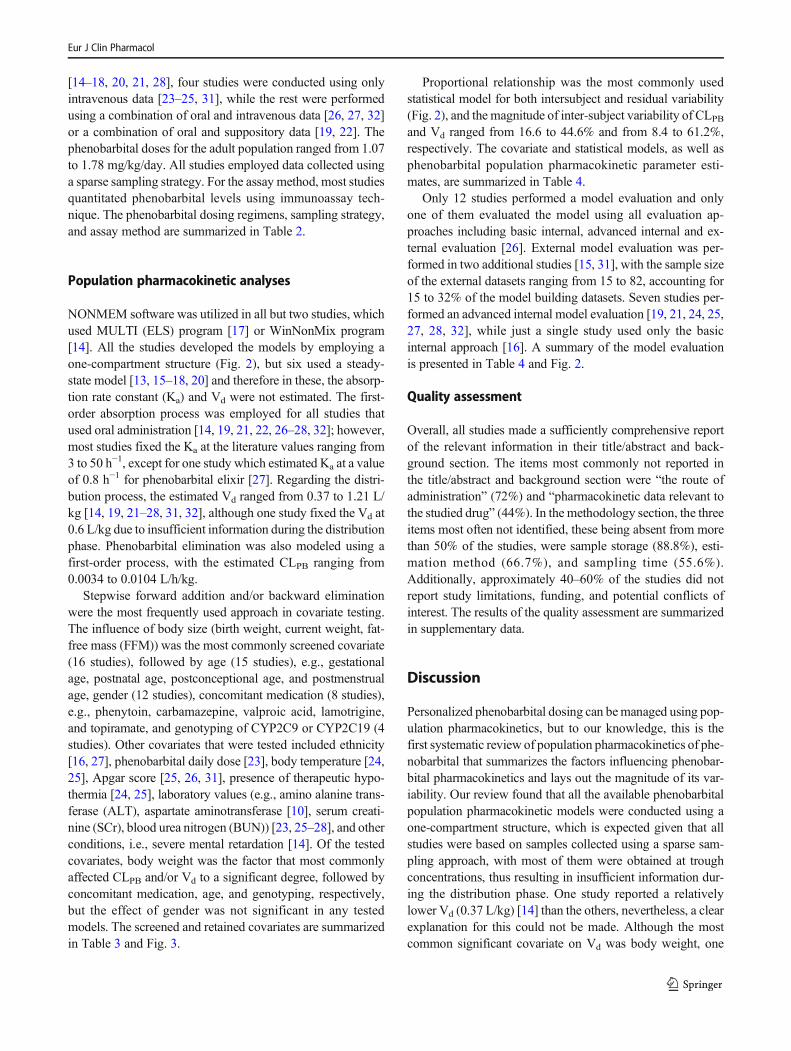
ensure a completeness of the search, references from identi-fied articles were also reviewed.
Inclusion criteria and exclusion criteria
Studies were included in this systematic review if they were(1) conducted on humans, (2) based on the use of phenobar-bital as a treatment, and (3) population pharmacokinetic stud-ies employing a nonlinear mixed-effect approach. Reviews,methodology studies, expert opinions, or case reports, aswell as studies that did not include model developmentprocess, were excluded. Non-English language articles werealso excluded.
Data extraction
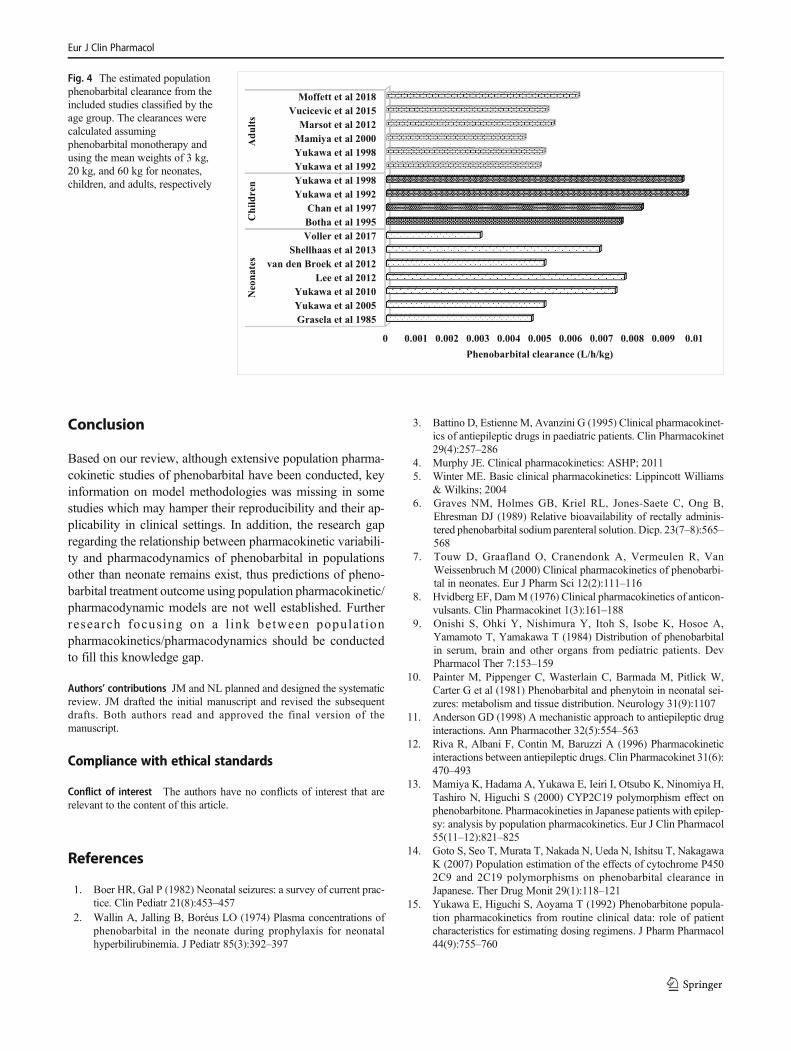
The following information was independently extracted byboth reviewers: (1) study characteristics, e.g., study design,study site, sample size; (2) population characteristics, e.g.,age, measurement of body size, gender, race, health conditions;(3) treatment regimens and pharmacokinetic data, e.g., pheno-barbital daily dose, dosing interval, phenobarbital formulations,route of administration, sampling strategy, and phenobarbitalconcentration assay; and (4) population pharmacokinetic anal-yses, e.g., structural and statistical models, estimated parame-ters, significant predictors and their relationship with pharma-cokinetic parameters, and model validation. In addition, theestimated population clearance values of the final populationpharmacokinetic models were calculated using the meanweights of 3 kg, 20 kg, and 60 kg for neonates, children, andadults, respectively, with the exception of the study that fixedthese values at those of the published literature. These valueswere graphically summarized for all studies.
For studies with the number of phenobarbital concentra-tions per patient of < 6, the sampling strategy was classifiedas a sparse approach, whereas for those with the number ofphenobarbital levels of ≥ 6, the sampling strategy was definedas an extensive approach. The total number of samples divid-ed by the number of subjects was used for the studies that didnot report the number of samples per patient. As for modelevaluation, three categories, namely, basic internal, advancedinternal, and external evaluation, described by Brendel et al.[33], were used to summarize the data.
Quality assessment
Selected checklist items developed by Kanji et al. [34],Dartois et al. [35], and Abdel-Jalil et al. [36] were used toassess the quality of the published population pharmacokinet-ic models of phenobarbital.
Eur J Clin Pharmacol

Results
Study identification and characteristics
The systematic literature search identified 1710 non-redundant articles, and after filtering with the inclusion andexclusion criteria, 18 out of 62 articles were included in thisreview, all of which were published between 1985 and 2018.The reasons for excluding studies are presented in thePRISMA diagram (Fig. 1).
The overall aim of most population pharmacokinetic stud-ies of phenobarbital has been to identify factors influencingphenobarbital pharmacokinetics and to provide population es-timates of the pharmacokinetic parameters. Four studies spe-cifically aimed to determine the effect of polymorphisms ofCYP450 on CLPB [13, 14, 20, 23], while two studies evaluat-ed the effect of therapeutic hypothermia on phenobarbitalpharmacokinetics [24, 25], with one of these [24] determinedthe influence of therapeutic hypothermia on phenobarbitalpharmacodynamics. In addition, one study aimed to determine
the absolute bioavailability of phenobarbital in neonates andinfants [32], while another determined the effectiveness ofenteral phenobarbital administered via a nasogastric tube inthe treatment of childhood status epilepticus [21].
The number of studies conducted prospectively and retro-spectively was approximately equal, and only two were mul-ticenter studies [24, 25]. All studies were conducted either inAsia [13–15, 17–20, 22, 23] or in Europe [16, 21, 24–28, 31,32], and overall, the studies had a median sample sizes of 62(with a range of 16–539) and a median number of phenobar-bital samples of 144 (with a range of 31–1002). Three studieswere conducted solely on adults [13, 20, 28], three were car-ried out on both pediatrics and adults [14, 15, 18], and theremainder were performed on pediatrics. Table 1 summarizesthe characteristics of the included studies.
Pharmacokinetic data
Though the majority of the studies developed their modelsusing data drawn exclusively from oral administration
Records identified through
databases searching
(n = 1,780)
gnineercSIn
clud
edytilibigilE
noitacifitnedI
Additional records identified
through other sources
(n = 0)
Records after duplicates removed
(n =1,710)
Records screened
(n =1,710)
Records excluded
(n = 1,648)
Full-text articles assessed
for eligibility
(n = 62)
Full-text articles excluded, with
reasons (n = 44)34: were not-population pharmacokinetic
studies
4: were reviews or commentary
2: provided insufficient information
1: was not a model development study
1: did not use nonlinear-mixed effect
modeling approach
1: was not a human study
1: provided no phenobarbital PK parameters
Studies included in
qualitative synthesis
(n = 18)
Fig. 1 A PRISMA diagram of the study identification
Eur J Clin Pharmacol

Table1
Characteristicsof
thestudiedpopulatio
n
No
Study
Country
Center
NMale(%
)Female
(%)
Meanage(range)
Meanweight(range)
Patient
characteristics
Co-medication
causingdrug
nteractio
n
Genotypes
1Graselaet
al.1985
[31]
USA
Single
5935
(59.3)
24(40.7)
GA:3
1.0±4.1
weeks
(24–42
weeks)
1.52
±0.7kg
(0.6–3.62kg)
Neonatesin
ICU
receiving
PBforprevention
ofintraventricular
hemorrhage
andtreatm
ento
fseizure
NR(the
majority
received
PBmonotherapy)
No
2Yukaw
aetal.
1992
[15]
Japan
Single
Total:5
39286(53.1)
253(47.0)
Pediatrics
andadults
with
epilepsy
VPA
,otherAEDs
No
PB:2
22PB
:8.67±5.6years
PB:2
7.98
±16.17kg
PB+AEDs
(noVPA
):136
PB+AEDs(no
VPA
):12.63±6.65
y
PB+AEDs(noVPA
):36.36±16.55kg
PB+AEDs
(with
VPA
):181
PB+AEDs(w
ithVPA
):11.88±
5.78
years
PB+AEDs(w
ithVPA
):34.33±17.29kg
3Botha
etal.
1995
[16]
South
Africa
Single
3224
(75)
8(25)
5.5±3.2years
20.4±9.6kg
African
andIndian
children
VPA
No
4Chanetal.
1997
[17]
HongKong
Single
6524
(36.9)
41(63.1)
8.84
±4.09
years
(2.5–16years)
15.44±5.29
kg(7–30kg)
Inpatients,severe
psychomotor
andgrow
thretardation,
unableto
walkor
feed
them
selves
CBZ,C
BZ+PH
T,
PHT
No
5Yukaw
aetal.
1998
[18]
Japan
NR
349
PB:2
22PB
+CBZ:6
3PB
+VPA
:64
[37]
[38]
10.4±6.4years
(0.4–33.3years
32.0±17.7
kg(6.0–93.0kg)
Pediatricandadult
epilepticpatients
CBZ,V
PANo
6Mam
iya
etal.
2000
[13]
Japan
Single
7442
(56.8)
32(43.2)
50.5±13.4
years
(17–76
years)
59.0±11.0
kg(35–85
kg)
Adultpatientswith
epilepsy
CBZ,Z
NS,
DZP,
CZP,
NZP,
acetazolam
ide,
sulth
iame,
acetylpheneturide
No
7Yukaw
aetal.
2005
[19]
Japan
Single
3519
(54.3)
16(45.7)
PNA:2
0.8±
21.3
days
(1–73)
GA:3
8.6±2.5
weeks
(30–42.1)
CurrentBW:2888±757.2g
(1312–5240
g)BornBW:2
812.1±704.8g
(1290–4004
g)
Neonatesandinfants
NR
No
8Yukaw
aetal.
2006
[20]
Japanese
NR
7442
(556.8)
32(43.2)
50.5±13.4
years
59.0±11.0
kgAdultpatientswith
epilepsy
PHT
Yes
*1/*1:
53*1/*2:
47*1/*3:
17*2/*2,*2/*3,
*3/*3:
159
Gotoetal.
2007
[14]
Japan
Single
7947
(59.5)
32(40.5)
CYP2
C9*1/*1:
13.8±8.9years
(0.8–43.8years)
CYP2
C9*1/*1:
35.4±18.1
kg(8.5–80.2kg)
Pediatricandadult
epilepticpatients
CBZ,V
PA,P
HT,
ZNS,
CZP,
CLO
Yes
CYP2
C9
(*1/*1,
*1/*3)
CYP2
C9*1/*3:
CYP2
C9*1/*3:
Eur J Clin Pharmacol

Tab
le1
(contin
ued)
No
Study
Country
Center
NMale(%
)Female
(%)
Meanage(range)
Meanweight(range)
Patient
characteristics
Co-medication
causingdrug
nteractio
n
Genotypes
CYP2
C19
(*1/*1,
*1/*2,
*1/*3,
*2/*2,
*2/*3)
12.6±6.9years
(2.9–19.9years)
31.0±12.5
kg(12–42.6
kg)
10Wilm
shurst
etal.
2010
[21]
South
Africa
Single
169(56.3)
7(43.7)
Median:
5months
(6days-168
months)
Median:
5.8kg
(2.6–24kg)
Inpatient
with
status
epilepticus
and
nasogastric
tube),septicem
ia(n=7),
meningitis
(n=1),
gastroenteritis
(n=2),
pneumonia(n=1),
otitismedia(n=1)
PHT
No
11Yukaw
aetal.
2011
[22]
Japan
Single
7039
(55.7)
31(44.3)
PNA:1
5.8±18.5
days
(1–73days)
GA: 38.2±3.4weeks
(24.1–43
weeks)
Current
BW:2
870±779g
(670–5240g)
Birth
BW:2
856±735g
(670–4654g)
Neonatesandinfants
No
No
12Lee
etal.
2012
[23]
Korea
Single
44dividedinto
2groups:g
r1
(8days-3
months),
gr2(4–6
months)
25(56.8)
19(43.2)
Hospitalized
neonates
andinfants
No
Yes
WT(*1/*1),
EM
(*1/*2,
*1/*3),
PM(*2/*2,
*2/*3):
WT: 2.4±1.9months
WT:5
.0±2.7kg
EM: 1.4±1.6months
EM:5
.3±4.3kg
PM: 3.3±2.5months
PM:6
.4±3.1kg
13Van
den
Broek
etal.
2012
[24]
Netherlands
Multi
3118
(58.1)
13(41.9)
GA:3
9.9weeks
(36.0–42.1
weeks)
3.62
kg(2.15–4.92
kg)
New
bornswith
gestational
ageof
atleast
36weeks
No
No
14Sh
ellhaas
etal.
2013
[25]
USA
Multi
(reviewed
from
Vermont-
Oxford
Database)
3924
(61.5)
15(38.5)
GA: 39.5±1.7weeks
Birth
WT:3
493±578g
Neonateswith
gestational
age>36
weeks
treated
forseizures
with
PBdiagnosedwith
HIE
NR
No
15Marsot
etal.
2014
[32]
France
NR
4829
(60.4)
19(39.6)
GA:37.1±3.3week
(27–42
weeks)
PNA:
26.8±64.0
days
(0–206
days)
4.26
±3.19
kg(0.7–10kg)
Neonatesandyoung
infantsin
ICU
No
No
16Vucicevic
etal.
Serbia
Single
136
69(50.7)
67(49.3)
42.4±13.0y
73.04±14.20kg
Adultoutpatients
diagnosed
VPA
,CBZ,T
PM,
LTG
No
Eur J Clin Pharmacol

Tab
le1
(contin
ued)
No
Study
Country
Center
NMale(%
)Female
(%)
Meanage(range)
Meanweight(range)
Patient
characteristics
Co-medication
causingdrug
nteractio
n
Genotypes
2015
[28]
epilepsyon
mono-,
orco-therapy
with
PB17
Volleretal.
2017
[26]
Netherlands
Single
53NR
NR
Retrospective:GA:
37weeks
(24–42
weeks)
Retrospectiv
e:PN
A:
4.5days
(0–22days)
Prospective:GA:2
5weeks
(24–31
weeks)
ProspectivePN
A:
15days
(1–76days)
Retrospectiv
e:2.7kg
(0.45–4.5kg)
Prospective:1.07
kg(0.63–4.7kg)
Neonatesyounger
than
35days
NR
No
18Moffett
etal.
2018
[27]
USA
Single
355
(50.3)
(49.7)
GA:m
edian39
week
age:median0.28
yPM
A:m
edian
50.6
years
Median:
4.9kg
Childrenaged
<19
onIV
ororalPB
F-PH
T,O
XC
ZNS,TPM
,MID
AZ
PHT,L
TG,V
PA,
RFP
,FB
M,V
GB,
LPZ
,FC
Z,P
ANTOP,
MTZ
No
AEDsantiepilepticdrugs,CBZcarbam
azepine,CLO
clobazam
,CZP
clonazepam
,DZP
diazepam
,EM
extensivemetabolizer,F
BM
felbam
ate,FCZfluconazole,F-PHTfosphenytoin,G
Agestationalage,
HIE
hypoxic-ischem
icencephalopathy,ICU
intensivecare
unit,
IVintravenous,LP
Zlansoprazole,MID
AZmidazolam
,MTZ
metronidazole,Nsamplesize,NRnotreported,NZP
nitrazepam
,OXC
oxcabazepine,P
Bphenobarbital,PHTphenytoin,PM
poor
metabolizer,P
NApostnatalage,P
MApostmenstrualage,PANTO
Ppantoprazole,R
FPrifampicin,TP
Mtopiramate,USA
theUnitedStates
ofAmerica,VGBvigabatrin,V
PAvalproicacid,W
Twild
type,Z
NSzonisamide
Eur J Clin Pharmacol
[14–18, 20, 21, 28], four studies were conducted using onlyintravenous data [23–25, 31], while the rest were performedusing a combination of oral and intravenous data [26, 27, 32]or a combination of oral and suppository data [19, 22]. Thephenobarbital doses for the adult population ranged from 1.07to 1.78 mg/kg/day. All studies employed data collected usinga sparse sampling strategy. For the assay method, most studiesquantitated phenobarbital levels using immunoassay tech-nique. The phenobarbital dosing regimens, sampling strategy,and assay method are summarized in Table 2.
Population pharmacokinetic analyses
NONMEM software was utilized in all but two studies, whichused MULTI (ELS) program [17] or WinNonMix program[14]. All the studies developed the models by employing aone-compartment structure (Fig. 2), but six used a steady-state model [13, 15–18, 20] and therefore in these, the absorp-tion rate constant (Ka) and Vd were not estimated. The first-order absorption process was employed for all studies thatused oral administration [14, 19, 21, 22, 26–28, 32]; however,most studies fixed the Ka at the literature values ranging from3 to 50 h−1, except for one study which estimated Ka at a valueof 0.8 h−1 for phenobarbital elixir [27]. Regarding the distri-bution process, the estimated Vd ranged from 0.37 to 1.21 L/kg [14, 19, 21–28, 31, 32], although one study fixed the Vd at0.6 L/kg due to insufficient information during the distributionphase. Phenobarbital elimination was also modeled using afirst-order process, with the estimated CLPB ranging from0.0034 to 0.0104 L/h/kg.
Stepwise forward addition and/or backward eliminationwere the most frequently used approach in covariate testing.The influence of body size (birth weight, current weight, fat-free mass (FFM)) was the most commonly screened covariate(16 studies), followed by age (15 studies), e.g., gestationalage, postnatal age, postconceptional age, and postmenstrualage, gender (12 studies), concomitant medication (8 studies),e.g., phenytoin, carbamazepine, valproic acid, lamotrigine,and topiramate, and genotyping of CYP2C9 or CYP2C19 (4studies). Other covariates that were tested included ethnicity[16, 27], phenobarbital daily dose [23], body temperature [24,25], Apgar score [25, 26, 31], presence of therapeutic hypo-thermia [24, 25], laboratory values (e.g., amino alanine trans-ferase (ALT), aspartate aminotransferase [10], serum creati-nine (SCr), blood urea nitrogen (BUN)) [23, 25–28], and otherconditions, i.e., severe mental retardation [14]. Of the testedcovariates, body weight was the factor that most commonlyaffected CLPB and/or Vd to a significant degree, followed byconcomitant medication, age, and genotyping, respectively,but the effect of gender was not significant in any testedmodels. The screened and retained covariates are summarizedin Table 3 and Fig. 3.
Proportional relationship was the most commonly usedstatistical model for both intersubject and residual variability(Fig. 2), and the magnitude of inter-subject variability of CLPB
and Vd ranged from 16.6 to 44.6% and from 8.4 to 61.2%,respectively. The covariate and statistical models, as well asphenobarbital population pharmacokinetic parameter esti-mates, are summarized in Table 4.
Only 12 studies performed a model evaluation and onlyone of them evaluated the model using all evaluation ap-proaches including basic internal, advanced internal and ex-ternal evaluation [26]. External model evaluation was per-formed in two additional studies [15, 31], with the sample sizeof the external datasets ranging from 15 to 82, accounting for15 to 32% of the model building datasets. Seven studies per-formed an advanced internal model evaluation [19, 21, 24, 25,27, 28, 32], while just a single study used only the basicinternal approach [16]. A summary of the model evaluationis presented in Table 4 and Fig. 2.
Quality assessment
Overall, all studies made a sufficiently comprehensive reportof the relevant information in their title/abstract and back-ground section. The items most commonly not reported inthe title/abstract and background section were “the route ofadministration” (72%) and “pharmacokinetic data relevant tothe studied drug” (44%). In the methodology section, the threeitems most often not identified, these being absent from morethan 50% of the studies, were sample storage (88.8%), esti-mation method (66.7%), and sampling time (55.6%).Additionally, approximately 40–60% of the studies did notreport study limitations, funding, and potential conflicts ofinterest. The results of the quality assessment are summarizedin supplementary data.
Discussion
Personalized phenobarbital dosing can bemanaged using pop-ulation pharmacokinetics, but to our knowledge, this is thefirst systematic review of population pharmacokinetics of phe-nobarbital that summarizes the factors influencing phenobar-bital pharmacokinetics and lays out the magnitude of its var-iability. Our review found that all the available phenobarbitalpopulation pharmacokinetic models were conducted using aone-compartment structure, which is expected given that allstudies were based on samples collected using a sparse sam-pling approach, with most of them were obtained at troughconcentrations, thus resulting in insufficient information dur-ing the distribution phase. One study reported a relativelylower Vd (0.37 L/kg) [14] than the others, nevertheless, a clearexplanation for this could not be made. Although the mostcommon significant covariate on Vd was body weight, one
Eur J Clin Pharmacol
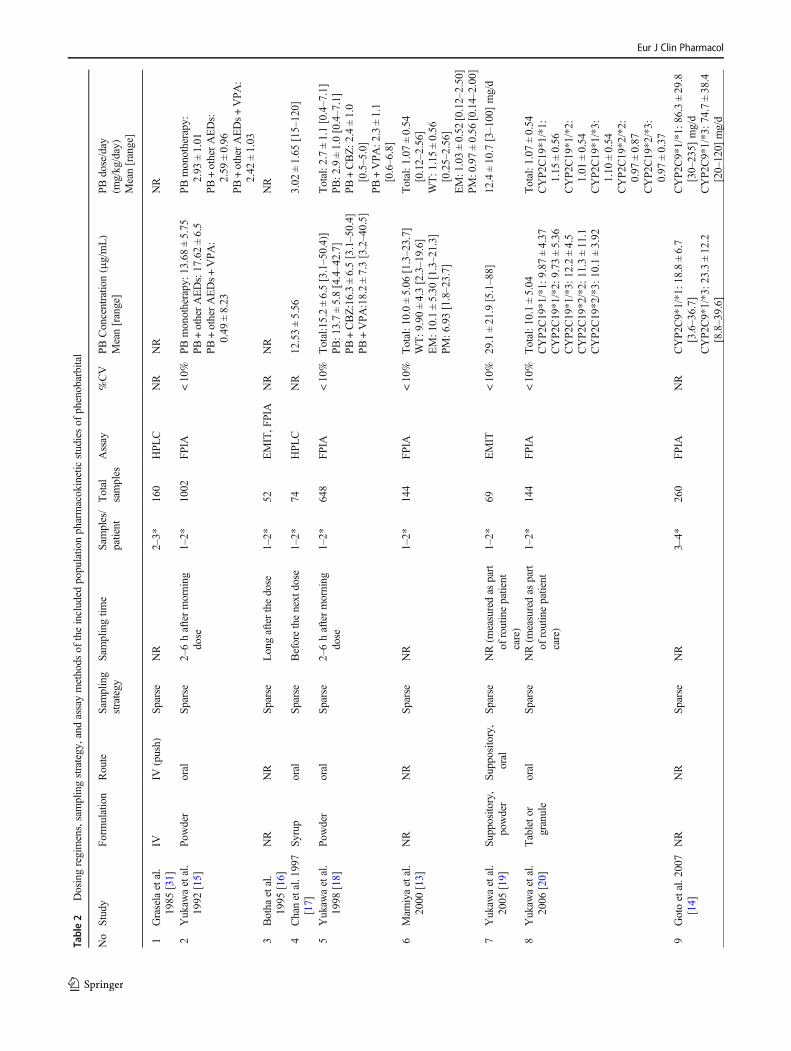
Table2
Dosingregimens,samplingstrategy,and
assaymethods
oftheincluded
populatio
npharmacokineticstudiesof
phenobarbital
No
Study
Form
ulation
Route
Sampling
strategy
Sam
plingtim
eSam
ples/
patient
Total
samples
Assay
%CV
PBConcentratio
n(μg/mL)
Mean[range]
PBdose/day
(mg/kg/day)
Mean[range]
1Graselaetal.
1985
[31]
IVIV
(push)
Sparse
NR
2–3*
160
HPL
CNR
NR
NR
2Yukaw
aetal.
1992
[15]
Powder
oral
Sparse
2–6haftermorning
dose
1–2*
1002
FPIA
<10%
PBmonotherapy:1
3.68
±5.75
PB+otherAEDs:17.62±6.5
PB+otherAEDs+VPA:
0.49
±8.23
PBmonotherapy:
2.93
±1.01
PB+otherAEDs:
2.59
±0.96
PB+otherAEDs+VPA:
2.42
±1.03
3Botha
etal.
1995
[16]
NR
NR
Sparse
Longafterthedose
1–2*
52EMIT,F
PIA
NR
NR
NR
4Chanetal.1997
[17]
Syrup
oral
Sparse
Beforethenext
dose
1–2*
74HPL
CNR
12.53±5.56
3.02
±1.65
[15–120]
5Yukaw
aetal.
1998
[18]
Powder
oral
Sparse
2–6haftermorning
dose
1–2*
648
FPIA
<10%
Total:15.2±6.5[3.1–50.4)]
PB:1
3.7±5.8[4.4–42.7]
PB+CBZ:16.3±6.5[3.1–50.4]
PB+VPA
:18.2±7.3[3.2–40.5]
Total:2
.7±1.1[0.4–7.1]
PB:2
.9±1.0[0.4–7.1]
PB+CBZ:2
.4±1.0
[0.5–5.0]
PB+VPA:2
.3±1.1
[0.6–6.8]
6Mam
iyaetal.
2000
[13]
NR
NR
Sparse
NR
1–2*
144
FPIA
<10%
Total:1
0.0±5.06
[1.3–23.7]
WT:9
.90±4.3[2.3–19.6]
EM:1
0.1±5.30
[1.3–21.3]
PM:6
.93[1.8–23.7]
Total:1
.07±0.54
[0.12–2.56]
WT:1
.15±0.56
[0.25–2.56]
EM:1.03±0.52
[0.12–2.50]
PM:0.97±0.56
[0.14–2.00]
7Yukaw
aetal.
2005
[19]
Supposito
ry,
powder
Supposito
ry,
oral
Sparse
NR(m
easuredas
part
ofroutinepatient
care)
1–2*
69EMIT
<10%
29.1±21.9[5.1–88]
12.4±10.7
[3–100]mg/d
8Yukaw
aetal.
2006
[20]
Tableto
rgranule
oral
Sparse
NR(m
easuredas
part
ofroutinepatient
care)
1–2*
144
FPIA
<10%
Total:1
0.1±5.04
CYP2
C19*1/*1:
9.87
±4.37
CYP2
C19*1/*2:
9.73
±5.36
CYP2
C19*1/*3:
12.2±4.5
CYP2
C19*2/*2:
11.3±11.1
CYP2
C19*2/*3:
10.1±3.92
Total:1
.07±0.54
CYP2
C19*1/*1:
1.15
±0.56
CYP2
C19*1/*2:
1.01
±0.54
CYP2
C19*1/*3:
1.10
±0.54
CYP2
C19*2/*2:
0.97
±0.87
CYP2
C19*2/*3:
0.97
±0.37
9Gotoetal.2007
[14]
NR
NR
Sparse
NR
3–4*
260
FPIA
NR
CYP2
C9*1/*1:1
8.8±6.7
[3.6–36.7]
CYP2
C9*1/*3:2
3.3±12.2
[8.8–39.6]
CYP2
C9*1/*1:8
6.3±29.8
[30–235]
mg/d
CYP2
C9*1/*3:7
4.7±38.4
[20–120]
mg/d
Eur J Clin Pharmacol

Tab
le2
(contin
ued)
No
Study
Form
ulation
Route
Sampling
strategy
Sam
plingtim
eSam
ples/
patient
Total
samples
Assay
%CV
PBConcentratio
n(μg/mL)
Mean[range]
PBdose/day
(mg/kg/day)
Mean[range]
10Wilm
shurst
etal.2010
[21]
NR
nasogastric
tube
Sparse
1h,4h,12
h,and24
hafterthedose
431
FPIA
NR
[10.5–65.7]
MedianLD:2
0[20–80]
11Yukaw
aetal.
2011
[22]
Supposito
ry,
powder
Supposito
ry,
oral
Sparse
NR(routin
edata
monito
ring)
1–2*
109
EMIT
<10%
25.6±18.6[5.4–88]
14.8±13.5
[3–100]mg/d
12Lee
etal.2012
[23]
IVIV
Sparse
Beforethenext
dose
1–4
115
FPIA
NR
8d–3mo
CYP2C
19*1/*1:
29.6[17.0–38.2]
CYP2
C19*1/*2,
*1/*3:
27.8
[19.9–61.8]
CYP2C
19*2/*2,
*2/*3:
24.8
[20.3–33.7]
4–6mo
22.3 [15.3–2-
6.7]
16.4 [12.7–2-
9.7]
14.0 [9.1–22-
.2]
CYP2
C19*1/*1:
LD:25.6±4.6,MD:
5.1±0.5
CYP2
C19*1/*2,*1/*3:LD:
23.1±3.4,MD:5
.0±0.3
CYP2
C19*2/*2,*2/*3:LD:
26.7±2.8,MD:5
.1±0.4
13Van
denBroek
etal.2012
[24]
IVIV
Sparse
Longafterthedose
1–4
87FP
IA<10%
9.0–37.1
LD:2
0[5–40]
14Sh
ellhaasetal.
2013
[25]
IVIV
Sparse
NR
4–5*
164
NR
NR
NR
NR
15Marsotetal.
2014
[32]
IV, suspen-
sion
IV,oral
Sparse
NR
1–2*
94Im
munoassay
NR
26±9.8[7.0–53.3]
4.6±1.6[3.1–10.6]
16Vucicevicetal.
2015
[28]
Tablet
Oral
Sparse
NR
1–2*
205
EMIT
NR
19.26±9.003
130.2±58.37mg/d
17Volleretal.
2017
[26]
NR
IV,O
ral
Sparse
NR
4–5*
229
FPIA
<10%
[3.2-75.2]
LD:2
0[4–40.7],
MD:3
.9[1.3–20]
18Moffettetal.
2018
[27]
IV,E
lixir
IV,O
ral
Sparse
Median6.5hafterd
ose
(IQR:2
.9–11.1)
NR
NR
CMIA
<5%
41.1±23.9
Oral:median2.6
[IQR:1.9–3.9]
mg/kg/dose
IV:m
edian2.6[IQR:
2.2–4.9]
mg/kg/dose
*calculatedusingthenumberof
totalsam
ples
andsamplesize
CMIA
chem
iluminescentmicroparticleim
munoassay,d
day,EM
extensivemetabolizer,E
MIT
enzymemultip
liedim
munoassay
technique,FPIA
fluorescence
polarizatio
nim
munoassay,IQRinter-quartile
range,IV
intravenous,LD
loadingdose,M
Dmaintenance
dose,m
omonth,N
Anotapplicable,N
Rnotreported,PM
poor
metabolizer,W
Twild
type
Eur J Clin Pharmacol

study accounted for the effect of body size using FFM basedon the greater reduction of the objective function value.However, such covariate might not be easily applied in clini-cal settings. Further, one study reported that a 5-min Apgarscore of less than 5 resulted in an increase in Vd by 13% [31],which could be explained by the metabolic acidosis, resultedfrom asphyxia [39]. Phenobarbital is a weak acid with a pKaof 7.3, thus variations in blood pH can affect the Vd of phe-nobarbital, with the decrease in blood pH resulting in a signif-icant increase in Vd of phenobarbital [40, 41]. However, otherstudies did not find such an effect on Vd [25, 26], and theApgar score alone cannot be used as evidence for asphyxia[42], but despite this, a 5-min Apgar score of less than 5 had a
high degree of concordance with metabolic acidemia [39]which could explain the 13% increase in Vd observed byGrasela et al. [31]. Waddell et al. also reported a significantincrease in Vd of phenobarbital due to a decrease in blood pH[41], and further studies should be conducted to confirm thisresult. As for the effect of age on Vd, inconsistent results werereported, these showing either a decrease [27] or a less thanproportional increase with increasing age [23]. In general,neonates and infants have a relatively large Vd compared toadults and elderly [4] which may be due to decreased bindingto plasma proteins [43].
As regards CLPB, body size was the most commonly iden-tified significant covariate of this parameter, with one study
a b
c d
1-CMT steady-state model 33%
1-CMT with first-order elimina�on
22%
1-CMT with first-order absorp�on and
elimina�on45%
Addi�ve17%
Exponen�al28%
Propor�onal44%
Not reported11%
Addi�ve17%
Exponen�al28%
Propor�onal44%
Not reported11%
Basic internal5%
Advanced internal 39%
External 11%
All6%
Basic and Advanced internal 6%
Not reported33%
Fig. 2 The information on the structural models (a), statistical models (inter-individual (b), and residual (c) variability), and model evaluation (d)described in the included studies
Eur J Clin Pharmacol
Table3
Screened
andsignificantcovariatesin
thepopulatio
npharmacokineticsof
phenobarbital
No
Study
Screened
covariates
Bodysize
Age
Gender
Race
Concomitant
medication
Genotype
1Graselaetal.1985[31]
√(Birthweight)
√(GA)
√2
Yukaw
aetal.1992[15]
√(TBW)
√√(A
EDs)
3Botha
etal.1995[16]
√(TBW)
√√
√√(PHT,C
BZ)
4Chanetal.1997[17]
√(TBW)
√√
√(PHT,C
BZ)
5Yukaw
aetal.1998[18]
√(TBW)
√√
√(V
PA,C
BZ)
6Mam
iyaetal.2000[13]
√(TBW)
√7
Yukaw
aetal.2005[19]
√(TBW)
√(G
A,P
NA,P
CA)
√8
Yukaw
aetal.2006[20]
√(TBW)
√(PHT)
√9
Gotoetal.2007[14]
√(TBW)
√√
√(PHT,V
PA)
√10
Wilm
shurstetal.2010[21]
11Yukaw
aetal.2011[22]
√(TBW)
√(G
A,P
NA,P
CA)
√12
Lee
etal.2012[23]
√(TBW)
√√
√13
Van
denBroek
etal.2012[24]
√(TBW)
14Sh
ellhaasetal.2013[25]
√(TBW)*
√(G
A,P
NA)
15Marsotetal.2014
[32]
√(G
A,P
NA)
√16
Vucicevicetal.2015[28]
√(TBW)
√√
√LTG,T
PM,C
BZ,V
PA
17Volleretal.2017[26]
√(birthweight,TBW,height)
√(G
A,P
NA)
√18
Moffettetal.2018[27]
√(FFM)
√(actualage,P
MA)
√√
√(PHT,M
DZ,P
ANTOP)
No
Screened
covariates
Significantcovariates
Other
Bodysize
Age
Gender
Concomitant
medication
Genotype
Other
1Apgar
score
Apgar
score
2√(TBW)
√(A
EDs)
3√(TBW)
√(PHT,C
BZ)
4√(TBW)
√(PHT,C
BZ)
5√(TBW)
√(V
PA,C
BZ)
6√(TBW)
√(CYP2
C19
PM)
7√(TBW)
√(PNA)
8√(TBW)
√(PHT)
√(CYP2-
C19*1/*3,*2/*2,*2/*3)
9√(SMID
)√(TBW)
√(PHT,V
PA)
√(CYP2
C9*1/*3)
√(SMID
)
10 11√Neonates-infantsclearancefactor
√(TBW)
√(PNA)
Eur J Clin Pharmacol

reporting on the significance of FFM for CLPB and a furtherfourteen doing so for body weight. The influence of body sizeon CLPB was mostly explained using a power relationship[13–15, 18, 20, 23–25, 27, 32], while two studies used anexponential [16, 17], and the other three utilized a linear rela-tionship [26]. The effect of weight on CLPB is variable, withsome studies showing a decrease in CLPB with an increase inbodyweight [13, 15–18, 20]. No definite explanation could bemade on this finding, but it may be due to the decrease in livervolume per unit of body weight that occurs during childhoodwith increasing age [44] or it might be due to the decrease inthe intrinsic activity of the liver with greater age [45]. In con-trast, some studies found an increase in CLPB with bodyweight [14, 19, 22] which could be explained by the matura-tion of liver enzymes with higher weight.
Age was a significant covariate of CLPB in children, neo-nates, and infants [19, 22, 23, 25–27], with CLPB shown toincrease with age. This is unsurprising since a greater age isrelated to hepatic enzyme maturity in these populations, forexample, with equal bodyweight, an older newborn shouldhave a higher CLPB than a younger newborn, and phenobar-bital dose should be increased accordingly.
Co-administration of phenobarbital with phenytoin,carbamazepine, or valproic acid significantly decreasedCLPB [14–18, 20, 27, 28]; however, due to the differenceof population characteristics among studies, a comparisonof the magnitude of drug-drug interaction across studieswas not performed. As expected, the concomitant admin-istration of phenobarbital with valproic acid, a CYP450inhibitor, reduced CLPB. This effect is well describedelsewhere [46–48], but the effects of phenytoin, aCYP450 inducer, on phenobarbital levels are controver-sial [49]. Some studies reported an increase in phenobar-bital levels [38, 50], whereas another study failed to ob-serve any significant elevation [51]. Nonetheless, resultsfrom population pharmacokinetic models confirm the for-mer finding, and this may be rationalized by the compet-itive inhibition of phenobarbital hydroxylation by phenyt-oin [37, 52]. Similar to the effect of phenytoin, the influ-ence of carbamazepine on phenobarbital pharmacokineticsis inconclusive. Some studies reported no effect of carba-mazepine on phenobarbital levels in adults [53, 54], whilethe other reported a decrease in CLPB when co-administered with carbamazepine in children [55], andresults from population pharmacokinetic studies supportthe view that when carbamazepine is administered concur-rently, this reduces phenobarbital clearance. Notably,Yukawa et al. proposed that the effects of carbamazepineon CLPB are maximal in early childhood, and decline in aweight-based fashion in children, with only minimalchanges found in adults [18]. Further, one study found a24% decrease in CLPB when co-administered with mid-azolam, and about 25% increase in CLPB when co-T
able3
(contin
ued)
√(PB
conc
>50
μg/m-
L)
12PB
dose,L
ab(A
LT,A
ST,T
P,A
LB,B
UN,
SCr)
√(TBW
onCLandVd)
√(onVd)
13Bodytemperature
14LFT
,Apgar
scores,therapeutichypothermia
√*(onCLandVd)
√(PNAon
CL)
15 16Lab
(ALT,A
ST,S
Cr)
√(V
PA)
17LFT,R
FT,A
PGARscore
√(birthweighto
nCL,T
BW
onVd)
√(PNAon
CL)
18SC
r,Urine
output,A
ST,A
LT,bodytemp,
ALB,B
UN
√(FFM
onCLandVd)
√(PMAon
CL,actualage
onVd)
√(PHT,M
IDAZ,
PANTOP)
√ Scr
*allo
metricscaling
ALT
alanineam
inotransferase,A
LBalbumin,A
STaspartateam
inotransferase,B
UNbloodurea
nitrogen,C
BZcarbam
azepine,CLclearance,CYP
2C19
PM
CYP2
C19
poormetabolizers,FFM
fatfreemass,
GAgestationalage,LF
Tliv
erfunctio
ntest,L
TGlamotrigine,M
IDAZmidazolam
,PANTO
Ppantoprazole,P
Bphenobarbital,PCApostconceptio
nalage,PHTphenytoin,
PMApostmenstrualage,PNA
postnatalage,R
FTrenalfunctiontest,SCrserum
creatin
ine,SM
IDsevere
mentalretardatio
n,TB
Wtotalb
odyweight,TP
totalp
rotein,T
PM
topiramate,Vdvolumeof
distributio
n,VPAvalproicacid
Eur J Clin Pharmacol

administered with pantoprazole [27]. Midazolam is a sub-strate of CYP3A4 which is not associated with phenobar-bital metabolism [56]; therefore, future studies should beconducted to confirm this finding. As for pantoprazole, itis known to induce CYP2C19 [57]; hence, an increase inCLPB is expected when co-administered with this drug.
Two population pharmacokinetic studies [13, 20] showed asignificant decrease in CLPB in the poor metabolizers(CYP2C19*2/*2, CYP2C19*2/*3) compared to the homozy-gous (CYP2C19*1/*1) or heterozygous (CYP2C19*1/*2,CYP2C19*1/*3) extensive metabolizers. In addition, a lowerCLPB was observed in the heterozygous group, compared tothat of the homozygous extensive metabolizers. However, itshould be noted that these two studies excluded the effects ofCYP2C9 polymorphisms (CYP2C9*1/*1 vs CYP2C9*1/*3)from the analysis. In contrast to these results, another studyfound no significant effect of CYP2C19 polymorphisms onCLPB after accounting for the effect of CYP2C9 polymor-phisms [14]; nonetheless, the number of subjects withCYP2C9*1/*3 was relatively small and no model validationwas performed. Given the limitations of the aforementionedstudies, the influence of CYP2C9 and CYP2C19 polymor-phisms should be confirmed simultaneously with larger sam-ple size. Such findings will be of importance in individualizedphenobarbital therapy, particularly when adjusting dosage re-gimes for patients from a diverse range of ethnic backgrounds.
Phenobarbital is eliminated by both hepatic metabolismand renal excretion, with the magnitude of the latter varyingby approximately 20–40% in subjects with normal renal func-tion [4]. Of all the published population pharmacokinetics ofphenobarbital, only one found that renal function (representedas serum creatinine) had a significant effect on CLPB [27], andas expected, this showed a linear decrease in CLPB with anincrease in serum creatinine.
Therapeutic hypothermia is a treatment commonly used forneonates with hypoxic-ischemic encephalopathy (HIE), and attimes, phenobarbital is administered to a patient undergonetherapeutic hypothermia experiencing seizures, but no signif-icant effect of therapeutic hypothermia on phenobarbital phar-macokinetics could be identified [24, 25]. However, byemploying a pharmacokinetic/pharmacodynamic model, vanden Broek found that administration of phenobarbital to as-phyxiated newborns under hypothermia resulted in the reduc-tion of transition rate from a continuous normal voltage(CNV) to discontinuous normal voltage amplitude-integratedelectroencephalography background level, providing evi-dence of neuroprotection of phenobarbital in infants with aCNV pattern [24].
The estimated population CLPB values for phenobarbitalmonotherapy are graphically presented in Fig. 4. Though adirect comparison of CLPB among studies could not be madegiven different patients’ characteristics, there is a trend thatCLPB is higher in children than in adults or neonates, whichcould be due to the developmental changes in children’s or-gans of elimination, although, as previously mentioned, thehigher CLPB in children than in adults could be explained bythe decrease in liver volume per unit of body weight thatoccurs with increasing age [44].
With regard to the quality of the studies reviewed, twosignificant items relevant to population pharmacokineticanalysis were missing, these being sampling time andthe estimation method, which have significant impactson the repeatability and validity of the models. In termsof the model evaluation, most studies employed advancedinternal evaluation; therefore, the generalizability of thedeveloped models is not warranted. To apply such modelsin real clinical settings, an external evaluation using thetarget population is required.
0 2 4 6 8 10 12 14 16 18
Body size
Age
Gender
Concomitant
Liver function test
Genotype
Serum creatinine
Apgar score
Race
Severe mental retardation
PB conc > 50 µg/mL
PB dose
Body temperature
Number of studies
Tested covariate Significant covariate
Fig. 3 Tested and significantcovariates described in theincluded studies
Eur J Clin Pharmacol

Table4
Asummaryof
populatio
npharmacokineticmodelsof
phenobarbital
No
Author
Model
Software
Equation
IIV
1Graselaetal.1985
[31]
1CMTwith
first-orderelim
ination
NONMEM
CL(L/h/kg)=0.0047
Additive
oflog
transformed
V(L/kg)=0.96
+Apgar
score*(13.5)
Apgar
score<5=1,0otherw
ise
2Yukaw
aetal.1992
[15]
1CMTsteady-state
NONMEM
PBmonotherapy:C
L/F
(mL/kg/h)=61*T
BW
(−0.613)
Additive
oflog
transformed
PB+otherAEDs:CL/F
(mL/kg/h)=19.4*T
BW
(−0.345)
PB+otherAEDs+VPA
:CL/F
(mL/kg/h)=22.9*T
BW
(−0.467)
3Botha
etal.1995*
[16]
1CMTsteady-state
NONMEM
(version
4)CL(L/h)=
[exp(0.029*W
T-2.53)]*M
M=1formonotherapy,0.62ifVPA
ispresent,0.87
ifCBZ
orPH
Tarepresent
Additive
4Chanetal.1997[17]
1CMTsteady-state
MULTI(ELS)program
for
microcomputer
CL/F
(L/d/kg)=0.830M
*exp(−0.479–0.057*WT)
M=1forCBZor
PHT
M=0formonotherapy
Exponential
5Yukaw
aetal.1998
[18]
1CMTsteady-state
NONMEM
(version
4)CL/F
(mL/kg/h)=52.3*T
BW
(−0.567) *CO
CO=1forPBmonotherapy,46.4(−1/TBW)forPB
+CBZ,
0.642forPB
+VPA
Proportio
nal
6Mam
iyaetal.2000
[13]
1CMTsteady-state
NONMEM
(version
4)CL/F
(mL/kg/h)=4.46*(TBW/60)
-0.633*0.812P
M
PM=1forpoor
metabolizer
ofCYP2
C19,0
forextensive
metabolizer
ofCYP2
C19
Proportio
nal
7Yukaw
aetal.2005
[19]
1CMTwith
first-orderabsorptio
nandelim
ination
NONMEM
(version
5)CL/F
(mL/h)=
3.41*T
BW
+1.64*(PNA)
Proportio
nal
V/F
(L)=
1.09*T
BW
Ka(h
−1)=
50(fixed)
F=0.406fororal,1
forsupposito
ry8
Yukaw
aetal.2006
[20]
1CMTsteady-state
NONMEM
(version
5)CL/F
(mL/kg/h)=5.29*(TBW/60)
-0.720*P
HTconc
-0.0985*G
1G1=0.807forCYP
2C19*1/*3,*2/*2,*2/*3
Proportio
nal
9Gotoetal.2007[14]
1CMTfirst-orderabsorptio
nand
elim
ination
WinNonMix
(version
2.0.1)
CL/F
(mL/h)=
0.23*(TBW/40)
0.21*0.52
CYP2C9*1/*3
*0.63
VPA*0.85
PHT*0.85
SMID
CYP
2C9*1/*3
=1,otherw
ise0
VPAor
PHT=1ifitisco-adm
inistered,otherw
ise0
SMID
=severe
mentalretardatio
n=1,otherw
ise0
Proportio
nal
V/F
(L)=
14.78
10Wilm
shurstetal.
2010
[21]
1CMTwith
first-orderabsorptio
nandelim
ination
NONMEM
(version
6)CL/F
(mL/h/kg)=7.6(fixed)
Proportio
nal
Ka(h
−1)=
5,10,25,50
(fixed)
V/F
(L/kg)=1.21
11Yukaw
aetal.2011
[22]
1CMTwith
first-orderabsorptio
nandelim
ination
NONMEM
(version
6)CL/F
(mL/h)=
5.95*T
BW
+1.41*(PNAin
weeks)*conc
-0.221
where
conc
=PBconc
>50
μg/L
Proportio
nal
V/F
(L)=
1.01*T
BW
Ka(h
−1)=
50(fixed)
F=1forsupposito
ry,=
0.483fororaladministration
13Lee
etal.2012[23]
1CMTwith
first-orderelim
ination
NONMEM
(version
6)CL(m
L/h)=
32.6*(TBW/4)1.21
NR
V(m
L)=
3590*(TBW/4)0.766*(AGE/2)0.283
12Van
denBroek
etal.
2012
[24]
1CMTwith
first-orderelim
ination
NONMEM
(version
6)CL(m
L/h)=
17.2*(TBW/3.5)0.81
Exponential
V(m
L)=
3450*(TBW/3.5)1.08
15Sh
ellhaasetal.2013
[25]
1CMTwith
first-orderelim
ination
NONMEM
(version
7.2)
CL(L/h)=
0.672*(W
T/70)
0.75*(PNAc/(PNAc50+PNAc))
PNAc50=22.1
Exponential
V(L)=
64.9*(WT/70)
Eur J Clin Pharmacol

Tab
le4
(contin
ued)
14Marsotetal.2014
[32]
1CMTwith
first-orderabsorptio
nandelim
ination
NONMEM
(version
7)CL(L/h)=
0.191*(W
T/70)
0.75
Exponential
V(L)=
44.6*(WT/70)
F=0.489
Ka(h
−1)=
50(fixed)
16Vucicevicetal.2015
[28]
1CMTwith
first-orderabsorptio
nandelim
ination
NONMEM
(version
7.2)
CL/F
(L/h)=
0.314*(1–0.248*D
VPA
(mg/d)/100)
DVPA
=VPA
daily
dose
(was
centered
at1000
mg/d)
Exponential
V/F
(L/kg)=0.6(fixed)
Ka(h
−1)=
3(fixed)
17Volleretal.2017
[26]
1CMTwith
first-orderabsorptio
nandelim
ination
NONMEM
(version
7.3)
CL(L/h)=
0.0091*(1+0.0533*(PN
A-m
edian))*(1+0.369*(bBW-m
edian))
NR
V(L)=
2.38*(1+0.309*(aBW-m
edian))
Ka(h
−1)=
50(fixed)
F=0.594
18Moffettetal.2018
[27]
1CMTwith
first-orderabsorptio
nandelim
ination
NONMEM
(version
7.3)
CL
L=h
ðÞ¼
0:372*
FFM
70
�� 0
:75*
0:3
Scr
�� 0
:265*
1
1þPM
A41ðÞ−4
:22
��*0
:596
PHT*0
:761
MID
AZ*
1:25
PANTOP
Proportio
nal
V¼
62:5*
FFM
70
�� *0
:981
LN
AGE
0:28ðÞ
Ka(h
−1)=
0.8
F=0.89
No
IIV
RV
Evaluation
1CL:%
CV=19
Additive
oflogtransformed
%CV=10.7
Externald
ataset(N
=15)
V:%
CV=16
2CL/F:%
CV=17.64
Additive
oflogtransformed
%CV=20.40
Externald
ataset
(N=82)
CL/F:%
CV=22.20
%CV=18.65
CL/F:%
CV=20.37
%CV=17.8
3CL:%
CV=18.1
Additive
%CV=18.0
GOFplots
4CL/F:%
CV=26.8
Additive
%CV=14.8
No
5CL/F:%
CV=21.2
Proportio
nal
%CV=19.7
No
6CL/F:%
CV=22.9
Proportio
nal
%CV=14.7
No
7CL/F:%
CV=31.9
Proportio
nal
%CV=25.2
ME,M
AE
V/F:%
CV=53.9
Ka:NA
8CL/F:%
CV=22.1
Proportio
nal
%CV=14.2
NR
9CL/F:%
CV=17.3
Additive
SD=3.49
μg/mL
No
10CL/F:N
AAdditive
SD=36
μmol/L
Bootstrap,V
PC
Ka:NA
V/F:%
CV=52
11CL/F:%
CV=26.0
Proportio
nal
%CV=22.5
GOFplots,ME,M
AE
V/F:%
CV=61.2
Ka:NA
Eur J Clin Pharmacol

Tab
le4
(contin
ued)
13CL:%
CV=27.0
NR
NR
NR
V:%
CV=31.1
12CL:%
CV=43.1
Proportio
nal
%CV=4.9
Bootstrap,N
PDEforPK
andVPC
forPD
model
V:%
CV=8.4
15CL:%
CV=41.8
Com
bined
Proportional:%CV=44.38
Additive:S
D=2.47
μg/mL
Bootstrap
14CL:%
CV=16.6
Additive
SD=7.22
μg/mL
NPD
E,bootstrap
V:%
CV=49.5
F:%CV=39.4
16CL/F:%
CV=44.61
Proportio
nal
%CV=38.34
Bootstrap,pcV
PCV/F:N
A
Ka:NA
17CL:%
CV=29
Proportio
nal
%CV=22
GOF,
NPD
E,externalv
alidation(n=17)
V:%
CV=40
Ka:NA
18CL:%
CV=42.5
Proportio
nal
%CV=14.8
Bootstrap,pcV
PCV:%
CV=33.8
AEDsantiepileptic
drugs,aB
Wactual
bodyweight,bB
Wbirthw
eight,CBZcarbam
azepine,CLclearance,CMTcompartment,CVcoefficientof
variation,
Fbioavailability,
FFM
fatfree
mass,GOF
goodnessof
fit,Kaabsorptio
nrateconstant,M
AEmeanabsoluteerror,MEmeanerror,MID
AZmidazolam
,NAnotapplicable,N
PDEnorm
alized
predictio
ndistributio
nerror,PANTO
Ppantoprazole,P
Bphenobarbital,pcVPCpredictio
n-correctedvisualpredictiv
echeck,PDpharmacodynam
ics,PHTphenytoin,PKpharmacokinetics,PMApostmenstrualage,PNApostnatalage,P
NAccontinuous
postnatal
age,PNAc50postnatalage
valueatwhich
clearancereacheshalfits
maxim
alvalue,SC
rserumcreatin
ine,SD
standard
deviation,TB
Wtotalbodyweight,Vvolumeof
distributio
n,VPAvalproicacid,V
PC
visualpredictiv
e,check,WTweight
*Note:bioavailabilitywas
considered
complete
Eur J Clin Pharmacol
Conclusion
Based on our review, although extensive population pharma-cokinetic studies of phenobarbital have been conducted, keyinformation on model methodologies was missing in somestudies which may hamper their reproducibility and their ap-plicability in clinical settings. In addition, the research gapregarding the relationship between pharmacokinetic variabili-ty and pharmacodynamics of phenobarbital in populationsother than neonate remains exist, thus predictions of pheno-barbital treatment outcome using population pharmacokinetic/pharmacodynamic models are not well established. Furtherresearch focusing on a l ink between populat ionpharmacokinetics/pharmacodynamics should be conductedto fill this knowledge gap.
Authors’ contributions JM and NL planned and designed the systematicreview. JM drafted the initial manuscript and revised the subsequentdrafts. Both authors read and approved the final version of themanuscript.
Compliance with ethical standards
Conflict of interest The authors have no conflicts of interest that arerelevant to the content of this article.
References
1. Boer HR, Gal P (1982) Neonatal seizures: a survey of current prac-tice. Clin Pediatr 21(8):453–457
2. Wallin A, Jalling B, Boréus LO (1974) Plasma concentrations ofphenobarbital in the neonate during prophylaxis for neonatalhyperbilirubinemia. J Pediatr 85(3):392–397
3. Battino D, Estienne M, Avanzini G (1995) Clinical pharmacokinet-ics of antiepileptic drugs in paediatric patients. Clin Pharmacokinet29(4):257–286
4. Murphy JE. Clinical pharmacokinetics: ASHP; 20115. Winter ME. Basic clinical pharmacokinetics: Lippincott Williams
& Wilkins; 20046. Graves NM, Holmes GB, Kriel RL, Jones-Saete C, Ong B,
Ehresman DJ (1989) Relative bioavailability of rectally adminis-tered phenobarbital sodium parenteral solution. Dicp. 23(7–8):565–568
7. Touw D, Graafland O, Cranendonk A, Vermeulen R, VanWeissenbruch M (2000) Clinical pharmacokinetics of phenobarbi-tal in neonates. Eur J Pharm Sci 12(2):111–116
8. Hvidberg EF, DamM (1976) Clinical pharmacokinetics of anticon-vulsants. Clin Pharmacokinet 1(3):161–188
9. Onishi S, Ohki Y, Nishimura Y, Itoh S, Isobe K, Hosoe A,Yamamoto T, Yamakawa T (1984) Distribution of phenobarbitalin serum, brain and other organs from pediatric patients. DevPharmacol Ther 7:153–159
10. Painter M, Pippenger C, Wasterlain C, Barmada M, Pitlick W,Carter G et al (1981) Phenobarbital and phenytoin in neonatal sei-zures: metabolism and tissue distribution. Neurology 31(9):1107
11. Anderson GD (1998) A mechanistic approach to antiepileptic druginteractions. Ann Pharmacother 32(5):554–563
12. Riva R, Albani F, Contin M, Baruzzi A (1996) Pharmacokineticinteractions between antiepileptic drugs. Clin Pharmacokinet 31(6):470–493
13. Mamiya K, Hadama A, Yukawa E, Ieiri I, Otsubo K, Ninomiya H,Tashiro N, Higuchi S (2000) CYP2C19 polymorphism effect onphenobarbitone. Pharmacokineties in Japanese patients with epilep-sy: analysis by population pharmacokinetics. Eur J Clin Pharmacol55(11–12):821–825
14. Goto S, Seo T, Murata T, Nakada N, Ueda N, Ishitsu T, NakagawaK (2007) Population estimation of the effects of cytochrome P4502C9 and 2C19 polymorphisms on phenobarbital clearance inJapanese. Ther Drug Monit 29(1):118–121
15. Yukawa E, Higuchi S, Aoyama T (1992) Phenobarbitone popula-tion pharmacokinetics from routine clinical data: role of patientcharacteristics for estimating dosing regimens. J Pharm Pharmacol44(9):755–760
0 0.001 0.002 0.003 0.004 0.005 0.006 0.007 0.008 0.009 0.01
Grasela et al 1985Yukawa et al 2005Yukawa et al 2010
Lee et al 2012van den Broek et al 2012
Shellhaas et al 2013Voller et al 2017Botha et al 1995Chan et al 1997
Yukawa et al 1992Yukawa et al 1998Yukawa et al 1992Yukawa et al 1998Mamiya et al 2000Marsot et al 2012
Vucicevic et al 2015Moffett et al 2018
Neo
nate
sC
hild
ren
Adu
lts
Phenobarbital clearance (L/h/kg)
Fig. 4 The estimated populationphenobarbital clearance from theincluded studies classified by theage group. The clearances werecalculated assumingphenobarbital monotherapy andusing the mean weights of 3 kg,20 kg, and 60 kg for neonates,children, and adults, respectively
Eur J Clin Pharmacol

16. Botha JH, Gray AL, Miller R (1995) Determination of phenobar-bitone population clearance values for South African children. Eur JClin Pharmacol 48(5):381–383
17. Chan E, Chan K, Teoh R (1997) Determination of phenobarbitonepopulation clearance values for physically and mentallyhandicapped Chinese children with epilepsy. J Clin Pharm Ther22(5–6):399–403
18. Yukawa E, To H, Ohdo S, Higuchi S, Aoyama T (1998) Detectionof a drug-drug interaction on population-based phenobarbitoneclearance using nonlinear mixed-effects modeling. Eur J ClinPharmacol 54(1):69–74
19. Yukawa E, Suematsu F, Yukawa M, Minemoto M (2005)Population pharmacokinetic investigation of phenobarbital bymixed effect modelling using routine clinical pharmacokinetic datain Japanese neonates and infants. J Clin Pharm Ther 30(2):159–163
20. Yukawa E, Mamiya K (2006) Effect of CYP2C19 genetic poly-morphism on pharmacokinetics of phenytoin and phenobarbital inJapanese epileptic patients using non-linear mixed effects modelapproach. J Clin Pharm Ther 31(3):275–282
21. Wilmshurst JM, Van Der Walt JS, Ackermann S, Karlsson MO,Blockman M (2010) Rescue therapy with high-dose oral phenobar-bitone loading for refractory status epilepticus. J Paediatr ChildHealth 46(1–2):17–22
22. Yukawa M, Yukawa E, Suematsu F, Takiguchi T, Ikeda H, Aki H,Mimemoto M (2011) Population pharmacokinetics of phenobarbi-tal by mixed effect modelling using routine clinical pharmacokinet-ic data in Japanese neonates and infants: an update. J Clin PharmTher 36(6):704–710
23. Lee SM, Chung JY, Lee YM, Park MS, Namgung R, Park KI, LeeC (2012) Effects of cytochrome P450 (CYP)2C19 polymorphismson pharmacokinetics of phenobarbital in neonates and infants withseizures. Arch Dis Child 97(6):569–572
24. Van Den BroekMPH, Huitema ADR, Groenendaal F, Van StraatenHLM, Toet M, Egberts ACG et al (2012) Pharmacokinetics andpharmacodynamics of phenobarbital during therapeutic hypother-mia in asphyxiated newborns. Pharmaceutisch Weekblad 147(24):103–106
25. Shellhaas RA, Ng CM, Dillon CH, Barks JDE, Bhatt-Mehta V(2013) Population pharmacokinetics of phenobarbital in infantswith neonatal encephalopathy treated with therapeutic hypother-mia. Pediatr Crit Care Med 14(2):194–202
26. Völler S, Flint RB, Stolk LM, Degraeuwe PLJ, Simons SHP,Pokorna P, Burger DM, de Groot R, Tibboel D, Knibbe CAJ(2017) Model-based clinical dose optimization for phenobarbitalin neonates: an illustration of the importance of data sharing andexternal validation. Eur J Pharm Sci 109:S90–SS7
27. Moffett BS,WeingartenMM, Galati M, Placencia JL, Rodman EA,Riviello JJ, Kayyal SY (2018) Phenobarbital population pharmaco-kinetics across the pediatric age spectrum. Epilepsia. 59(7):1327–1333
28. VučićevićK, JovanovićM,GolubovićB,Kovačević SV,MiljkovićB, Martinović Ž, Prostran M (2015) Nonlinear mixed effectsmodelling approach in investigating phenobarbital pharmacokineticinteractions in epileptic patients. Eur J Clin Pharmacol 71(2):183–190
29. Methaneethorn J (2018) A systematic review of population phar-macokinetics of valproic acid. Br J Clin Pharmacol 84(5):816–834
30. Methaneethorn J (2018) Population pharmacokinetic analyses oflithium: a systematic review. Eur J Drug Metab Pharmacokinet43(1):25–34
31. Grasela TH Jr, Donn SM (1985) Neonatal population pharmacoki-netics of phenobarbital derived from routine clinical data. DevPharmacol Ther 8(6):374–383
32. Marsot A, Brevaut-Malaty V, Vialet R, Boulamery A, BruguerolleB, Simon N (2014) Pharmacokinetics and absolute bioavailabilityof phenobarbital in neonates and young infants, a population
pharmacokinetic modelling approach. Fundam Clin Pharmacol28(4):465–471
33. Brendel K, Dartois C, Comets E, Lemenuel-Diot A, Laveille C,Tranchand B et al (2007) Are population pharmacokinetic and/orpharmacodynamic models adequately evaluated? ClinPharmacokinet 46(3):221–234
34. Kanji S, Hayes M, Ling A, Shamseer L, Chant C, Edwards DJ,Edwards S, Ensom MHH, Foster DR, Hardy B, Kiser TH, laPorte C, Roberts JA, Shulman R, Walker S, Zelenitsky S, MoherD (2015) Reporting guidelines for clinical pharmacokinetic studies:the ClinPK statement. Clin Pharmacokinet 54(7):783–795
35. Dartois C, Brendel K, Comets E, Laffont C, Laveille C, TranchandB et al (2007) Overview of model-building strategies in populationPK/PD analyses: 2002–2004 literature survey. Br J Clin Pharmacol64(5):603–612
36. Abdel-Jalil M, Abdullah N, Alsous M, Saleh M, Abu-Hammour K(2020) A systematic review of population pharmacokinetic analy-ses of digoxin in the pediatric population. Br J Clin Pharmacol
37. Patsalos PN, Lascelles PT (1981) Inhibition of in vitro diphenylhy-dantoin hydroxylation by different anticonvulsant drug combina-tions: a kinetic analysis. General Pharmacology: The VascularSystem 12(1):51–55
38. Morselli P, Rizzo M, Garattini S (1971) Interaction between phe-nobarbital and diphenylhydantoin in animals and in epileptic pa-tients. Ann N Y Acad Sci 179(1):88–107
39. Manganaro R, Mamì C, Gemelli M (1994) The validity of theApgar scores in the assessment of asphyxia at birth. EuropeanJournal of Obstetrics & Gynecology and Reproductive Biology54(2):99–102
40. Heimann G, Gladtke E (1977) Pharmacokinetics of phenobarbitalin childhood. Eur J Clin Pharmacol 12(4):305–310
41. Waddell WJ, Butler TC (1957) The distribution and excretion ofphenobarbital. J Clin Invest 36(8):1217–1226
42. (2015) The Apgar Score. Pediatrics 136(4):819–82243. Morselli PL (1976) Clinical pharmacokinetics in neonates. Clin
Pharmacokinet 1(2):81–9844. Rylance GW, Moreland TA, Cowan MD, Clark DC (1982) Liver
volume estimation using ultrasound scanning. Arch Dis Child57(4):283–286
45. Chiba K, Suganuma T, Ishizaki T, Iriki T, Shirai Y, Naitoh H, HoriM (1985) Comparison of steady-state pharmacokinetics of valproicacid in children between monotherapy and multiple antiepilepticdrug treatment. J Pediatr 106(4):653–658
46. Suganuma T, Ishizaki T, Chiba K, Hori M (1981) The effect ofconcurrent administration of valproate sodium on phenobarbitalplasma concentration/dosage ratio in pediatric patients. J Pediatr99(2):314–317
47. Kapetanovic IM, Kupferberg HJ, Porter RJ, Theodore W,Schulman E, Penry JK (1981) Mechanism of valproate-phenobarbital interaction in epileptic patients. Clin PharmacolTher 29(4):480–486
48. Pokrajac M, Miljković B, Varagić VM, Lević Z (1993)Pharmacokinetic interaction between valproic acid and phenobar-bital. Biopharm Drug Dispos 14(1):81–86
49. Patsalos PN, Duncan JS (1993) Antiepileptic drugs. Drug Saf 9(3):156–184
50. Lambie D, Johnson R, Nanda R, Shakir R (1976) Therapeutic andpharmacokinetic effects of increasing phenytoin in chronic epilep-tics on multiple drug therapy. Lancet 308(7982):386–389
51. Eadie M, Lander C, Hooper W, Tyrer J (1977) Factors influencingplasma phenobarbitone levels in epileptic patients. Br J ClinPharmacol 4(5):541–547
52. Patsalos PN, Lascelles PT (1977) In vitro hydroxylation of diphe-nylhydantoin and its inhibition by other commonly used anticon-vulsant drugs. Biochem Pharmacol 26(20):1929–1933
Eur J Clin Pharmacol

53. Cereghino JJ, Brock JT, VanMeter JC, Penry JK, Smith LD,WhiteBG (1975) The efficacy of carbamazepine combinations in epilep-sy. Clinical Pharmacology & Therapeutics 18(6):733–741
54. Sennoune S, Iliadis A, Bonneton J, Barra Y, Genton P, Mesdjian E(1996) Steady state pharmacokinetics of carbamazepine-phenobarbital interaction in patients with epilepsy. BiopharmDrug Dispos 17(2):155–164
55. Guelen PJM, van der Kleijn E (1978) Rational anti-epileptic drugtherapy. Elsevier/North-Holland Biomedical Press
56. Wandel C, Bocker R, Bohrer H, Browne A, Rugheimer E, Martin E(1994) Midazolam is metabolized by at least three different cyto-chrome P450 enzymes. Br J Anaesth 73(5):658–661
57. Li X-Q, Andersson TB, Ahlström M, Weidolf L (2004)Comparison of inhibitory effects of the proton pump-inhibitingdrugs omeprazole, esomeprazole, lansoprazole, pantoprazole, andrabeprazole on human cytochrome P450 activities. Drug MetabDispos 32(8):821–827
Publisher’s note Springer Nature remains neutral with regard to jurisdic-tional claims in published maps and institutional affiliations.
Eur J Clin Pharmacol


![Postnatal phenobarbital for the prevention of ...perinatal.com.br/9simposiointneorj/pdf/Aula11 - Whitelaw prevencao... · [Intervention Review] Postnatal phenobarbital for the prevention](https://static.fdocuments.net/doc/165x107/5af131777f8b9ac2468f06a7/postnatal-phenobarbital-for-the-prevention-of-whitelaw-prevencaointervention.jpg)

