.com Disclosures: How to Make Effective Disclosures in Digital ...
Pharmaceutical Marketing Disclosures
July 1, 2007 – June 30, 2008
Report of
Vermont Attorney General
William H. Sorrell
April 2009
Prepared by staff of the Vermont Attorney General’s Office:
Wendy Morgan, Assistant Attorney General
AJ Van Tassel-Sweet, Investigator
and
Bethany Beyer, Candidate for Masters of Public Health,
Dartmouth Institute for Health Policy
i
Pharmaceutical Marketing Disclosures: Report of
Vermont Attorney General
William H. Sorrell
April 2009
Table of Contents
Page:
I. Executive Summary .................................................................................................................1
II. Description of Vermont’s Payment Disclosure Law ................................................................2
III. Amendments to Prior Pharmaceutical Marketing Disclosure
Reports filed by the Vermont Attorney General’s Office ........................................................3
IV. Summary of Pharmaceutical marketing Expenditures ............................................................3
1. Total Payments of Each Pharmaceutical Manufacturer ....................................................4
2. Payments Organized by Recipient Type ...........................................................................5
3. Payments Organized by Prescriber Specialty for the Top 100 Individual Recipients ......5
4. Payments Organized by Marketing Expenditures for Specific Drugs and Indications ....7
5. Payments Organized by Nature of Expenditure ................................................................8
6. Payments Organized by Purpose of Expenditure............................................................10
7. Trade Secret Declarations ...............................................................................................10
Appendix: FY08 - Ranking by Company Name.................................................. Appendix - page 1
1
Pharmaceutical Marketing Disclosures: Report of
Vermont Attorney General
William H. Sorrell
April 2009
I. Executive Summary
This is the sixth report of Vermont Attorney General William H. Sorrell on Pharmaceutical
Marketing Disclosures. It is based upon disclosures of payments made during the period July 1, 2007,
through June 30, 2008 (“FY08”) by pharmaceutical marketers on consulting and speaker fees, travel
expenses, gifts, and other payments to or for physicians, hospitals, universities and others authorized to
prescribe or dispense pharmaceutical products. Vermont’s Pharmaceutical Marketing Disclosure Law,
18 V.S.A. § 4632, requires manufacturers to file the disclosures with the Vermont Attorney General’s
Office by December 1st following the fiscal year, and requires the Vermont Attorney General to issue a
report about the disclosures.
As this report demonstrates, the Pharmaceutical Marketing Disclosure Law in Vermont provides
useful information regarding pharmaceutical manufacturer’s distribution of money within the Vermont
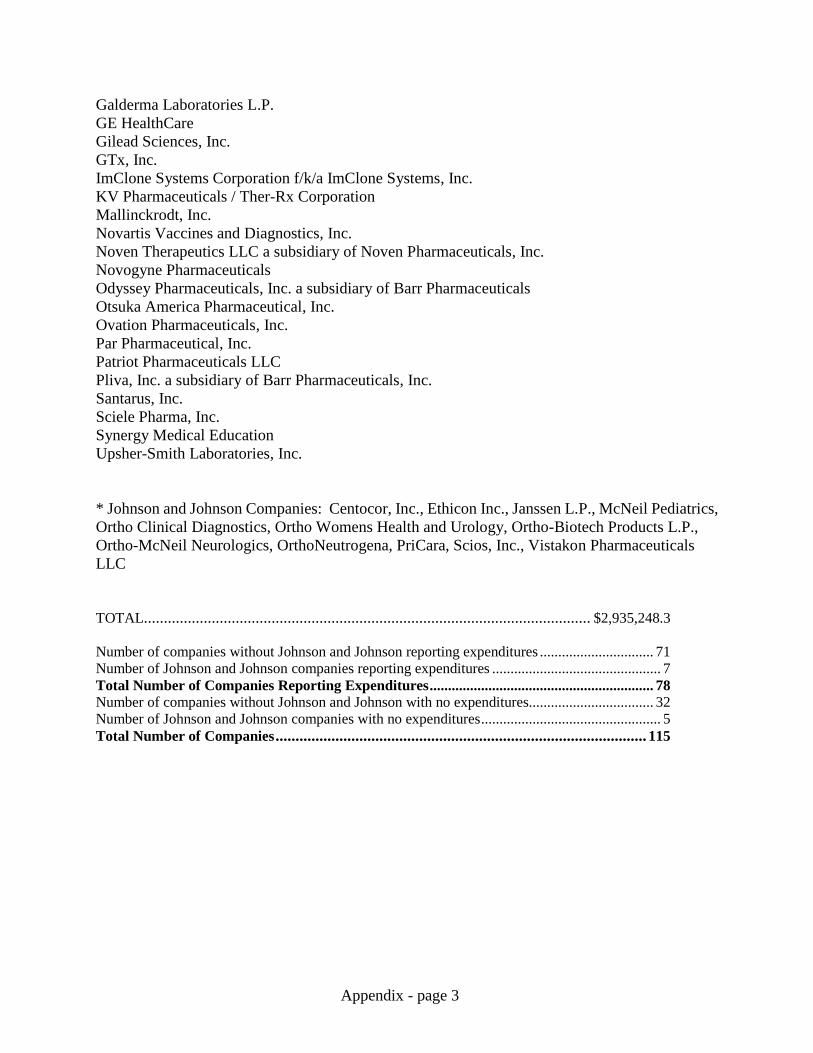
medical community to market pharmaceuticals. According to the FY08 disclosures, 78 pharmaceutical
manufacturers reported spending $2,935,248 in Vermont on fees, travel expenses, and other direct
payments to Vermont physicians, hospitals, universities and others for the purpose of marketing their
products. There were 115 pharmaceutical manufacturers who filed disclosures in FY08, with 37 of
these manufacturers reporting no expenditures.
From FY04 through FY08, there has been an increase of over 40% in the number of
manufacturers who have reported marketing expenditures, and a decrease of nearly 30% in the amount
of expenditures.
The top five spenders in Vermont on marketing during FY08 were:
Eli Lilly and Company
Pfizer, Inc.
Novartis Pharmaceuticals Corporation
Merck & Co., Inc., and
Forest Pharmaceuticals, Inc.
Over the last three years, the percentage of payments reported by the top five spenders, as
compared with the total amount of expenditures reported, has dropped from 59% to 56% to 52% in
FY08.
Nearly $1,770,000 was expended on the top 100 individual recipients in FY08. Thus, with
approximately 2280 recipients, 4.3 % of the recipients received 60% of the total payments in that year.
The greatest amount of expenditures went to psychiatrists as a group, totaling nearly half a million
dollars; one psychiatrist received over $112,000, the greatest amount of pharmaceutical marketing
dollars spent on any single person in FY08.
2
In addition to psychiatry, the following groups of specialists received over $100,000 in
expenditures: internal medicine; neurology; endocrinology, diabetes and metabolism; and ionizing
radiation privileges.
Individual specialists in geriatric medicine and in endocrinology, diabetes and metabolism,
received the highest average expenditures for the top 100 recipients, each averaging over $50,000.
Specialists in family practice, pediatrics, OBGYN, gastroenterology, and colon and rectal surgery
received the lowest average expenditures in the top 100 recipients, each with an average expenditure of
less than $6,500.
Seven individuals in the top 100 recipients were not physicians, but were physician’s assistants,
registered nurses, or advance practice registered nurses.
Nearly 50% of all marketing expenditures reported in FY08 were for speaker fees or other
payments to recipients, nearly a quarter were for marketing of pharmaceutical products, and
approximately a fifth were for educational purposes. Nearly 60% were direct payments to recipients in
the form of cash or check.
Expenditures on food totaled over $860,000, or nearly 30% of all marketing expenditures. Of all
recipients of food in FY08, more than 20% had over $500 expended on them, including more than 11%
who had over $1000 expended on them. Approximately 40% of all recipients of food received food
valued at less than $100. The individual recipient with the greatest reported food expenditure received
nearly $15,800 in food for him or herself and any non-prescribing colleagues.
In FY08, the drug for which the greatest marketing was expended was for attention-
deficit/hyperactivity disorder (ADHD). Looking only at the 50 drugs with the greatest expenditures,
nearly 15% of those expenditures went for marketing drugs used for controlling diabetes, nearly twice as
much as was spent on the promotion of the next closest drugs, which were for the treatment of
hypertension, depression, and ADHD. Nearly 70% of the total expenditures for FY08 was spent on the
top 13% of all drugs marketed.
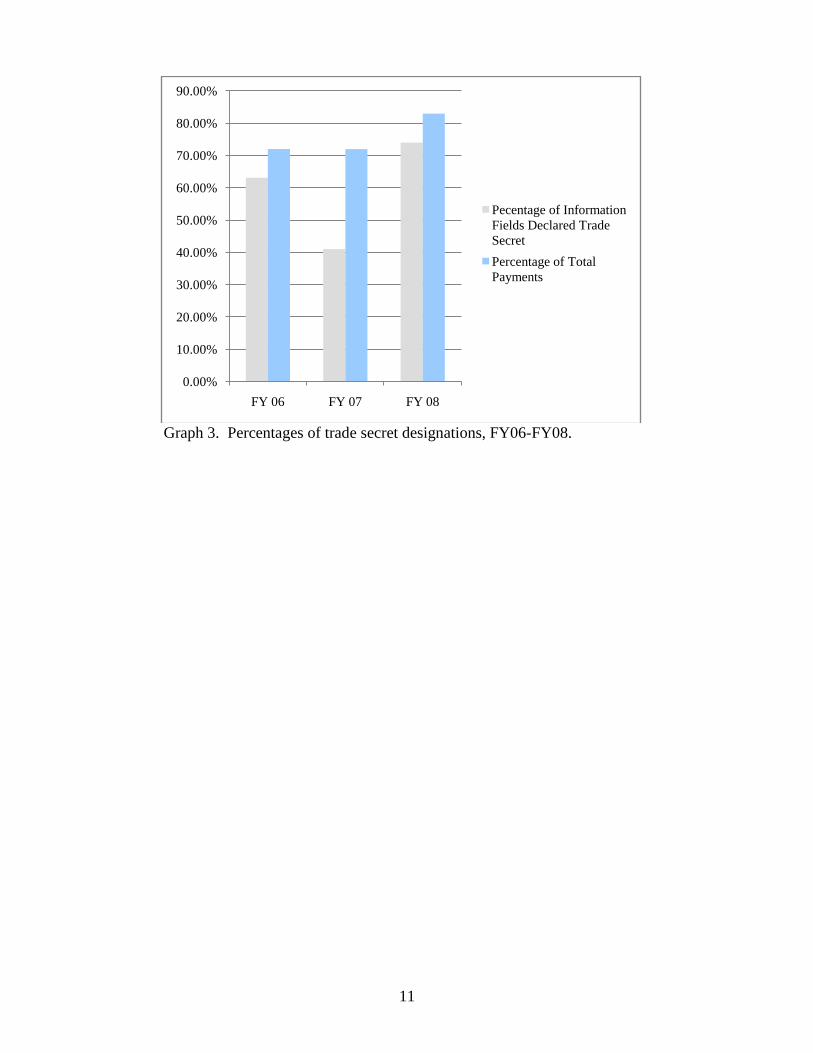
From FY06 through FY08, the percentage of information fields declared to be trade secret
increased from 63% to 74%, and the percentage of payments declared to be trade secret increased from
72% to 83%. Click here for the public data upon which this report is based.
II. Description of Vermont’s Pharmaceutical Marketing Disclosure Law
The Vermont Legislature enacted the Pharmaceutical Marketing Disclosure Law in 2002, and
amended it in 2004, 2005, 2006, and 2007. The law requires pharmaceutical manufacturers to report to
the Vermont Attorney General, on forms and in a manner prescribed by the Attorney General, marketing
payments made to persons in Vermont who are authorized to prescribe, dispense, or purchase
pharmaceutical products. In particular, the law requires every pharmaceutical manufacturer to disclose:
the value, nature, and purpose of any gift, fee, payment, subsidy, or other economic benefit
provided in connection with detailing, promotional, or other marketing activities by the
company, directly or through its pharmaceutical marketers, to any physician, hospital, nursing
home, pharmacist, health benefit plan administrator, or any other person in Vermont authorized
to prescribe, dispense, or purchase prescription drugs in this state.
3
18 V.S.A. § 4632(a)(1).
Exempted by statute from disclosure are the following:
Free samples of prescription drugs intended for distribution to patients;
Payment of reasonable compensation and reimbursement of expenses in connection with
bona fide clinical trials;
Any gift, fee, payment, subsidy, or other economic benefit the value of which is less than
$25.00;
Scholarship or other support for medical students, residents, and fellows to attend a
significant educational, scientific, or policy-making conference of a national, regional, or
specialty medical or other association if the recipient of the scholarship or other support
is selected by the association; and
Prescription drug rebates and discounts.
18 V.S.A. § 4632(a)(4).
The Pharmaceutical Marketing Disclosure Law prohibits the Attorney General from disclosing
information that constitutes “trade secrets” under Vermont’s Access to Public Records Law, 1 V.S.A.
§ 317(c)(9). 18 V.S.A. § 4632(a)(3). The disclosure form permits the company to identify any
information that it claims is a trade secret. If trade secret information is requested, the Attorney General
shall notify the pharmaceutical company, which shall respond within 30 days by consenting to the
release of the information or certifying the reasons for its claim of trade secret. The requester may then
apply to the Washington County Superior Court for a declaration that the claim is invalid. The Attorney
General is not a party to that action and shall keep the information confidential until the court action is
resolved.
III. Amendments to Marketing Disclosure Reports
In the past, the Attorney General’s Office has revised summaries of expenditures for prior
reporting periods to account for late or corrected filings by some manufacturers. Such was the case for
the report of FY06, but not for the report of FY07.
This year’s report has far fewer comparisons across years than in the past because the data for
FY08 was corrected by the Attorney General’s Office to a far greater degree than occurred in the past.
Where needed, submissions regarding nature of payment and purpose of payment were corrected after
consultation with the reporting company. Corrections as to type of health care provider (physicians to
RNs or RNs to physicians, for example) were made based on the type of license held by the recipient
without consultation with the pharmaceutical companies.
IV. Summary of Pharmaceutical Marketing Expenditures
The Attorney General’s Office has organized the data submitted by pharmaceutical
manufacturers in seven ways:
4
1. Total payments of each pharmaceutical manufacturer;
2. Payments organized by recipient type;
3. Payments organized by prescriber specialty for the top 100 individual recipients;
4. Payments organized by marketing expenditures for specific drugs and indications;
5. Payments organized by nature of expenditure;
6. Payments organized by purpose of expenditure; and
7. Trade secret declarations.
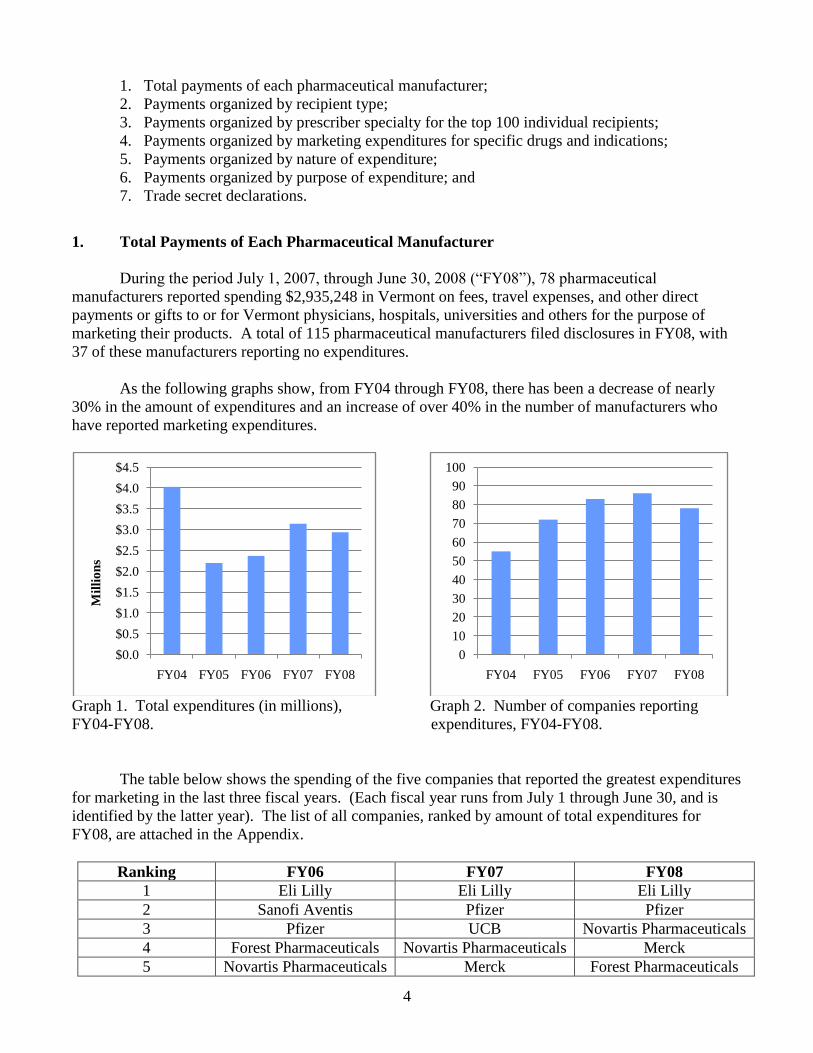
1. Total Payments of Each Pharmaceutical Manufacturer
During the period July 1, 2007, through June 30, 2008 (“FY08”), 78 pharmaceutical
manufacturers reported spending $2,935,248 in Vermont on fees, travel expenses, and other direct
payments or gifts to or for Vermont physicians, hospitals, universities and others for the purpose of
marketing their products. A total of 115 pharmaceutical manufacturers filed disclosures in FY08, with
37 of these manufacturers reporting no expenditures.
As the following graphs show, from FY04 through FY08, there has been a decrease of nearly
30% in the amount of expenditures and an increase of over 40% in the number of manufacturers who
have reported marketing expenditures.
Graph 1. Total expenditures (in millions), Graph 2. Number of companies reporting
FY04-FY08. expenditures, FY04-FY08.
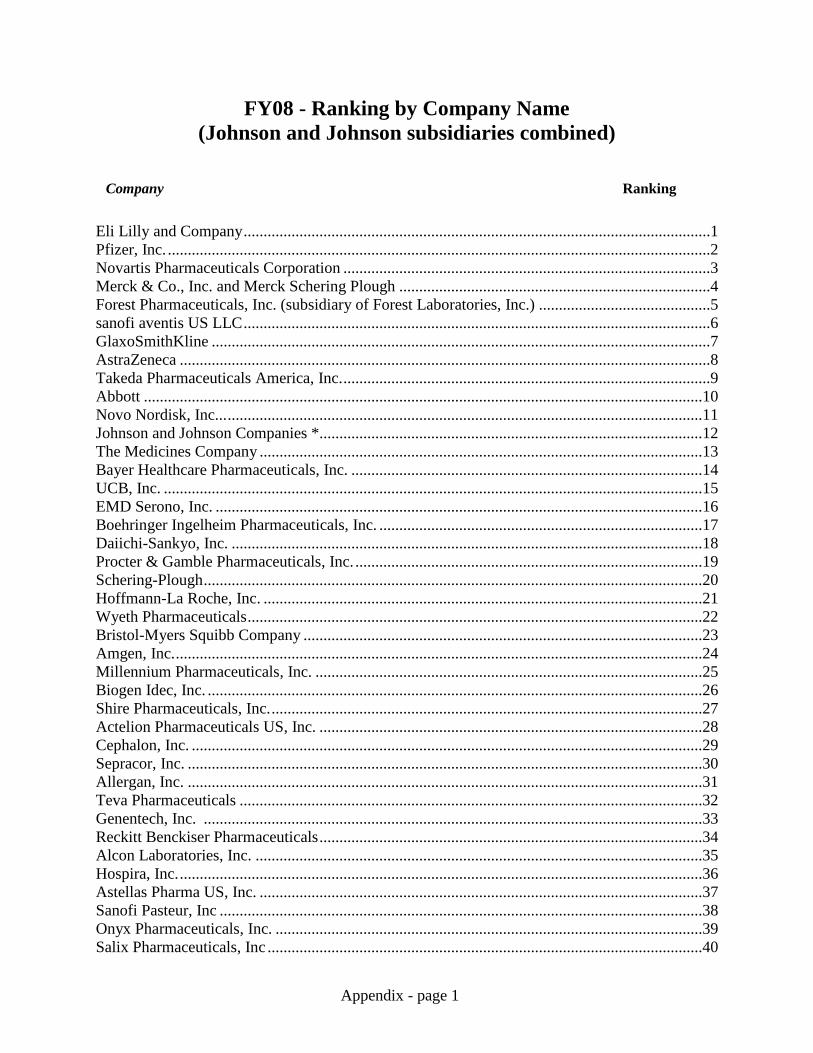
The table below shows the spending of the five companies that reported the greatest expenditures
for marketing in the last three fiscal years. (Each fiscal year runs from July 1 through June 30, and is
identified by the latter year). The list of all companies, ranked by amount of total expenditures for
FY08, are attached in the Appendix.
Ranking FY06 FY07 FY08
1 Eli Lilly Eli Lilly Eli Lilly
2 Sanofi Aventis Pfizer Pfizer
3 Pfizer UCB Novartis Pharmaceuticals
4 Forest Pharmaceuticals Novartis Pharmaceuticals Merck
5 Novartis Pharmaceuticals Merck Forest Pharmaceuticals
$0.0
$0.5
$1.0
$1.5
$2.0
$2.5
$3.0
$3.5
$4.0
$4.5
FY04 FY05 FY06 FY07 FY08
Mil
lio
ns
0
10
20
30
40
50
60
70
80
90
100
FY04 FY05 FY06 FY07 FY08
5
Total expenditures
for top 5 $1,326,075.24 $1,756,150.56 $1,519,745.18
Average
expenditure
for each of top 5
$265,215.05
$351,230.11 $303,949.04
Top 5’s percentage
of total
expenditures
59%
56%
52%
Table 1. Marketing expenditures of five companies with highest expenditures, FY06-FY08.
2. Payments Organized by Recipient Type
There are 10 categories of licensed professionals authorized to prescribe in Vermont: advance
practice registered nurses (commonly known as nurse practitioners); dentists; naturopathic physicians;
optometrists; osteopaths; physicians; physician’s assistants; podiatrists; scientific investigators; and
veterinarians. The Vermont Secretary of State and the Medical Practice Board currently list 4,573
physicians, osteopaths, PAs and APRNs licensed to prescribe pharmaceuticals in Vermont.1
The table below sets out how the payments made in FY08 were distributed among all categories
of recipients.
Recipient
Type
Total
Received
Percentage
of Total
Doctor $2,118,543.50 72.18
Other Healthcare Provider2 $289,773.75 9.87
University $250,416.88 8.53
Other Prescriber $160,301.60 5.46
Hospital $68,544.90 2.34
Clinic $24,682.53 0.84
Pharmacist/Pharmacy Technician $22,985.22 0.78
Table 2. Distribution of expenditures by recipient type, FY08.
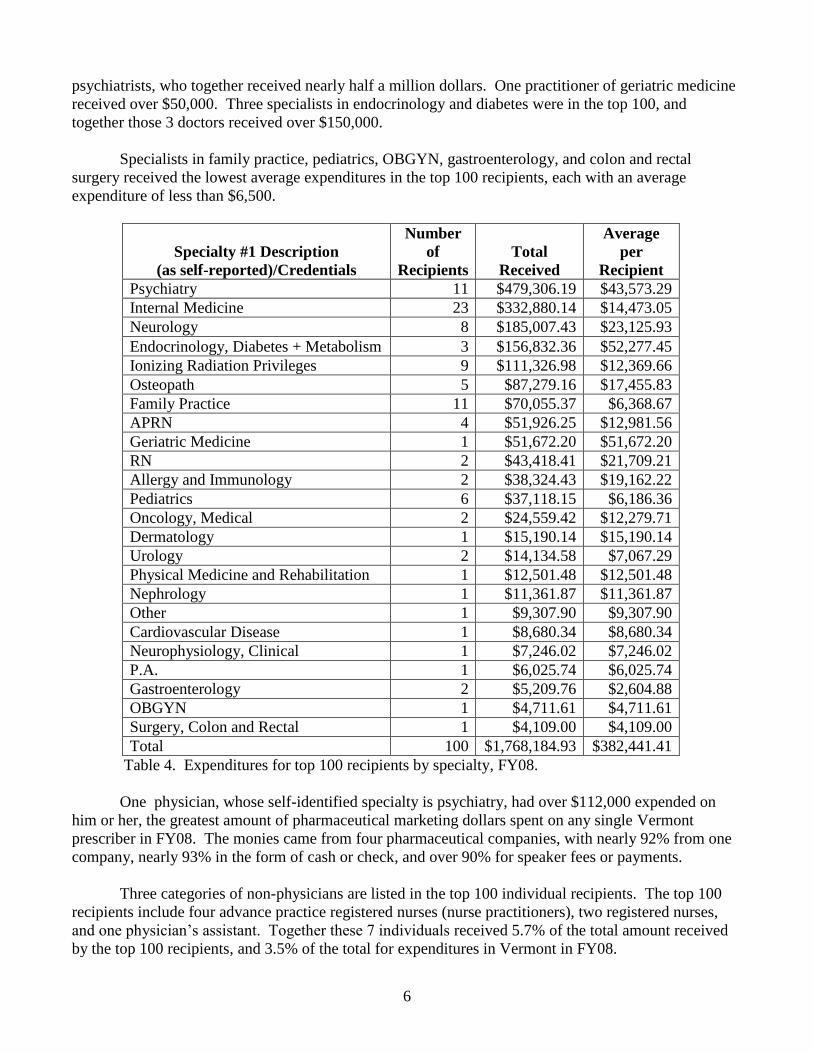
3. Payments Organized by Prescriber Specialty for the Top 100 Individual Recipients
Vermont doctors are allowed to self-report specialties. Below is the marketing data analyzed for
payments made to the top 100 recipients organized by self-reported specialty of those licensees. The
averages provided are only for specialists in the top 100, not for all specialists in that group.
A total of $1,768,184.91 in FY08 was expended on the top 100 individual recipients. Thus,
4.3 % of recipients received 60% of the total payments in that year. The top 100 includes 11
1 An unknown number of the physicians and osteopaths included in the 4,573 figure are on limited temporary licenses which
do not allow them to prescribe. 2 PAs, APRNs, RNs, LPNs, dentists, podiatrists, optometrists and opticians. RNs and LPNs cannot prescribe drugs in
Vermont. Data on expenditures to or for RNs and LPNs is included in this report because some pharmaceutical companies
neglected to associate the expenditures with a licensed prescriber as is required by the Attorney General’s guidance.
6
psychiatrists, who together received nearly half a million dollars. One practitioner of geriatric medicine
received over $50,000. Three specialists in endocrinology and diabetes were in the top 100, and
together those 3 doctors received over $150,000.
Specialists in family practice, pediatrics, OBGYN, gastroenterology, and colon and rectal
surgery received the lowest average expenditures in the top 100 recipients, each with an average
expenditure of less than $6,500.
Specialty #1 Description
(as self-reported)/Credentials
Number
of
Recipients
Total
Received
Average
per
Recipient
Psychiatry 11 $479,306.19 $43,573.29
Internal Medicine 23 $332,880.14 $14,473.05
Neurology 8 $185,007.43 $23,125.93
Endocrinology, Diabetes + Metabolism 3 $156,832.36 $52,277.45
Ionizing Radiation Privileges 9 $111,326.98 $12,369.66
Osteopath 5 $87,279.16 $17,455.83
Family Practice 11 $70,055.37 $6,368.67
APRN 4 $51,926.25 $12,981.56
Geriatric Medicine 1 $51,672.20 $51,672.20
RN 2 $43,418.41 $21,709.21
Allergy and Immunology 2 $38,324.43 $19,162.22
Pediatrics 6 $37,118.15 $6,186.36
Oncology, Medical 2 $24,559.42 $12,279.71
Dermatology 1 $15,190.14 $15,190.14
Urology 2 $14,134.58 $7,067.29
Physical Medicine and Rehabilitation 1 $12,501.48 $12,501.48
Nephrology 1 $11,361.87 $11,361.87
Other 1 $9,307.90 $9,307.90
Cardiovascular Disease 1 $8,680.34 $8,680.34
Neurophysiology, Clinical 1 $7,246.02 $7,246.02
P.A. 1 $6,025.74 $6,025.74
Gastroenterology 2 $5,209.76 $2,604.88
OBGYN 1 $4,711.61 $4,711.61
Surgery, Colon and Rectal 1 $4,109.00 $4,109.00
Total 100 $1,768,184.93 $382,441.41
Table 4. Expenditures for top 100 recipients by specialty, FY08.
One physician, whose self-identified specialty is psychiatry, had over $112,000 expended on
him or her, the greatest amount of pharmaceutical marketing dollars spent on any single Vermont
prescriber in FY08. The monies came from four pharmaceutical companies, with nearly 92% from one
company, nearly 93% in the form of cash or check, and over 90% for speaker fees or payments.
Three categories of non-physicians are listed in the top 100 individual recipients. The top 100
recipients include four advance practice registered nurses (nurse practitioners), two registered nurses,
and one physician’s assistant. Together these 7 individuals received 5.7% of the total amount received
by the top 100 recipients, and 3.5% of the total for expenditures in Vermont in FY08.
7
Credentials
Number of
Recipients
Total
Received
Percentage
of Total
for top 100
Average per
Recipient
APRN 4 $51,926.25 2.90% $12,981.56
RN 2 $43,418.41 2.40% $21,709.21
P.A. 1 $6,025.74 0.34% $6,025.74
Total 7 $101,370.39 5.7% $40,716.51
Table 5. Expenditures for APRNs, RNs and Physician’s Assistants in top 100 recipients,
FY08.
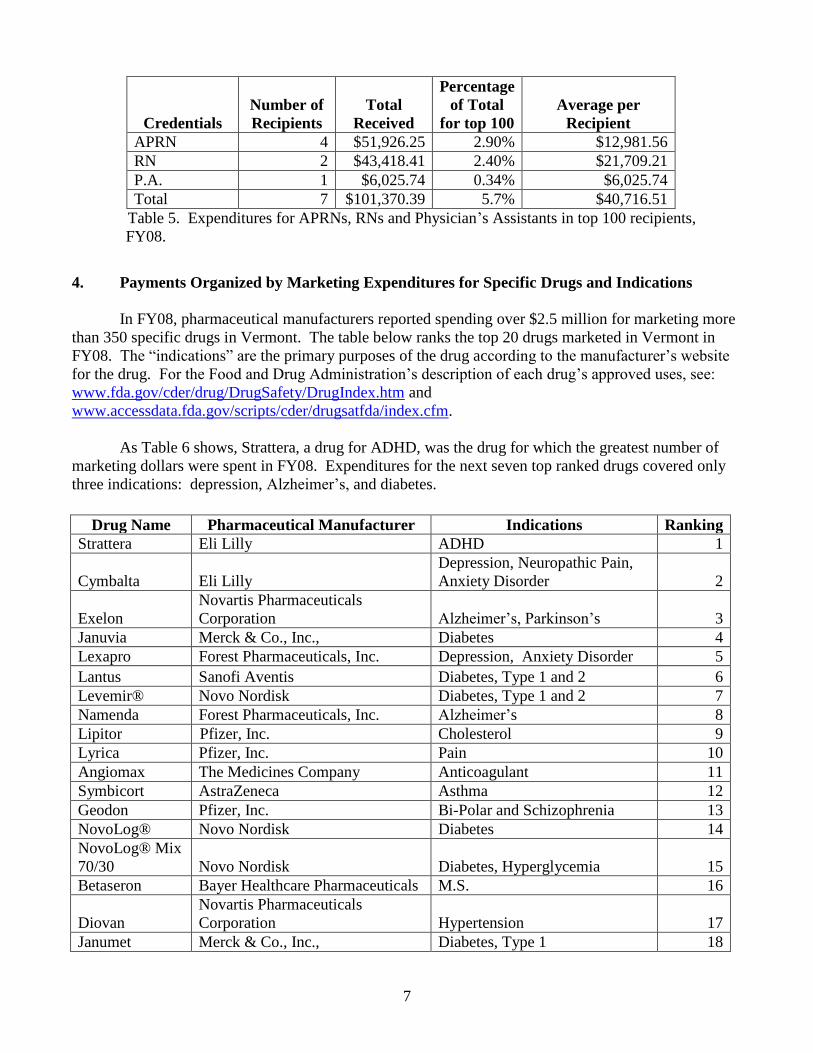
4. Payments Organized by Marketing Expenditures for Specific Drugs and Indications
In FY08, pharmaceutical manufacturers reported spending over $2.5 million for marketing more
than 350 specific drugs in Vermont. The table below ranks the top 20 drugs marketed in Vermont in
FY08. The “indications” are the primary purposes of the drug according to the manufacturer’s website
for the drug. For the Food and Drug Administration’s description of each drug’s approved uses, see:
www.fda.gov/cder/drug/DrugSafety/DrugIndex.htm and
www.accessdata.fda.gov/scripts/cder/drugsatfda/index.cfm.
As Table 6 shows, Strattera, a drug for ADHD, was the drug for which the greatest number of
marketing dollars were spent in FY08. Expenditures for the next seven top ranked drugs covered only
three indications: depression, Alzheimer’s, and diabetes.
Drug Name Pharmaceutical Manufacturer Indications Ranking
Strattera Eli Lilly ADHD 1
Cymbalta Eli Lilly
Depression, Neuropathic Pain,
Anxiety Disorder 2
Exelon
Novartis Pharmaceuticals
Corporation Alzheimer’s, Parkinson’s 3
Januvia Merck & Co., Inc., Diabetes 4
Lexapro Forest Pharmaceuticals, Inc. Depression, Anxiety Disorder 5
Lantus Sanofi Aventis Diabetes, Type 1 and 2 6
Levemir® Novo Nordisk Diabetes, Type 1 and 2 7
Namenda Forest Pharmaceuticals, Inc. Alzheimer’s 8
Lipitor Pfizer, Inc. Cholesterol 9
Lyrica Pfizer, Inc. Pain 10
Angiomax The Medicines Company Anticoagulant 11
Symbicort AstraZeneca Asthma 12
Geodon Pfizer, Inc. Bi-Polar and Schizophrenia 13
NovoLog® Novo Nordisk Diabetes 14
NovoLog® Mix
70/30 Novo Nordisk Diabetes, Hyperglycemia 15
Betaseron Bayer Healthcare Pharmaceuticals M.S. 16
Diovan
Novartis Pharmaceuticals
Corporation Hypertension 17
Janumet Merck & Co., Inc., Diabetes, Type 1 18
8
Humira Abbott
Rheumatoid Arthritis; Juvenile
Idiopathic Arthritis, Crohn’s
Disease, Plaque Psoriasis 19
Tekturna
Novartis Pharmaceuticals
Corporation Hypertension 20
Table 6. Ranking of 20 drugs with greatest expenditures, FY08.
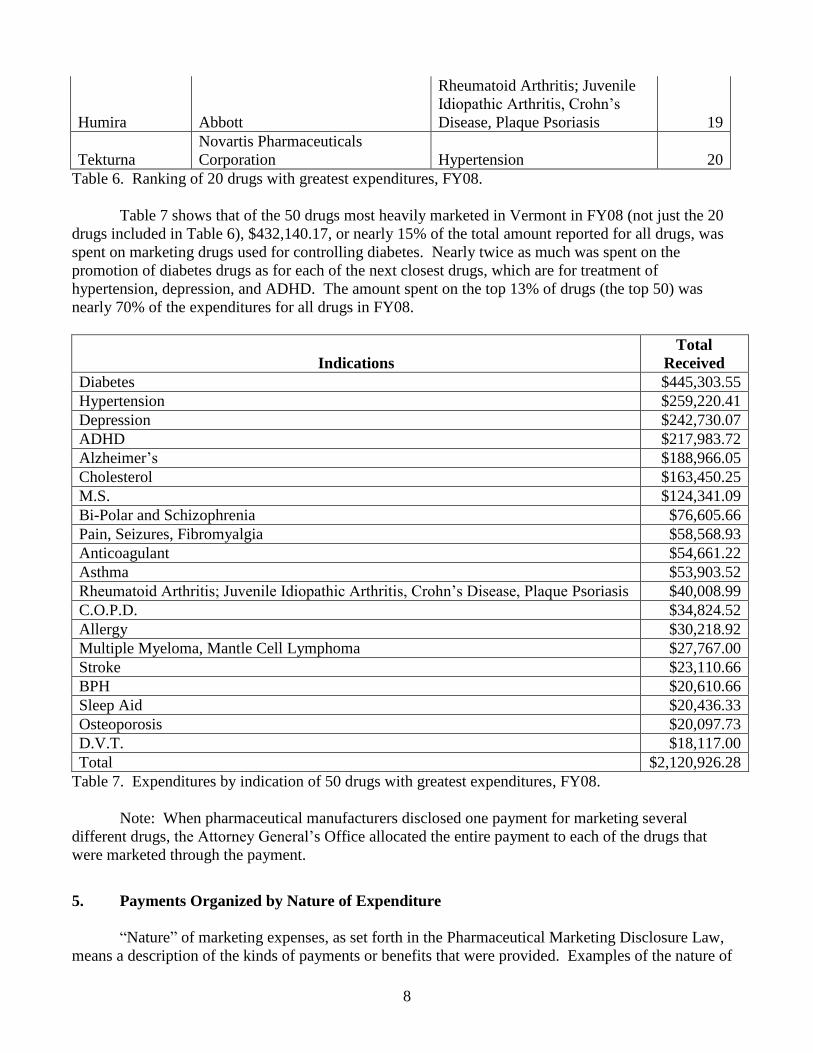
Table 7 shows that of the 50 drugs most heavily marketed in Vermont in FY08 (not just the 20
drugs included in Table 6), $432,140.17, or nearly 15% of the total amount reported for all drugs, was
spent on marketing drugs used for controlling diabetes. Nearly twice as much was spent on the
promotion of diabetes drugs as for each of the next closest drugs, which are for treatment of
hypertension, depression, and ADHD. The amount spent on the top 13% of drugs (the top 50) was
nearly 70% of the expenditures for all drugs in FY08.
Indications
Total
Received
Diabetes $445,303.55
Hypertension $259,220.41
Depression $242,730.07
ADHD $217,983.72
Alzheimer’s $188,966.05
Cholesterol $163,450.25
M.S. $124,341.09
Bi-Polar and Schizophrenia $76,605.66
Pain, Seizures, Fibromyalgia $58,568.93
Anticoagulant $54,661.22
Asthma $53,903.52
Rheumatoid Arthritis; Juvenile Idiopathic Arthritis, Crohn’s Disease, Plaque Psoriasis $40,008.99
C.O.P.D. $34,824.52
Allergy $30,218.92
Multiple Myeloma, Mantle Cell Lymphoma $27,767.00
Stroke $23,110.66
BPH $20,610.66
Sleep Aid $20,436.33
Osteoporosis $20,097.73
D.V.T. $18,117.00
Total $2,120,926.28
Table 7. Expenditures by indication of 50 drugs with greatest expenditures, FY08.
Note: When pharmaceutical manufacturers disclosed one payment for marketing several
different drugs, the Attorney General’s Office allocated the entire payment to each of the drugs that
were marketed through the payment.
5. Payments Organized by Nature of Expenditure
“Nature” of marketing expenses, as set forth in the Pharmaceutical Marketing Disclosure Law,
means a description of the kinds of payments or benefits that were provided. Examples of the nature of
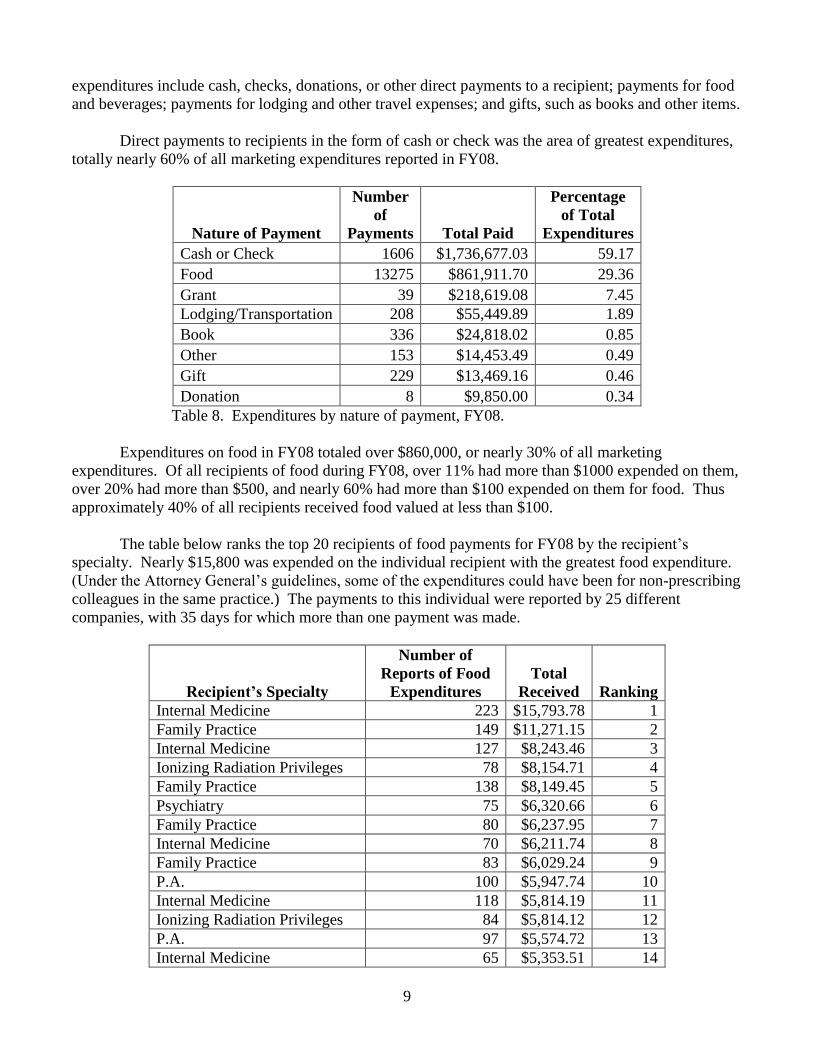
9
expenditures include cash, checks, donations, or other direct payments to a recipient; payments for food
and beverages; payments for lodging and other travel expenses; and gifts, such as books and other items.
Direct payments to recipients in the form of cash or check was the area of greatest expenditures,
totally nearly 60% of all marketing expenditures reported in FY08.
Nature of Payment
Number
of
Payments Total Paid
Percentage
of Total
Expenditures
Cash or Check 1606 $1,736,677.03 59.17
Food 13275 $861,911.70 29.36
Grant 39 $218,619.08 7.45
Lodging/Transportation 208 $55,449.89 1.89
Book 336 $24,818.02 0.85
Other 153 $14,453.49 0.49
Gift 229 $13,469.16 0.46
Donation 8 $9,850.00 0.34
Table 8. Expenditures by nature of payment, FY08.
Expenditures on food in FY08 totaled over $860,000, or nearly 30% of all marketing
expenditures. Of all recipients of food during FY08, over 11% had more than $1000 expended on them,
over 20% had more than $500, and nearly 60% had more than $100 expended on them for food. Thus
approximately 40% of all recipients received food valued at less than $100.
The table below ranks the top 20 recipients of food payments for FY08 by the recipient’s
specialty. Nearly $15,800 was expended on the individual recipient with the greatest food expenditure.
(Under the Attorney General’s guidelines, some of the expenditures could have been for non-prescribing
colleagues in the same practice.) The payments to this individual were reported by 25 different
companies, with 35 days for which more than one payment was made.
Recipient’s Specialty
Number of
Reports of Food
Expenditures
Total
Received Ranking
Internal Medicine 223 $15,793.78 1
Family Practice 149 $11,271.15 2
Internal Medicine 127 $8,243.46 3
Ionizing Radiation Privileges 78 $8,154.71 4
Family Practice 138 $8,149.45 5
Psychiatry 75 $6,320.66 6
Family Practice 80 $6,237.95 7
Internal Medicine 70 $6,211.74 8
Family Practice 83 $6,029.24 9
P.A. 100 $5,947.74 10
Internal Medicine 118 $5,814.19 11
Ionizing Radiation Privileges 84 $5,814.12 12
P.A. 97 $5,574.72 13
Internal Medicine 65 $5,353.51 14
10
Family Practice 90 $5,348.21 15
Ionizing Radiation Privileges 56 $5,306.99 16
A.P.R.N. 75 $5,299.92 17
P.A. 69 $5,182.64 18
Internal Medicine 81 $5,009.92 19
Family Practice 92 $5,005.66 20
Table 9. Expenditures on food for the top 20 individual recipients of food, FY08.
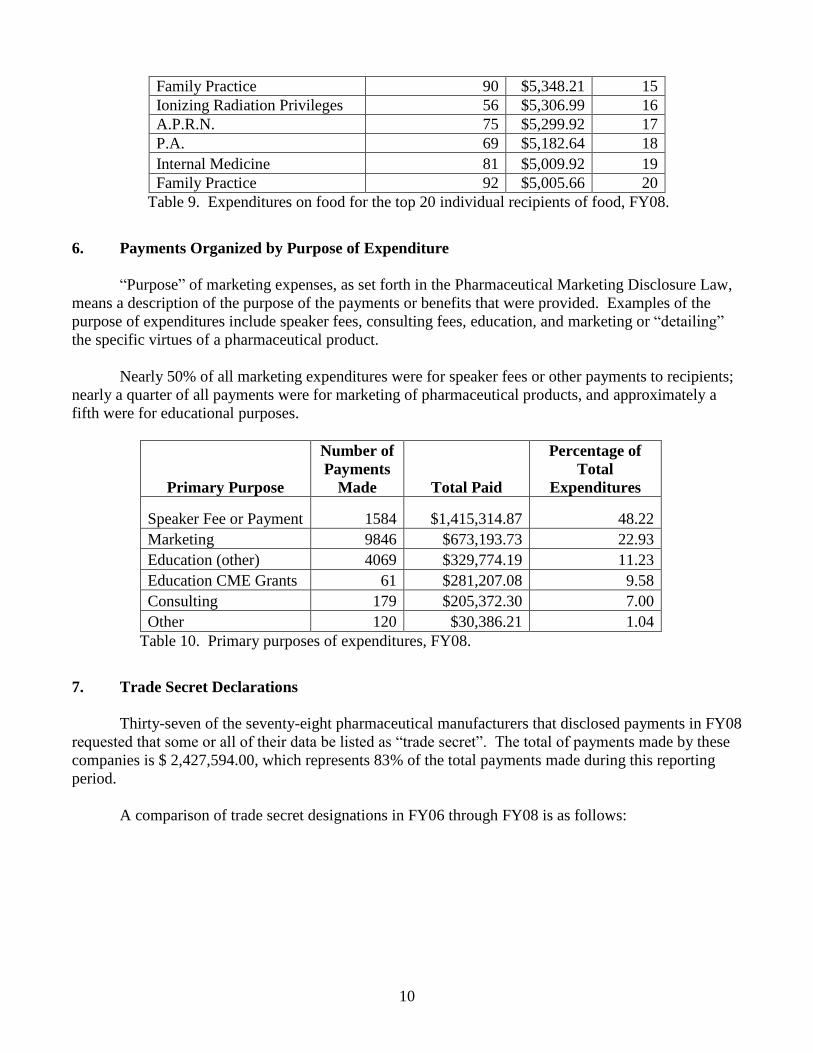
6. Payments Organized by Purpose of Expenditure
“Purpose” of marketing expenses, as set forth in the Pharmaceutical Marketing Disclosure Law,
means a description of the purpose of the payments or benefits that were provided. Examples of the
purpose of expenditures include speaker fees, consulting fees, education, and marketing or “detailing”
the specific virtues of a pharmaceutical product.
Nearly 50% of all marketing expenditures were for speaker fees or other payments to recipients;
nearly a quarter of all payments were for marketing of pharmaceutical products, and approximately a
fifth were for educational purposes.
Primary Purpose
Number of
Payments
Made Total Paid
Percentage of
Total
Expenditures
Speaker Fee or Payment 1584 $1,415,314.87 48.22
Marketing 9846 $673,193.73 22.93
Education (other) 4069 $329,774.19 11.23
Education CME Grants 61 $281,207.08 9.58
Consulting 179 $205,372.30 7.00
Other 120 $30,386.21 1.04
Table 10. Primary purposes of expenditures, FY08.
7. Trade Secret Declarations
Thirty-seven of the seventy-eight pharmaceutical manufacturers that disclosed payments in FY08
requested that some or all of their data be listed as “trade secret”. The total of payments made by these
companies is $ 2,427,594.00, which represents 83% of the total payments made during this reporting
period.
A comparison of trade secret designations in FY06 through FY08 is as follows:
11
Graph 3. Percentages of trade secret designations, FY06-FY08.
0.00%
10.00%
20.00%
30.00%
40.00%
50.00%
60.00%
70.00%
80.00%
90.00%
FY 06 FY 07 FY 08
Pecentage of Information
Fields Declared Trade
Secret
Percentage of Total
Payments
Appendix - page 1
FY08 - Ranking by Company Name
(Johnson and Johnson subsidiaries combined)
Company Ranking
Eli Lilly and Company .....................................................................................................................1
Pfizer, Inc. ........................................................................................................................................2
Novartis Pharmaceuticals Corporation ............................................................................................3
Merck & Co., Inc. and Merck Schering Plough ..............................................................................4
Forest Pharmaceuticals, Inc. (subsidiary of Forest Laboratories, Inc.) ...........................................5
sanofi aventis US LLC .....................................................................................................................6
GlaxoSmithKline .............................................................................................................................7
AstraZeneca .....................................................................................................................................8
Takeda Pharmaceuticals America, Inc. ............................................................................................9
Abbott ............................................................................................................................................10
Novo Nordisk, Inc... .......................................................................................................................11
Johnson and Johnson Companies *................................................................................................12
The Medicines Company ...............................................................................................................13
Bayer Healthcare Pharmaceuticals, Inc. ........................................................................................14
UCB, Inc. .......................................................................................................................................15
EMD Serono, Inc. ..........................................................................................................................16
Boehringer Ingelheim Pharmaceuticals, Inc. .................................................................................17
Daiichi-Sankyo, Inc. ......................................................................................................................18
Procter & Gamble Pharmaceuticals, Inc. .......................................................................................19
Schering-Plough .............................................................................................................................20
Hoffmann-La Roche, Inc. ..............................................................................................................21
Wyeth Pharmaceuticals ..................................................................................................................22
Bristol-Myers Squibb Company ....................................................................................................23
Amgen, Inc. ....................................................................................................................................24
Millennium Pharmaceuticals, Inc. .................................................................................................25
Biogen Idec, Inc. ............................................................................................................................26
Shire Pharmaceuticals, Inc. ............................................................................................................27
Actelion Pharmaceuticals US, Inc. ................................................................................................28
Cephalon, Inc. ................................................................................................................................29
Sepracor, Inc. .................................................................................................................................30
Allergan, Inc. .................................................................................................................................31
Teva Pharmaceuticals ....................................................................................................................32
Genentech, Inc. .............................................................................................................................33
Reckitt Benckiser Pharmaceuticals ................................................................................................34
Alcon Laboratories, Inc. ................................................................................................................35
Hospira, Inc. ...................................................................................................................................36
Astellas Pharma US, Inc. ...............................................................................................................37
Sanofi Pasteur, Inc .........................................................................................................................38
Onyx Pharmaceuticals, Inc. ...........................................................................................................39
Salix Pharmaceuticals, Inc .............................................................................................................40
Appendix - page 2
Reliant Pharmaceuticals .................................................................................................................41
Endo Pharmaceuticals, Inc. ............................................................................................................42
Dey L.P. .........................................................................................................................................43
Duramed Pharmaceuticals, Inc. a subsidiary of Barr Pharmaceuticals ........................................44
Solvay Pharmaceuticals, Inc. .........................................................................................................45
Abraxis Bioscience LLC ................................................................................................................46
Baxter Healthcare Corporation ......................................................................................................47
Acorda Therapeutics, Inc. ..............................................................................................................48
Meda Pharmaceuticals, Inc. ...........................................................................................................49
Alpharma Pharmaceuticals, LLC ...................................................................................................50
Eisai, Inc. / Eisai Corporation of North America...........................................................................51
Enzon Pharmaceuticals, Inc. ..........................................................................................................52
MedImmune ...................................................................................................................................53
Solstice Neurosciences, Inc. ..........................................................................................................54
King Pharmaceuticals, Inc. ............................................................................................................55
MGI Pharma, Inc. / Eisai Corporation of North America ..............................................................56
Watson Pharma, Inc. (Watson Pharmaceuticals, Inc.) ...................................................................57
Cubist Pharmaceuticals, Inc. ..........................................................................................................58
Amylin Pharmaceuticals, Inc. ........................................................................................................59
Alkermes, Inc. ................................................................................................................................60
Purdue Pharma L.P. .......................................................................................................................61
Tibotec Therapeutics, a division of Ortho-Biotech Products L.P. ................................................62
Intendis, Inc....................................................................................................................................63
Valeant Pharmaceuticals ................................................................................................................64
CSL Behring LLC ..........................................................................................................................65
Stiefel Laboratories, Inc. ................................................................................................................66
Genzyme Corporation ....................................................................................................................67
Jazz Pharmaceuticals, Inc. .............................................................................................................68
Talecris Biotherapeutics, Inc. ........................................................................................................69
WARNER CHILCOTT .................................................................................................................70
UDL Laboratories, Inc. ..................................................................................................................71
Graceway Pharmaceuticals LLC....................................................................................................72
Companies with nothing to report.
(OSI) Eyetech, Inc. (subsidiary of OSI Pharmaceuticals Inc.)
Alexion Pharmaceuticals, Inc.
Axcan Pharma US, Inc.
B. Braun Medical, Inc.
Barr Laboratories a subsidiary of Barr Pharmaceuticals, Inc. 225
BioMarin Pharmaceutical, Inc.
CV Therapeutics, Inc.
DENTSPLY Pharmaceutical
Elan Pharmaceuticals, Inc.
ETHEX Corporation
Eyetech, Inc.
Fresenius Medical Care North America
Appendix - page 3
Galderma Laboratories L.P.
GE HealthCare
Gilead Sciences, Inc.
GTx, Inc.
ImClone Systems Corporation f/k/a ImClone Systems, Inc.
KV Pharmaceuticals / Ther-Rx Corporation
Mallinckrodt, Inc.
Novartis Vaccines and Diagnostics, Inc.
Noven Therapeutics LLC a subsidiary of Noven Pharmaceuticals, Inc.
Novogyne Pharmaceuticals
Odyssey Pharmaceuticals, Inc. a subsidiary of Barr Pharmaceuticals
Otsuka America Pharmaceutical, Inc.
Ovation Pharmaceuticals, Inc.
Par Pharmaceutical, Inc.
Patriot Pharmaceuticals LLC
Pliva, Inc. a subsidiary of Barr Pharmaceuticals, Inc.
Santarus, Inc.
Sciele Pharma, Inc.
Synergy Medical Education
Upsher-Smith Laboratories, Inc.
* Johnson and Johnson Companies: Centocor, Inc., Ethicon Inc., Janssen L.P., McNeil Pediatrics,
Ortho Clinical Diagnostics, Ortho Womens Health and Urology, Ortho-Biotech Products L.P.,
Ortho-McNeil Neurologics, OrthoNeutrogena, PriCara, Scios, Inc., Vistakon Pharmaceuticals
LLC
TOTAL................................................................................................................ $2,935,248.3
Number of companies without Johnson and Johnson reporting expenditures ............................... 71
Number of Johnson and Johnson companies reporting expenditures .............................................. 7
Total Number of Companies Reporting Expenditures ............................................................. 78
Number of companies without Johnson and Johnson with no expenditures.................................. 32
Number of Johnson and Johnson companies with no expenditures ................................................. 5 Total Number of Companies ............................................................................................. 115