Pharmaceutical Copay Assistance Programs and … Copay Assistance Programs and Patient Drug Choice:...
54
Pharmaceutical Copay Assistance Programs and Patient Drug Choice: Biological Specialty Drugs Shirley Yarin 1 Department of Economics Stanford University, Stanford, CA 94305 [email protected] Under the direction of Prof. Liran Einav May 7, 2015 Abstract In an effort to manage prescription drug spending, health insurers design tiered copay schemes that steer patients towards buying lower-price drugs. In response, pharmaceutical companies issue coupons (called copay cards) that can lower the high copayments insurers assign to non-preferred drugs. This paper exploits the lifting of a ban on coupons in Massachusetts effective July 2012. The paper examines the effect of the ban lift on patients’ choice of drug brand as well as changes in the cost burden shared by insurers and patients. I use pharmacy claims data for biological specialty drugs that treat Multiple Sclerosis and Rheumatoid Arthritis to examine the effect of copay cards on insurers’ costs and patients’ purchasing behavior. I find that brand names that introduced coupons following the ban lift saw a 16% increase in the number of prescriptions (scripts) and patients per quarter relative to brand names that did not offer coupons. Moreover, I find evidence that the likelihood that a transaction had a coupon increases with the copayment. Lastly, I find that for a given drug brand, following the ban lift, transactions with a coupon also had higher copayments. This fact suggests that the introduction of coupons in Massachusetts was offset by a decrease in the share of the drug cost covered by the insurer, resulting in no change in the patient’s out-of- pocket payment. Keywords : Tiered co-pay schemes, co-pay offset programs, prescription drug choice, pharmaceutical pricing, and coupons 1 I would like to thank Jason Rucker, Director of Copay Offset Monitor at Zitter Health Insights, a healthcare research firm that consults life science companies, for graciously offering me access to pharmacy claims data of biological specialty drugs. I also thank Professor Liran Einav, who served as my thesis advisor and Marcelo Clerici-Arias, who guided me throughout the writing process.
Transcript of Pharmaceutical Copay Assistance Programs and … Copay Assistance Programs and Patient Drug Choice:...
Pharmaceutical Copay Assistance Programs and Patient Drug Choice: Biological Specialty Drugs
Shirley Yarin1
Department of Economics Stanford University, Stanford, CA 94305
Under the direction of Prof. Liran Einav
May 7, 2015 Abstract
In an effort to manage prescription drug spending, health insurers design tiered copay schemes that steer patients towards buying lower-price drugs. In response, pharmaceutical companies issue coupons (called copay cards) that can lower the high copayments insurers assign to non-preferred drugs. This paper exploits the lifting of a ban on coupons in Massachusetts effective July 2012. The paper examines the effect of the ban lift on patients’ choice of drug brand as well as changes in the cost burden shared by insurers and patients. I use pharmacy claims data for biological specialty drugs that treat Multiple Sclerosis and Rheumatoid Arthritis to examine the effect of copay cards on insurers’ costs and patients’ purchasing behavior. I find that brand names that introduced coupons following the ban lift saw a 16% increase in the number of prescriptions (scripts) and patients per quarter relative to brand names that did not offer coupons. Moreover, I find evidence that the likelihood that a transaction had a coupon increases with the copayment. Lastly, I find that for a given drug brand, following the ban lift, transactions with a coupon also had higher copayments. This fact suggests that the introduction of coupons in Massachusetts was offset by a decrease in the share of the drug cost covered by the insurer, resulting in no change in the patient’s out-of-pocket payment. Keywords: Tiered co-pay schemes, co-pay offset programs, prescription drug choice, pharmaceutical pricing, and coupons
1 I would like to thank Jason Rucker, Director of Copay Offset Monitor at Zitter Health Insights, a healthcare research firm that consults life science companies, for graciously offering me access to pharmacy claims data of biological specialty drugs. I also thank Professor Liran Einav, who served as my thesis advisor and Marcelo Clerici-Arias, who guided me throughout the writing process.

Shirley Yarin
2
1 Introduction
Unlike in perfectly competitive markets, pharmaceutical prices are set well
above marginal cost to compensate for high research and development (R&D) costs.
Additionally, demand for healthcare products is distorted because consumers only
face a small portion of the drug cost. In particular, consumers might pay a fixed
amount called a copay for the drug, and the insurer will cover the rest of the cost.
The copay of the drug depends on the copay scheme of the insurer, which is often
segmented into tiers. A typical tier structure might look as follows: generics,
preferred brands, and off-patent and non-preferred brands. Drug manufacturers
that can negotiate lower prices for the insurer are placed in the first two tiers. In
order to incentivize patients to buy favorably tiered drugs, insurers will make the
copays for drugs in those tiers lower. For example, the out-of-pocket (OOP) cost for a
generic statin to lower cholesterol will be lower than that of a brand name drug.
In an effort to circumvent the tiered copay system, drug manufacturers can
directly offer insured patients a coupon, sometimes called a copay card, to lower
their OOP cost. For example, consider a brand name drug that costs $150 and a
generic alternative that costs $100. A patient’s copayments for the two drugs are
$50 and $30, respectively. Without the coupon, a patient who is indifferent between
the brand and generic drug will choose the generic medication. This scenario results
in the insurer paying $70 for the prescription. If the branded drug manufacturer
gives the patient a coupon that reduces the OOP cost to $30, he is more likely to
choose the brand name drug and the insurer will pay $100. In this case, the

Shirley Yarin
3
branded drug manufacturer helps the patient to pay for $20 of copayment and earns
$100 from the insurer. This illustrated example shows how manufactures of
non-preferred drugs can use coupons to steer patients to buy their product.
According to Zitter Health Insights Co-Pay Offset Monitor, about 700 brand-
name drugs offered coupon programs in 2014, constituting an increase of 61% in
less than two years. Even though coupon programs accounted for less than 5% of all
dispensed prescriptions, more than one-third of biological specialty drug 2
transactions used a copay card in 2014. The use of copay cards, however, varies
drastically by therapeutic class. For Rheumatoid Arthritis (RA), which accounted
for about half of specialty pharmacy scripts, the percentage of prescriptions with a
copay offset was 56% in the third quarter of 2013. Without a coupon, the average
copay for an RA script was $60 while with a coupon, the copay is only $0-$5. For
Multiple Sclerosis (MS), which accounted for about a quarter of specialty scripts,
28% of prescriptions had a copay offset. The average co-pay for an MS script was
$76, but coupons reduced patients’ OOP cost to about $10.
The rising prevalence of coupon programs may be partially explained by the
rise in high copay and coinsurance tiers. According to the Kaiser/HRET Survey of
Employer-Sponsored Health Benefits (2013), the distribution of covered workers
facing different cost-sharing formulas for prescription drug benefits has seen a
2 Specialty pharmacy scripts refer to medications that require special handling and auxiliary services to treat diseases such as: cancer, cystic fibrosis, immune deficiency, multiple sclerosis, osteoarthritis, and rheumatoid arthritis.

Shirley Yarin
4
significant increase in the number of plans with four or more tiers3. In 2013, the
share of such plans was 23%, up from 14% in 2012. The shift towards fourth-tier
copay tiers requires patients to cover a larger portion of the cost. In this sense,
pharmaceutical copay cards can help lower patients’ OOP cost for biological
specialty drugs that are not covered by their insurance. If tiered copay schemes
depend on copay differentials, however, then it is important to assess the effect of
this rise in drug coupons on insurers’ costs and patients’ purchasing choices.
The main debate surrounding pharmaceutical coupons concerns their
potential to undermine the tiered copay system. Critics of copay programs claim
that coupons induce consumers to purchase more expensive drugs, thereby making
insurers charge higher premiums and increasing total healthcare costs. On the
other hand, proponents of copay cards assert that coupons make medications more
affordable to consumers and improve drug compliance. This paper tests the
hypotheses of whether coupons induce purchases and whether they change how the
cost of the drug is allocated across patients and insurers. Towards this end, I
present an empirical evaluation of the effect of coupons on the number of scripts
sold and the cost covered by the patient and the insurer. The central question is if
coupons actually reduce patients’ out-of-pocket cost or do insurers simply rearrange
copay amounts so that consumers end up paying the same as without coupons.
I rely on pharmaceutical data for biological specialty drugs that treat
Multiple Sclerosis and Rheumatoid Arthritis provided by a healthcare research
3 Among workers with three or-more tier plans, the average copayments in these plans are $11 for first-tier drugs, $31 for second-tier drugs, $53 for third-tier drugs, and $83 for fourth-tier drugs.
Shirley Yarin
5
company called Zitter Health Insights. In the data, I observe national retail dollars
and unit sales of each script at quarterly frequency from January 2012 to June
2014. My data set includes information on over 2,056,557 prescriptions and
1,421,127 patients. This data set contains information on the medication, including
its trade name, whether it is brand or generic, the disease it is used to treat, and
whether it is a refill; it also includes the zip code of the pharmacy where the drug
was sold, the specialty of the prescribing physician, the total cost of the drug, and
the amount covered by insurance, patient, and coupon.
My empirical strategy exploits a policy change that repealed the ban on using
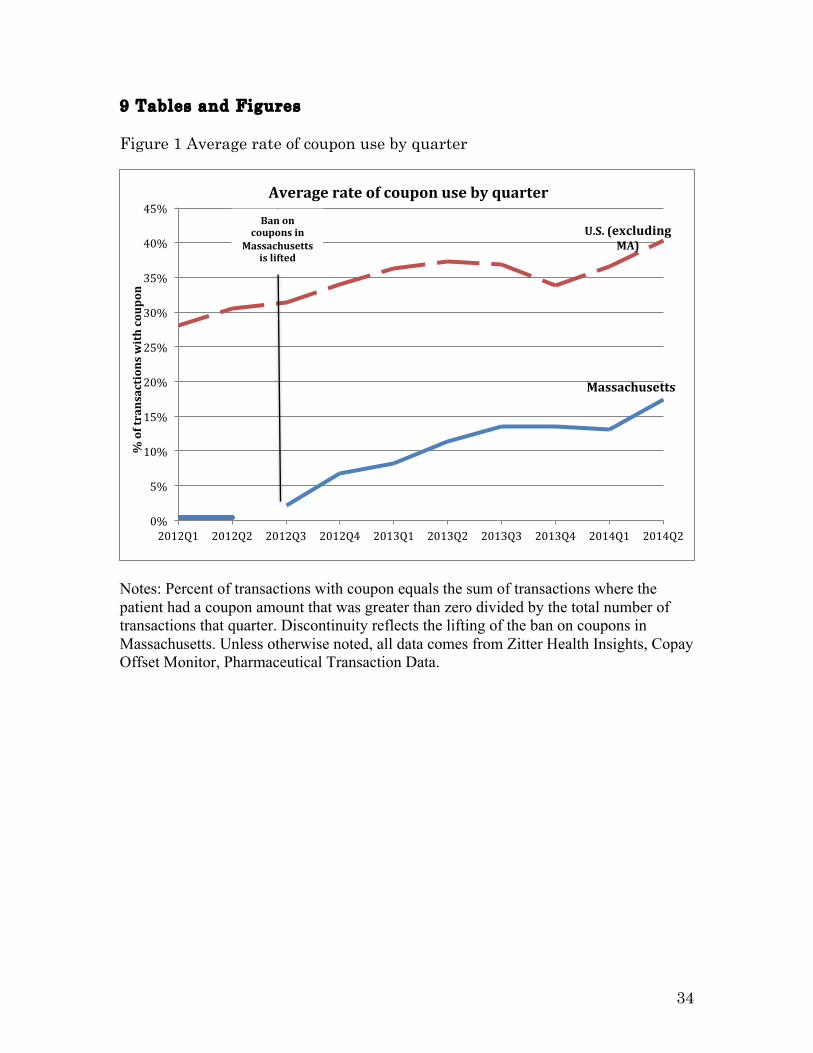
coupons to purchase biological specialty drugs in Massachusetts. Figure 1 shows the
mean portion of transactions that used a coupon in Massachusetts and the rest of
the U.S. over each quarter. The data demonstrates that before the ban is lifted, the
average share of transactions involving a coupon was zero whereas after the ban
lift, the number steadily increases in a similar fashion to the rest of the United
States. If a similar chart is plotted for comparison states like New Hampshire or
Rhode Island, no such trend is found (see Appendix section 9.1). This paper exploits
this change in policy to isolate the effect of coupons on health spending in
Massachusetts. Using sources of variation in the offering of coupons by drug
companies after the ban lift in a differences-in-differences method, I can estimate
the ban lift’s effect on the number of scripts sold. Moreover, the variation among
coupon use in transactions for the same brand name allows me to also examine
whether coupons change the share of the drug cost covered by insurers.

Shirley Yarin
6
I find that companies that distributed coupons in Massachusetts after the
ban lift saw an increase of 1,339.6 in the number scripts sold per quarter,
corresponding to a 15.8% increase relative to companies that did not offer coupons.
Similarly, companies that distributed coupons had an increase of 866.3 patients per
quarter, corresponding to a 15.9% increase. Based on changes in copay structures,
my analysis finds that the redeemable coupon amount is offset by an increase in
copays. This indicates that on net there is almost no change in patients’ out-of-
pocket costs.
This paper is organized into the following sections. Section 2 provides a brief
overview of the Massachusetts copay ban and biological specialty drugs. In Section
3, I review the relevant literature in three sections: papers that study the impact of
tiered copay structures on healthcare costs, papers that examine company
advertising strategies, and a paper that conducts a welfare analysis of drug
coupons. Section 4 discusses the data set, how I construct my sample, and how I
define variables of interest. Section 5 describes my empirical methodology,
particularly the differences-in-differences strategy and other econometric models. In
Section 6, I explain the results of the regressions and show the effects of the
Massachusetts coupon ban lift on drug sales and patient cost. Section 7 concludes
with a discussion of copay cards and directions for further research.

Shirley Yarin
7
2 Background
This paper exploits a recent overturn of an amendment in Massachusetts
that outlawed the use of coupons in pharmacy transactions. Before 2012,
Massachusetts was the only state to outlaw the use of drugs coupons. “The
Massachusetts statute (Mass. Gen. Laws ch. 175H, § 3) contains a broad prohibition
on soliciting, receiving, offering, or paying remuneration in return for purchasing,
or to induce a person to purchase, any good, facility, service, or item for which
payment may be made by a healthcare insurer.” On July 8, 2012, Governor Deval
Patrick signed the Massachusetts budget bill, which contained a provision lifting
the state’s anti-kickback law. The new law allows for the limited use of copay cards
and other coupons with the purchase of biologicals and brand name drugs with no
generic alternatives. This new provision, effective July 1, 2012, applied to all
Massachusetts residents except for those enrolled in Medicare, Medicaid, and other
federal health care programs that are still subject to federal anti-kickback laws.
At this point, it is worth mentioning why biological specialty drugs are given
special treatment under the law. Unlike other drugs, biological specialty drugs lack
generic alternatives because an FDA review and approval procedure for biosimilars
is still in the process of being developed. This means that Massachusetts’s residents
suffering from illnesses like Rheumatoid Arthritis (RA) or Multiple Sclerosis (MA)
could have experienced a significant drop in their out-of-pocket costs for drugs in
the third quarter of 2012. This exogenous policy change serves as a natural
experiment to examine the effect of copay cards on insurers’ costs. In particular,

Shirley Yarin
8
this paper will test the hypothesis that insurers in Massachusetts absorbed the
shock of the ban lift by simply raising the copay band of patients whose net OOP
expense remained constant. The paper also examines the change in the composition
of patients’ purchasing behavior to see if they substitute drugs that do not offer
coupons for those that do.
The data in this paper focuses exclusively on medications for two diseases,
which deserve a brief discussion. The first is Multiple Sclerosis (MS), which is
considered to be an immune-mediated disease in which the body's immune system
attacks the central nervous system. In particular, the immune system attacks
myelin, which is the fatty substance that surrounds and insulates the nerve fibers,
distorting nerve impulses traveling to and from the brain and spinal cord and
producing a variety of symptoms. The second disease is Rheumatoid Arthritis (RA),
which is also considered to be an autoimmune disorder in which the immune system
mistakenly attacks a patient’s joints causing painful inflammation and damage.
Multiple Sclerosis does not have a cure, but there are treatment options that
slow down the course of the disease. Taken on a long-term basis, medications can
reduce the severity of relapses and the accumulation of lesions. The majority of MS
medications are biologicals, which means that they are genetically engineered drugs
that provide patients with substances that are naturally produced by the body's
immune system. So far, experts have found that the immune system protein
interferon beta is effective in treating MS. My data set contains four drugs of this
form: Avonex, Betaseron, Extavia, and Rebif. Table 1.1 compares the mode of

Shirley Yarin
9
administration and administration intervals for drugs that treat MS. The table
shows that drugs are taken in intervals that range from twice a day to every four
weeks, administered by mouth or by injection. The main takeaway from this table;
however, is that there is no clear winner for ease of use and that medication choice
largely depends on physicians’ advice and individual preference. Nevertheless, it is
worthwhile to note that since these medications take a few months to work,
switching drugs leaves patients unprotected for long periods of time.
Rheumatoid Arthritis also has no cure. Medications can only reduce
inflammation in joints to relieve pain and prevent or slow joint damage. Patients
have four main medication options: anti-inflammation drugs, steroids, disease-
modifying antirheumatic drugs, and biologicals. As noted earlier, the majority of
drugs in my data set are biologicals, which interfere with biologic substances that
cause or worsen inflammation. Similar to Table 1.1, Table 1.2 compares routes of
delivery and frequency of medications that treat RA. Because drugs vary wildly
across these two factors, there are no direct substitutes and drug choice rests
heavily on doctors’ orders. Clinical research and experience suggest that these
drugs also exhibit meaningful differences in their efficacy and safety, and that
switching between biological therapies is not advisable. The fact that consumer
drug choice is relatively sticky and that patients can incur switching costs means
that coupons that induce purchases can have a significant effect on pharmaceutical
companies’ profits and insurers’ costs.

Shirley Yarin
10
3 Related Literature
3.1 Multi-tiered copay schemes
The first section of the literature review contains papers that assess the
extent to which tiered copay schemes are successful at managing consumer
behavior. The relevance of tiered copay structures to drug coupons rests on the
following conjecture: if the success of insurance cost-sharing programs relies on
copay differentials, then the introduction of coupons could undermine their effect.
Rector et al. (2003) develops an empirical framework to study whether tiered
prescription copayments affect patients’ use of preferred brand medication. In
particular, the paper tests whether financial incentives in drug formularies are
effective in getting patients to buy preferred drugs. The authors employ a
longitudinal logistic regression analysis of pharmacy claims from 1998 and 1999
comparing concurrent groups that were or were not exposed to tiered copayments.
The study focuses on enrollees in four independent physician practices across three
main therapeutic classes: ACEI, PPI, and STATIN drugs. The study showed that
tiered prescription copayments correspond to a statistically significant increase in
the use of preferred brands of ACEI, PPI and STATIN over time.
In a similar study, Gilman and Kautter (2008) assess the impact of
multitiered copayments on the use and cost of prescription drugs among Medicare
beneficiaries. The paper compares individuals enrolled in retirement health plans
with one tier with those enrolled in plans with three tiers, and finds that the latter
group had lower total drug expenditures, fewer prescriptions filled, and higher out-

Shirley Yarin
11
of-pocket costs than individuals in lower tiered plans. The portion of generic
prescriptions was also higher among the three-tiered group. Additionally, the
authors look at the effect of cost sharing on the use of medications that treat chronic
conditions. They find that while tiers are effective at lowering drug expenditures
among Medicare beneficiaries, they are less effective in influencing the behavior of
patients who have chronic conditions. The implication of these papers is that copay
differentials are an important determinant in consumer purchasing behavior. This
means that coupon programs bear the potential of steering patients towards non-
preferred brands, thereby, circumventing the tiered copay scheme.
Dickstein (2014) develops a model of physician and patient incentives in
prescription drug choice. The paper addresses two main distortions in the market
for prescription drugs: (i) consumer moral hazard problem stemming from the fact
that patients do not face the full cost of the drug, (ii) asymmetric information as
physicians know more about the severity of patients’ condition. The paper seeks to
resolve whether the benefits of higher cost sharing, which come in the form of lower
short-term costs, outweigh the unintended potential consequence of lower
adherence rates, which can raise health costs in the long run. Dickstein uses
variation in three plan types, PPO, HMO, and Capitated HMO, to identify the effect
of different cost sharing structures on physician prescribing choices between brand
and generic medications that treat depression.
To address the problem of self-selection bias, Dickstein restricts the sample
to patients who are newly diagnosed with depression, and as a result are less likely

Shirley Yarin
12
to select a health plan based on copay amounts. He finds that physicians facing
capitation elect psychotherapy at higher rates and are more likely to prescribe
generic brands. However, plans with high degrees of cost sharing also have the
poorest rates of adherence, which may lead to costly relapse. This paper serves as a
good starting point for understanding the tradeoffs between higher cost sharing, in
the absence of coupons, and potentially lower compliance rates that are associated
with patients not being able to afford their medications. Unlike this paper which
focused on the prescribing behavior of physicians, my paper will address the
purchasing behavior of patients through variation not in plan structure but in
coupon use.
3.2 Pharmaceutical pricing strategy
The next section of the literature review surveys papers that examine
company-advertising decisions. The first paper focuses on the advertising cycle of
pharmaceutical companies in the face of patent expiry. The second paper assesses
the empirical validity of theories for why manufacturers offer coupons.
Bhattacharya and Vogt (2003) propose a dynamic model to explain why branded
pharmaceutical prices rise after their patents expire and generics enter the market.
The model predicts a pattern of rising prices and diminishing advertising over a
drug’s life cycle. The logic behind this is that initially pharmaceutical firms build
the public’s stock of knowledge about their drug, and then they take advantage of it
and of physicians’ sticky prescribing habits. Even though generic entry should force
the price of branded drugs down, the model of knowledge diffusion predicts that a

Shirley Yarin
13
brand’s knowledge stock will outweigh the competitive force on prices. The author
test the predictions of the model using data on beta-blockers, using time to expiry as
an instrument that affects pricing and advertising but is not correlated with
demand. They find confirmation for price dynamics based on the accumulation of
knowledge stock for branded drugs. The patent life of drugs is an important factor
to consider when assessing a firm’s decision to offer coupons. Specifically, if the
patent on a brand name drug is close to expiry and the company is worried about
competition from generics, it might be willing to offer coupons to compensate for the
copay differential to stop consumers from switching to the generic version.
Expanding on the question of companies’ advertising strategies, Nevo and
Wolfram (2002) explore the question of why do manufacturers issue coupons. The
paper is an empirical analysis of the market for breakfast cereals, a highly
concentrated stable oligopoly. The authors seek to assess the empirical validity of
four major explanations: (i) price discrimination, (ii) fluctuating demand,
(iii) retailers’ objectives and costs, and (iv) cross-brands effects. To do so, they
compare shelf prices in given cities and quarters for which a coupon was distributed
for a particular brand and other cities in which a coupon was not distributed.
Nevoand Wolfram find that shelf prices are lower during periods when
coupons are available. This is in support of models of price discrimination in
oligopoly settings that suggest inter-brand competition that causes all prices to be
lower than the uniform (nondiscriminatory) price. They also find that coupons are
used most intensely at the end of manufacturers’ fiscal years when brand managers
Shirley Yarin
14
are trying to meet sales targets. Finally, they find a positive correlation between
lagged coupon use and current sales, suggesting that coupons are used to encourage
purchases. In addition to providing a useful way to think about the return on
coupon marketing campaigns, this paper raises questions about the long-term
implication of drugs coupons. In particular, can copay card programs result in price
discrimination if consumers self-select into groups that do and do not use coupon?
Are drug coupons a “foot-in-the-door” loyalty program to get patients on drugs and
prevent them from switching when a generic alternative becomes available? While
the scope of this paper does address these broader questions, these questions should
still be raised when discussing the welfare implication of coupons.
3.3 Contribution
Though coupons in retail markets have received considerable attention from
economists, there has been no significant study on the effect of pharmaceutical
coupon programs. One paper that seriously addresses this question is by Lee (2013)
who presents a welfare analysis of coupons in pharmaceuticals. His paper seeks to
address two questions: (i) how do coupons impact the agency problem of consumers
not facing the full cost of drugs? (ii) how does the ability of drug manufacturer to
target coupons to particular types of consumer affect their profitability? Using data
from the IMS Health on dollars and unit sales of different molecule/form/strength
combinations at monthly frequency from January 2003 to August 2011, Lee
compares outcomes under random versus targeted distribution of coupons and
allows pharmaceutical companies to change their prices in response to coupons.
Shirley Yarin
15
After running counterfactual simulations, Lee finds a net drop in welfare because
the increase in insurance costs exceeds the increases in consumer surplus due to
lower copayments. Additionally, the paper concludes that pharmaceutical
companies that distribute coupons can rely on consumers to self-select into groups
to achieve price discrimination and increase profits.
This paper contributes to the existing literature by exploiting an exogenous
policy change that presents opportunities to compare treatment and control
observations across multiple periods. This differences-in-differences strategy, which
will be explained in detail in section five, allows me to isolate the effect of coupons
on each drug’s total number of scripts and patients per quarter. Additionally, this
paper exploits variations in coupon use for the same trade name to determine how
coupons change the cost burden of insurers and patients. This setup of a natural
experiment provides more causal evidence on the effect of coupons on consumer
copayments and insurers’ health costs.
4 Data 4.1 Summary of Data: Description of Sample Construction and Variables of Interest What I observe in the data:
This paper uses claims data for biological specialty drugs that treat Multiple
Sclerosis (MS) and Rheumatoid Arthritis (RA). The data was obtained from Zitter
Health Insights, a healthcare research firm that consults life science companies. In,
the data, I see transactions associated with 27 drug brands from across the country,
but the time stamp on each transaction is only associated with the quarter and the

Shirley Yarin
16
year to preserve privacy. At the prescription level, I am able to observe the drug
name, whether it is brand or generic, the disease it is used to treat, whether it is a
refill, the zip code of the pharmacy where the drug was sold, the specialty of the
prescribing physician, the total cost of the drug, and the amount covered by
insurance, patient, and the coupon.
The data set described above does not provide a way to identify individuals so
it is not possible to track purchasing decisions longitudinally. Because individuals
are de-identified, the data also does not include information on patients’ general
health status. Even though there is a variable to indicate whether the consumer
involved in the transaction is insured, there is no detailed information on the
insurance type or extent of coverage. As such, there is no way of telling which tier a
drug is classified under, though usually drugs in high copay bands are considered to
be in higher tiers. As can be seen in the last row of Table 2, the data set has
495,940 observations for MS and 842,042 observations for RA, resulting in a total of
1,337,982 transactions from across the United States. Some of these transactions
involve multiple scripts and patients. Table 1 provides a breakdown of transactions
on the patient and script level across time for each drug class.
How I construct the subsample:
The results in this paper come from a sample of 63,736 transactions with zip
codes in Massachusetts. In addition, I restrict my attention to individuals with
insurance. Table 3 categorizes transactions by coverage type. As can be seen from
the second row fourth column, 99.25% of the data is composed of individuals with

Shirley Yarin
17
insurance. The reason I exclude people without health insurance is because coupons
are only offered people with health insurance. Including noninsured in the
non-coupon users “control” group will bias the results because the characteristic of
having insurance is not orthogonal to health spending.
Variables of interest:
Table 4 shows basic statistics for the main variables in the data set. The unit
of observation is the transaction, which may involve more than one script and
patient. The first string variable is the name of the drug. The next two variables are
indicators that equal one if the drug sold in the transaction is brand (versus
generic) or if the drug is used to treat MS (as opposed to RA) and zero otherwise. As
can be seen from the second row third column of Table 4, 99.8% of transactions
involved brand name drugs, as expected in the case of biological specialty drugs.
Row 3 column 3 shows that 37% of transactions involved medication used to treat
MS while the remaining 63% of transactions involved drugs that treat RA. The next
string variable specifies the zip code of the pharmacy where the transaction took
place from all across the nation. The zip code variable proves to be extremely
important in the ensuing analysis because it provides a way to separate
observations from Massachusetts in the pre- and post- ban period.
The fifth row is a dummy variable that equals one if the transaction is for a
refill prescription. As can be seen from the fifth row third column of Table 3, 61% of
the transactions involved refills as opposed to new prescriptions. The variable in
row six of table 4 specifies the specialty of the prescribing physician, which varies

Shirley Yarin
18
across 140 categories. The next two variables indicate the number of scripts and
patients involved in every transaction. In order to get cost information on a per unit
basis, I divide the total cost variables (rows 9-13 of Table 4) by the product of the
total number of patients and scripts per transaction. For example, when I do this
operation on the variable total_spend ($) from row 9, I obtain the variable
total_spend_per script in row 14, the average of which was $4,425 for a one-month
supply of drugs that treat MS and RA. I do the same procedure to the rest of the
cost variables (rows 10-13), which specify the amount covered by the insurance, the
consumer, the coupon, and a charitable subsidy in that order.
Out of the $4425 average total cost for a one-month supply of both medication
types, the insurer covers on average $4141 per script. The standard deviation for
both of these numbers is roughly $3000. The maximum drug cost is $142,815 while
the maximum insurance payment is $135,674. While the insurer pays an average of
about $4000 per script, the patient’s average out-of-pocket is only $109 (with a
standard deviation of $340 and a maximum of $75,133). The average amount of
coupon assistance from the drug manufacturer is $42 (with a standard deviation of
$270 and a maximum of $13,252), which constitutes roughly half of the patient’s
copay. Lastly, row 19 of table 4 gives summary statistics for the dollar amount that
patients receive in the form of subsidies from charitable organizations. The average
assistance from non-pharmaceutical companies is only $3. Because the magnitude
of donations is insignificant compared to the total cost of the drug (on the order of
$4000), it will not be featured in the ensuing analysis.

Shirley Yarin
19
Variables I constructed:
In addition to per unit cost variables, I create the following aggregate
variables: Total_Scripts is the sum of the number of scripts (can be found in Table 4
row 8) per quarter for each drug, classified into two groups of brands that offered
coupons after the ban lift and those that did not. Total_Patients is the sum of the
number of patients (can be found in Table 4 row 7) per quarter for each drug, split
into the same two groups as above. To run to the differences-in-differences
regression, I also needed to create the following dummy variables: Treat signifies
that the transaction involves a brand that offered coupons after the ban lift, Post
signified that the transaction took place in MA after the ban lift, and Treat*Post is
the interaction variables that equals one if the brand offered coupons and the
transaction occurred after the lift.
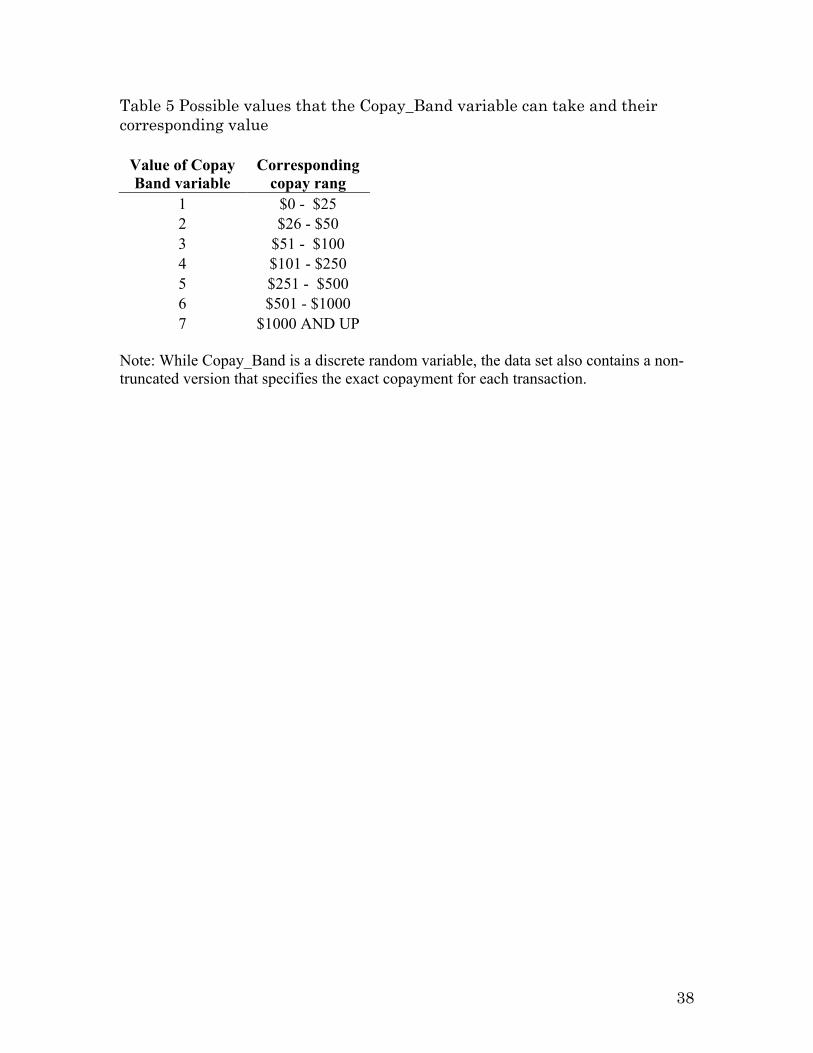
Another important discrete random variable is Copay_Band, which takes on
seven possible values copay range from $0 - $25 to $1000 AND UP as detailed in
table 5. Even though Copay_Band is a truncated variable, there is a separate copay
variable that allows us to observe the exact copay amount the patient was expected
to pay out-of-pocket in each transaction.
Lastly, I construct variables to quantify the cost burden of each party. Each
variable equals the amount paid by the player divided by the total cost of the drug
as detailed in the Appendix section 9.2.

Shirley Yarin
20
4.2 Summary Statistics
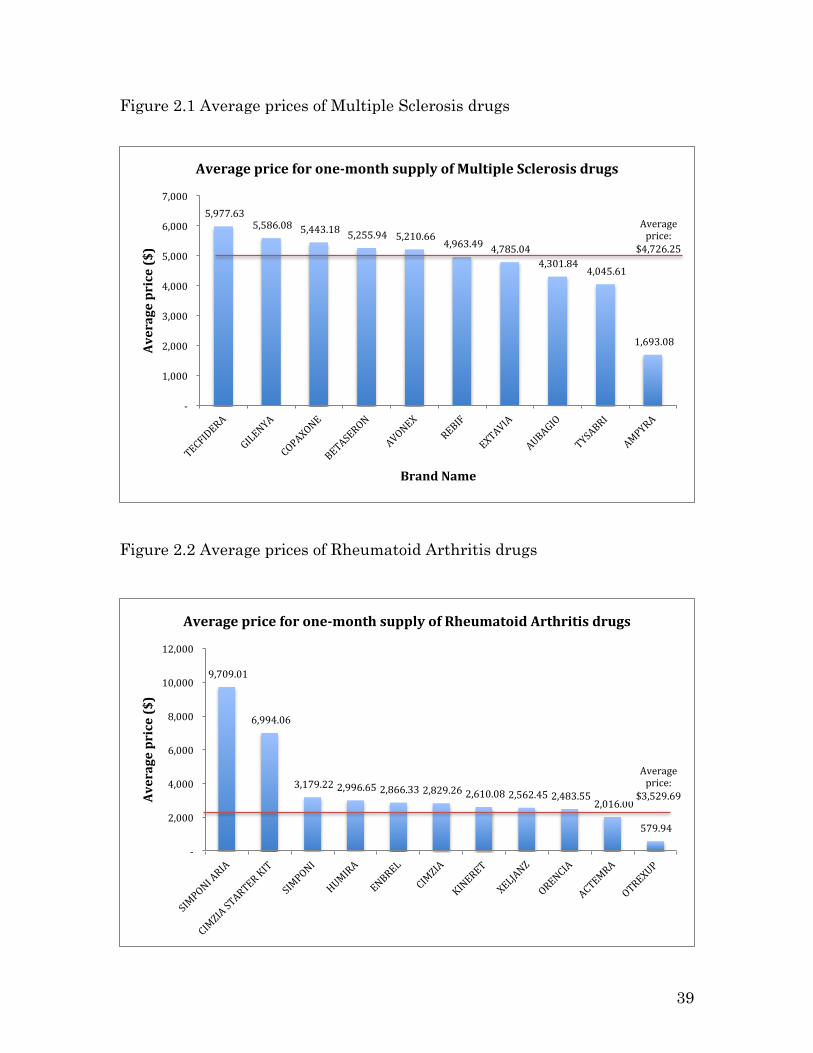
Figures 2.1 and 2.2, which show the average price for a one-month supply of
Multiple Sclerosis and Rheumatoid Arthritis drugs, demonstrate that drug brands
can vary significantly in prices. The average price of a one-month supply of MS
medication is $4,726, while the average price of a one-month of RA medication is
$3,529. The high price of these biological drugs emphasizes the importance of
insurance coverage and the potential role for coupons to influence patients’ choices.
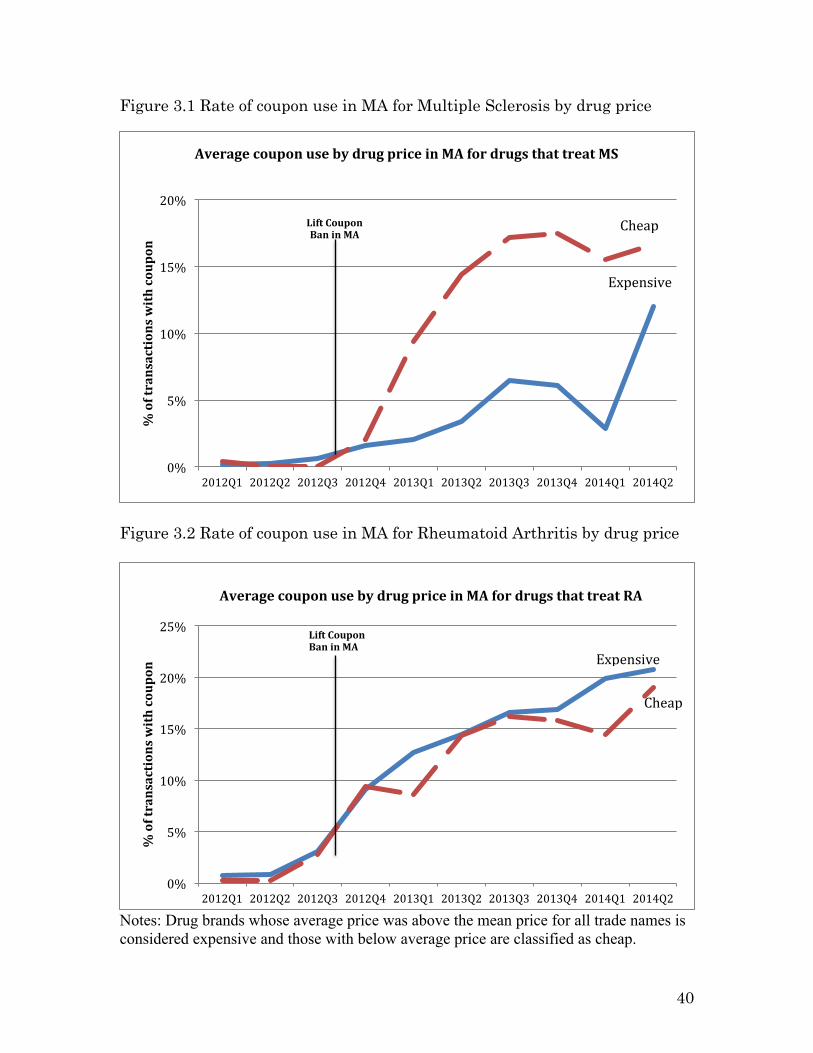
Charts 3.1 and 3.2 group drug brands into two groups: those with prices above the
average and those below. In this case the two drug treatments exhibit different
behaviors. For MS, the drugs with above-average prices issued fewer coupons in
Massachusetts after the ban lift, while for RA drugs with above-average prices
issued slightly more coupons.
Despite their high costs, most biologicals have copays that are less than $100.
The last rows of Tables 6.1 and 6.2 show the percentage of transactions that fall
across the copay bands. Adding the percentages for each column, we see that for
Multiple Sclerosis, 88% of transactions fell within the $0 - $100 copay range and for
Rheumatoid Arthritis, the cumulative share of transactions that fell within that
range is 83%. The main takeaway from this table is that the majority of copays are
less than $100, meaning that the insurance company covers almost the entire cost
of the drug. However, the next tables show that coupons start to play a major role
precisely when copays exceed $100.
Shirley Yarin
21
Tables 7.1 and 7.2 show the breakdown of dollar amount spent on coupons by
pharmaceutical companies across these copay bands. Over the period of 2012Q1-
2014Q2, pharmaceutical companies spent $21,728,771 on coupons for MS
medication, constituting 1% of total transaction costs. Alternatively for RA drugs,
pharmaceutical companies spent $95,702,287 on coupons, which represented 2% of
total transaction costs over the period. It is important to note that more coupons are
redeemed in transactions that involve drugs with copays of $101 and up. In
particular, the last rows of tables 7.1 and 7.2 show that for MA, 83% of the total
amount spent on coupons fell in this range and for RA it was 76%. Lastly, tables 8.1
and 8.2 show the share of the drug cost born by insurers and patients by copay
band. The second to last row in both tables show that the insurer’s coverage of drug
cost significantly drops in extreme copay categories of $500 or more, where the
majority of coupons are redeemed.
Table 9.1 and 9.2 show which pharmaceutical companies spent the most on
coupons in 2013. In addition, it lists the companies’ sales and relative market share
ranking for that year. Both tables show that there is discernable variation among
the brand names in the percent of national transactions with a coupon. Secondly,
we see that for MS, the biggest market player Copaxone is also the one with the
highest percentage of coupons, but that other big players like Avonex and Gilenya
had very few transactions with coupons in the 2013 data. Meanwhile Tecfidera and
Ampyra, who had large percentage of transactions with coupons, had relatively low
sales figures in 2013. For RA, the correlation between coupon offering and market

Shirley Yarin
22
size seems clearer. Specifically, the two biggest players Humira and Enerbal are
also the ones whose transactions had the most coupons redeemed, while the rest of
the brands had less coupons and lower sales figures.
In order to exploit the variation in coupon offering in Massachusetts after the
ban lift, I had to first identify which brands offered coupon and which ones did not.
Table 10 shows the percent of transactions in Massachusetts with coupons from
2012Q1 to 2014Q2 for each drug brand. As can be seen from the first three rows of
the first table, the three MS brands that began to offer coupons after the ban lift are
Ampyra, Aubagio, and Tecfidera. By contrast, for RA, all but the last three brand
names, Acterma, Kineret, and Methotrexate, started offering coupons after the ban
was lifted.
5 Empirical Methodology
This paper uses three main identification strategies that will be discussed in
turn. First, I employ a differences-in-differences approach that only uses insured
individuals in Massachusetts because coupons are only offered to people with
insurance. This approach relies on the fact that some pharmaceutical firms did not
offer coupons even after the ban was lifted, at least not in the time frame of the
study (see Table 10). This variation in coupon offering presents a natural division
between control and treatment firms. The following equations were used to analyze
the effect of coupons on two dependent variables of interest:
Total_Scriptsit = α0 + α1Drug_Brandi + α2Quartert + α3Treati*Postt + ξit (1)
Total_Patientsit = B0 + B1Drug_Brandi + B2Quartert + B3Treati*Postt + εit (2)

Shirley Yarin
23
Where Total_Scripts is sum of scripts for drug i in quarter t, Total_Patients is sum
of patients for drug i in quarter t, Drug_Brand are fixed effects to pick up
characteristics of drug brands that are constant over time period, Quarter are fixed
effects to capture time trends, Treat is a binary variable that equals one if the drug
company offered coupons after the ban lift and zero otherwise, and Treat*Post is an
interaction term and the variable of interest.
Note that this strategy relies on the assumption that firms that started
offering coupons after the ban lift and those that did not exhibit parallel trends in
the period before the ban was lifted. The diff-in-diff approach isolates the effect that
offering coupons had on the sales of pharmaceutical companies, both in terms of
number of scripts and number of patients per quarter. In essence, this approach
subtracts the change in the number of scripts and patients experienced by brands
that did not offer coupons (the first difference) from the change experienced by those
that did offer coupons (the second difference) in order to not attribute the effect of
time passage to the introduction of coupons.
The second estimation strategy exploits variation in coupon use among
transactions for the same drug. Even for a drug that had a coupon program after
the ban lift, not all patients redeemed a coupon in transactions involving that drug.
This portion of the analysis is restricted to observations of insured patients in
Massachusetts after the lifting of the ban. The comparison of transactions with and
without a coupon allows me to assess how the cost burden shouldered by the insurer
and the patient changes after the introduction of coupons.

Shirley Yarin
24
In order to estimate the effect of coupons on patients’ copay band, I first
employ a multinomial logit model to estimate the probability that a transaction
with a coupon will land in one of the following seven copay bands. The
corresponding regression equation is:
Pr(Copay_band = z) = γ0 + γ1Couponi + γ2MSi + γ3Refilli + εi (3)
Where Copay band is a discrete dependent variable that takes on seven
possible values (see Table 5), i stands for transaction that occur in Massachusetts
after the ban lift, Coupon is binary variable that equals one if the transaction had a
redeemable coupon amount that is greater than zero, MS is an indicator variable for
whether the medication treats Multiple Sclerosis (as opposed to Rheumatoid
Arthritis), and Refill is dummy for whether that prescription was a refill.
We are interested in the coefficient on the coupon dummy, γ1. In the data
section, we observed the trend that the highest coupon amounts are redeemed at
high copay bands (see Table 7), so we should expect the coefficient on the coupon
dummy to increase relative to the baseline as we increase the copay band.
Finally, in order to examine how the cost of medications with coupons gets
allocated across insurers and patients, I run the following set of regressions:
Yi = α0 + α1Couponi + α2MSi + α3Refilli +α4Tradenamei + α5MD_specialtyi+ ξit (4)
Where Y stands for one of six variables: Total drug cost, Insurance cost, Insurance
cost share (see Appendix 9.2 for explanation), Patient cost share, Copay amount,
and Patient out-of-pocket. Additionally, i stands for transaction that occur in

Shirley Yarin
25
Massachusetts after the ban lift, Tradename is the fixed effect for each drug brand,
and MD_specialty is the fixed effect for the specialty of the prescribing physician.
The results from this regression could go one of two ways: it is possible that coupons
reduce the out-of-pocket cost of patients and that the insurance company ends up
carrying a larger cost burden. It is also possible, however, that the coupon amount
is offset by an increase in the copay amount, resulting in a zero net change in the
OOP spending of the patient. If the latter is true, then coupons do not result in a
change in the cost of the patient, but a change in the framing of who is paying for it.
6 Results
6.1 Comparing brands that did not introduce coupons to those that did
Before I ran the differences-in-differences regressions, I plotted the raw data
to verify that the two groups exhibit different trends after the ban lift. Chart 4.1
shows that the portion of transactions with coupons is significantly different across
the treatment and the control group whose percentage is flat at zero. Chart 4.2
shows the divergence in the total number of scripts across the two groups. It can be
seen that before the ban lift both groups were relatively flat, with the control group
(drugs that did not introduce coupons after ban lift) having slightly more scripts.
However, after the ban is lifted, the number of scripts for brand names that offered
coupons increased even though it decreased for brands that did not offer coupons.
Similarly, Chart 4.3 shows the same story but with total number of patients. Both
groups start out at roughly the same level and growth rate, but after the ban lift the

Shirley Yarin
26
number of patients for brands that offered coupons increased by more than for
brands that did not offer them.
Table 11 shows the results from the diff-in-diff regression assessing the effect
of coupons on total scripts and patients and confirms the story from the figure 5.
The results present the coefficient from regression specified in equations (1) and (2)
in the empirical methodology section. The coefficients were obtained by aggregating
the unit transaction level data into quarterly buckets and the results should thus be
interpreted as quarterly averages. As can be seen in Table 11, both coefficients on
the interaction term are positive and statistically significant at the 99% level. In
particular, the first row of Table 13 shows that the introduction of coupons for
specific brands was associated with an increase of 1,339.6 scripts per quarter, which
corresponds to a 15.8% increase relative to the starting level. Moreover, those drug
brands that introduced coupons following the ban lift saw an increase of 866.3
patients per quarter, corresponding to a 15.9% increase relative to drug brands that
did not offer coupons.
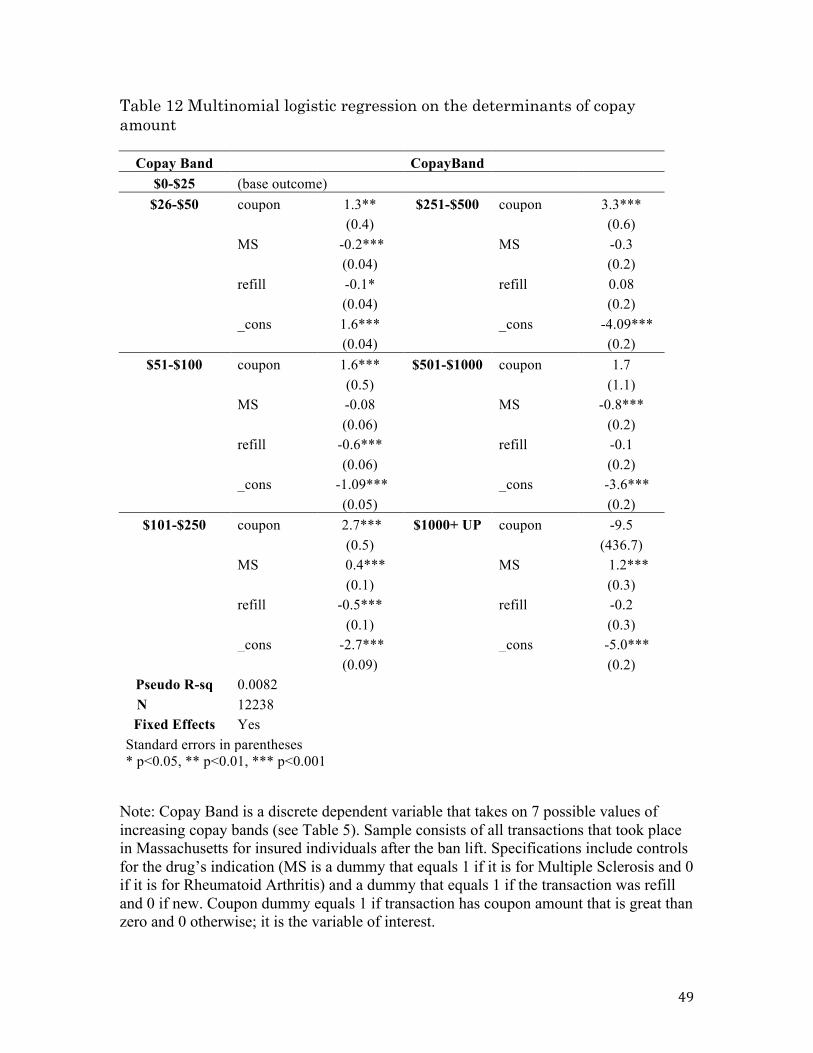
6.2 Assessing the impact of coupons on copay bands
Table 12 shows the results from the multinomial logit regression of copay
band categories on whether a coupon was used in the transaction. In particular, it
presents the coefficients from running the regression specified by equation (3) in the
empirical methodology section. In my regression, the first copay band of $0-$25 is
omitted due to multicollinearity. As such, all coefficients should be interpreted

Shirley Yarin
27
relative to this baseline. In addition, this regression is restricted to transactions of
insured patients in Massachusetts after the ban lift.
The coefficients on the coupon dummy in Table 12 show that the presence of
a coupon in the transaction increases the multinomial log-odds for a higher copay
band relative to the omitted category. In other words, the likelihood that a
transaction had a coupon increases as the copay band rises. For example, the cell in
the second row first column of Table 12 shows that redeeming a coupon at purchase
increases the likelihood that the transaction had a copay between $26-$50 by 1.3
relative the baseline. Similarly, for copay band $251-$500 (row two column two) the
coefficient is 3.3. The coefficient on the coupon dummy increases monotonically with
copay range until it reaches $500. While the first four coefficients are statistically
significant at the 99% confidence level, the last two coefficients are not statistically
significant perhaps because there are fewer observations in that range. Focusing on
the negative coefficients on the refill dummy that are statistically significant is also
revealing. Specifically, we see that refill prescriptions are more likely to belong to
the cheapest $0-$25 copay range.
6.3 Do coupons change the share of the cost covered by insurance?
The third and final portion of the analysis exploits variation in coupon usage
among transactions for the same brand name in Massachusetts after the ban lift. It
is illustrative to start with a case example that appears multiple times in the data.
Chart 5 presents a four-panel story that starts by plotting the average coupon
redeemable amount for transactions with and without a coupon. Obviously for those
Shirley Yarin
28
without a coupon, the amount is constant at zero. However, for transactions with a
coupon, the average redeemable starts at around $20 and steadily increases until it
reaches $220. The total price of the drug steadily increases over time, for both
coupon and non-coupon transactions. What is interesting to note, though, is how the
sharp rise in coupon amount is matched by a steep decline in the share of the drug
cost covered by insurance and, consequently, a sharp rise in the share covered by
the patient. This sequence of events suggests that on net, the patient did not benefit
from the coupon because it was used to cover a higher copay.
Even though it is tempting to generalize this story to the rest of the data,
doing so would be seriously misleading as figure 5 was based on one drug, Orencia
and its 1482 observations. These figures do, however, serve as a good starting point
to hypothesize about what we could expect to see once we use all 63,736
observations from Massachusetts. Now that the motivation for this section has been
laid out, Table 13 presets the results from regressing total price and the share
covered by insurer and patient on the presence of a coupon in the transaction. The
regression also includes fixed effects for brand name and the specialty of the
prescribing physician (see equations 4 in the empirical methodology section).
Table 13 shows that the story is not as clear as it seems. In particular, the
first column has the total drug cost as the dependent variable, and the coefficient on
the coupon dummy is not statistically significant. The same holds for the dollar
amount paid by the insurer to cover the cost of the medication, which is dependent
variable in the second column. The rest of the coefficients are statistically

Shirley Yarin
29
significant. In particular, the drop in the portion of the cost covered by the insurer
is almost exactly matched by the increase in the copay’s percentage of total cost.
Specifically, the third column regresses the insurance share of the cost on the
coupon dummy and results in a negative coefficient of 0.02 while the fourth column
regresses the copay share of the cost on the same dummy and results in a positive
coefficient of 0.02. In addition, the fifth column regresses the dollar amount the
insurance expects the patient to pay for the drug and shows that this amount
increases by $57.4 dollars when a coupon is used in the transaction. Nevertheless,
the sixth column shows that the actual amount paid by the patient out-of-pocket
(which equals the copay amount minus the value of the coupon) decreases by less
than one dollar. This means that even though consumers have a coupon, because
they are now required to cover a greater portion of the drug’s cost, the net change in
OOP expense is about zero.
As an exercise to further test this hypothesis, I ran the same set of
regressions on four subsamples: (1) MS drugs whose price is above average (2) MS
drugs whose price is below average (3) RA drugs whose price is above average and
(4) RA drugs whose price is below average. I do not present the full results in a
table because most of the coefficients turn out to be statistically insignificant. The
only dependent variable for which the coefficient on the coupon dummy is
statistically significant is the share of the drug cost covered by the copay. Table 14
summarizes the results. For Rheumatoid Arthritis, the coefficient is not
significantly different across the two groups. However, the last two rows show that

Shirley Yarin
30
for Multiple Sclerosis drugs that are priced above average, having a coupon increase
the share of total cost covered by the copay (0.014 percentage points) by a
significantly lower amount than for MS drugs that priced below average price
(0.032 percentage points).
7 Conclusion
I examine the economic consequences of the lift on coupons for bio-specialty
drugs in Massachusetts in the third quarter of 2012. The advantages of evaluating
this policy change is that (a) its timing was well defined and (b) differences across
brand names and transactions allow for a treatment/control design. I find that
brand names that started introducing coupons following the ban lift saw close to a
16% increase in the total number of scripts and patients per quarter relative to
brand names that did not offer coupons. Moreover, I find support that coupons are
more likely to be used to pay for drugs that have high copays. Lastly, I find that the
introduction of coupons in Massachusetts was associated with a corresponding
decrease in insurers’ share of the drug cost, resulting in no change in patients’ out-
of-pocket cost.
A key outstanding issue is what causes insurance companies to raise the
copay for drugs that offer coupons. If patients with coupons are expected to cover a
larger portion of the drug cost, then their total out-of-pocket cost stays the same.
Because the effect of coupons on total drug price is inconclusive, it remains unclear
whether insurance companies pay more to cover patients who use coupons.

Shirley Yarin
31
Possibly, insurance companies try to keep their patients’ out-of-pocket cost the same
as without coupons in order to maintain the tiered structure, which incentivizes
patients to buy preferred drugs by giving them lower copayments.
This analysis of the use of coupons by pharmaceutical companies provides
several directions for further research. First, future researcher might study whether
coupons give pharmaceutical companies the power to price discriminate because
consumers self-select into customer segments that do and do not use coupons.
Further research should also explore paths by which drug coupons can be used in
loyalty programs or foot-in-the-door advertising campaigns. If physician-prescribing
habits are sticky as Bhattacharya claims, then targeted campaigns to physicians’
offices can have long-lasting effects. In addition to studying the validity of this
statement, researchers could look at the interplay between asymmetric information
and drug coupons. In particular, they could test if patients’ limited medical
knowledge makes them more likely to use a coupon given to them by a doctor even
when a cheaper generic alternative is available. Thirdly, future research could
exploit variations in the number of times a drug coupon can be redeemed to
determine if consumers switch drugs when their coupon expires. Finally, further
research could characterize the extent to which coupons create barriers to entry in
the pharmaceutical industry. This question is especially relevant for smaller
players who compete with established brand names that employ coupons to keep
consumers from switching over to substitutes. These ideas underscore the
importance of investigating pharmaceutical companies’ decision to issue coupons.
Shirley Yarin
32
Overall, my analysis provides a valuable starting point for further research to
understand how coupons affect sales and the out-of-pocket cost of patients.
8 References Bhattacharya, Jayanta, and William B. Vogt. 2003. "A Simple Model of
Pharmaceutical Price Dynamics," The Journal of Law and Economics
46(2): pp. 599-626. JSTOR. Web. 12 Aug. 2014.
"Biosimilars." U.S. Food and Drug Administration. Web. 12 Dec. 2015.
Crush, John J. 2004. "Biologic Treatments for Rheumatoid Arthritis." American
College of Rheumatology. Web. 15 Apr. 2015.
"Definition of MS." National Multiple Sclerosis Society. Web. 12 Feb. 2015.
Dickstein, M. 2014. "Physician vs. patient incentives in prescription drug choice,"
Stanford University. Working Paper.
Fein, Adam J. 2014. "Drug Channels: Co-Pay Offset Programs Are Blooming in
Specialty Pharmacy," Drug Channels. Web. 12 Aug. 2014.
Gilman, Boyd H., and John Kautter. 2007. "Impact of Multitiered Copayments on
the Use and Cost of Prescription Drugs among Medicare Beneficiaries,"
Health Research and Educational Trust.
Kaiser/HRET Survey of Employer-Sponsored Health Benefits, 2000-2013.
Lee, C. 2013. "A Welfare Analysis of Copay Coupons in Pharmaceuticals," Duke
University.Working Paper.

Shirley Yarin
33
Lovells, Hogan. "Massachusetts Amends Anti-kickback Law to Allow Certain
Prescription Drug Coupons," Lexology. Globe Business Publishing Ltd. Web.
12 Apr. 2015.
Nevo, Aviv, and Catherine Wolfram. 2002. "Why Do Manufacturers Issue Coupons?
An Empirical Analysis of Breakfast Cereals," The RAND Journal of
Economics 33(2): pp. 319-39.
O'Keeffe, Kevin, and Shiraz Hasan. 2012. "Making Dollars and Sense out of Copay
Assistance." IN VIVO 30.7: n. pag.
Palmer, Eric. 2013. "Top 10 Rheumatoid Arthritis Drugs 2013," FiercePharma 16
Sept. Web. 16 Apr. 2015.
Philippidis, Alex. 2014. "Top 10 Multiple Sclerosis Drugs," From Genetic
Engineering & Biotechnology News 18 Feb. Web. 15 Apr. 2015.
Rector, Thomas S. 2003. "Effect of Tiered Prescription Copayments on the Use of
Preferred Brand Medication," Medical Care 41.3: pp. 398-406. JSTOR.
Web. 20 Aug. 2014.
"Rheumatoid Arthritis." Mayo Clinic. Web. 14 Feb. 2015.
"Using Biologic Drugs to Treat Rheumatoid Arthritis Comparing Effectiveness,
Safety, Side Effects, and Price." 2013. Consumer Reports Best Buy
DrugsTM. Web. 16 Apr. 2015.
Zitter Health Insights, Copay Offset Monitor, Pharmaceutical Transaction Data for
Biological Specialty Drugs. Electronic data, 2014.
34
9 Tables and Figures Figure 1 Average rate of coupon use by quarter
Notes: Percent of transactions with coupon equals the sum of transactions where the patient had a coupon amount that was greater than zero divided by the total number of transactions that quarter. Discontinuity reflects the lifting of the ban on coupons in Massachusetts. Unless otherwise noted, all data comes from Zitter Health Insights, Copay Offset Monitor, Pharmaceutical Transaction Data.
0%
5%
10%
15%
20%
25%
30%
35%
40%
45%
2012Q1 2012Q2 2012Q3 2012Q4 2013Q1 2013Q2 2013Q3 2013Q4 2014Q1 2014Q2
% of transactions with coupon
Average rate of coupon use by quarter Ban on
coupons in Massachusetts
is lifted
U.S. (excluding MA)
Massachusetts

35
Table 1.1 Multiple Sclerosis medications: mode of administration and administration intervals
Brand Name Must be repeated Administration AMPYRA Twice a day By mouth AUBAGIO Daily By mouth AVONEX Every week Intramuscular injection BETASERON Every other day Subcutaneous injection COPAXONE Daily Subcutaneous injection EXTAVIA Every other day Subcutaneous injection GILENYA Daily By mouth REBIF 3 times / week Subcutaneous injection TECFIDERA Twice a day By mouth TYSABRI Every 4 weeks Intravenous infusion
Notes: Note that some drugs may have alternate routs of delivery. Information about drugs is taken from the National Multiple Sclerosis Society. Table 1.2 Rheumatoid Arthritis medications: mode of administration and
administration intervals
Brand Name Must be repeated Administration ACTEMRA Every 4 weeks Intravenous infusion CIMZIA Every other week Subcutaneous injection ENBREL Weekly Subcutaneous injection HUMIRA Every other week Subcutaneous injection KINERET Daily Subcutaneous injection
ORENCIA Every 4 weeks or weekly
Intravenous infusion or Subcutaneous injection
SIMPONI Once a month Subcutaneous injection
Notes: Note that some drugs may have alternate routs of delivery. Information about drugs is taken from Consumer Reports Best Buy DrugsTM.

36
Table 2 Sample size in terms of transactions, patients, and scripts
Multiple Sclerosis Year Rows Patients Scripts 2012 181,816 188,986 292,761 2013 207,389 219,961 343,480 2014 106,735 113,144 170,227 Total 495,940 522,091 806,468
Rheumatoid Arthritis
Year Rows Patients Scripts 2012 315,416 333,447 464,529 2013 350,204 377,451 530,738 2014 176,422 188,138 254,822 Total 842,042 899,036 1,250,089
Notes: Sample consists of all transactions from across the U.S. for all patients, including non-insured individuals, from 2012Q1-2014Q2. Table 3 Data cross-section by type of insurance coverage
Coverage Type Freq. Percent Cum. Insured 878,615 65.67 65.67
Insured and used coupon 449,283 33.58 99.25 Uninsured 2,676 0.2 99.45
Insured and used subsidy from charity 7,408 0.55 100 Total 1,337,982 100
Notes: Sample consists of all transactions from across the U.S. for all patients, including non-insured individuals, from 2012Q1-2014Q2.

37
Table 4 Descriptive Statistics
Variable Obs Mean Std. Dev. Min Max 1. Tradename 1337982 string variable
2. Brand dummy 1337982 0.998 0.05 0 1 3. Multiple Sclerosis dummy 1337982 0.37 0.48 0 1
4. Zipcode 1337958 5. Refill 1337982 0.61 0.49 0 1
6. MD_specialty 1337982 categorical variable 7.total_patient 1337982 1.06 0.31 0 17 8. total_script 1337982 1.54 0.93 1 41
9. total_spend ($) 1337982 6,314.66 4,473.51 0 142,815 10. total_insur ($) 1156166 5,918.89 4,425.31 0 135,674 11. total_copay ($) 1337982 138.05 412.92 0 75,133
12. total_coupon_amt ($) 314124 54.76 339.04 0 20,076 13. total_fdt_subsidy ($) 1337982 3.49 74.44 0 18,756 14. total_spend per script 1337979 4425.00 3229.12 0 142,815 15. total_insur per script 1156166 4141.64 3141.91 0 135,674 16. total_copay per script 1337979 108.91 340.53 0 75,133
17. total_coupon_amt per script 314124 42.64 269.57 0 13,252 18. total_fdt_subsidy per script 1337979 2.94 61.92 0 4,866
Notes: Table 4 only shows variables that were provided in the original dataset. Sample consists of all transactions from across the U.S. for all patients, including non-insured individuals, from 2012Q1-2014Q2.
38
Table 5 Possible values that the Copay_Band variable can take and their corresponding value
Value of Copay Band variable
Corresponding copay rang
1 $0 - $25 2 $26 - $50 3 $51 - $100 4 $101 - $250 5 $251 - $500 6 $501 - $1000 7 $1000 AND UP
Note: While Copay_Band is a discrete random variable, the data set also contains a non-truncated version that specifies the exact copayment for each transaction.
39
Figure 2.1 Average prices of Multiple Sclerosis drugs
Figure 2.2 Average prices of Rheumatoid Arthritis drugs
5,977.63 5,586.08 5,443.18 5,255.94 5,210.66
4,963.49 4,785.04 4,301.84
4,045.61
1,693.08
-‐
1,000
2,000
3,000
4,000
5,000
6,000
7,000
Average price ($)
Brand Name
Average price for one-‐month supply of Multiple Sclerosis drugs
Average price:
$4,726.25
9,709.01
6,994.06
3,179.22 2,996.65 2,866.33 2,829.26 2,610.08 2,562.45 2,483.55 2,016.00
579.94
-‐
2,000
4,000
6,000
8,000
10,000
12,000
Average price ($)
Average price for one-‐month supply of Rheumatoid Arthritis drugs
Average price:
$3,529.69
40
Figure 3.1 Rate of coupon use in MA for Multiple Sclerosis by drug price
Figure 3.2 Rate of coupon use in MA for Rheumatoid Arthritis by drug price
Notes: Drug brands whose average price was above the mean price for all trade names is considered expensive and those with below average price are classified as cheap.
0%
5%
10%
15%
20%
25%
2012Q1 2012Q2 2012Q3 2012Q4 2013Q1 2013Q2 2013Q3 2013Q4 2014Q1 2014Q2
% of transactions with coupon
Average coupon use by drug price in MA for drugs that treat RA
Lift Coupon Ban in MA
Cheap
Expensive
0%
5%
10%
15%
20%
2012Q1 2012Q2 2012Q3 2012Q4 2013Q1 2013Q2 2013Q3 2013Q4 2014Q1 2014Q2
% of transactions with coupon
Average coupon use by drug price in MA for drugs that treat MS
Lift Coupon Ban in MA
Cheap
Expensive

Table 6.1: Distribution across copay bands for transactions involving Multiple Sclerosis (MS) drugs
COPAY BAND 2012Q1 - 2014Q2
Percent of total cost $0 - $25 $26 - $50 $51 - $100 $101 - $250 $251 - $500 $501 - $1000 $1001 AND UP AMPYRA 42% 19% 26% 9% 3% 1% 1% AUBAGIO 44% 17% 22% 10% 2% 2% 3% AVONEX 40% 23% 25% 9% 1% 1% 1% BETASERON 60% 12% 20% 6% 1% 0% 1% COPAXONE 36% 24% 24% 11% 2% 1% 2% EXTAVIA 72% 10% 11% 6% 0% 1% 1% GILENYA 88% 4% 5% 2% 0% 0% 0% MITOXANTRONE 100% 0% 0% 0% 0% 0% 0% REBIF 47% 21% 20% 9% 1% 0% 1% TECFIDERA 38% 21% 24% 11% 2% 1% 2% TYSABRI 66% 15% 14% 3% 1% 1% 1% Grand Total 48% 19% 21% 8% 1% 1% 1%
Table 6.2: Distribution across copay bands for transactions involving Rheumatoid Arthritis (RA) drugs.
COPAY BAND 2012Q1 - 2014Q2
Percent of total cost $0 - $25 $26 - $50 $51 - $100 $101 - $250 $251 - $500 $501 - $1000 $1001 AND UP ACTEMRA 57% 18% 17% 6% 2% 0% 1% CIMZIA 21% 21% 35% 15% 5% 2% 2% CIMZIA STARTER KIT 22% 27% 36% 8% 1% 2% 3% CYCLOPHOSPHAMIDE 9% 0% 0% 91% 0% 0% 0% CYCLOSPORINE 100% 0% 0% 0% 0% 0% 0% ENBREL 32% 24% 27% 11% 3% 2% 2% HUMIRA 33% 24% 27% 11% 3% 1% 1% KINERET 35% 19% 24% 13% 6% 2% 1% METHOTREXATE 99% 1% 0% 0% 0% 0% 0% METHOTREXATE SODIUM 99% 1% 0% 0% 0% 0% 0% ORENCIA 29% 20% 32% 12% 4% 2% 2% OTREXUP 26% 50% 20% 4% 1% 0% 0% SIMPONI 23% 21% 33% 14% 4% 2% 2% SIMPONI ARIA 39% 23% 23% 12% 2% 1% 0% XELJANZ 22% 22% 36% 14% 3% 2% 2% Grand Total 32% 23% 28% 11% 3% 1% 2% 41

Tables 7.1: % total dollars spent on coupons by pharmaceutical companies across copay band for MS and RA, 2012Q1 - 2014Q2
Table 7.2 Percent of coupon amount $0 - $0- $25 $26 - $50 $51 - $100
$101 - $250
$251 - $500
$501 - $1000
$1001 AND UP
Dollars spent by firms on coupons ($)
ACTEMRA 2% 8% 9% 18% 24% 7% 31% 61,027 CIMZIA 1% 8% 19% 20% 13% 14% 25% 1,638,926 CIMZIA KIT 0% 4% 12% 7% 4% 11% 62% 74,888 ENBREL 1% 6% 12% 16% 13% 15% 37% 35,450,527 HUMIRA 2% 9% 17% 20% 15% 11% 26% 48,353,121 KINERET 0% 0% 100% 0% 0% 0% 0% 60 METHOTREXATE 94% 6% 0% 0% 0% 0% 0% 1,055 METHO SODIUM 100% 0% 0% 0% 0% 0% 0% 84 ORENCIA 0% 6% 16% 19% 15% 15% 29% 3,335,794 OTREXUP 0% 100% 0% 0% 0% 0% 0% 30 SIMPONI 0% 5% 12% 14% 10% 13% 46% 5,537,847 XELJANZ 0% 9% 18% 23% 14% 13% 23% 1,248,928 Grand Total 1% 8% 15% 18% 14% 13% 31% 95,702, 287
Percent of coupon amount $0 - $25 $26 - $50 $51 - $100
$101 - $250
$251 - $500
$501 - $1000
$1001 AND UP
Dollars spent by firms on coupons ($)
AMPYRA 0% 1% 14% 18% 23% 21% 22% 1,644,498 AUBAGIO 0% 6% 13% 12% 6% 16% 47% 1,191,547 AVONEX 0% 4% 6% 15% 9% 15% 51% 337,086 BETASERON 1% 6% 8% 10% 4% 28% 44% 295,076 COPAXONE 1% 7% 10% 12% 6% 11% 54% 13,366,080 EXTAVIA 6% 47% 0% 47% 0% 0% 0% 425 GILENYA 1% 10% 19% 16% 3% 8% 43% 355,652 MITOXANTRONE 0% 0% 0% 0% 0% 0% 0% 767,684 REBIF 0% 0% 0% 11% 2% 6% 75% 3,717,462 TECFIDERA 1% 5% 11% 13% 6% 10% 54% 53,261 Grand Total 1% 6% 10% 12% 7% 12% 52% 21,728,771
42
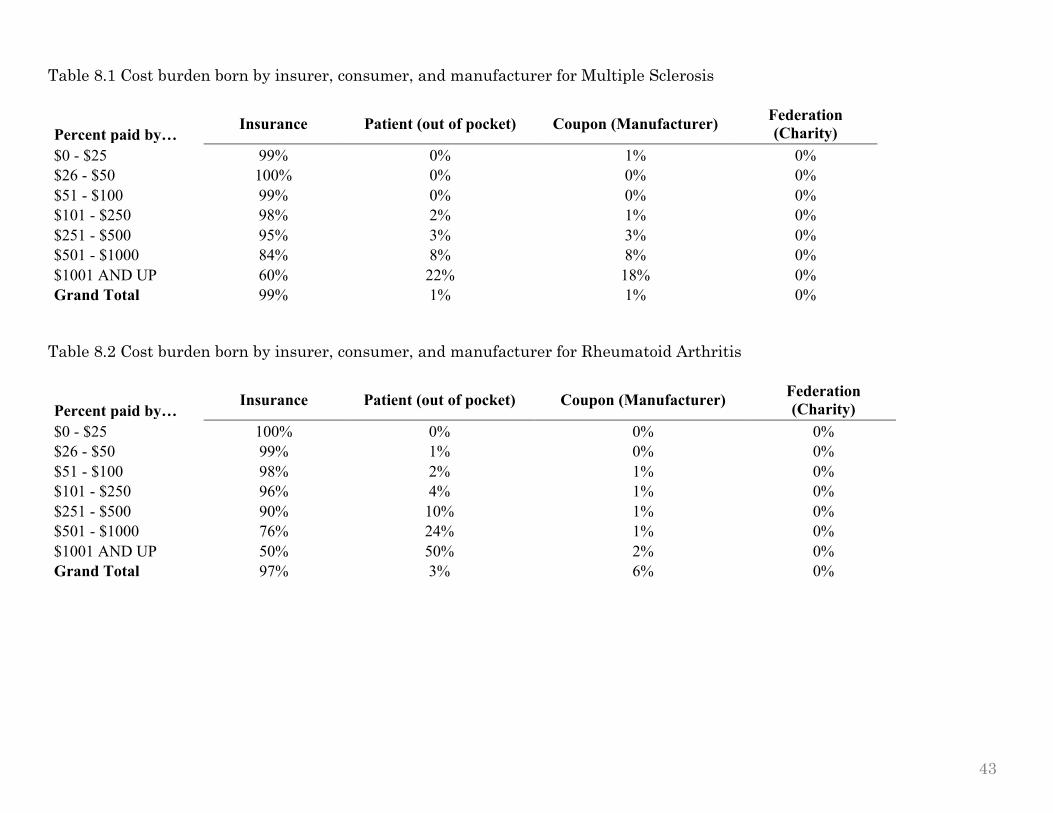
Table 8.1 Cost burden born by insurer, consumer, and manufacturer for Multiple Sclerosis
Percent paid by… Insurance Patient (out of pocket) Coupon (Manufacturer) Federation
(Charity) $0 - $25 99% 0% 1% 0% $26 - $50 100% 0% 0% 0% $51 - $100 99% 0% 0% 0% $101 - $250 98% 2% 1% 0% $251 - $500 95% 3% 3% 0% $501 - $1000 84% 8% 8% 0% $1001 AND UP 60% 22% 18% 0% Grand Total 99% 1% 1% 0%
Table 8.2 Cost burden born by insurer, consumer, and manufacturer for Rheumatoid Arthritis
Percent paid by… Insurance Patient (out of pocket) Coupon (Manufacturer) Federation
(Charity) $0 - $25 100% 0% 0% 0% $26 - $50 99% 1% 0% 0% $51 - $100 98% 2% 1% 0% $101 - $250 96% 4% 1% 0% $251 - $500 90% 10% 1% 0% $501 - $1000 76% 24% 1% 0% $1001 AND UP 50% 50% 2% 0% Grand Total 97% 3% 6% 0%
43

Table 9.1 Multiple Sclerosis drugs brands: coupon use, sales, and relative market size ranking
2013 annual national figures
Brand name Percent of
transactions with coupon
Sales ($B)
Market share
ranking COPAXONE 37.5 4.3 1
AVONEX 0.9 3 2 GILENYA 3.4 1.9 3 TYSABRI 0.9 1.7 4
BETASERON 2.7 1.1 5 TECFIDERA 34.6 0.88 6
REBIF 2.2 0.62 7 AMPYRA 18.6 0.3 8 AUBAGIO 35.1 0.23 9 EXTAVIA 0.5 0.12 10
Notes: Sales and market share figures come from Genetic Engineering & Biotechnology News. Table 9.2 Rheumatoid Arthritis drugs brands: coupon use, sales, and relative market size ranking
2013 annual national figures
Brand name
Percent of transactions with coupon
Sales ($B) Market share
ranking HUMIRA 51.4 5 1 ENBREL 40.7 4.6 2
ORENCIA 33.1 0.9 3 CIMZIA 51.9 0.49 4
SIMPONI 40.4 0.38 5 KINERET 0.0 0.35 6
Notes: Sales and market share figures come from FiercePharma industry report.
44
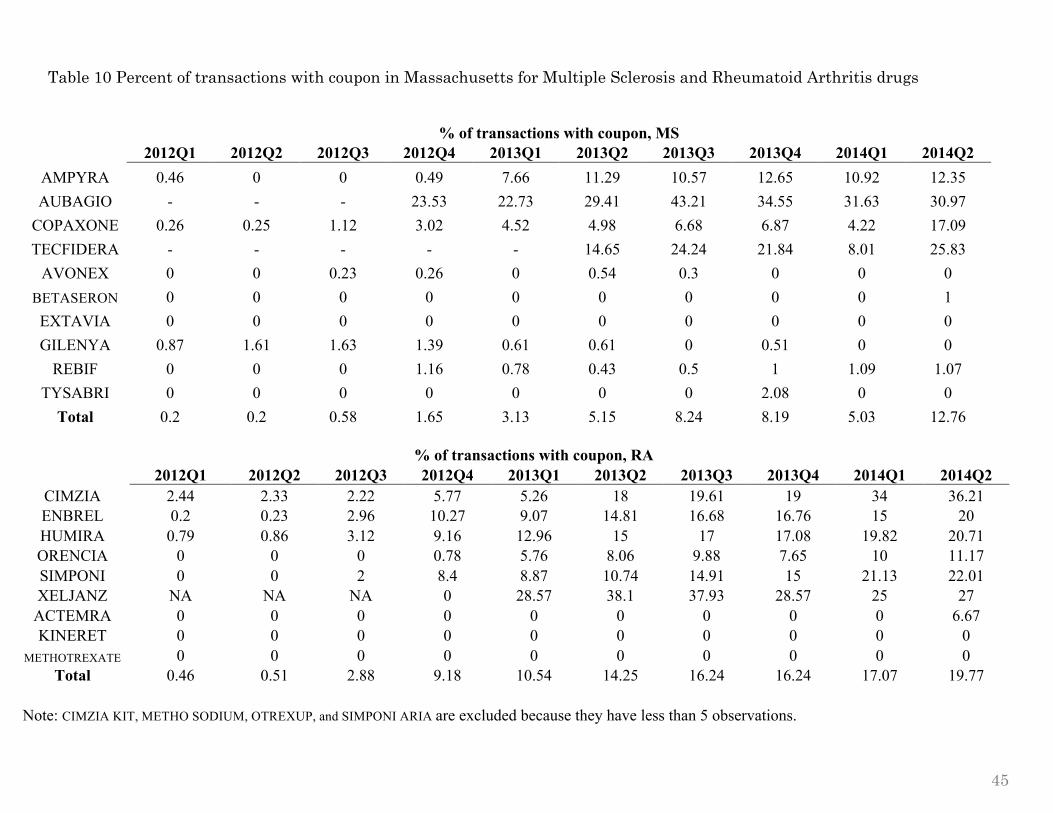
Table 10 Percent of transactions with coupon in Massachusetts for Multiple Sclerosis and Rheumatoid Arthritis drugs
% of transactions with coupon, MS
2012Q1 2012Q2 2012Q3 2012Q4 2013Q1 2013Q2 2013Q3 2013Q4 2014Q1 2014Q2
AMPYRA 0.46 0 0 0.49 7.66 11.29 10.57 12.65 10.92 12.35 AUBAGIO - - - 23.53 22.73 29.41 43.21 34.55 31.63 30.97
COPAXONE 0.26 0.25 1.12 3.02 4.52 4.98 6.68 6.87 4.22 17.09 TECFIDERA - - - - - 14.65 24.24 21.84 8.01 25.83
AVONEX 0 0 0.23 0.26 0 0.54 0.3 0 0 0 BETASERON 0 0 0 0 0 0 0 0 0 1 EXTAVIA 0 0 0 0 0 0 0 0 0 0 GILENYA 0.87 1.61 1.63 1.39 0.61 0.61 0 0.51 0 0
REBIF 0 0 0 1.16 0.78 0.43 0.5 1 1.09 1.07 TYSABRI 0 0 0 0 0 0 0 2.08 0 0
Total 0.2 0.2 0.58 1.65 3.13 5.15 8.24 8.19 5.03 12.76
% of transactions with coupon, RA
2012Q1 2012Q2 2012Q3 2012Q4 2013Q1 2013Q2 2013Q3 2013Q4 2014Q1 2014Q2 CIMZIA 2.44 2.33 2.22 5.77 5.26 18 19.61 19 34 36.21 ENBREL 0.2 0.23 2.96 10.27 9.07 14.81 16.68 16.76 15 20 HUMIRA 0.79 0.86 3.12 9.16 12.96 15 17 17.08 19.82 20.71 ORENCIA 0 0 0 0.78 5.76 8.06 9.88 7.65 10 11.17 SIMPONI 0 0 2 8.4 8.87 10.74 14.91 15 21.13 22.01 XELJANZ NA NA NA 0 28.57 38.1 37.93 28.57 25 27
ACTEMRA 0 0 0 0 0 0 0 0 0 6.67 KINERET 0 0 0 0 0 0 0 0 0 0
METHOTREXATE 0 0 0 0 0 0 0 0 0 0 Total 0.46 0.51 2.88 9.18 10.54 14.25 16.24 16.24 17.07 19.77
Note: CIMZIA KIT, METHO SODIUM, OTREXUP, and SIMPONI ARIA are excluded because they have less than 5 observations.
45

46
Figure 4.1 Rate of coupon use by treatment for Multiple Sclerosis drugs in MA
Chart 4.2 Comparing total scripts for treatment and control group, MS
Lift Coupon Ban in MA
0%
5%
10%
15%
20%
25%
2012Q1 2012Q2 2012Q3 2012Q4 2013Q1 2013Q2 2013Q3 2013Q4 2014Q1 2014Q2
% of transactions with coupon
Portion of transactions with coupon, MS
Drugs that introduced coupons Drugs that didn't offer coupons
Lift Coupon Ban in MA
0
500
1000
1500
2000
2500
3000
2012Q1 2012Q2 2012Q3 2012Q4 2013Q1 2013Q2 2013Q3 2013Q4 2014Q1 2014Q2
Total Num
ber of scripts
Average number of scripts per quarter
Drugs that introduced coupons Drugs that didn't offer coupons
Lift Coupon Ban in MA
Note: y-axis measures the average number of scripts for each brand per quarter.

47
Chart 4.3 Comparing total patients for treatment and control group, MS
0
500
1000
1500
2000
2012Q1 2012Q2 2012Q3 2012Q4 2013Q1 2013Q2 2013Q3 2013Q4 2014Q1 2014Q2
Total num
ber of patients
Average number of patients per quarter
Drugs that introduced coupons Drugs that didn't offer coupons
Lift Coupon Ban in MA
Note: y-axis measures the average number of patients for each brand per quarter.

48
Table 11 Diff-in-diff regression results for coupon effect on total scripts and patients per quarter
Total scripts
per quarter
Total patients
per quarter
Interaction term 1339.6** 866.3**
(587.8) (389.3)
Post ban lift 93.8 16.9
(415.6) (275.3)
Offered coupon after ban lift 6584*** 4329***
(525.7) (348.2)
_cons 1881.5 1112.0
(371.8) (246.2)
Fixed Effects Yes Yes R-sq 0.003 0.009 F 67 200 N 63445 63445
Standard errors in parentheses * p<0.05, ** p<0.01, *** p<0.001
Note: Dependent variables are total number of scripts and patients for each drug per quarter. Sample consists of all transactions that took place in Massachusetts for insured individuals from 2012Q1-2014Q2. Specifications include controls for the specialty of the prescribing physician. The regressions also include drug brand fixed effects to pick up characteristics of brands that are constant over the period and year fixed effects to allow for brand-wide changes. The dummy post ban lift equals one if the transaction took place after 2012Q3 and the dummy offered coupon after ban lift equals one if the brand name offered coupons after the ban was lifted. The interaction term equals one if the transaction took place after the ban lift and included a brand name that offered coupons; it is the variable of interest.
49
Table 12 Multinomial logistic regression on the determinants of copay amount
Copay Band CopayBand $0-$25 (base outcome)
$26-$50 coupon 1.3** $251-$500 coupon 3.3***
(0.4)
(0.6)
MS -0.2***
MS -0.3
(0.04)
(0.2)
refill -0.1*
refill 0.08
(0.04)
(0.2)
_cons 1.6***
_cons -4.09***
(0.04) (0.2) $51-$100 coupon 1.6*** $501-$1000 coupon 1.7
(0.5)
(1.1)
MS -0.08
MS -0.8***
(0.06)
(0.2)
refill -0.6***
refill -0.1
(0.06)
(0.2)
_cons -1.09***
_cons -3.6***
(0.05) (0.2) $101-$250 coupon 2.7*** $1000+ UP coupon -9.5
(0.5)
(436.7)
MS 0.4***
MS 1.2***
(0.1)
(0.3)
refill -0.5***
refill -0.2
(0.1)
(0.3)
_cons -2.7***
_cons -5.0***
(0.09) (0.2)
Pseudo R-sq 0.0082 N 12238
Fixed Effects Yes Standard errors in parentheses
* p<0.05, ** p<0.01, *** p<0.001
Note: Copay Band is a discrete dependent variable that takes on 7 possible values of increasing copay bands (see Table 5). Sample consists of all transactions that took place in Massachusetts for insured individuals after the ban lift. Specifications include controls for the drug’s indication (MS is a dummy that equals 1 if it is for Multiple Sclerosis and 0 if it is for Rheumatoid Arthritis) and a dummy that equals 1 if the transaction was refill and 0 if new. Coupon dummy equals 1 if transaction has coupon amount that is great than zero and 0 otherwise; it is the variable of interest.

50
Figure 5 Allocation of cost burden across insurer and patient for Rheumatoid Arthritis drug Orencia
Note: Sample consists of all transactions that took place in Massachusetts for insured individuals after the ban lift. Coupon group includes transactions with a coupon amount greater than zero. All transactions are for the same drug Orencia.
0
100
200
300
400
2012Q1 2012Q2 2012Q3 2012Q4 2013Q1 2013Q2 2013Q3 2013Q4 2014Q1 2014Q2
Average coupon amount ($)
Coupon No coupon
75% 80% 85% 90% 95% 100% 105%
Insurer share of cost (%)
Coupon No coupon
0%
5%
10%
15%
20%
2012Q1 2012Q2 2012Q3 2012Q4 2013Q1 2013Q2 2013Q3 2013Q4 2014Q1
Patient share of cost (%)
Coupon No coupon
0
500
1000
1500
2000
2500
3000
2012Q1 2012Q2 2012Q3 2012Q4 2013Q1 2013Q2 2013Q3 2013Q4 2014Q1 2014Q2
Average price per script ($)
Coupon No coupon
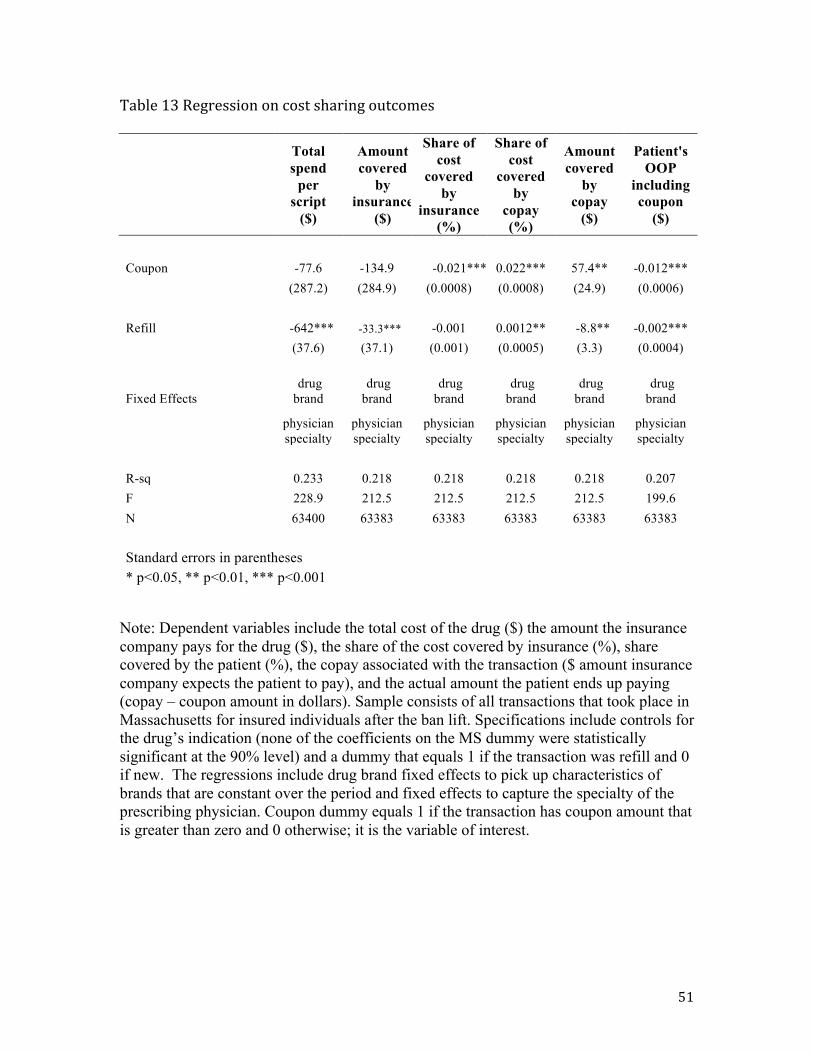
51
Table 13 Regression on cost sharing outcomes
Total spend
per script
($)
Amount covered
by insurance
($)
Share of cost
covered by
insurance (%)
Share of cost
covered by
copay (%)
Amount covered
by copay
($)
Patient's OOP
including coupon
($)
Coupon -77.6 -134.9 -0.021*** 0.022*** 57.4** -0.012***
(287.2) (284.9) (0.0008) (0.0008) (24.9) (0.0006)
Refill -642*** -33.3*** -0.001 0.0012** -8.8** -0.002***
(37.6) (37.1) (0.001) (0.0005) (3.3) (0.0004)
Fixed Effects
drug brand
drug brand
drug brand
drug brand
drug brand
drug brand
physician specialty
physician specialty
physician specialty
physician specialty
physician specialty
physician specialty
R-sq 0.233 0.218 0.218 0.218 0.218 0.207 F 228.9 212.5 212.5 212.5 212.5 199.6 N 63400 63383 63383 63383 63383 63383
Standard errors in parentheses * p<0.05, ** p<0.01, *** p<0.001
Note: Dependent variables include the total cost of the drug ($) the amount the insurance company pays for the drug ($), the share of the cost covered by insurance (%), share covered by the patient (%), the copay associated with the transaction ($ amount insurance company expects the patient to pay), and the actual amount the patient ends up paying (copay – coupon amount in dollars). Sample consists of all transactions that took place in Massachusetts for insured individuals after the ban lift. Specifications include controls for the drug’s indication (none of the coefficients on the MS dummy were statistically significant at the 90% level) and a dummy that equals 1 if the transaction was refill and 0 if new. The regressions include drug brand fixed effects to pick up characteristics of brands that are constant over the period and fixed effects to capture the specialty of the prescribing physician. Coupon dummy equals 1 if the transaction has coupon amount that is greater than zero and 0 otherwise; it is the variable of interest.

52
Table 14 Effect of coupon on copay’s share of total cost by subgroup
Subgroup Coefficient of
copay share on coupon dummy
MS drugs with above average price 0.01432*** MS drugs with below average price 0.03156*** RA drugs with above average price 0.02171*** RA drugs with below average price 0.02320*** Standard errors in parentheses * p<0.05, ** p<0.01, *** p<0.001
Note: The coefficients in this table are obtained by running the regression specified in table 13 when the dependent variable is the share of cost covered by copay. The regression splits the sample to those drugs with prices above or below the average. The reported coefficients are those attached to the coupon dummy. As a point of comparison, the coefficient reported in table 13 was 0.022***.
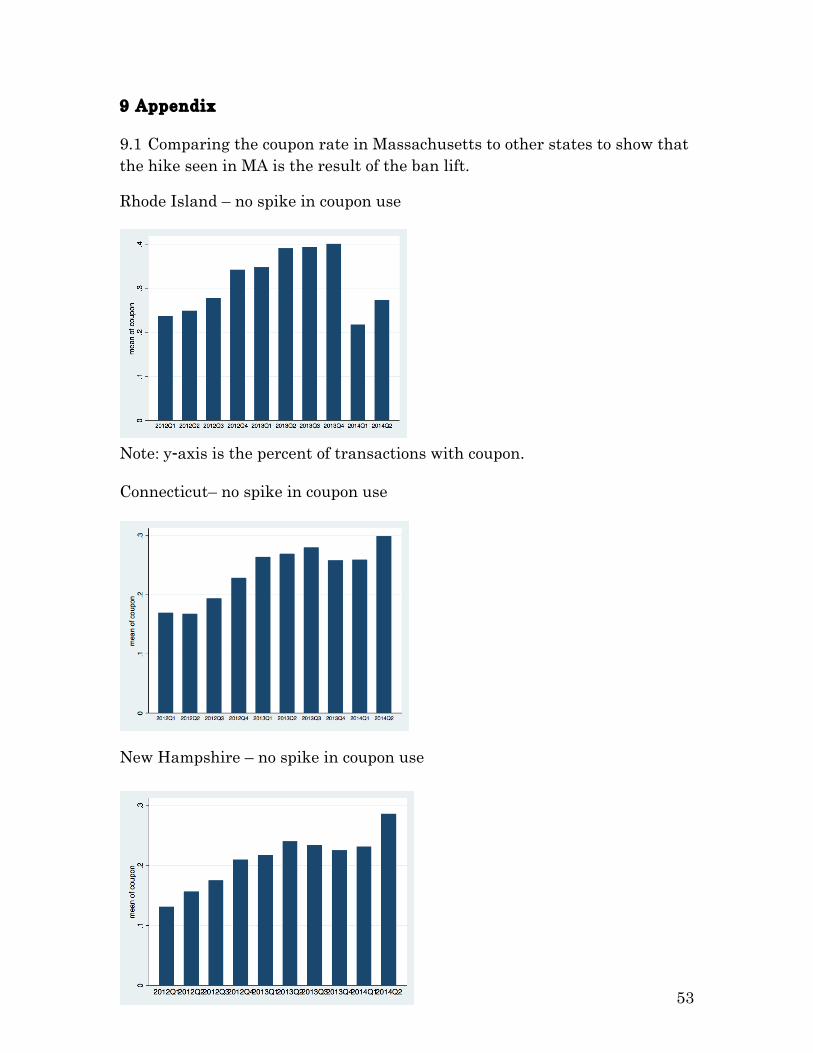
53
9 Appendix 9.1 Comparing the coupon rate in Massachusetts to other states to show that the hike seen in MA is the result of the ban lift.
Rhode Island – no spike in coupon use
Note: y-axis is the percent of transactions with coupon. Connecticut– no spike in coupon use
New Hampshire – no spike in coupon use

54
9.2 Breakdown of total drug cost by coverage
Variables to quantify the cost burden on each player (in %):
Insur_share = insurance coverage / total cost of drug Copay_share = copay / total cost of drug Coupon_share = coupon / total cost of drug
Insurance
Copay Patient out-‐of-‐pocket
Coupon
Total Drug Cost