PGCPS Comprehensive School Boundary Initiative
17
PGCPS Comprehensive School Boundary Initiative Draft Scenarios Report Summary Spring 2021
Transcript of PGCPS Comprehensive School Boundary Initiative

PGCPS Comprehensive Boundary Initiative 1Draft Scenarios Report Summary
PGCPS Comprehensive School Boundary Initiative
Draft Scenarios Report SummarySpring 2021
PGCPS Comprehensive Boundary Initiative 2Draft Scenarios Report Summary
Authors & Acknowledgments
This report was developed by WXY architecture + urban design, in collaboration with Public Engagement Associates. The report was produced in partnership with Prince George’s County Public Schools.
Special Thanks
The PGCPS project team, including Rhianna McCarter, John Wooden, and David Dove
Former Chief of Staff Christian Rhodes
Former Chief Operating Officer Barry Stanton
Dr. Jennifer Love and the language access team from the Office of Interpreting and Translation
Maryland-National Capital Parks and Planning Commission (M-NCPPC)
The 75 trained facilitators who led virtual breakout rooms at the Community Conversations
The 1,157 community members who participated in the Virtual Community Conversations in January, 2021
Boundary Advisory Committee (BAC)
An internal working group comprised of PGCPS leadership
Howard Burnett, Senior Advisor to the CEO
Dr. Judith J. White, Chief Academic Officer
Dr. Helen Coley, Chief of School Support and Leadership
Mark E. Fossett, Chief Operating Officer
Michael Herbstman, Chief Financial Officer
Dr. Andrew Zuckerman, Chief Information and Technology Officer
Raven Hill, Associate Superintendent for Communications and Community Engagement
Trinell M. Bowman, Associate Superintendent for Special Education
Shawn Matlock, Director of Capital Programs
Rudolph R. Saunders, Jr., Director of Transportation
Sam Stefanelli, Director of Building Services
PGCPS Boundary Initiative PGCPS Comprehensive Boundary Initiative 3Draft Scenarios Report Summary
Contents
Initiative OverviewReport Executive Summary
Draft Scenarios SummaryDraft Scenarios OverviewDraft Scenarios Results MatrixSummary Table
What is in the Full Report?
46
13131415
16
PGCPS Comprehensive Boundary Initiative Draft Scenarios Report Summary 4
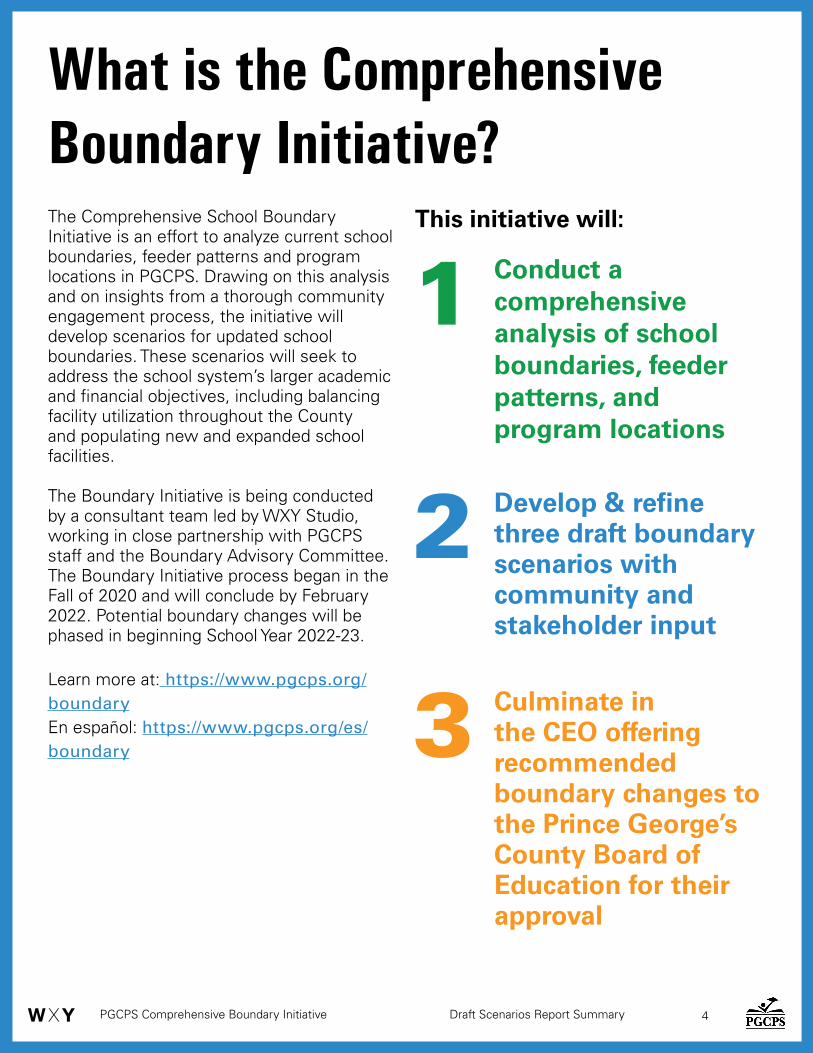
The Comprehensive School Boundary Initiative is an effort to analyze current school boundaries, feeder patterns and program locations in PGCPS. Drawing on this analysis and on insights from a thorough community engagement process, the initiative will develop scenarios for updated school boundaries. These scenarios will seek to address the school system’s larger academic and financial objectives, including balancing facility utilization throughout the County and populating new and expanded school facilities.
The Boundary Initiative is being conducted by a consultant team led by WXY Studio, working in close partnership with PGCPS staff and the Boundary Advisory Committee. The Boundary Initiative process began in the Fall of 2020 and will conclude by February 2022. Potential boundary changes will be phased in beginning School Year 2022-23.
Learn more at: https://www.pgcps.org/boundaryEn español: https://www.pgcps.org/es/boundary
What is the Comprehensive Boundary Initiative?
1 Conduct a comprehensive analysis of school boundaries, feeder patterns, and program locations
2
3
Develop & refine three draft boundary scenarios with community and stakeholder input
Culminate in the CEO offering recommended boundary changes to the Prince George’s County Board of Education for their approval
This initiative will:

PGCPS Comprehensive Boundary Initiative Draft Scenarios Report Summary 5
Draft Scenario DevelopmentJanuary-April 2021
Introduced the Comprehensive Boundary Initiative and shared data related to district challenges.
Five virtual meetings were held to inform the public and to better understand the community’s priorities related to school boundaries.
This phase of engagement will focus on gathering public input to the three draft scenarios presented in this report.
Based on community feedback, we will refine the draft scenarios, and narrow down to one approach for the final scenario.
Pre-Scenario Engagement
January 2021
Post-Scenario EngagementApril-October 2021
Three draft scenarios developed for new school boundaries in PGCPS.
These scenarios are presented in this report and will be further developed with community input during Post-Scenario Engagement.
Final Scenario Development
October 2021-February 2022
During this phase we will develop a final boundary scenario, incorporating community input gathered during Post-Scenario Engagement and continued analysis.
This phase will culminate in the Boundary Approval Process, where the proposed boundaries will be presented to the CEO, who will present them to the Board of Education.
Project Timeline
PGCPS Comprehensive Boundary Initiative Draft Scenarios Report Summary 6
Executive Summary
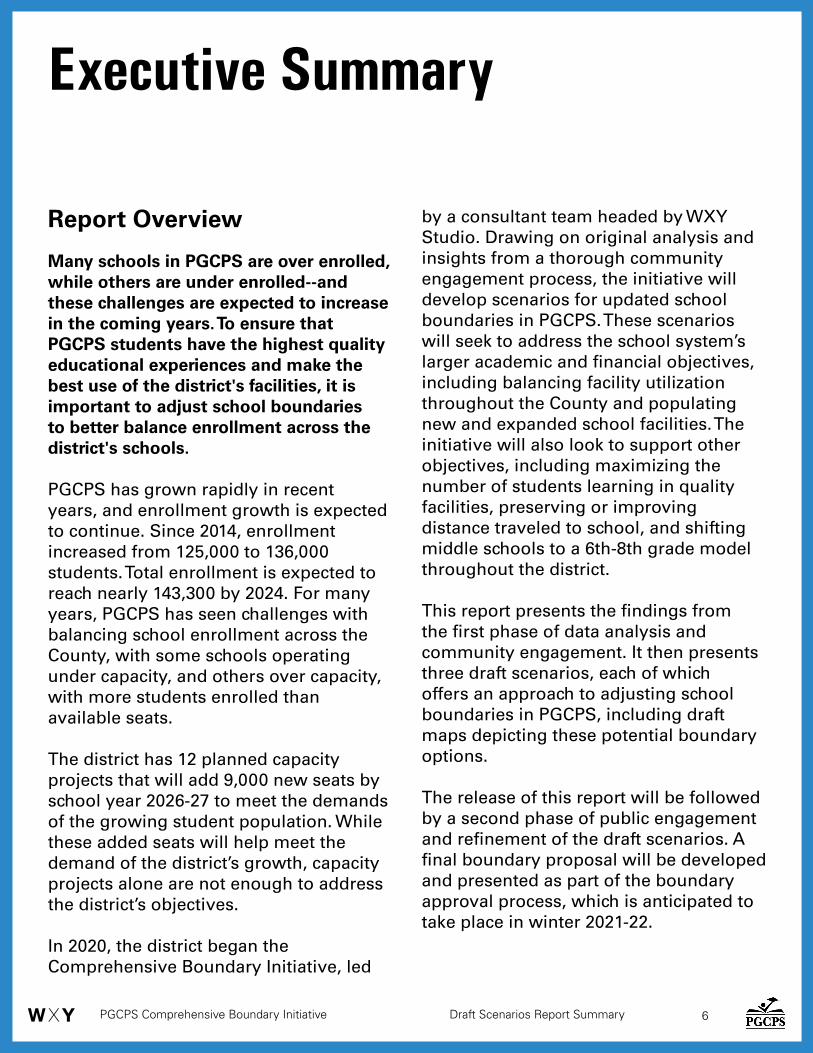
Report Overview
Many schools in PGCPS are over enrolled, Many schools in PGCPS are over enrolled, while others are under enrolled--and while others are under enrolled--and these challenges are expected to increase these challenges are expected to increase in the coming years. To ensure that in the coming years. To ensure that PGCPS students have the highest quality PGCPS students have the highest quality educational experiences and make the educational experiences and make the best use of the district's facilities, it is best use of the district's facilities, it is important to adjust school boundaries important to adjust school boundaries to better balance enrollment across the to better balance enrollment across the district's schools.district's schools.
PGCPS has grown rapidly in recent PGCPS has grown rapidly in recent years, and enrollment growth is expected years, and enrollment growth is expected to continue. Since 2014, enrollment to continue. Since 2014, enrollment increased from 125,000 to 136,000 increased from 125,000 to 136,000 students. Total enrollment is expected to students. Total enrollment is expected to reach nearly 143,300 by 2024. For many reach nearly 143,300 by 2024. For many years, PGCPS has seen challenges with years, PGCPS has seen challenges with balancing school enrollment across the balancing school enrollment across the County, with some schools operating County, with some schools operating under capacity, and others over capacity, under capacity, and others over capacity, with more students enrolled than with more students enrolled than available seats. available seats.
The district has 12 planned capacity The district has 12 planned capacity projects that will add 9,000 new seats by projects that will add 9,000 new seats by school year 2026-27 to meet the demands school year 2026-27 to meet the demands of the growing student population. While of the growing student population. While these added seats will help meet the these added seats will help meet the demand of the district’s growth, capacity demand of the district’s growth, capacity projects alone are not enough to address projects alone are not enough to address the district’s objectives. the district’s objectives.
In 2020, the district began the In 2020, the district began the Comprehensive Boundary Initiative, led Comprehensive Boundary Initiative, led
by a consultant team headed by WXY by a consultant team headed by WXY Studio. Drawing on original analysis and Studio. Drawing on original analysis and insights from a thorough community insights from a thorough community engagement process, the initiative will engagement process, the initiative will develop scenarios for updated school develop scenarios for updated school boundaries in PGCPS. These scenarios boundaries in PGCPS. These scenarios will seek to address the school system’s will seek to address the school system’s larger academic and financial objectives, larger academic and financial objectives, including balancing facility utilization including balancing facility utilization throughout the County and populating throughout the County and populating new and expanded school facilities. The new and expanded school facilities. The initiative will also look to support other initiative will also look to support other objectives, including maximizing the objectives, including maximizing the number of students learning in quality number of students learning in quality facilities, preserving or improving facilities, preserving or improving distance traveled to school, and shifting distance traveled to school, and shifting middle schools to a 6th-8th grade model middle schools to a 6th-8th grade model throughout the district. throughout the district.
This report presents the findings from This report presents the findings from the first phase of data analysis and the first phase of data analysis and community engagement. It then presents community engagement. It then presents three draft scenarios, each of which three draft scenarios, each of which offers an approach to adjusting school offers an approach to adjusting school boundaries in PGCPS, including draft boundaries in PGCPS, including draft maps depicting these potential boundary maps depicting these potential boundary options.options.
The release of this report will be followed The release of this report will be followed by a second phase of public engagement by a second phase of public engagement and refinement of the draft scenarios. A and refinement of the draft scenarios. A final boundary proposal will be developed final boundary proposal will be developed and presented as part of the boundary and presented as part of the boundary approval process, which is anticipated to approval process, which is anticipated to take place in winter 2021-22. take place in winter 2021-22.

PGCPS Comprehensive Boundary Initiative Draft Scenarios Report Summary 7
Community Engagement Process
Community engagement is an integral Community engagement is an integral part of this initiative. The insights, part of this initiative. The insights, priorities, and perspectives of PGCPS priorities, and perspectives of PGCPS parents, students, staff, and other parents, students, staff, and other community members will inform community members will inform every aspect of the process. Phase 1 of every aspect of the process. Phase 1 of Community Engagement took place in Community Engagement took place in January 2021. The objectives were:January 2021. The objectives were:
• • Inform the public about the boundary Inform the public about the boundary initiative and how they can be involvedinitiative and how they can be involved
• • Provide context and introduce Provide context and introduce concepts that will allow the public to concepts that will allow the public to meaningfully engage moving forwardmeaningfully engage moving forward
• • Understand community members’ Understand community members’ priorities as they relate to school priorities as they relate to school boundariesboundaries
This phase of engagement included This phase of engagement included the launching of the project website, an the launching of the project website, an online comment form, targeted outreach online comment form, targeted outreach throughout the district, and a series of throughout the district, and a series of five virtual public meetings. five virtual public meetings.
A total of 1,157 participants took part in A total of 1,157 participants took part in the public meetings—including three the public meetings—including three regional meetings (North, Central, regional meetings (North, Central, and South County) and two area wide and South County) and two area wide meetings conducted in Spanish. meetings conducted in Spanish.
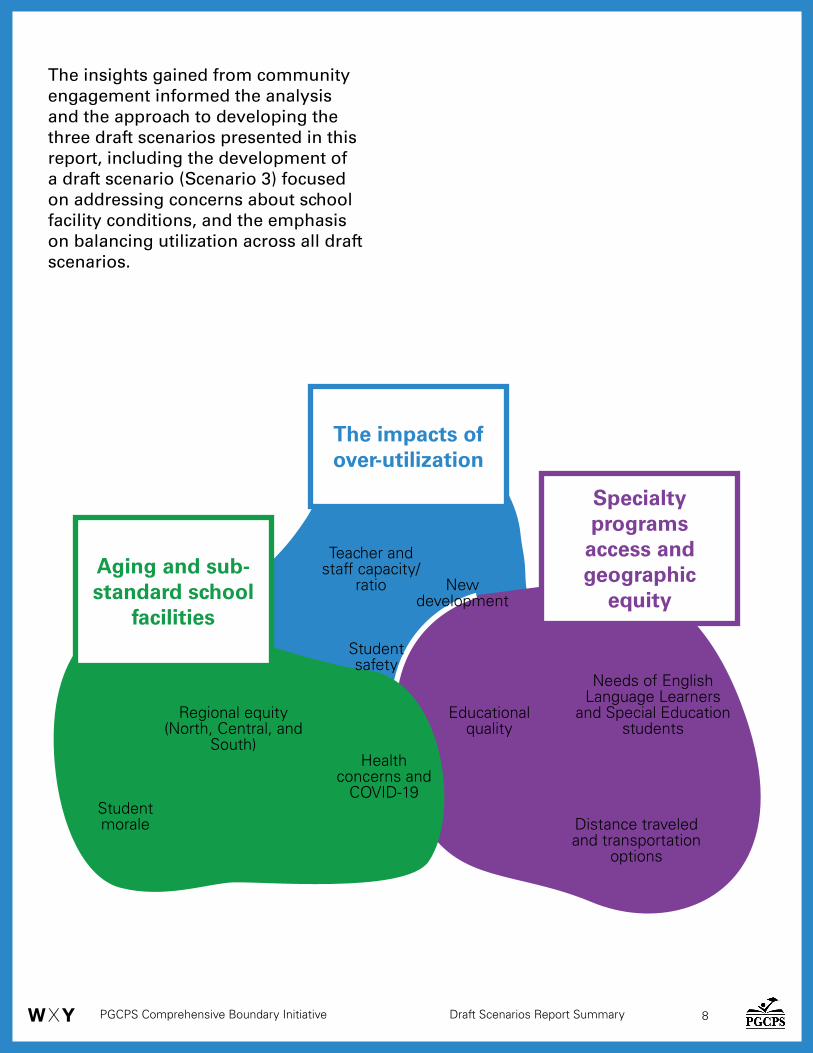
Meeting participants were asked to rate Meeting participants were asked to rate their priorities with regard to key factors their priorities with regard to key factors being considered in this initiative. Across being considered in this initiative. Across all meetings, the priority ranked first all meetings, the priority ranked first most often was Aging School Facilities. most often was Aging School Facilities. Addressing Over-utilization was the next Addressing Over-utilization was the next most highly ranked priority, followed by most highly ranked priority, followed by Specialty Programs. Specialty Programs.
Three key sets of themes emerged as Three key sets of themes emerged as strong priorities for participants during strong priorities for participants during facilitated breakout room conversations:facilitated breakout room conversations:
• • Theme 1: The impacts of over-Theme 1: The impacts of over-utilizationutilization: concerns about over-: concerns about over-utilization include diminished utilization include diminished academic quality in over-crowded academic quality in over-crowded classrooms and schools, concerns classrooms and schools, concerns about safety, and newfound concerns about safety, and newfound concerns related to health in light of COVID-19. related to health in light of COVID-19. Participant concerns also include the Participant concerns also include the use of trailers, and challenges for use of trailers, and challenges for teachers and staff to manage over-teachers and staff to manage over-utilized facilities.utilized facilities.
• • Theme 2: Aging and sub-standard Theme 2: Aging and sub-standard school facilitiesschool facilities: participants stressed : participants stressed the impact of aging school facilities the impact of aging school facilities on student morale and educational on student morale and educational experience, as well as health concerns experience, as well as health concerns in light of COVID-19. in light of COVID-19.
• • Theme 3: Specialty program access Theme 3: Specialty program access and geographic equityand geographic equity: many : many participants expressed concern participants expressed concern about the locations of specialty about the locations of specialty programs. Other participants programs. Other participants expressed frustration at the difficulty expressed frustration at the difficulty of applying to/gaining acceptance of applying to/gaining acceptance into these programs. There was also into these programs. There was also interest in expanding the capacity of interest in expanding the capacity of Special Education and ESOL (English Special Education and ESOL (English for Speakers of Other Languages) for Speakers of Other Languages) programs. programs.
Note: this boundary initiative will not be Note: this boundary initiative will not be changing boundaries for specialty programs changing boundaries for specialty programs or adding/removing specialty programs. or adding/removing specialty programs. However, draft boundary scenarios will However, draft boundary scenarios will measure the impacts on existing specialty measure the impacts on existing specialty programs.programs.
PGCPS Comprehensive Boundary Initiative Draft Scenarios Report Summary 8
The insights gained from community The insights gained from community engagement informed the analysis engagement informed the analysis and the approach to developing the and the approach to developing the three draft scenarios presented in this three draft scenarios presented in this report, including the development of report, including the development of a draft scenario (Scenario 3) focused a draft scenario (Scenario 3) focused on addressing concerns about school on addressing concerns about school facility conditions, and the emphasis facility conditions, and the emphasis on balancing utilization across all draft on balancing utilization across all draft scenarios. scenarios.
Student morale
Educational quality
Health concerns and
COVID-19
Aging and sub-Aging and sub-standard school standard school
facilitiesfacilities
Regional equity (North, Central, and
South)
Distance traveled and transportation
options
Student safety
New development
Specialty Specialty programs programs
access and access and geographic geographic
equityequity
The impacts of The impacts of over-utilizationover-utilization
Teacher and staff capacity/
ratio
Needs of English Language Learners
and Special Education students

PGCPS Comprehensive Boundary Initiative Draft Scenarios Report Summary 9
Draft Scenarios
This report presents three draft boundary This report presents three draft boundary scenarios, developed based on the school scenarios, developed based on the school system’s priorities, community priorities system’s priorities, community priorities and input from Phase 1 Community and input from Phase 1 Community Engagement, and original analysis Engagement, and original analysis conducted by the consultant team. All conducted by the consultant team. All three draft scenarios are designed to three draft scenarios are designed to address the key factors of utilization and address the key factors of utilization and capacity, distance to school, and facility capacity, distance to school, and facility condition, while measuring impacts condition, while measuring impacts to assignment stability and specialty to assignment stability and specialty programs and services. Each scenario programs and services. Each scenario also looks to further the district’s primary also looks to further the district’s primary and secondary priorities, outlined in the and secondary priorities, outlined in the Methodology section starting on Methodology section starting on page page 64 64 of the full report.of the full report.
The three draft scenarios are:The three draft scenarios are:
Draft Scenario 1: Address Utilization Draft Scenario 1: Address Utilization Extremes and Minimize RezoningsExtremes and Minimize Rezonings
This scenario places the greatest This scenario places the greatest importance among the three on importance among the three on minimizing the amount of change and minimizing the amount of change and disruption for student assignment. In disruption for student assignment. In order to stay under a lower assignment order to stay under a lower assignment stability threshold, this scenario focuses stability threshold, this scenario focuses on addressing utilization extremes in the on addressing utilization extremes in the district (i.e. highly over-utilized or under-district (i.e. highly over-utilized or under-utilized schools). In order to stay within utilized schools). In order to stay within the lower assignment stability threshold, the lower assignment stability threshold, this scenario includes temporary this scenario includes temporary classrooms as part of school capacity, as classrooms as part of school capacity, as opposed to trying to minimize temporary opposed to trying to minimize temporary capacity. capacity.
Draft Scenario 2: Improve Utilization as Draft Scenario 2: Improve Utilization as Widely as PossibleWidely as Possible
This scenario is the most ambitious in This scenario is the most ambitious in terms of optimizing utilization across terms of optimizing utilization across the district. Draft Scenario 2 has the the district. Draft Scenario 2 has the
highest threshold for assignment stability, highest threshold for assignment stability, meaning more students are rezoned in meaning more students are rezoned in order to achieve these objectives. This order to achieve these objectives. This scenario also seeks to reduce temporary scenario also seeks to reduce temporary classrooms as much as possible.classrooms as much as possible.
Draft Scenario 3: Maximize the Students Draft Scenario 3: Maximize the Students Attending School in Updated FacilitiesAttending School in Updated Facilities
During Phase 1 Community Engagement, During Phase 1 Community Engagement, improving school facility conditions was improving school facility conditions was ranked the highest priority most often ranked the highest priority most often by participants. This scenario seeks to by participants. This scenario seeks to respond to this community priority by respond to this community priority by maximizing the number of students maximizing the number of students assigned to newer and higher quality assigned to newer and higher quality facilities. While boundary changes can facilities. While boundary changes can be a limited tool to improve school be a limited tool to improve school facility conditions, this model uses two facility conditions, this model uses two strategies to optimize school facilities: strategies to optimize school facilities: first, it presents the greatest amount of first, it presents the greatest amount of school consolidations, with a focus on school consolidations, with a focus on closing schools in the worst condition closing schools in the worst condition and rezoning students to newer facilities and rezoning students to newer facilities nearby. Second, it reduces the number of nearby. Second, it reduces the number of temporary classrooms used around the temporary classrooms used around the district to improve the quality of students’ district to improve the quality of students’ learning environments, prioritizing only learning environments, prioritizing only preserving the temporary classrooms in preserving the temporary classrooms in the best condition.the best condition.

PGCPS Comprehensive Boundary Initiative Draft Scenarios Report Summary 10
Draft Scenario Outcomes
The draft scenarios show that strong The draft scenarios show that strong improvements can be made to utilization improvements can be made to utilization across PGCPS, while staying within across PGCPS, while staying within reasonable parameters for assignment reasonable parameters for assignment stability, and pursuing other district stability, and pursuing other district objectives. The three draft scenarios each objectives. The three draft scenarios each present distinct pros and cons in their present distinct pros and cons in their approach and their outcomes. Together, approach and their outcomes. Together, they present a range of possibilities for they present a range of possibilities for adjusting school boundaries in PGCPS. adjusting school boundaries in PGCPS.
Each draft scenario has a different upper Each draft scenario has a different upper limit for the percentage of students limit for the percentage of students rezoned, and this is reflected in the rezoned, and this is reflected in the outcomes for assignment stability.outcomes for assignment stability.
• • Draft Scenario 1 rezones 11% of students Draft Scenario 1 rezones 11% of students overall. Draft Scenario 3 rezones 12% overall. Draft Scenario 3 rezones 12% of students, and includes many more of students, and includes many more elementary school consolidations than elementary school consolidations than Scenario 1. Draft Scenario 2 rezones the Scenario 1. Draft Scenario 2 rezones the highest percentage of students, at 14%. highest percentage of students, at 14%.
• • Across all scenarios, the school level with Across all scenarios, the school level with the highest degree of rezoning is MS/K-8, the highest degree of rezoning is MS/K-8, due largely to grade realignment, which due largely to grade realignment, which moves all 6th graders to middle schools, moves all 6th graders to middle schools, as well as the three new middle schools as well as the three new middle schools opening in the district.opening in the district.
All three scenarios improve utilization All three scenarios improve utilization rates across the district. The different rates across the district. The different approaches and goals of each scenario approaches and goals of each scenario lead to different outcomes with regard to lead to different outcomes with regard to utilization.utilization.
• • Draft Scenario 2 attempts to make as Draft Scenario 2 attempts to make as many improvements as possible to many improvements as possible to utilization widely across the district, utilization widely across the district, resulting in the highest number of resulting in the highest number of schools overall within the optimal schools overall within the optimal utilization range of 80-95%, and the utilization range of 80-95%, and the
fewest number of highly over- or fewest number of highly over- or under-utilized schools. Draft Scenario 2 under-utilized schools. Draft Scenario 2 increases the total number of optimally increases the total number of optimally utilized schools across the district the utilized schools across the district the most, from 50 to 73 schools.most, from 50 to 73 schools.
• • By focusing on the utilization extremes, By focusing on the utilization extremes, Draft Scenario 1 decreases the number of Draft Scenario 1 decreases the number of very over- or under-utilized schools from very over- or under-utilized schools from 13 to 5. This draft scenario also decreases 13 to 5. This draft scenario also decreases the total range of utilization rates the the total range of utilization rates the most, from 81 percentage points to most, from 81 percentage points to 64. However, because it has a lower 64. However, because it has a lower threshold for assignment stability, the threshold for assignment stability, the number of schools in the 80-95% target number of schools in the 80-95% target utilization range decreases slightly from utilization range decreases slightly from 50 to 48 schools. 50 to 48 schools.
• • Because of its focus on consolidating Because of its focus on consolidating older, under-utilized schools, Draft older, under-utilized schools, Draft Scenario 3 is able to increase the number Scenario 3 is able to increase the number of schools in the target utilization range of schools in the target utilization range from 50 to 57. However, 11 schools from 50 to 57. However, 11 schools remain very over- or under-utilized (more remain very over- or under-utilized (more than double the amount in each of the than double the amount in each of the other scenarios). That said, Draft Scenario other scenarios). That said, Draft Scenario 3 improves utilization while eliminating 3 improves utilization while eliminating all temp classrooms that are leased or in all temp classrooms that are leased or in poor or fair condition. This means there poor or fair condition. This means there is less capacity overall, and the capacity is less capacity overall, and the capacity that remains is of higher quality.that remains is of higher quality.
All three scenarios are able to maintain All three scenarios are able to maintain or improve overall distances to school for or improve overall distances to school for non-walkers. All scenarios result in only non-walkers. All scenarios result in only minor decreases in the rate of students minor decreases in the rate of students living in walk zones, despite grade living in walk zones, despite grade realignment and consolidations.realignment and consolidations.
• • All three scenarios result in boundaries All three scenarios result in boundaries that maintain or slightly decrease the that maintain or slightly decrease the overall average distance traveled to overall average distance traveled to school, with Scenario 1 decreasing overall school, with Scenario 1 decreasing overall distances the most from 2.94 miles to distances the most from 2.94 miles to 2.88 miles. 2.88 miles.
PGCPS Comprehensive Boundary Initiative Draft Scenarios Report Summary 11
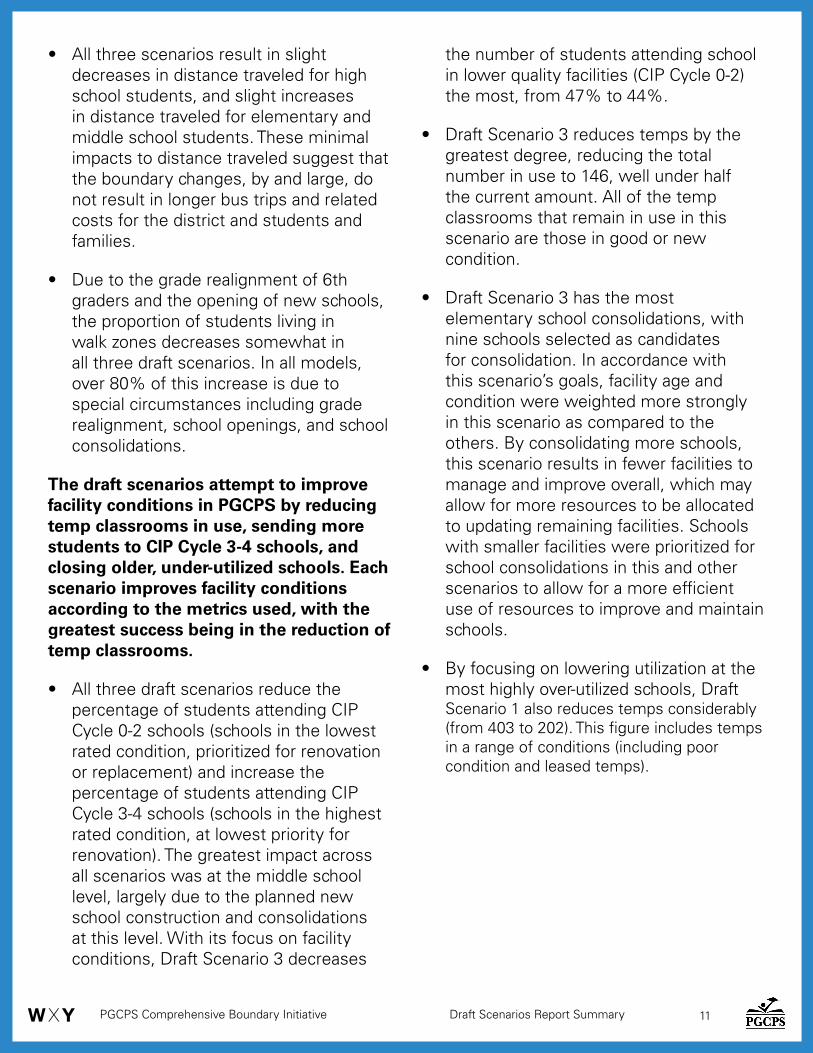
• • All three scenarios result in slight All three scenarios result in slight decreases in distance traveled for high decreases in distance traveled for high school students, and slight increases school students, and slight increases in distance traveled for elementary and in distance traveled for elementary and middle school students. These minimal middle school students. These minimal impacts to distance traveled suggest that impacts to distance traveled suggest that the boundary changes, by and large, do the boundary changes, by and large, do not result in longer bus trips and related not result in longer bus trips and related costs for the district and students and costs for the district and students and families.families.
• • Due to the grade realignment of 6th Due to the grade realignment of 6th graders and the opening of new schools, graders and the opening of new schools, the proportion of students living in the proportion of students living in walk zones decreases somewhat in walk zones decreases somewhat in all three draft scenarios. In all models, all three draft scenarios. In all models, over 80% of this increase is due to over 80% of this increase is due to special circumstances including grade special circumstances including grade realignment, school openings, and school realignment, school openings, and school consolidations. consolidations.
The draft scenarios attempt to improve The draft scenarios attempt to improve facility conditions in PGCPS by reducing facility conditions in PGCPS by reducing temp classrooms in use, sending more temp classrooms in use, sending more students to CIP Cycle 3-4 schools, and students to CIP Cycle 3-4 schools, and closing older, under-utilized schools. Each closing older, under-utilized schools. Each scenario improves facility conditions scenario improves facility conditions according to the metrics used, with the according to the metrics used, with the greatest success being in the reduction of greatest success being in the reduction of temp classrooms.temp classrooms.
• • All three draft scenarios reduce the All three draft scenarios reduce the percentage of students attending CIP percentage of students attending CIP Cycle 0-2 schools (schools in the lowest Cycle 0-2 schools (schools in the lowest rated condition, prioritized for renovation rated condition, prioritized for renovation or replacement) and increase the or replacement) and increase the percentage of students attending CIP percentage of students attending CIP Cycle 3-4 schools (schools in the highest Cycle 3-4 schools (schools in the highest rated condition, at lowest priority for rated condition, at lowest priority for renovation). The greatest impact across renovation). The greatest impact across all scenarios was at the middle school all scenarios was at the middle school level, largely due to the planned new level, largely due to the planned new school construction and consolidations school construction and consolidations at this level. With its focus on facility at this level. With its focus on facility conditions, Draft Scenario 3 decreases conditions, Draft Scenario 3 decreases
the number of students attending school the number of students attending school in lower quality facilities (CIP Cycle 0-2) in lower quality facilities (CIP Cycle 0-2) the most, from 47% to 44%. the most, from 47% to 44%.
• • Draft Scenario 3 reduces temps by the Draft Scenario 3 reduces temps by the greatest degree, reducing the total greatest degree, reducing the total number in use to 146, well under half number in use to 146, well under half the current amount. All of the temp the current amount. All of the temp classrooms that remain in use in this classrooms that remain in use in this scenario are those in good or new scenario are those in good or new condition. condition.
• • Draft Scenario 3 has the most Draft Scenario 3 has the most elementary school consolidations, with elementary school consolidations, with nine schools selected as candidates nine schools selected as candidates for consolidation. In accordance with for consolidation. In accordance with this scenario’s goals, facility age and this scenario’s goals, facility age and condition were weighted more strongly condition were weighted more strongly in this scenario as compared to the in this scenario as compared to the others. By consolidating more schools, others. By consolidating more schools, this scenario results in fewer facilities to this scenario results in fewer facilities to manage and improve overall, which may manage and improve overall, which may allow for more resources to be allocated allow for more resources to be allocated to updating remaining facilities. Schools to updating remaining facilities. Schools with smaller facilities were prioritized for with smaller facilities were prioritized for school consolidations in this and other school consolidations in this and other scenarios to allow for a more efficient scenarios to allow for a more efficient use of resources to improve and maintain use of resources to improve and maintain schools. schools.
• • By focusing on lowering utilization at the By focusing on lowering utilization at the most highly over-utilized schools, Draftmost highly over-utilized schools, Draft Scenario 1 also reduces temps considerably Scenario 1 also reduces temps considerably (from 403 to 202). This figure includes temps (from 403 to 202). This figure includes temps in a range of conditions (including poor in a range of conditions (including poor condition and leased temps).condition and leased temps).
PGCPS Comprehensive Boundary Initiative Draft Scenarios Report Summary 12
PGCPS Comprehensive Boundary Initiative Draft Scenarios Report Summary 13Draft Scenarios Report Summary 13
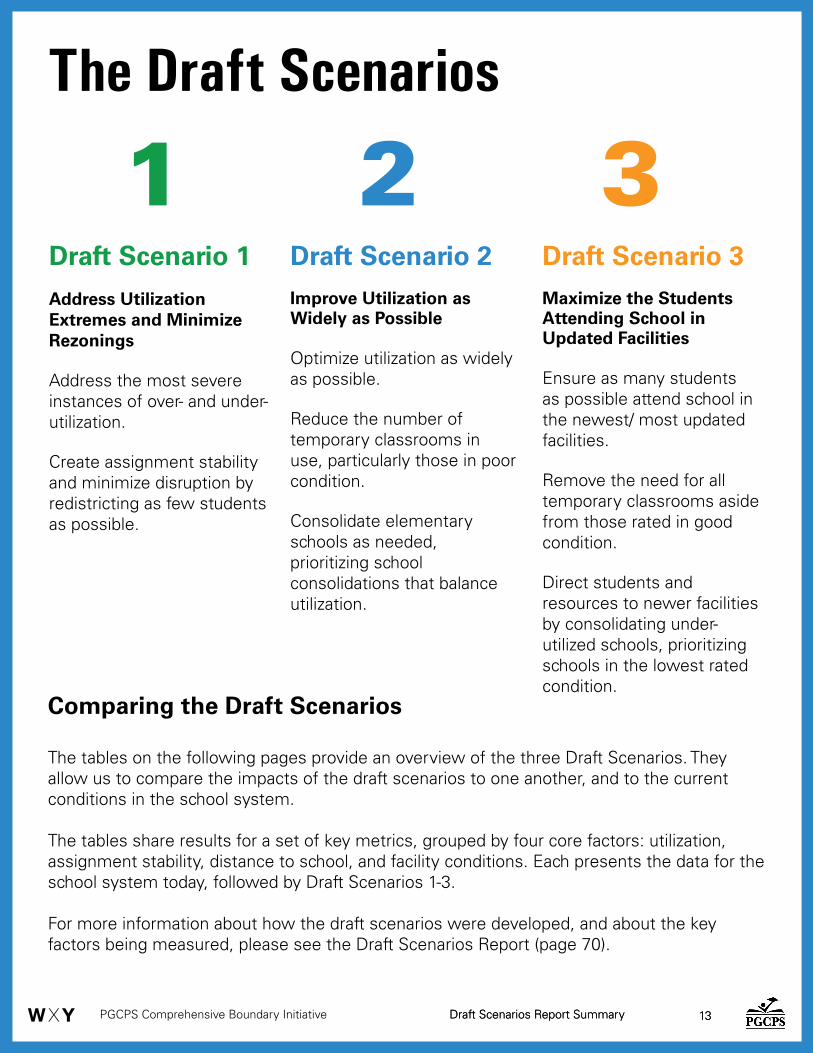
Comparing the Draft Scenarios
The tables on the following pages provide an overview of the three Draft Scenarios. They allow us to compare the impacts of the draft scenarios to one another, and to the current conditions in the school system.
The tables share results for a set of key metrics, grouped by four core factors: utilization, assignment stability, distance to school, and facility conditions. Each presents the data for the school system today, followed by Draft Scenarios 1-3.
For more information about how the draft scenarios were developed, and about the key factors being measured, please see the Draft Scenarios Report (page 70).
The Draft Scenarios
1Draft Scenario 1
Address Utilization Extremes and Minimize Rezonings
Address the most severe instances of over- and under-utilization.
Create assignment stability and minimize disruption by redistricting as few students as possible.
2 3Draft Scenario 2Improve Utilization as Widely as Possible
Optimize utilization as widely as possible.
Reduce the number of temporary classrooms in use, particularly those in poor condition.
Consolidate elementary schools as needed, prioritizing school consolidations that balance utilization.
Draft Scenario 3Maximize the Students Attending School in Updated Facilities
Ensure as many students as possible attend school in the newest/ most updated facilities.
Remove the need for all temporary classrooms aside from those rated in good condition.
Direct students and resources to newer facilities by consolidating under-utilized schools, prioritizing schools in the lowest rated condition.
PGCPS Comprehensive Boundary Initiative Draft Scenarios Report Summary 14Draft Scenarios Report Summary 14
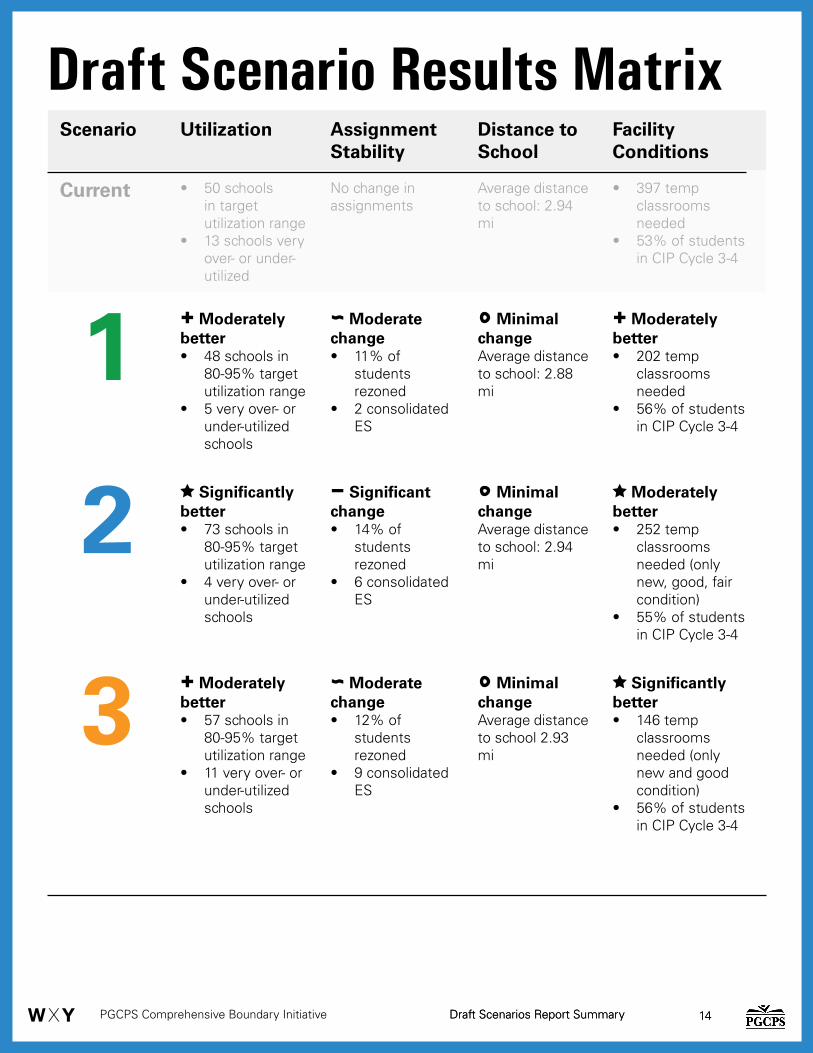
Draft Scenario Results MatrixScenario Utilization Assignment
StabilityDistance to School
Facility Conditions
Current • 50 schools in target utilization range
• 13 schools very over- or under-utilized
No change in assignments
Average distance to school: 2.94 mi
• 397 temp classrooms needed
• 53% of students in CIP Cycle 3-4
1 Moderately better• 48 schools in
80-95% target utilization range
• 5 very over- or under-utilized schools
Moderate change• 11% of
students rezoned
• 2 consolidated ES
Minimal changeAverage distance to school: 2.88 mi
Moderately better• 202 temp
classrooms needed
• 56% of students in CIP Cycle 3-4
2 Significantly better• 73 schools in
80-95% target utilization range
• 4 very over- or under-utilized schools
Significant change• 14% of
students rezoned
• 6 consolidated ES
Minimal changeAverage distance to school: 2.94 mi
Moderately better• 252 temp
classrooms needed (only new, good, fair condition)
• 55% of students in CIP Cycle 3-4
3 Moderately better• 57 schools in
80-95% target utilization range
• 11 very over- or under-utilized schools
Moderate change• 12% of
students rezoned
• 9 consolidated ES
Minimal changeAverage distance to school 2.93 mi
Significantly better• 146 temp
classrooms needed (only new and good condition)
• 56% of students in CIP Cycle 3-4

PGCPS Comprehensive Boundary Initiative Draft Scenarios Report Summary 1515
Utilization Current Scenario 1 Scenario 2 Scenario 3
Utilization, with Temp Classrooms*Schools in 80-95% utilization range 50 (30%) 48 (29%) 73 (45%) 57 (36%)Maximum utilization (overall) 126% 119% 120% 129% Minimum utilization (overall) 45% 55% 49% 48%
Assignment Stability Percent Percent Percent Total students rezoned 11% 14% 12%ES students rezoned*** 10% 14% 11%MS students rezoned*** 17% 20% 19% HS students rezoned*** 7% 9% 7%
Distance to School** Current Scenario 1 Scenario 2 Scenario 3 Average distance to school 2.94 mi 2.88 mi 2.94 mi 2.93 miES students 1.88 mi 1.91 mi 1.96 mi 2.03 miMS students 2.98 mi 3.03 mi 3.13 mi 3.09 miHS students 4.19 mi 3.97 mi 4.02 mi 3.99 miStudents in walk zone 36% 35% 34% 34%
Facility Conditions Current Scenario 1 Scenario 2 Scenario 3 % of students in CIP Cycle 0-2**** 47% 45% 46% 44%% of students in CIP Cycle 3-4**** 53% 56% 55% 56%Temp classrooms needed 397 202 252 146School Consolidations 3 7 10
Summary Table
* See page 115 of the Draft Scenarios Report for data and discussion about state rated capacity (SRC) utilization. * See page 115 of the Draft Scenarios Report for data and discussion about state rated capacity (SRC) utilization. ** Distances for comprehensive education pupils living outside of a walk zone only.*** Reassignment excludes grade levels in their last year of a school level: 5th, 8th, and 12th graders. **** CIP Cycle 0-2 schools are prioritized most highly for renovation or replacement. CIP Cycle 3-4 schools are the newest schools with the
highest rated facility conditions.
Adelphi ES, Potomac Adelphi ES, Potomac Landing ES, Isaac J Landing ES, Isaac J Gourdine MSGourdine MS
Adelphi ES, Potomac Adelphi ES, Potomac Landing ES, Baden ES, Landing ES, Baden ES, Concord ES, Pointer Concord ES, Pointer Ridge ES, Rose Valley Ridge ES, Rose Valley ES, Isaac J Gourdine MSES, Isaac J Gourdine MS
Adelphi ES, Potomac Adelphi ES, Potomac Landing ES, Bradbury Landing ES, Bradbury Heights ES, Francis T. Heights ES, Francis T. Evans ES, J. Frank Dent Evans ES, J. Frank Dent ES, Mattaponi ES, Pointer ES, Mattaponi ES, Pointer Ridge ES, Rose Valley ES, Ridge ES, Rose Valley ES, Woodmore ES, Isaac J Woodmore ES, Isaac J Gourdine MSGourdine MS
PGCPS Comprehensive Boundary Initiative Draft Scenarios Report Summary 16
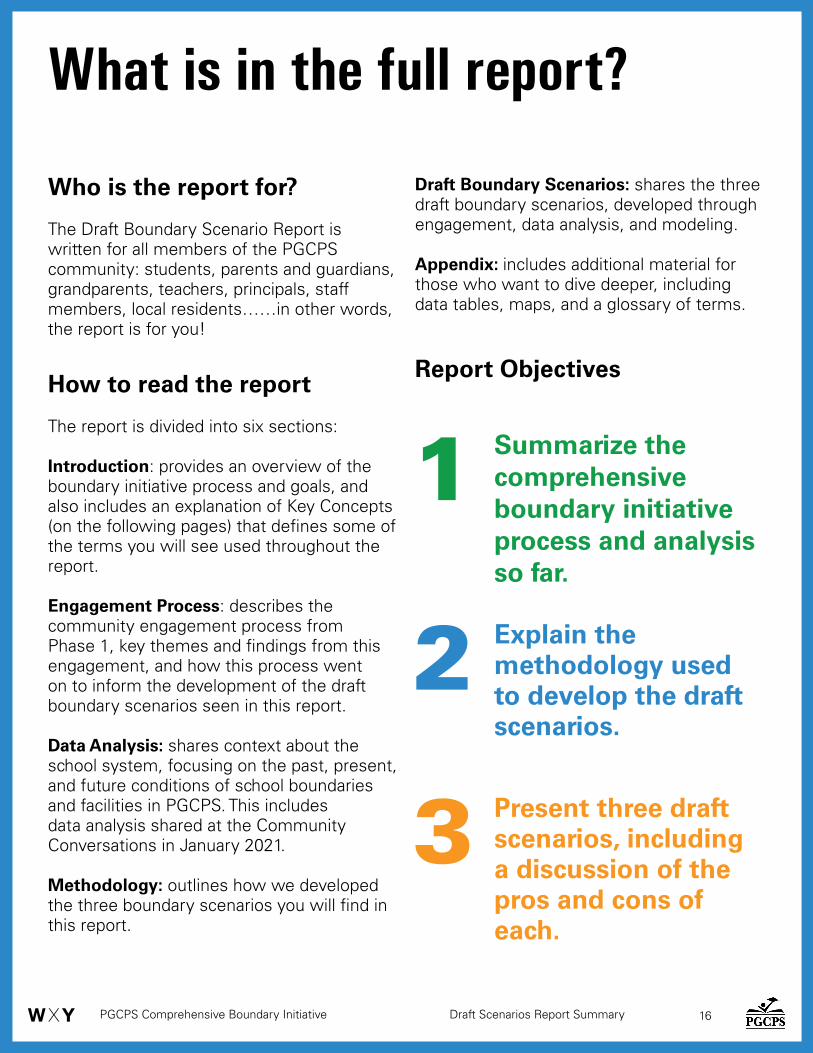
Who is the report for?
The Draft Boundary Scenario Report is The Draft Boundary Scenario Report is written for all members of the PGCPS written for all members of the PGCPS community: students, parents and guardians, community: students, parents and guardians, grandparents, teachers, principals, staff grandparents, teachers, principals, staff members, local residents……in other words, members, local residents……in other words, the report is for you!the report is for you!
How to read the report
The report is divided into six sections:
Introduction: provides an overview of the boundary initiative process and goals, and also includes an explanation of Key Concepts (on the following pages) that defines some of the terms you will see used throughout the report.
Engagement Process: describes the community engagement process from Phase 1, key themes and findings from this engagement, and how this process went on to inform the development of the draft boundary scenarios seen in this report.
Data Analysis: shares context about the school system, focusing on the past, present, and future conditions of school boundaries and facilities in PGCPS. This includes data analysis shared at the Community Conversations in January 2021.
Methodology: outlines how we developed the three boundary scenarios you will find in this report.
What is in the full report?
1 Summarize the comprehensive boundary initiative process and analysis so far.
2
3
Explain the methodology used to develop the draft scenarios.
Present three draft scenarios, including a discussion of the pros and cons of each.
Draft Boundary Scenarios: shares the three draft boundary scenarios, developed through engagement, data analysis, and modeling.
Appendix: includes additional material for those who want to dive deeper, including data tables, maps, and a glossary of terms.
Report Objectives