PFMI Quantitative Disclosure - Options Clearing Corporation1 . PFMI Quantitative Disclosure . As of...
23
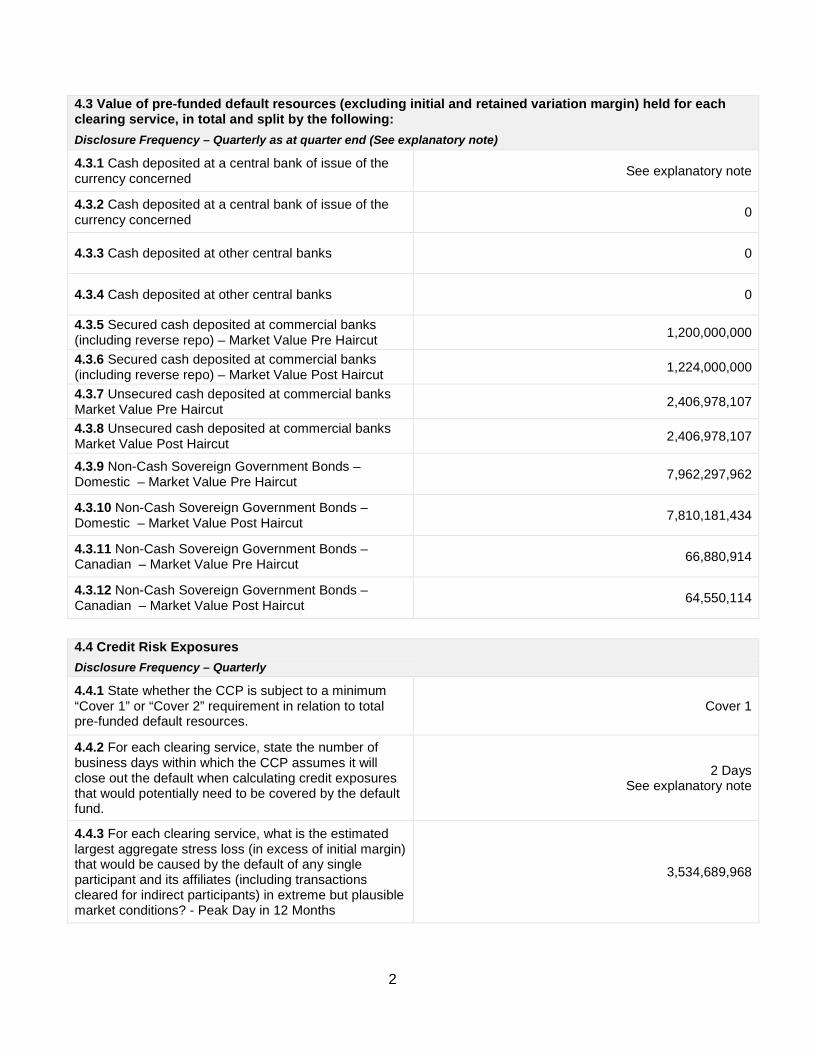
1 PFMI Quantitative Disclosure As of September 30, 2015 All financial data in USD Revised as of March 16, 2016 4.1 Total value of default resources (excluding initial and retained variation margin), split by clearing service if default funds are segregated by clearing service Disclosure Frequency - Quarterly as at quarter end 4.1.1 Prefunded - Own Capital Before See explanatory note 4.1.2 Prefunded - Own Capital Alongside 0 4.1.3 Prefunded - Own Capital After 0 4.1.4 Prefunded - Aggregate Participant Contributions - Required 11,260,943,260 4.1.5 Prefunded - Aggregate Participant Contributions - Post-Haircut Posted 11,481,709,654 4.1.6 Prefunded - Other 0 4.1.7 Committed - Own/parent funds that are committed to address a participant default (or round of participant defaults) 0 4.1.8 Committed - Aggregate participant commitments to address an initial participant default (or initial round of participant defaults) See explanatory note 4.1.9 Committed - Aggregate participant commitments to replenish the default fund to deal with a subsequent participant default (or round of participant defaults) after the initial participant default (or round of participant defaults) has been addressed See explanatory note 4.1.10 Committed - Other 0 4.2 Kccp Disclosure Frequency – Quarterly 4.2.1 Kccp - Kccp need only be reported by those CCPs which are, or seek to be a "qualifying CCP" under relevant law 273,145,189 See explanatory note
Transcript of PFMI Quantitative Disclosure - Options Clearing Corporation1 . PFMI Quantitative Disclosure . As of...
1
PFMI Quantitative Disclosure
As of September 30, 2015
All financial data in USD
Revised as of March 16, 2016
4.1 Total value of default resources (excluding initial and retained variation margin), split by clearing service if default funds are segregated by clearing service Disclosure Frequency - Quarterly as at quarter end
4.1.1 Prefunded - Own Capital Before See explanatory note 4.1.2 Prefunded - Own Capital Alongside 0 4.1.3 Prefunded - Own Capital After 0 4.1.4 Prefunded - Aggregate Participant Contributions - Required 11,260,943,260
4.1.5 Prefunded - Aggregate Participant Contributions - Post-Haircut Posted 11,481,709,654
4.1.6 Prefunded - Other 0 4.1.7 Committed - Own/parent funds that are committed to address a participant default (or round of participant defaults)
0
4.1.8 Committed - Aggregate participant commitments to address an initial participant default (or initial round of participant defaults)
See explanatory note
4.1.9 Committed - Aggregate participant commitments to replenish the default fund to deal with a subsequent participant default (or round of participant defaults) after the initial participant default (or round of participant defaults) has been addressed
See explanatory note
4.1.10 Committed - Other 0
4.2 Kccp Disclosure Frequency – Quarterly 4.2.1 Kccp - Kccp need only be reported by those CCPs which are, or seek to be a "qualifying CCP" under relevant law
273,145,189 See explanatory note
2
4.3 Value of pre-funded default resources (excluding initial and retained variation margin) held for each clearing service, in total and split by the following: Disclosure Frequency – Quarterly as at quarter end (See explanatory note)
4.3.1 Cash deposited at a central bank of issue of the currency concerned See explanatory note
4.3.2 Cash deposited at a central bank of issue of the currency concerned 0
4.3.3 Cash deposited at other central banks 0
4.3.4 Cash deposited at other central banks 0
4.3.5 Secured cash deposited at commercial banks (including reverse repo) – Market Value Pre Haircut 1,200,000,000
4.3.6 Secured cash deposited at commercial banks (including reverse repo) – Market Value Post Haircut 1,224,000,000
4.3.7 Unsecured cash deposited at commercial banks Market Value Pre Haircut 2,406,978,107
4.3.8 Unsecured cash deposited at commercial banks Market Value Post Haircut 2,406,978,107
4.3.9 Non-Cash Sovereign Government Bonds – Domestic – Market Value Pre Haircut 7,962,297,962
4.3.10 Non-Cash Sovereign Government Bonds – Domestic – Market Value Post Haircut 7,810,181,434
4.3.11 Non-Cash Sovereign Government Bonds – Canadian – Market Value Pre Haircut 66,880,914
4.3.12 Non-Cash Sovereign Government Bonds – Canadian – Market Value Post Haircut 64,550,114
4.4 Credit Risk Exposures Disclosure Frequency – Quarterly 4.4.1 State whether the CCP is subject to a minimum “Cover 1” or “Cover 2” requirement in relation to total pre-funded default resources.
Cover 1
4.4.2 For each clearing service, state the number of business days within which the CCP assumes it will close out the default when calculating credit exposures that would potentially need to be covered by the default fund.
2 Days See explanatory note
4.4.3 For each clearing service, what is the estimated largest aggregate stress loss (in excess of initial margin) that would be caused by the default of any single participant and its affiliates (including transactions cleared for indirect participants) in extreme but plausible market conditions? - Peak Day in 12 Months
3,534,689,968
3
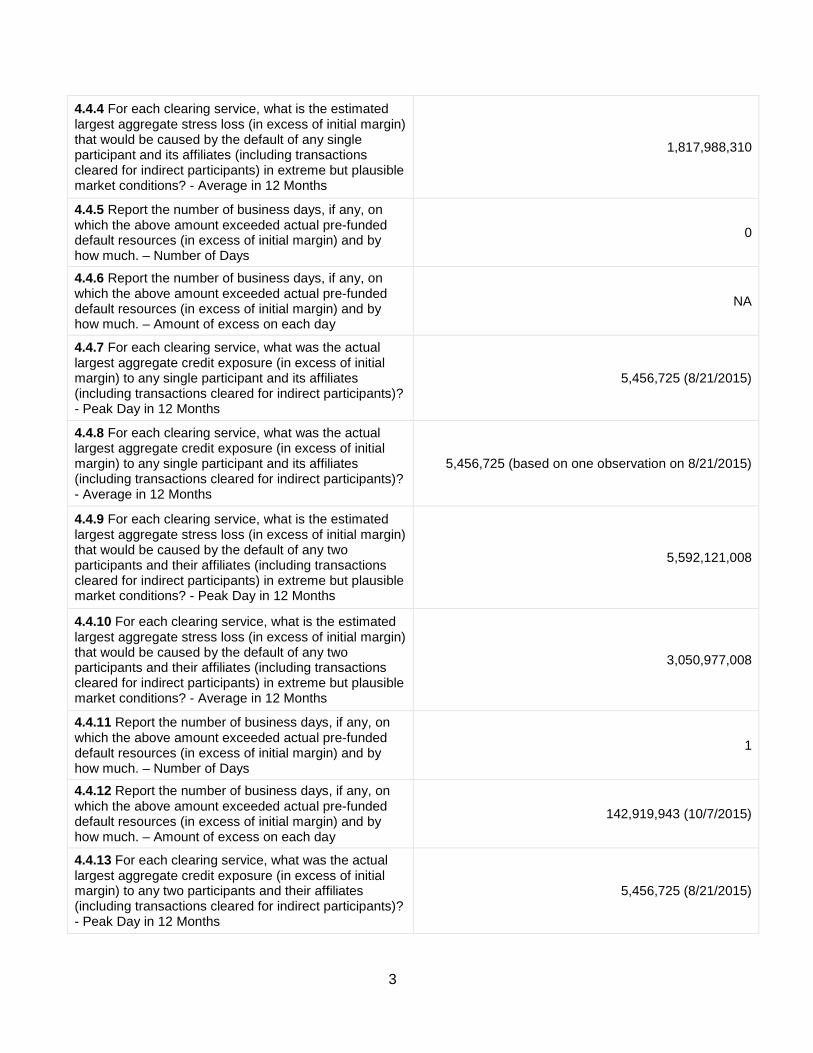
4.4.4 For each clearing service, what is the estimated largest aggregate stress loss (in excess of initial margin) that would be caused by the default of any single participant and its affiliates (including transactions cleared for indirect participants) in extreme but plausible market conditions? - Average in 12 Months
1,817,988,310
4.4.5 Report the number of business days, if any, on which the above amount exceeded actual pre-funded default resources (in excess of initial margin) and by how much. – Number of Days
0
4.4.6 Report the number of business days, if any, on which the above amount exceeded actual pre-funded default resources (in excess of initial margin) and by how much. – Amount of excess on each day
NA
4.4.7 For each clearing service, what was the actual largest aggregate credit exposure (in excess of initial margin) to any single participant and its affiliates (including transactions cleared for indirect participants)? - Peak Day in 12 Months
5,456,725 (8/21/2015)
4.4.8 For each clearing service, what was the actual largest aggregate credit exposure (in excess of initial margin) to any single participant and its affiliates (including transactions cleared for indirect participants)? - Average in 12 Months
5,456,725 (based on one observation on 8/21/2015)
4.4.9 For each clearing service, what is the estimated largest aggregate stress loss (in excess of initial margin) that would be caused by the default of any two participants and their affiliates (including transactions cleared for indirect participants) in extreme but plausible market conditions? - Peak Day in 12 Months
5,592,121,008
4.4.10 For each clearing service, what is the estimated largest aggregate stress loss (in excess of initial margin) that would be caused by the default of any two participants and their affiliates (including transactions cleared for indirect participants) in extreme but plausible market conditions? - Average in 12 Months
3,050,977,008
4.4.11 Report the number of business days, if any, on which the above amount exceeded actual pre-funded default resources (in excess of initial margin) and by how much. – Number of Days
1
4.4.12 Report the number of business days, if any, on which the above amount exceeded actual pre-funded default resources (in excess of initial margin) and by how much. – Amount of excess on each day
142,919,943 (10/7/2015)
4.4.13 For each clearing service, what was the actual largest aggregate credit exposure (in excess of initial margin) to any two participants and their affiliates (including transactions cleared for indirect participants)? - Peak Day in 12 Months
5,456,725 (8/21/2015)
4
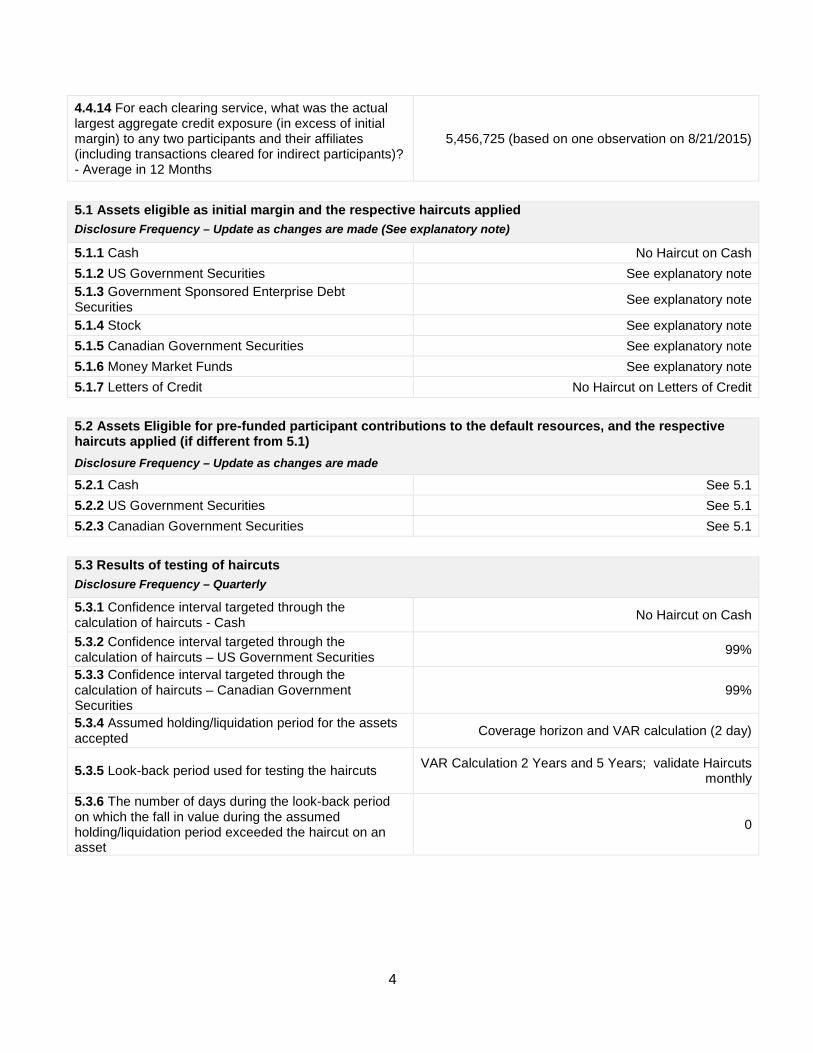
4.4.14 For each clearing service, what was the actual largest aggregate credit exposure (in excess of initial margin) to any two participants and their affiliates (including transactions cleared for indirect participants)? - Average in 12 Months
5,456,725 (based on one observation on 8/21/2015)
5.1 Assets eligible as initial margin and the respective haircuts applied Disclosure Frequency – Update as changes are made (See explanatory note)
5.1.1 Cash No Haircut on Cash 5.1.2 US Government Securities See explanatory note 5.1.3 Government Sponsored Enterprise Debt Securities See explanatory note
5.1.4 Stock See explanatory note 5.1.5 Canadian Government Securities See explanatory note 5.1.6 Money Market Funds See explanatory note 5.1.7 Letters of Credit No Haircut on Letters of Credit
5.2 Assets Eligible for pre-funded participant contributions to the default resources, and the respective haircuts applied (if different from 5.1) Disclosure Frequency – Update as changes are made
5.2.1 Cash See 5.1 5.2.2 US Government Securities See 5.1 5.2.3 Canadian Government Securities See 5.1
5.3 Results of testing of haircuts Disclosure Frequency – Quarterly
5.3.1 Confidence interval targeted through the calculation of haircuts - Cash No Haircut on Cash
5.3.2 Confidence interval targeted through the calculation of haircuts – US Government Securities 99%
5.3.3 Confidence interval targeted through the calculation of haircuts – Canadian Government Securities
99%
5.3.4 Assumed holding/liquidation period for the assets accepted Coverage horizon and VAR calculation (2 day)
5.3.5 Look-back period used for testing the haircuts VAR Calculation 2 Years and 5 Years; validate Haircuts monthly
5.3.6 The number of days during the look-back period on which the fall in value during the assumed holding/liquidation period exceeded the haircut on an asset
0
5
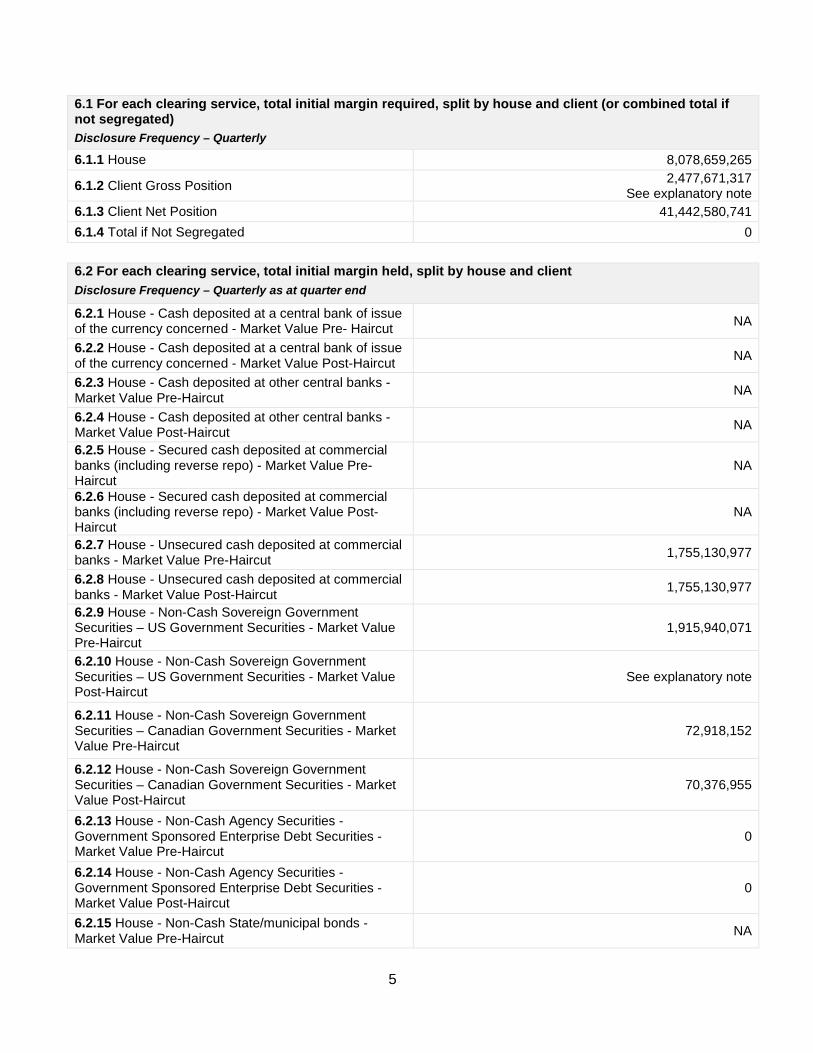
6.1 For each clearing service, total initial margin required, split by house and client (or combined total if not segregated) Disclosure Frequency – Quarterly
6.1.1 House 8,078,659,265
6.1.2 Client Gross Position 2,477,671,317 See explanatory note
6.1.3 Client Net Position 41,442,580,741 6.1.4 Total if Not Segregated 0
6.2 For each clearing service, total initial margin held, split by house and client Disclosure Frequency – Quarterly as at quarter end
6.2.1 House - Cash deposited at a central bank of issue of the currency concerned - Market Value Pre- Haircut NA
6.2.2 House - Cash deposited at a central bank of issue of the currency concerned - Market Value Post-Haircut NA
6.2.3 House - Cash deposited at other central banks - Market Value Pre-Haircut NA
6.2.4 House - Cash deposited at other central banks - Market Value Post-Haircut NA
6.2.5 House - Secured cash deposited at commercial banks (including reverse repo) - Market Value Pre-Haircut
NA
6.2.6 House - Secured cash deposited at commercial banks (including reverse repo) - Market Value Post-Haircut
NA
6.2.7 House - Unsecured cash deposited at commercial banks - Market Value Pre-Haircut 1,755,130,977
6.2.8 House - Unsecured cash deposited at commercial banks - Market Value Post-Haircut 1,755,130,977
6.2.9 House - Non-Cash Sovereign Government Securities – US Government Securities - Market Value Pre-Haircut
1,915,940,071
6.2.10 House - Non-Cash Sovereign Government Securities – US Government Securities - Market Value Post-Haircut
See explanatory note
6.2.11 House - Non-Cash Sovereign Government Securities – Canadian Government Securities - Market Value Pre-Haircut
72,918,152
6.2.12 House - Non-Cash Sovereign Government Securities – Canadian Government Securities - Market Value Post-Haircut
70,376,955
6.2.13 House - Non-Cash Agency Securities - Government Sponsored Enterprise Debt Securities - Market Value Pre-Haircut
0
6.2.14 House - Non-Cash Agency Securities - Government Sponsored Enterprise Debt Securities - Market Value Post-Haircut
0
6.2.15 House - Non-Cash State/municipal bonds - Market Value Pre-Haircut NA
6
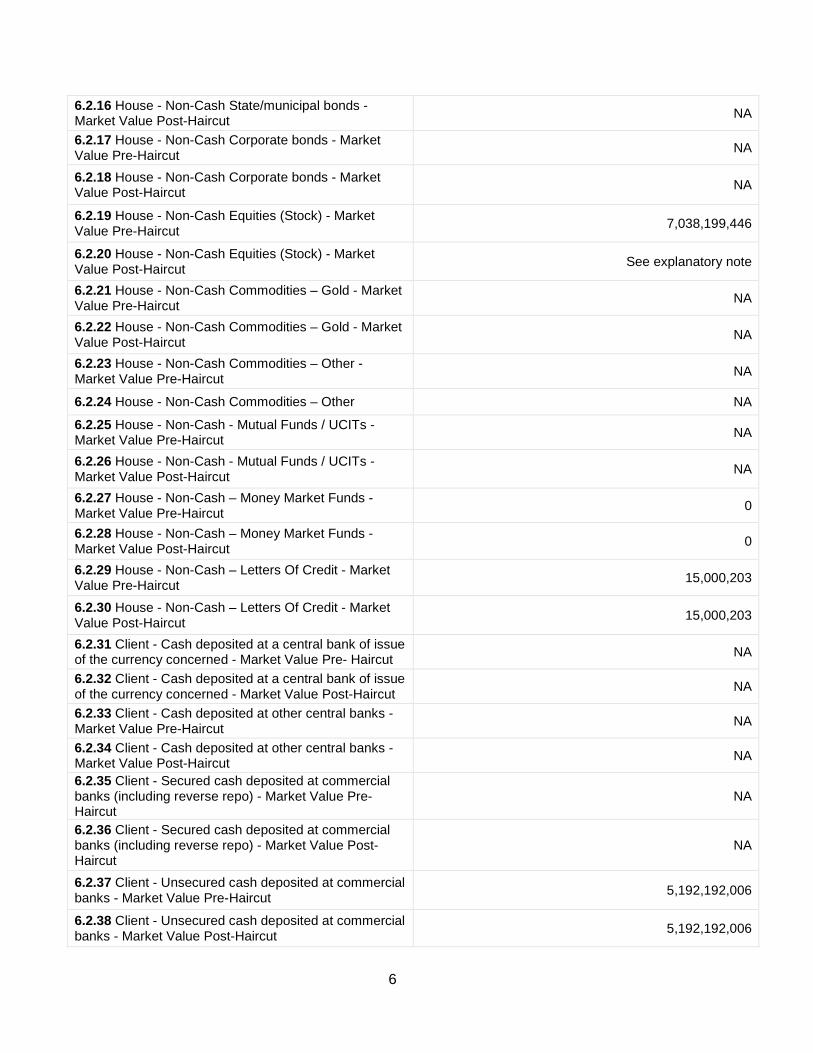
6.2.16 House - Non-Cash State/municipal bonds - Market Value Post-Haircut NA
6.2.17 House - Non-Cash Corporate bonds - Market Value Pre-Haircut NA
6.2.18 House - Non-Cash Corporate bonds - Market Value Post-Haircut NA
6.2.19 House - Non-Cash Equities (Stock) - Market Value Pre-Haircut 7,038,199,446
6.2.20 House - Non-Cash Equities (Stock) - Market Value Post-Haircut See explanatory note
6.2.21 House - Non-Cash Commodities – Gold - Market Value Pre-Haircut NA
6.2.22 House - Non-Cash Commodities – Gold - Market Value Post-Haircut NA
6.2.23 House - Non-Cash Commodities – Other - Market Value Pre-Haircut NA
6.2.24 House - Non-Cash Commodities – Other NA
6.2.25 House - Non-Cash - Mutual Funds / UCITs - Market Value Pre-Haircut NA
6.2.26 House - Non-Cash - Mutual Funds / UCITs - Market Value Post-Haircut NA
6.2.27 House - Non-Cash – Money Market Funds - Market Value Pre-Haircut 0
6.2.28 House - Non-Cash – Money Market Funds - Market Value Post-Haircut 0
6.2.29 House - Non-Cash – Letters Of Credit - Market Value Pre-Haircut 15,000,203
6.2.30 House - Non-Cash – Letters Of Credit - Market Value Post-Haircut 15,000,203
6.2.31 Client - Cash deposited at a central bank of issue of the currency concerned - Market Value Pre- Haircut NA
6.2.32 Client - Cash deposited at a central bank of issue of the currency concerned - Market Value Post-Haircut NA
6.2.33 Client - Cash deposited at other central banks - Market Value Pre-Haircut NA
6.2.34 Client - Cash deposited at other central banks - Market Value Post-Haircut NA
6.2.35 Client - Secured cash deposited at commercial banks (including reverse repo) - Market Value Pre-Haircut
NA
6.2.36 Client - Secured cash deposited at commercial banks (including reverse repo) - Market Value Post-Haircut
NA
6.2.37 Client - Unsecured cash deposited at commercial banks - Market Value Pre-Haircut 5,192,192,006
6.2.38 Client - Unsecured cash deposited at commercial banks - Market Value Post-Haircut 5,192,192,006
7
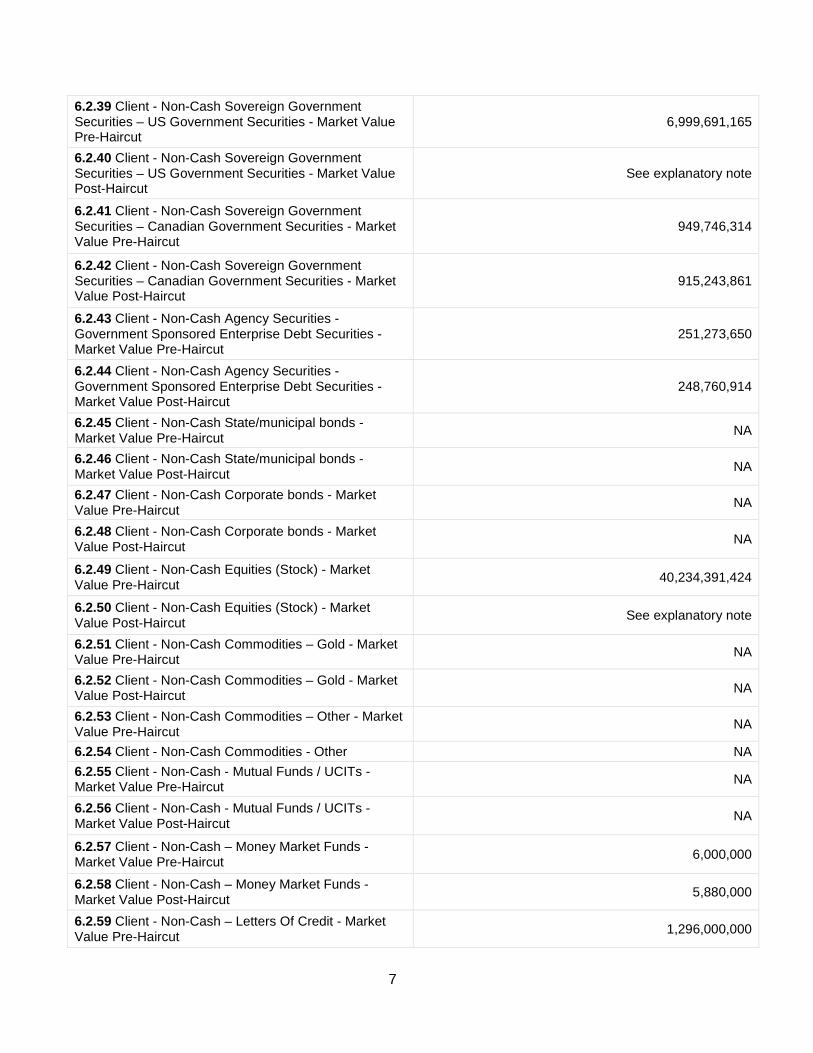
6.2.39 Client - Non-Cash Sovereign Government Securities – US Government Securities - Market Value Pre-Haircut
6,999,691,165
6.2.40 Client - Non-Cash Sovereign Government Securities – US Government Securities - Market Value Post-Haircut
See explanatory note
6.2.41 Client - Non-Cash Sovereign Government Securities – Canadian Government Securities - Market Value Pre-Haircut
949,746,314
6.2.42 Client - Non-Cash Sovereign Government Securities – Canadian Government Securities - Market Value Post-Haircut
915,243,861
6.2.43 Client - Non-Cash Agency Securities - Government Sponsored Enterprise Debt Securities - Market Value Pre-Haircut
251,273,650
6.2.44 Client - Non-Cash Agency Securities - Government Sponsored Enterprise Debt Securities - Market Value Post-Haircut
248,760,914
6.2.45 Client - Non-Cash State/municipal bonds - Market Value Pre-Haircut NA
6.2.46 Client - Non-Cash State/municipal bonds - Market Value Post-Haircut NA
6.2.47 Client - Non-Cash Corporate bonds - Market Value Pre-Haircut NA
6.2.48 Client - Non-Cash Corporate bonds - Market Value Post-Haircut NA
6.2.49 Client - Non-Cash Equities (Stock) - Market Value Pre-Haircut 40,234,391,424
6.2.50 Client - Non-Cash Equities (Stock) - Market Value Post-Haircut See explanatory note
6.2.51 Client - Non-Cash Commodities – Gold - Market Value Pre-Haircut NA
6.2.52 Client - Non-Cash Commodities – Gold - Market Value Post-Haircut NA
6.2.53 Client - Non-Cash Commodities – Other - Market Value Pre-Haircut NA
6.2.54 Client - Non-Cash Commodities - Other NA 6.2.55 Client - Non-Cash - Mutual Funds / UCITs - Market Value Pre-Haircut NA
6.2.56 Client - Non-Cash - Mutual Funds / UCITs - Market Value Post-Haircut NA
6.2.57 Client - Non-Cash – Money Market Funds - Market Value Pre-Haircut 6,000,000
6.2.58 Client - Non-Cash – Money Market Funds - Market Value Post-Haircut 5,880,000
6.2.59 Client - Non-Cash – Letters Of Credit - Market Value Pre-Haircut 1,296,000,000
8
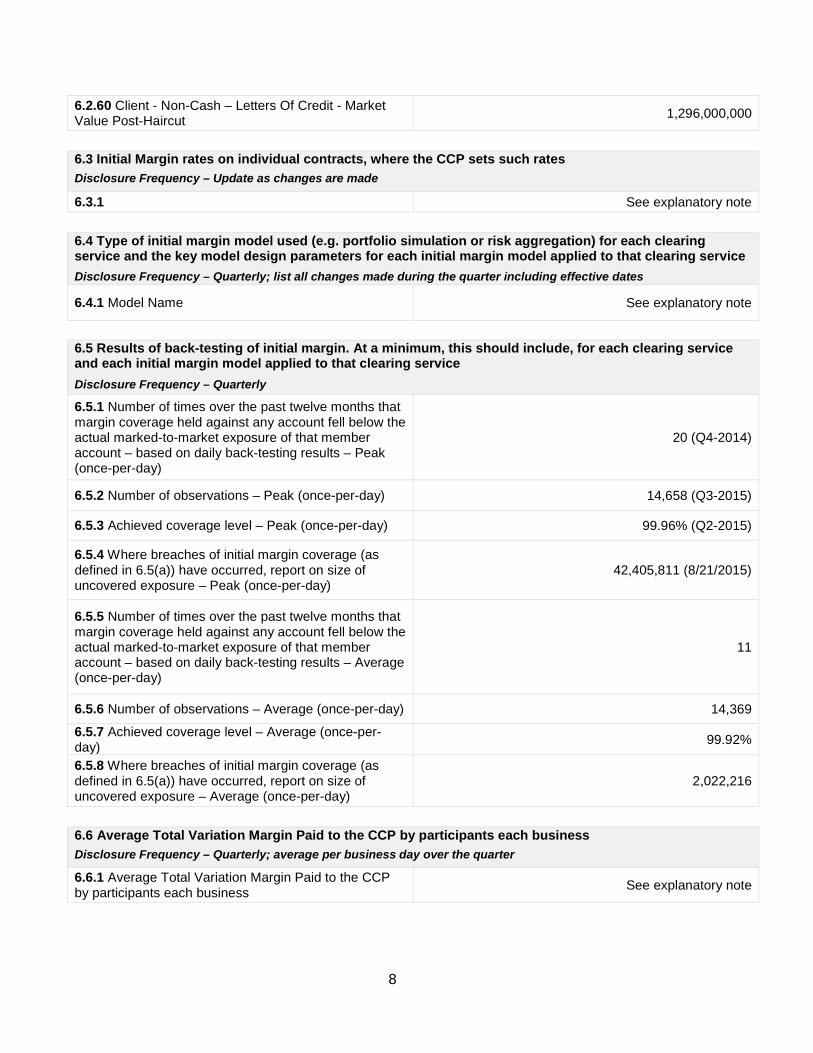
6.2.60 Client - Non-Cash – Letters Of Credit - Market Value Post-Haircut 1,296,000,000
6.3 Initial Margin rates on individual contracts, where the CCP sets such rates Disclosure Frequency – Update as changes are made
6.3.1 See explanatory note
6.4 Type of initial margin model used (e.g. portfolio simulation or risk aggregation) for each clearing service and the key model design parameters for each initial margin model applied to that clearing service Disclosure Frequency – Quarterly; list all changes made during the quarter including effective dates
6.4.1 Model Name See explanatory note
6.5 Results of back-testing of initial margin. At a minimum, this should include, for each clearing service and each initial margin model applied to that clearing service Disclosure Frequency – Quarterly
6.5.1 Number of times over the past twelve months that margin coverage held against any account fell below the actual marked-to-market exposure of that member account – based on daily back-testing results – Peak (once-per-day)
20 (Q4-2014)
6.5.2 Number of observations – Peak (once-per-day) 14,658 (Q3-2015)
6.5.3 Achieved coverage level – Peak (once-per-day) 99.96% (Q2-2015)
6.5.4 Where breaches of initial margin coverage (as defined in 6.5(a)) have occurred, report on size of uncovered exposure – Peak (once-per-day)
42,405,811 (8/21/2015)
6.5.5 Number of times over the past twelve months that margin coverage held against any account fell below the actual marked-to-market exposure of that member account – based on daily back-testing results – Average (once-per-day)
11
6.5.6 Number of observations – Average (once-per-day) 14,369
6.5.7 Achieved coverage level – Average (once-per-day) 99.92%
6.5.8 Where breaches of initial margin coverage (as defined in 6.5(a)) have occurred, report on size of uncovered exposure – Average (once-per-day)
2,022,216
6.6 Average Total Variation Margin Paid to the CCP by participants each business Disclosure Frequency – Quarterly; average per business day over the quarter
6.6.1 Average Total Variation Margin Paid to the CCP by participants each business See explanatory note
9
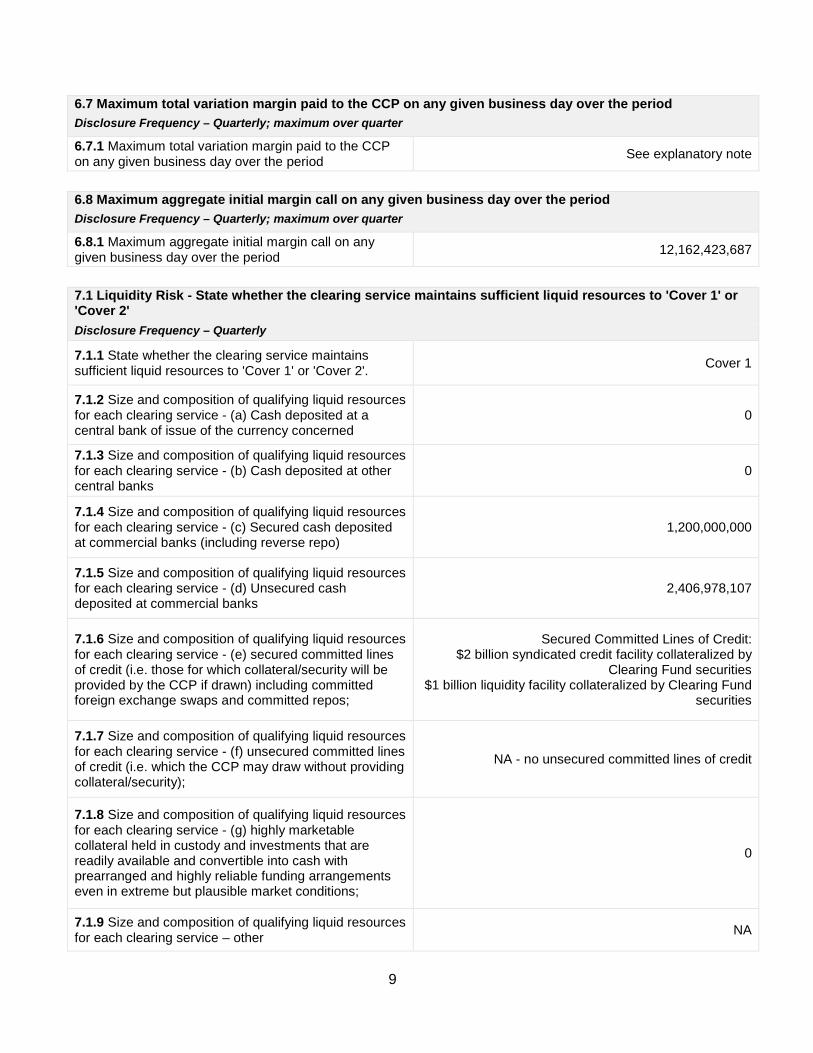
6.7 Maximum total variation margin paid to the CCP on any given business day over the period Disclosure Frequency – Quarterly; maximum over quarter
6.7.1 Maximum total variation margin paid to the CCP on any given business day over the period See explanatory note
6.8 Maximum aggregate initial margin call on any given business day over the period Disclosure Frequency – Quarterly; maximum over quarter
6.8.1 Maximum aggregate initial margin call on any given business day over the period 12,162,423,687
7.1 Liquidity Risk - State whether the clearing service maintains sufficient liquid resources to 'Cover 1' or 'Cover 2' Disclosure Frequency – Quarterly
7.1.1 State whether the clearing service maintains sufficient liquid resources to 'Cover 1' or 'Cover 2'. Cover 1
7.1.2 Size and composition of qualifying liquid resources for each clearing service - (a) Cash deposited at a central bank of issue of the currency concerned
0
7.1.3 Size and composition of qualifying liquid resources for each clearing service - (b) Cash deposited at other central banks
0
7.1.4 Size and composition of qualifying liquid resources for each clearing service - (c) Secured cash deposited at commercial banks (including reverse repo)
1,200,000,000
7.1.5 Size and composition of qualifying liquid resources for each clearing service - (d) Unsecured cash deposited at commercial banks
2,406,978,107
7.1.6 Size and composition of qualifying liquid resources for each clearing service - (e) secured committed lines of credit (i.e. those for which collateral/security will be provided by the CCP if drawn) including committed foreign exchange swaps and committed repos;
Secured Committed Lines of Credit: $2 billion syndicated credit facility collateralized by
Clearing Fund securities $1 billion liquidity facility collateralized by Clearing Fund
securities
7.1.7 Size and composition of qualifying liquid resources for each clearing service - (f) unsecured committed lines of credit (i.e. which the CCP may draw without providing collateral/security);
NA - no unsecured committed lines of credit
7.1.8 Size and composition of qualifying liquid resources for each clearing service - (g) highly marketable collateral held in custody and investments that are readily available and convertible into cash with prearranged and highly reliable funding arrangements even in extreme but plausible market conditions;
0
7.1.9 Size and composition of qualifying liquid resources for each clearing service – other NA
10
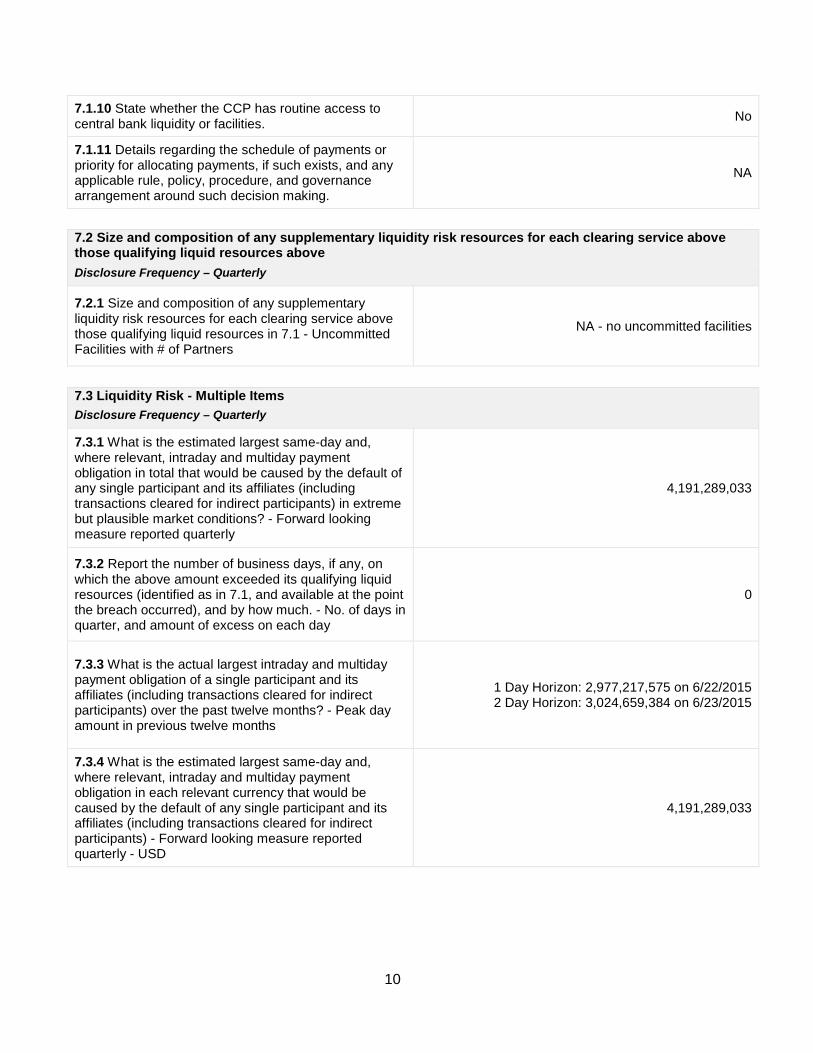
7.1.10 State whether the CCP has routine access to central bank liquidity or facilities. No
7.1.11 Details regarding the schedule of payments or priority for allocating payments, if such exists, and any applicable rule, policy, procedure, and governance arrangement around such decision making.
NA
7.2 Size and composition of any supplementary liquidity risk resources for each clearing service above those qualifying liquid resources above Disclosure Frequency – Quarterly
7.2.1 Size and composition of any supplementary liquidity risk resources for each clearing service above those qualifying liquid resources in 7.1 - Uncommitted Facilities with # of Partners
NA - no uncommitted facilities
7.3 Liquidity Risk - Multiple Items Disclosure Frequency – Quarterly
7.3.1 What is the estimated largest same-day and, where relevant, intraday and multiday payment obligation in total that would be caused by the default of any single participant and its affiliates (including transactions cleared for indirect participants) in extreme but plausible market conditions? - Forward looking measure reported quarterly
4,191,289,033
7.3.2 Report the number of business days, if any, on which the above amount exceeded its qualifying liquid resources (identified as in 7.1, and available at the point the breach occurred), and by how much. - No. of days in quarter, and amount of excess on each day
0
7.3.3 What is the actual largest intraday and multiday payment obligation of a single participant and its affiliates (including transactions cleared for indirect participants) over the past twelve months? - Peak day amount in previous twelve months
1 Day Horizon: 2,977,217,575 on 6/22/2015 2 Day Horizon: 3,024,659,384 on 6/23/2015
7.3.4 What is the estimated largest same-day and, where relevant, intraday and multiday payment obligation in each relevant currency that would be caused by the default of any single participant and its affiliates (including transactions cleared for indirect participants) - Forward looking measure reported quarterly - USD
4,191,289,033
11
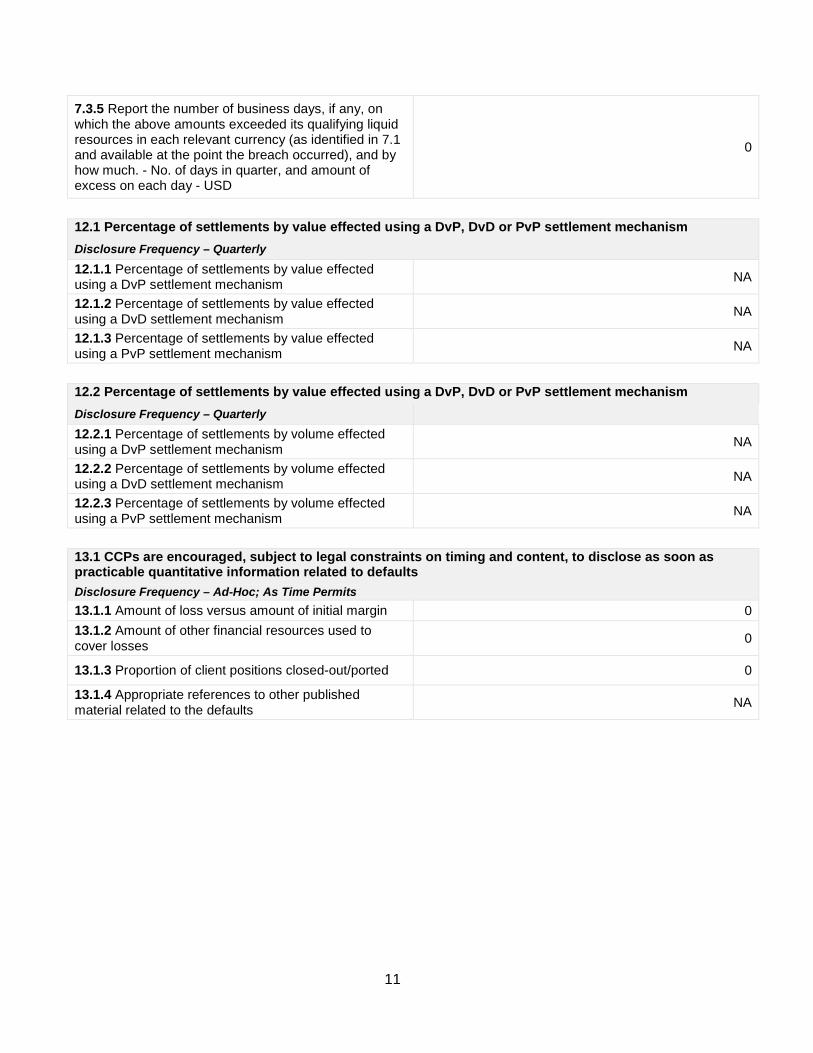
7.3.5 Report the number of business days, if any, on which the above amounts exceeded its qualifying liquid resources in each relevant currency (as identified in 7.1 and available at the point the breach occurred), and by how much. - No. of days in quarter, and amount of excess on each day - USD
0
12.1 Percentage of settlements by value effected using a DvP, DvD or PvP settlement mechanism Disclosure Frequency – Quarterly 12.1.1 Percentage of settlements by value effected using a DvP settlement mechanism NA
12.1.2 Percentage of settlements by value effected using a DvD settlement mechanism NA
12.1.3 Percentage of settlements by value effected using a PvP settlement mechanism NA
12.2 Percentage of settlements by value effected using a DvP, DvD or PvP settlement mechanism Disclosure Frequency – Quarterly 12.2.1 Percentage of settlements by volume effected using a DvP settlement mechanism NA
12.2.2 Percentage of settlements by volume effected using a DvD settlement mechanism NA
12.2.3 Percentage of settlements by volume effected using a PvP settlement mechanism NA
13.1 CCPs are encouraged, subject to legal constraints on timing and content, to disclose as soon as practicable quantitative information related to defaults Disclosure Frequency – Ad-Hoc; As Time Permits 13.1.1 Amount of loss versus amount of initial margin 0 13.1.2 Amount of other financial resources used to cover losses 0
13.1.3 Proportion of client positions closed-out/ported 0
13.1.4 Appropriate references to other published material related to the defaults NA
12
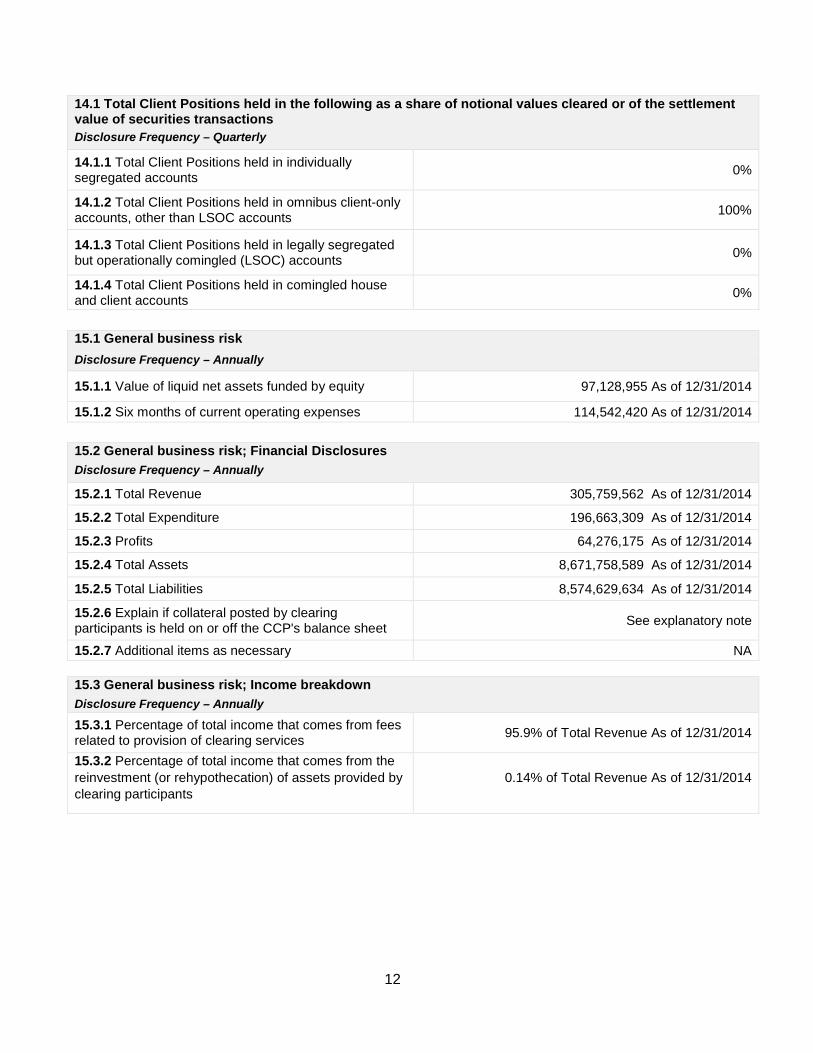
14.1 Total Client Positions held in the following as a share of notional values cleared or of the settlement value of securities transactions Disclosure Frequency – Quarterly
14.1.1 Total Client Positions held in individually segregated accounts 0%
14.1.2 Total Client Positions held in omnibus client-only accounts, other than LSOC accounts 100%
14.1.3 Total Client Positions held in legally segregated but operationally comingled (LSOC) accounts 0%
14.1.4 Total Client Positions held in comingled house and client accounts 0%
15.1 General business risk Disclosure Frequency – Annually
15.1.1 Value of liquid net assets funded by equity 97,128,955 As of 12/31/2014
15.1.2 Six months of current operating expenses 114,542,420 As of 12/31/2014
15.2 General business risk; Financial Disclosures Disclosure Frequency – Annually
15.2.1 Total Revenue 305,759,562 As of 12/31/2014
15.2.2 Total Expenditure 196,663,309 As of 12/31/2014
15.2.3 Profits 64,276,175 As of 12/31/2014
15.2.4 Total Assets 8,671,758,589 As of 12/31/2014
15.2.5 Total Liabilities 8,574,629,634 As of 12/31/2014
15.2.6 Explain if collateral posted by clearing participants is held on or off the CCP's balance sheet See explanatory note
15.2.7 Additional items as necessary NA
15.3 General business risk; Income breakdown Disclosure Frequency – Annually
15.3.1 Percentage of total income that comes from fees related to provision of clearing services 95.9% of Total Revenue As of 12/31/2014
15.3.2 Percentage of total income that comes from the reinvestment (or rehypothecation) of assets provided by clearing participants
0.14% of Total Revenue As of 12/31/2014
13
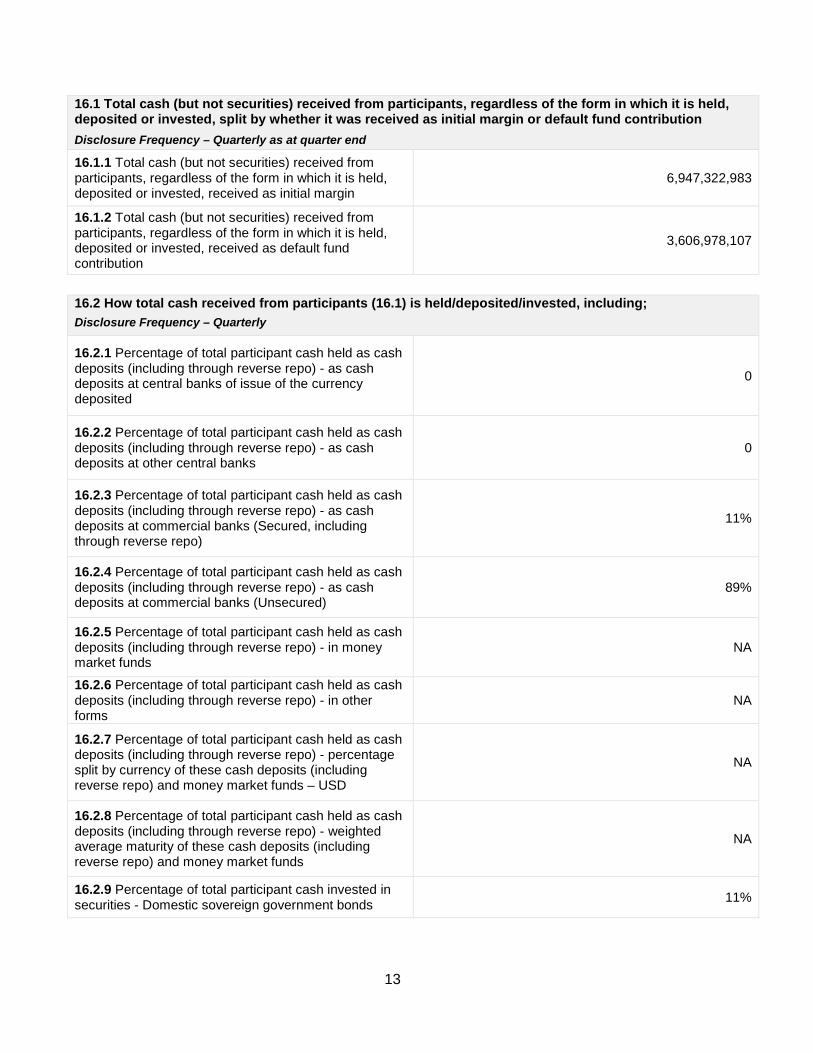
16.1 Total cash (but not securities) received from participants, regardless of the form in which it is held, deposited or invested, split by whether it was received as initial margin or default fund contribution Disclosure Frequency – Quarterly as at quarter end
16.1.1 Total cash (but not securities) received from participants, regardless of the form in which it is held, deposited or invested, received as initial margin
6,947,322,983
16.1.2 Total cash (but not securities) received from participants, regardless of the form in which it is held, deposited or invested, received as default fund contribution
3,606,978,107
16.2 How total cash received from participants (16.1) is held/deposited/invested, including; Disclosure Frequency – Quarterly
16.2.1 Percentage of total participant cash held as cash deposits (including through reverse repo) - as cash deposits at central banks of issue of the currency deposited
0
16.2.2 Percentage of total participant cash held as cash deposits (including through reverse repo) - as cash deposits at other central banks
0
16.2.3 Percentage of total participant cash held as cash deposits (including through reverse repo) - as cash deposits at commercial banks (Secured, including through reverse repo)
11%
16.2.4 Percentage of total participant cash held as cash deposits (including through reverse repo) - as cash deposits at commercial banks (Unsecured)
89%
16.2.5 Percentage of total participant cash held as cash deposits (including through reverse repo) - in money market funds
NA
16.2.6 Percentage of total participant cash held as cash deposits (including through reverse repo) - in other forms
NA
16.2.7 Percentage of total participant cash held as cash deposits (including through reverse repo) - percentage split by currency of these cash deposits (including reverse repo) and money market funds – USD
NA
16.2.8 Percentage of total participant cash held as cash deposits (including through reverse repo) - weighted average maturity of these cash deposits (including reverse repo) and money market funds
NA
16.2.9 Percentage of total participant cash invested in securities - Domestic sovereign government bonds 11%
14
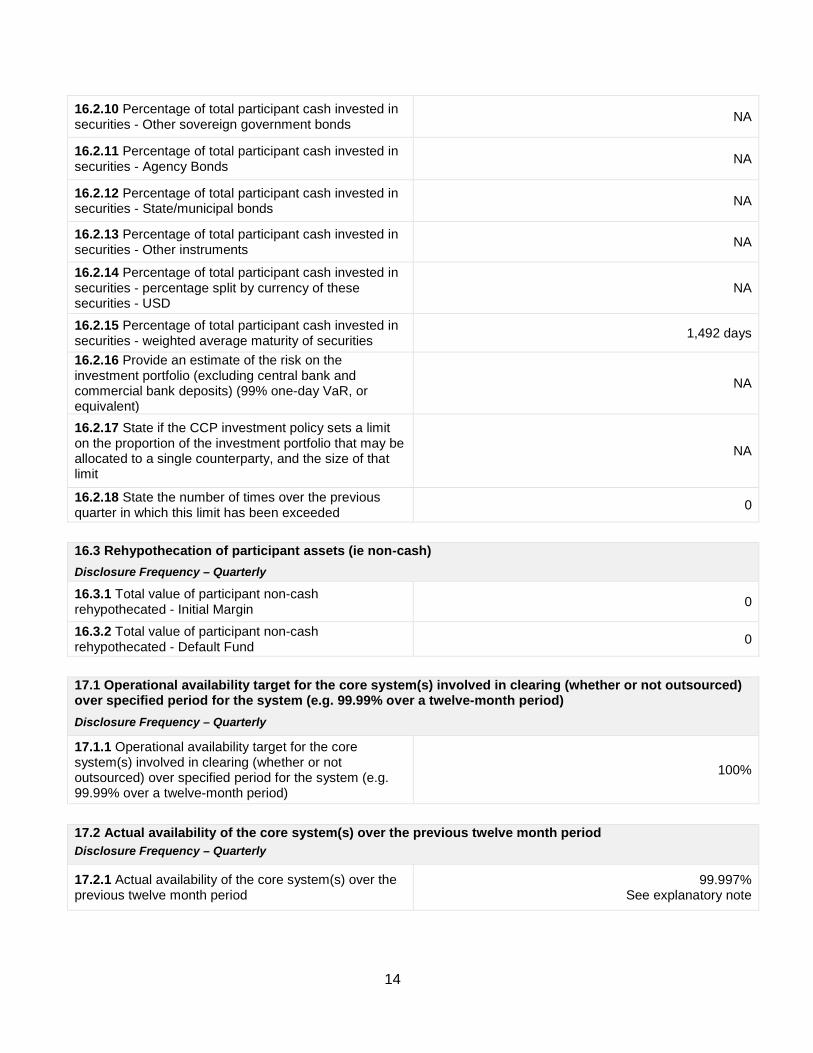
16.2.10 Percentage of total participant cash invested in securities - Other sovereign government bonds NA
16.2.11 Percentage of total participant cash invested in securities - Agency Bonds NA
16.2.12 Percentage of total participant cash invested in securities - State/municipal bonds NA
16.2.13 Percentage of total participant cash invested in securities - Other instruments NA
16.2.14 Percentage of total participant cash invested in securities - percentage split by currency of these securities - USD
NA
16.2.15 Percentage of total participant cash invested in securities - weighted average maturity of securities 1,492 days
16.2.16 Provide an estimate of the risk on the investment portfolio (excluding central bank and commercial bank deposits) (99% one-day VaR, or equivalent)
NA
16.2.17 State if the CCP investment policy sets a limit on the proportion of the investment portfolio that may be allocated to a single counterparty, and the size of that limit
NA
16.2.18 State the number of times over the previous quarter in which this limit has been exceeded 0
16.3 Rehypothecation of participant assets (ie non-cash) Disclosure Frequency – Quarterly 16.3.1 Total value of participant non-cash rehypothecated - Initial Margin 0
16.3.2 Total value of participant non-cash rehypothecated - Default Fund 0
17.1 Operational availability target for the core system(s) involved in clearing (whether or not outsourced) over specified period for the system (e.g. 99.99% over a twelve-month period) Disclosure Frequency – Quarterly
17.1.1 Operational availability target for the core system(s) involved in clearing (whether or not outsourced) over specified period for the system (e.g. 99.99% over a twelve-month period)
100%
17.2 Actual availability of the core system(s) over the previous twelve month period Disclosure Frequency – Quarterly
17.2.1 Actual availability of the core system(s) over the previous twelve month period
99.997% See explanatory note
15
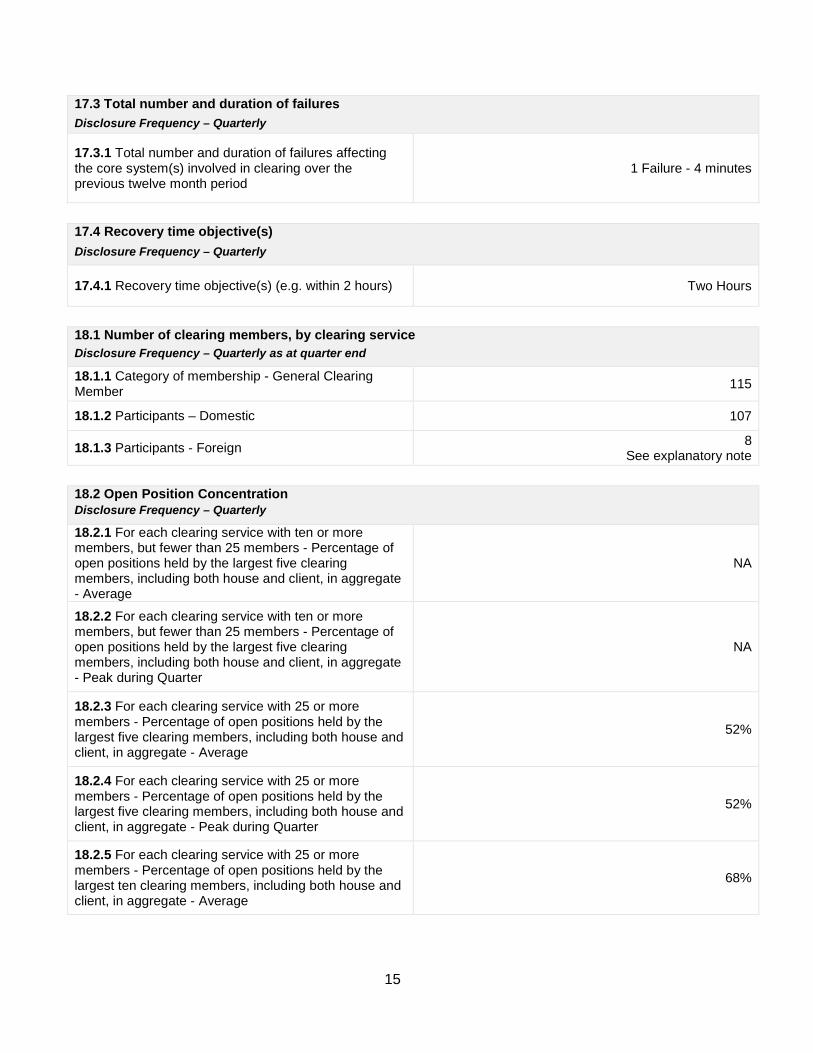
17.3 Total number and duration of failures Disclosure Frequency – Quarterly
17.3.1 Total number and duration of failures affecting the core system(s) involved in clearing over the previous twelve month period
1 Failure - 4 minutes
17.4 Recovery time objective(s) Disclosure Frequency – Quarterly
17.4.1 Recovery time objective(s) (e.g. within 2 hours) Two Hours
18.1 Number of clearing members, by clearing service Disclosure Frequency – Quarterly as at quarter end
18.1.1 Category of membership - General Clearing Member 115
18.1.2 Participants – Domestic 107
18.1.3 Participants - Foreign 8 See explanatory note
18.2 Open Position Concentration Disclosure Frequency – Quarterly
18.2.1 For each clearing service with ten or more members, but fewer than 25 members - Percentage of open positions held by the largest five clearing members, including both house and client, in aggregate - Average
NA
18.2.2 For each clearing service with ten or more members, but fewer than 25 members - Percentage of open positions held by the largest five clearing members, including both house and client, in aggregate - Peak during Quarter
NA
18.2.3 For each clearing service with 25 or more members - Percentage of open positions held by the largest five clearing members, including both house and client, in aggregate - Average
52%
18.2.4 For each clearing service with 25 or more members - Percentage of open positions held by the largest five clearing members, including both house and client, in aggregate - Peak during Quarter
52%
18.2.5 For each clearing service with 25 or more members - Percentage of open positions held by the largest ten clearing members, including both house and client, in aggregate - Average
68%
16
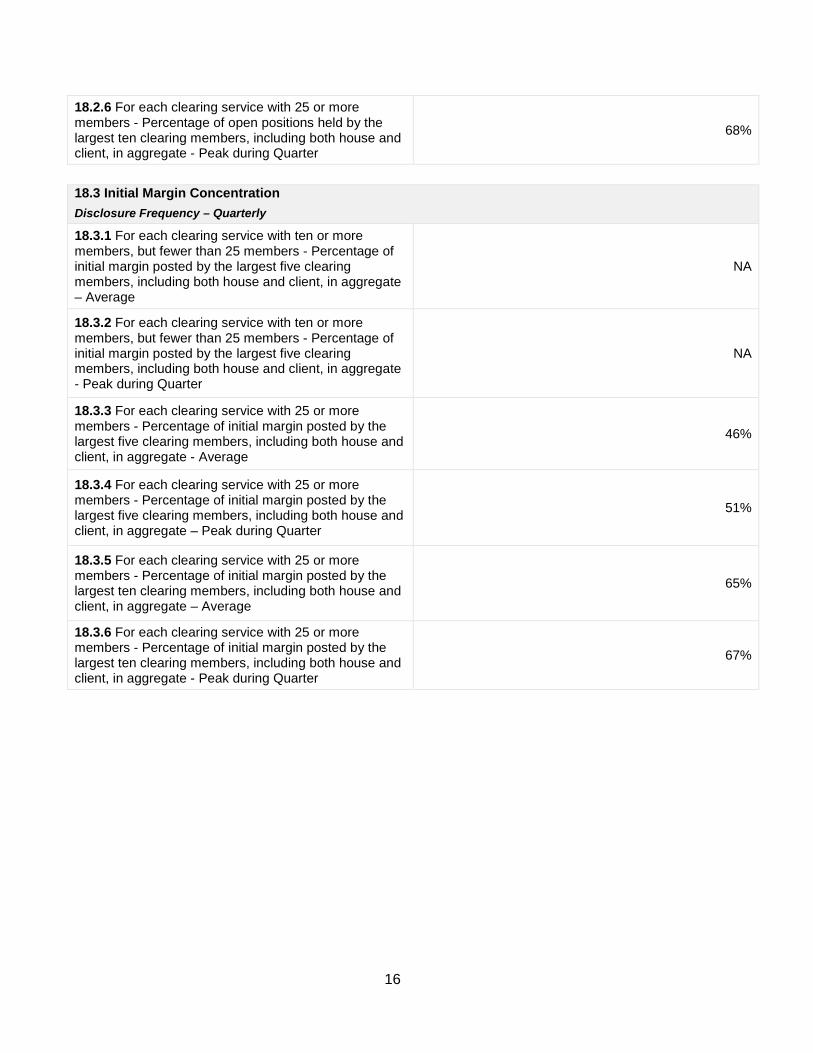
18.2.6 For each clearing service with 25 or more members - Percentage of open positions held by the largest ten clearing members, including both house and client, in aggregate - Peak during Quarter
68%
18.3 Initial Margin Concentration Disclosure Frequency – Quarterly 18.3.1 For each clearing service with ten or more members, but fewer than 25 members - Percentage of initial margin posted by the largest five clearing members, including both house and client, in aggregate – Average
NA
18.3.2 For each clearing service with ten or more members, but fewer than 25 members - Percentage of initial margin posted by the largest five clearing members, including both house and client, in aggregate - Peak during Quarter
NA
18.3.3 For each clearing service with 25 or more members - Percentage of initial margin posted by the largest five clearing members, including both house and client, in aggregate - Average
46%
18.3.4 For each clearing service with 25 or more members - Percentage of initial margin posted by the largest five clearing members, including both house and client, in aggregate – Peak during Quarter
51%
18.3.5 For each clearing service with 25 or more members - Percentage of initial margin posted by the largest ten clearing members, including both house and client, in aggregate – Average
65%
18.3.6 For each clearing service with 25 or more members - Percentage of initial margin posted by the largest ten clearing members, including both house and client, in aggregate - Peak during Quarter
67%
17
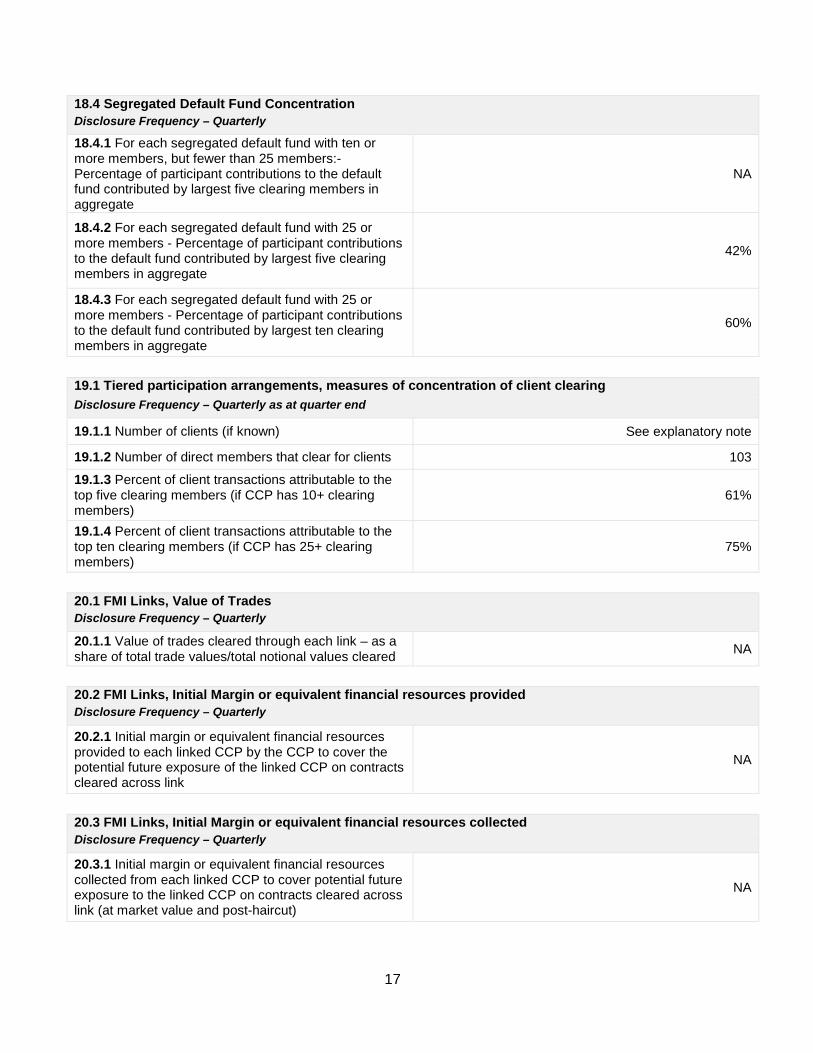
18.4 Segregated Default Fund Concentration Disclosure Frequency – Quarterly
18.4.1 For each segregated default fund with ten or more members, but fewer than 25 members:- Percentage of participant contributions to the default fund contributed by largest five clearing members in aggregate
NA
18.4.2 For each segregated default fund with 25 or more members - Percentage of participant contributions to the default fund contributed by largest five clearing members in aggregate
42%
18.4.3 For each segregated default fund with 25 or more members - Percentage of participant contributions to the default fund contributed by largest ten clearing members in aggregate
60%
19.1 Tiered participation arrangements, measures of concentration of client clearing Disclosure Frequency – Quarterly as at quarter end
19.1.1 Number of clients (if known) See explanatory note
19.1.2 Number of direct members that clear for clients 103
19.1.3 Percent of client transactions attributable to the top five clearing members (if CCP has 10+ clearing members)
61%
19.1.4 Percent of client transactions attributable to the top ten clearing members (if CCP has 25+ clearing members)
75%
20.1 FMI Links, Value of Trades Disclosure Frequency – Quarterly
20.1.1 Value of trades cleared through each link – as a share of total trade values/total notional values cleared NA
20.2 FMI Links, Initial Margin or equivalent financial resources provided Disclosure Frequency – Quarterly
20.2.1 Initial margin or equivalent financial resources provided to each linked CCP by the CCP to cover the potential future exposure of the linked CCP on contracts cleared across link
NA
20.3 FMI Links, Initial Margin or equivalent financial resources collected Disclosure Frequency – Quarterly
20.3.1 Initial margin or equivalent financial resources collected from each linked CCP to cover potential future exposure to the linked CCP on contracts cleared across link (at market value and post-haircut)
NA
18
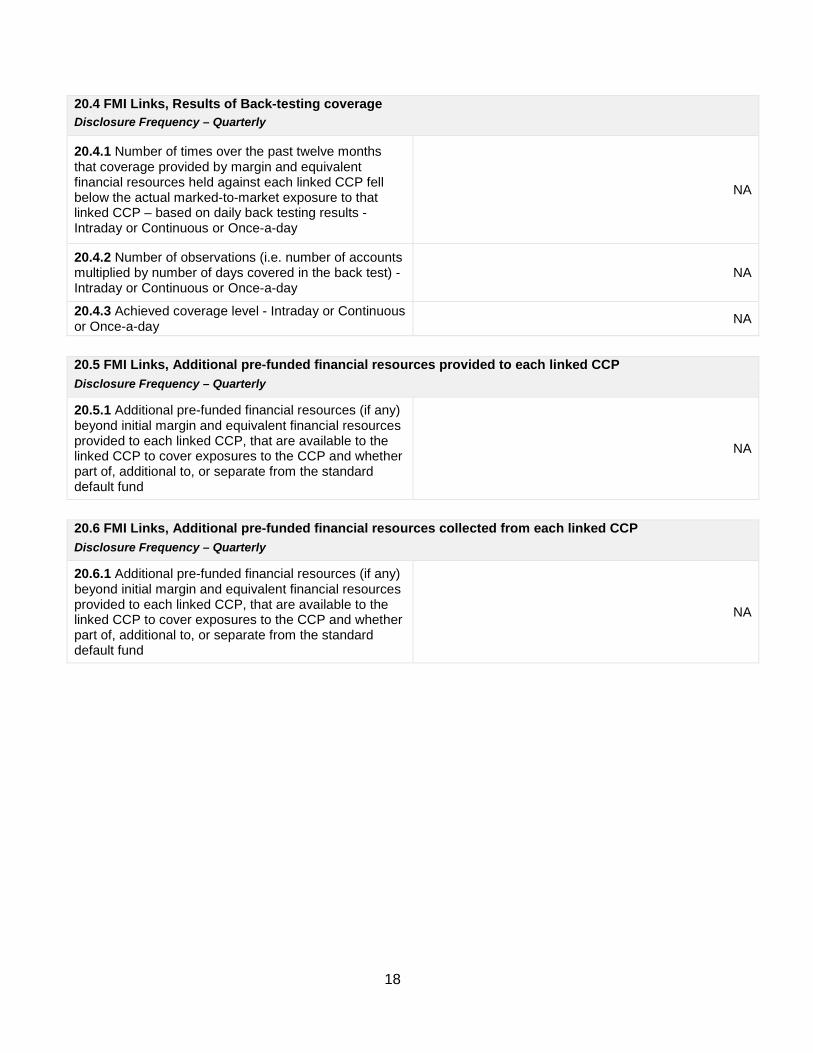
20.4 FMI Links, Results of Back-testing coverage Disclosure Frequency – Quarterly
20.4.1 Number of times over the past twelve months that coverage provided by margin and equivalent financial resources held against each linked CCP fell below the actual marked-to-market exposure to that linked CCP – based on daily back testing results - Intraday or Continuous or Once-a-day
NA
20.4.2 Number of observations (i.e. number of accounts multiplied by number of days covered in the back test) - Intraday or Continuous or Once-a-day
NA
20.4.3 Achieved coverage level - Intraday or Continuous or Once-a-day NA
20.5 FMI Links, Additional pre-funded financial resources provided to each linked CCP Disclosure Frequency – Quarterly
20.5.1 Additional pre-funded financial resources (if any) beyond initial margin and equivalent financial resources provided to each linked CCP, that are available to the linked CCP to cover exposures to the CCP and whether part of, additional to, or separate from the standard default fund
NA
20.6 FMI Links, Additional pre-funded financial resources collected from each linked CCP Disclosure Frequency – Quarterly
20.6.1 Additional pre-funded financial resources (if any) beyond initial margin and equivalent financial resources provided to each linked CCP, that are available to the linked CCP to cover exposures to the CCP and whether part of, additional to, or separate from the standard default fund
NA
19
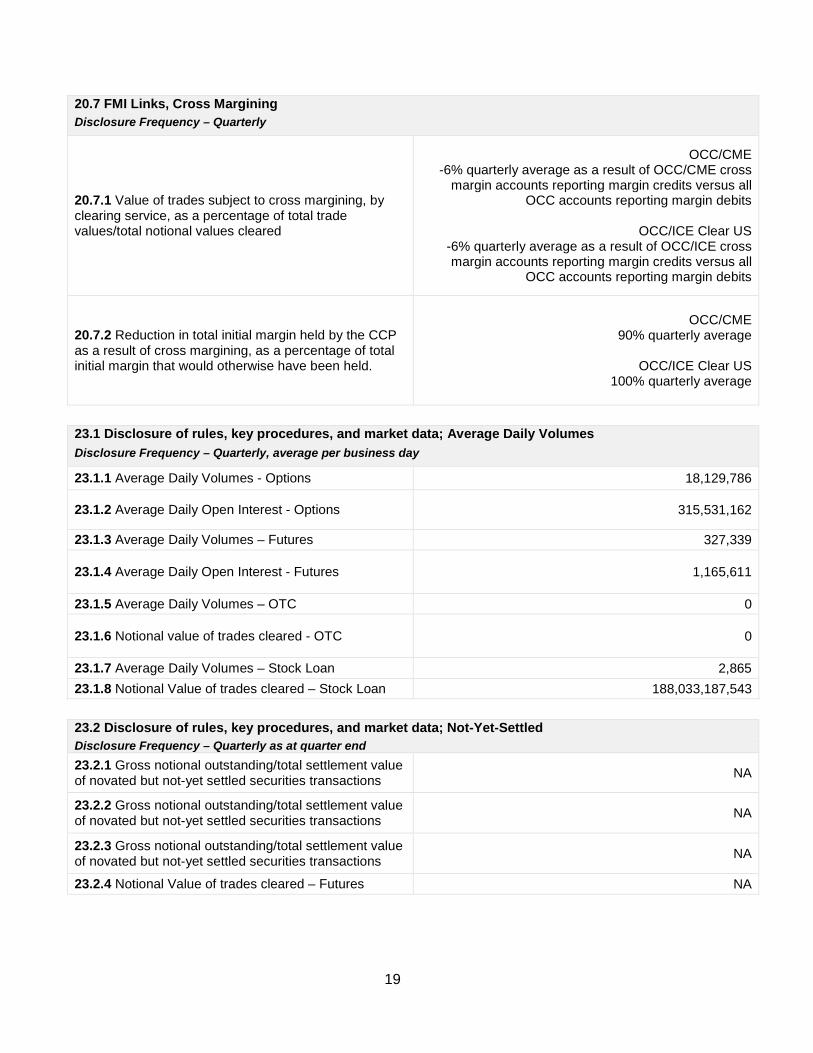
20.7 FMI Links, Cross Margining Disclosure Frequency – Quarterly
20.7.1 Value of trades subject to cross margining, by clearing service, as a percentage of total trade values/total notional values cleared
OCC/CME -6% quarterly average as a result of OCC/CME cross
margin accounts reporting margin credits versus all OCC accounts reporting margin debits
OCC/ICE Clear US
-6% quarterly average as a result of OCC/ICE cross margin accounts reporting margin credits versus all
OCC accounts reporting margin debits
20.7.2 Reduction in total initial margin held by the CCP as a result of cross margining, as a percentage of total initial margin that would otherwise have been held.
OCC/CME 90% quarterly average
OCC/ICE Clear US
100% quarterly average
23.1 Disclosure of rules, key procedures, and market data; Average Daily Volumes Disclosure Frequency – Quarterly, average per business day
23.1.1 Average Daily Volumes - Options 18,129,786
23.1.2 Average Daily Open Interest - Options 315,531,162
23.1.3 Average Daily Volumes – Futures 327,339
23.1.4 Average Daily Open Interest - Futures 1,165,611
23.1.5 Average Daily Volumes – OTC 0
23.1.6 Notional value of trades cleared - OTC 0
23.1.7 Average Daily Volumes – Stock Loan 2,865 23.1.8 Notional Value of trades cleared – Stock Loan 188,033,187,543
23.2 Disclosure of rules, key procedures, and market data; Not-Yet-Settled Disclosure Frequency – Quarterly as at quarter end 23.2.1 Gross notional outstanding/total settlement value of novated but not-yet settled securities transactions NA
23.2.2 Gross notional outstanding/total settlement value of novated but not-yet settled securities transactions NA
23.2.3 Gross notional outstanding/total settlement value of novated but not-yet settled securities transactions NA
23.2.4 Notional Value of trades cleared – Futures NA
20
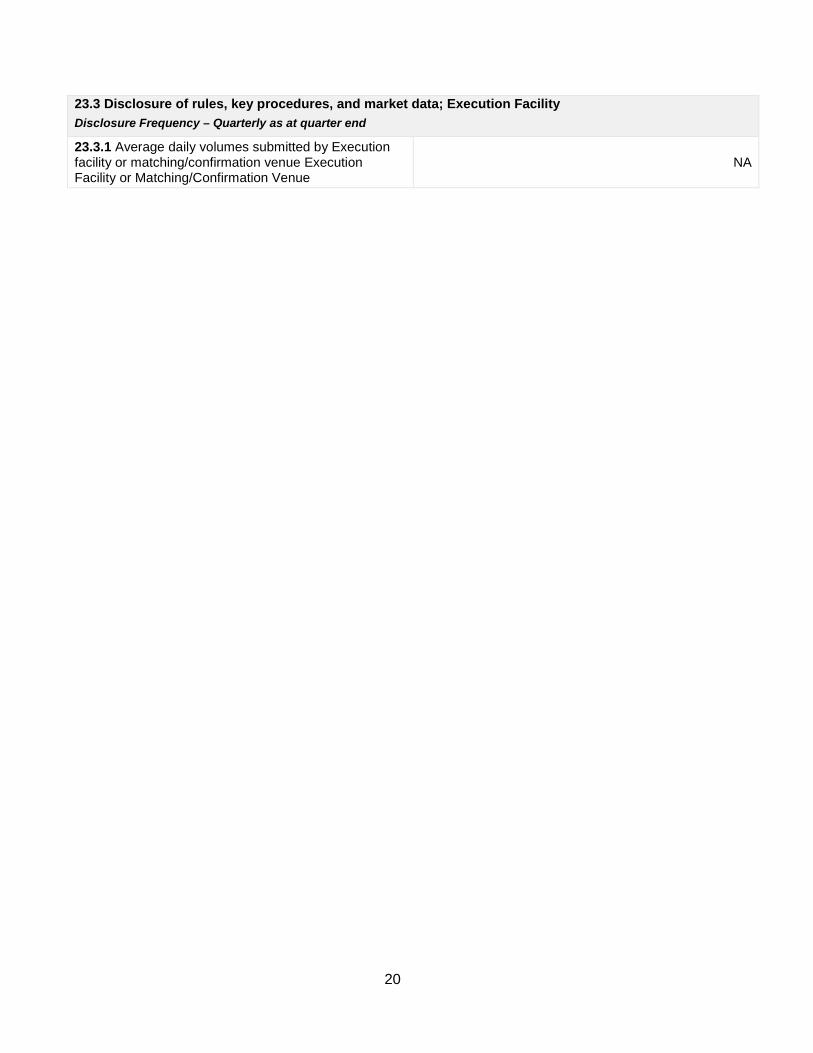
23.3 Disclosure of rules, key procedures, and market data; Execution Facility Disclosure Frequency – Quarterly as at quarter end
23.3.1 Average daily volumes submitted by Execution facility or matching/confirmation venue Execution Facility or Matching/Confirmation Venue
NA
21
Explanatory notes to accompany the quantitative disclosure
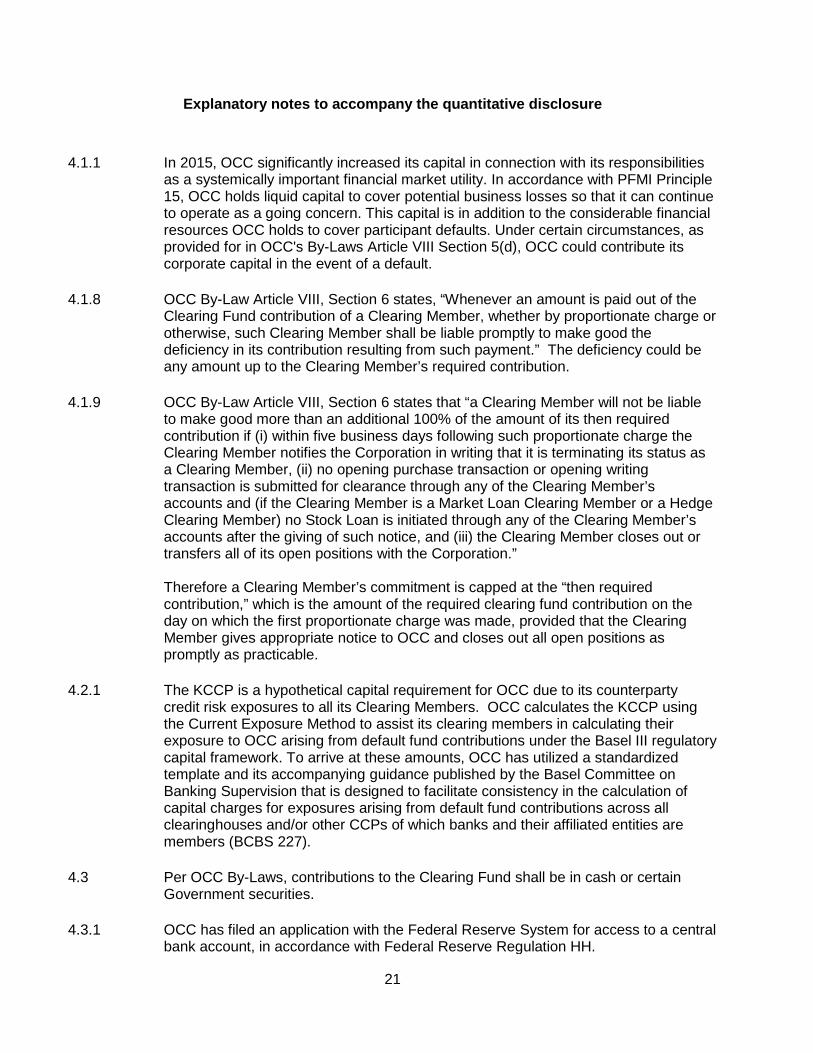
4.1.1 In 2015, OCC significantly increased its capital in connection with its responsibilities as a systemically important financial market utility. In accordance with PFMI Principle 15, OCC holds liquid capital to cover potential business losses so that it can continue to operate as a going concern. This capital is in addition to the considerable financial resources OCC holds to cover participant defaults. Under certain circumstances, as provided for in OCC's By-Laws Article VIII Section 5(d), OCC could contribute its corporate capital in the event of a default.
4.1.8 OCC By-Law Article VIII, Section 6 states, “Whenever an amount is paid out of the Clearing Fund contribution of a Clearing Member, whether by proportionate charge or otherwise, such Clearing Member shall be liable promptly to make good the deficiency in its contribution resulting from such payment.” The deficiency could be any amount up to the Clearing Member’s required contribution.
4.1.9 OCC By-Law Article VIII, Section 6 states that “a Clearing Member will not be liable to make good more than an additional 100% of the amount of its then required contribution if (i) within five business days following such proportionate charge the Clearing Member notifies the Corporation in writing that it is terminating its status as a Clearing Member, (ii) no opening purchase transaction or opening writing transaction is submitted for clearance through any of the Clearing Member’s accounts and (if the Clearing Member is a Market Loan Clearing Member or a Hedge Clearing Member) no Stock Loan is initiated through any of the Clearing Member’s accounts after the giving of such notice, and (iii) the Clearing Member closes out or transfers all of its open positions with the Corporation.” Therefore a Clearing Member’s commitment is capped at the “then required contribution,” which is the amount of the required clearing fund contribution on the day on which the first proportionate charge was made, provided that the Clearing Member gives appropriate notice to OCC and closes out all open positions as promptly as practicable.
4.2.1 The KCCP is a hypothetical capital requirement for OCC due to its counterparty credit risk exposures to all its Clearing Members. OCC calculates the KCCP using the Current Exposure Method to assist its clearing members in calculating their exposure to OCC arising from default fund contributions under the Basel III regulatory capital framework. To arrive at these amounts, OCC has utilized a standardized template and its accompanying guidance published by the Basel Committee on Banking Supervision that is designed to facilitate consistency in the calculation of capital charges for exposures arising from default fund contributions across all clearinghouses and/or other CCPs of which banks and their affiliated entities are members (BCBS 227).
4.3 Per OCC By-Laws, contributions to the Clearing Fund shall be in cash or certain Government securities.
4.3.1 OCC has filed an application with the Federal Reserve System for access to a central bank account, in accordance with Federal Reserve Regulation HH.
22
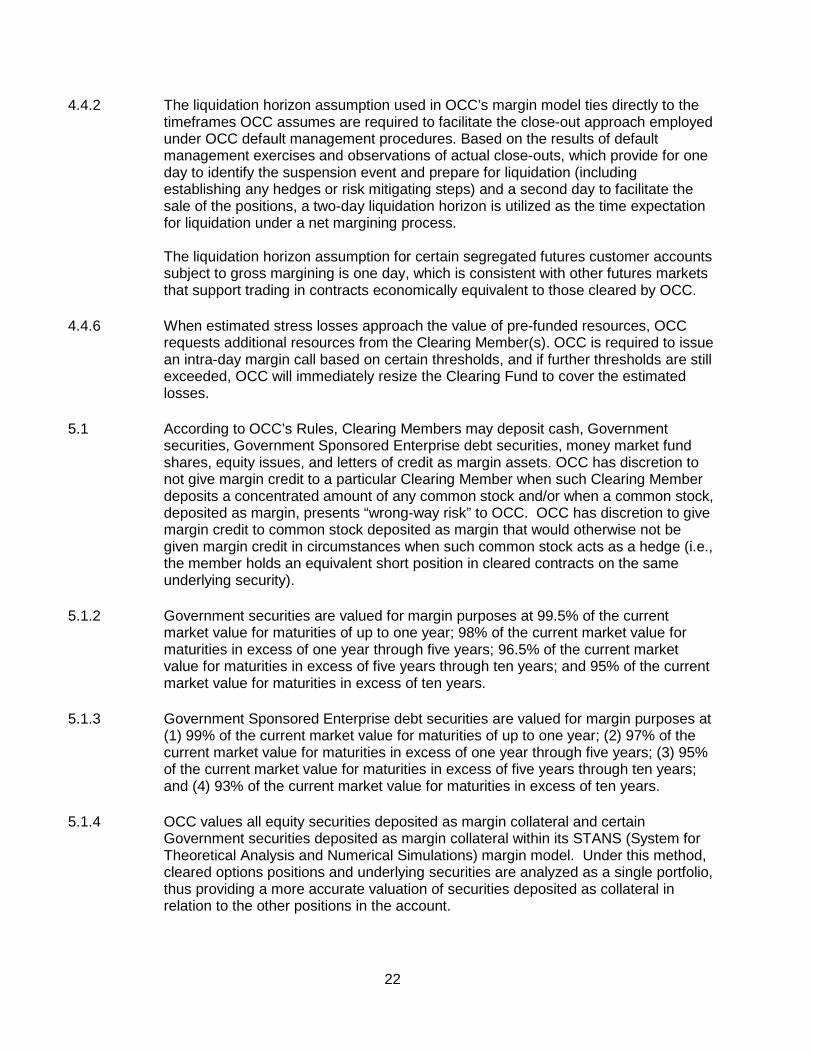
4.4.2 The liquidation horizon assumption used in OCC’s margin model ties directly to the timeframes OCC assumes are required to facilitate the close-out approach employed under OCC default management procedures. Based on the results of default management exercises and observations of actual close-outs, which provide for one day to identify the suspension event and prepare for liquidation (including establishing any hedges or risk mitigating steps) and a second day to facilitate the sale of the positions, a two-day liquidation horizon is utilized as the time expectation for liquidation under a net margining process. The liquidation horizon assumption for certain segregated futures customer accounts subject to gross margining is one day, which is consistent with other futures markets that support trading in contracts economically equivalent to those cleared by OCC.
4.4.6 When estimated stress losses approach the value of pre-funded resources, OCC requests additional resources from the Clearing Member(s). OCC is required to issue an intra-day margin call based on certain thresholds, and if further thresholds are still exceeded, OCC will immediately resize the Clearing Fund to cover the estimated losses.
5.1 According to OCC’s Rules, Clearing Members may deposit cash, Government securities, Government Sponsored Enterprise debt securities, money market fund shares, equity issues, and letters of credit as margin assets. OCC has discretion to not give margin credit to a particular Clearing Member when such Clearing Member deposits a concentrated amount of any common stock and/or when a common stock, deposited as margin, presents “wrong-way risk” to OCC. OCC has discretion to give margin credit to common stock deposited as margin that would otherwise not be given margin credit in circumstances when such common stock acts as a hedge (i.e., the member holds an equivalent short position in cleared contracts on the same underlying security).
5.1.2 Government securities are valued for margin purposes at 99.5% of the current market value for maturities of up to one year; 98% of the current market value for maturities in excess of one year through five years; 96.5% of the current market value for maturities in excess of five years through ten years; and 95% of the current market value for maturities in excess of ten years.
5.1.3 Government Sponsored Enterprise debt securities are valued for margin purposes at (1) 99% of the current market value for maturities of up to one year; (2) 97% of the current market value for maturities in excess of one year through five years; (3) 95% of the current market value for maturities in excess of five years through ten years; and (4) 93% of the current market value for maturities in excess of ten years.
5.1.4 OCC values all equity securities deposited as margin collateral and certain Government securities deposited as margin collateral within its STANS (System for Theoretical Analysis and Numerical Simulations) margin model. Under this method, cleared options positions and underlying securities are analyzed as a single portfolio, thus providing a more accurate valuation of securities deposited as collateral in relation to the other positions in the account.
23
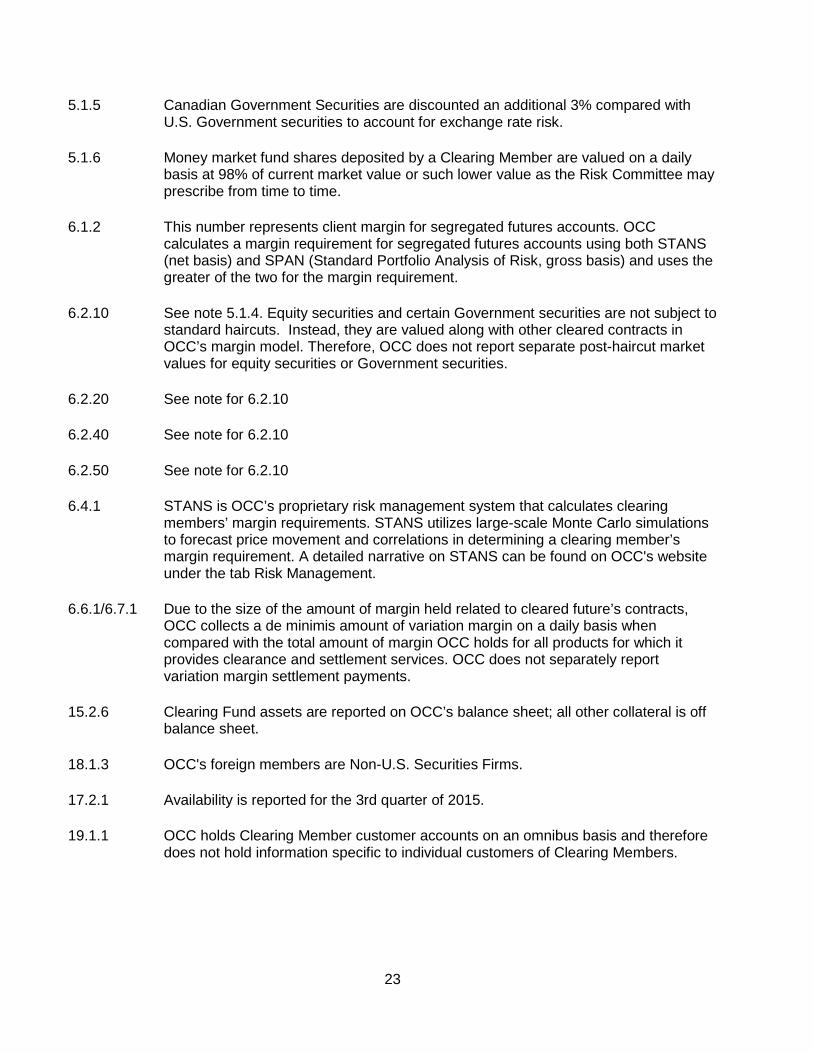
5.1.5 Canadian Government Securities are discounted an additional 3% compared with U.S. Government securities to account for exchange rate risk.
5.1.6 Money market fund shares deposited by a Clearing Member are valued on a daily basis at 98% of current market value or such lower value as the Risk Committee may prescribe from time to time.
6.1.2 This number represents client margin for segregated futures accounts. OCC calculates a margin requirement for segregated futures accounts using both STANS (net basis) and SPAN (Standard Portfolio Analysis of Risk, gross basis) and uses the greater of the two for the margin requirement.
6.2.10 See note 5.1.4. Equity securities and certain Government securities are not subject to standard haircuts. Instead, they are valued along with other cleared contracts in OCC’s margin model. Therefore, OCC does not report separate post-haircut market values for equity securities or Government securities.
6.2.20 See note for 6.2.10
6.2.40 See note for 6.2.10
6.2.50 See note for 6.2.10
6.4.1 STANS is OCC’s proprietary risk management system that calculates clearing members’ margin requirements. STANS utilizes large-scale Monte Carlo simulations to forecast price movement and correlations in determining a clearing member’s margin requirement. A detailed narrative on STANS can be found on OCC's website under the tab Risk Management.
6.6.1/6.7.1 Due to the size of the amount of margin held related to cleared future’s contracts, OCC collects a de minimis amount of variation margin on a daily basis when compared with the total amount of margin OCC holds for all products for which it provides clearance and settlement services. OCC does not separately report variation margin settlement payments.
15.2.6 Clearing Fund assets are reported on OCC’s balance sheet; all other collateral is off balance sheet.
18.1.3 OCC's foreign members are Non-U.S. Securities Firms.
17.2.1 Availability is reported for the 3rd quarter of 2015.
19.1.1 OCC holds Clearing Member customer accounts on an omnibus basis and therefore does not hold information specific to individual customers of Clearing Members.