PFM CAPABILITIES ASSESSMENT REPORT SERIES NO. 2
44
Instuonal and personnel capabilies for fiscal decentralisaon in Benin PFM CAPABILITIES ASSESSMENT REPORT SERIES NO. 2
Transcript of PFM CAPABILITIES ASSESSMENT REPORT SERIES NO. 2

Institutional and personnel capabilities for fiscal
decentralisation in Benin
PFM CAPABILITIESASSESSMENT REPORT SERIESNO. 2

2 PFM CAPABILITIES ASSESMENT REPORT SERIES / NO. 2
ContentsTables and figures .........................................................................................................................................................................................3
Acronyms and abbreviations ........................................................................................................................................................................3
Executive summary .................................................................................................................................................................................4
1 Background ....................................................................................................................................................................................6Economic context ............................................................................................................................................................................6Decentralisation framework ...........................................................................................................................................................6Implementation and challenges of decentralisation reform ..........................................................................................................7
2 Institutional capabilities .................................................................................................................................................................92.1 Revenue forecasting and mobilisation .....................................................................................................................................92.2 Expenditure planning .............................................................................................................................................................112.3 Budget execution and efficiency ............................................................................................................................................122.4 Procurement and cash management ......................................................................................................................................122.5 Accountability mechanisms ...................................................................................................................................................142.6 Intergovernmental fiscal relations .........................................................................................................................................14
3 Personnel capabilities ...................................................................................................................................................................16
4 Reform ecosystem .......................................................................................................................................................................22
5 Capabilities for fiscal decentralisation: Discussion of key results ................................................................................................27Delivery capabilities ......................................................................................................................................................................27Regulatory capabilities .................................................................................................................................................................27Co-ordinative capabilities .............................................................................................................................................................28Analytical capabilities....................................................................................................................................................................28
6 Conclusion ...................................................................................................................................................................................29
References ..................................................................................................................................................................................................30
Appendix 1: Methodology ..........................................................................................................................................................................31
Appendix 2: Distribution of operating and investment allocations and conditions for granting FADeC transfers
from the state to municipalities ..................................................................................................................................................................34
Appendix 3: List of central government directorates, prefectures and municipalities included in the personnel survey ........................ 35
Appendix 4: Personnel questionnaire ........................................................................................................................................................36
AcknowledgementsThis report was written by Dr Biniam Bedasso from the CABRI Secretariat. The fieldwork and validation were conducted by Yacine Bio-Tchane. Comments were provided by Dr Philipp Krause, Prof. Christian Schuster and Awab Elmesbah. CABRI extends its gratitude to the team of officials from the Ministry of Economy and Finance who helped facilitate the review from its inception as well as to all key informants and survey respondents for their participation in the study. The CABRI Secretariat also expresses its gratitude to the Bill & Melinda Gates Foundation for their invaluable support.
‘Bill & Melinda Gates Foundation’ is a registered trademark of the Bill & Melinda Gates Foundation in the United States and is used with permission.

Institutional and personnel capabilities for fiscal decentralisation in Benin 3
Tables and figures
Table 1: Key economic indicators .................................................................................................................................................6Table 2: PEFA assessment on intergovernmental budgetary relations ........................................................................................8Table 3: Forecasted and actual budget revenue in sample municipalities (millions CFAF) .......................................................10Table 4: Rates of execution of municipal budget expenditures in sample municipalities .........................................................13Table 5: Summary characteristics of the sample officials ..........................................................................................................16Table 6: Dimensions of personnel capabilities ..........................................................................................................................17Table 7: Predictors of potential turnover (ordered logit estimates) .........................................................................................19Table A1: Sample municipalities ...................................................................................................................................................33
Figure 1 : Distribution of years of experience in the sample .......................................................................................................17Figure 2: Distribution of sample officials across central government and local government institutions .................................18Figure 3: Personnel motivation and associated indicators ..........................................................................................................19Figure 4: Potential turnover reasons and destinations ................................................................................................................20Figure 5: Share of officials believing that skills mismatch has affected their unit’s performance .............................................21Figure 6: Length of time worked with supervisors and horizontal colleagues ............................................................................21Figure 7: Origins of new ideas/practices ......................................................................................................................................22Figure 8: Sequencing of reforms ..................................................................................................................................................23Figure 9: Engaging other units in reform activities ......................................................................................................................24Figure 10: Main drivers of improved performance ........................................................................................................................25Figure 11: Means to transfer past reform lessons .........................................................................................................................26Figure A1: Map of sample municipalities .......................................................................................................................................32
Acronyms and abbreviations
CABRI Collaborative Africa Budget Reform Initiative
CONAFIL National Commission of Local Finance
CSO civil society organisation
FADeC Municipal Development Support Fund
PAG Government Action Plan
PDC communal development plan
PEFA Public Expenditure and Financial Accountability
PFM public financial management
MDAs ministries, departments and agencies
WAEMU West African Economic and Monetary Union
WASH water, sanitation and hygiene

4 PFM CAPABILITIES ASSESMENT REPORT SERIES / NO. 2
Executive summary
1 The concept of budget credibility, as it is operationalised in this assessment, is adopted from Andrews et al. (2014). Accordingly, budget credibility is defined as maintaining comprehensive and regular budgets that give a binding expression to government public finance priorities and plans, actual revenue policies and collection performance that reflect proposals and forecasts, and actual spending that reflects budgeted promises (in aggregate and in detailed allocations).
2 Samson and Houessou (2018).3 Bardhan (2002).4 The conceptualisation of state capability in this report is anchored in the typology of capability formulated in Lodge and Wegrich (2014): analytical
capacity, delivery capacity, co-ordinative capacity and regulatory capacity. This framework has already been applied to analyse the capabilities of finance ministries in Krause et al (2016) and CABRI (2017).
This report aims to take stock of the institutional and human-resources capabilities necessary for the implementation of fiscal decentralisation in Benin. The report originates from the central government’s concern regarding the revenue mobilisation and budget execution capabilities of municipalities. As such, the capabilities review complements the practical work a team from the Ministry of Economy and Finance has been conducting on improving revenue mobilisation and budget execution in municipalities with the support of CABRI. Building on preliminary consultations with country officials to identify core issues of public financial management (PFM) in the context of fiscal decentralisation in Benin, the following dimensions of a functional PFM system were selected for review: budget credibility,1 reliable and efficient budget execution and institutionalised accountability. Moreover, considering that knowledge is arguably the most important input for carrying out PFM functions in a decentralised system, human-resources capabilities were identified as a standalone component of the review.
Decentralisation has been one of the centrepieces of governance reforms in many developing countries over the past few decades. Specifically, fiscal decentralisation is a key element of the overall devolution of power to subnational government units. Benin has undertaken one of the most rigorous decentralisation reforms on the African continent. Local government in Benin is a critical component of the democratic process as well as the effort to promote sustainable development. However, a recent study by Afrobarometer concludes that ‘popular assessments of local government performance are largely negative and have worsened over time’.2 Part of the reason for this negative outlook could be the lack of sufficient capabilities to implement decentralisation with sufficient effect to deliver on the promise to improve efficiency of service delivery and accountability. This is not unique to Benin, however. Weak administrative capacity at the subnational level and potential local capture are cited as two of the most salient shortcomings of decentralisation in developing countries.3
The review consists of extensive interviews with 25 key informants from municipalities, prefectures, central government ministries, departments and agencies (MDAs), civil society and the media. The qualitative interviews are accompanied by a quantitative survey of 270 public finance officials with roles related to fiscal decentralisation from nine municipalities, seven prefectures and six central government MDAs. The key findings of the review are triangulated and validated by way of a stakeholder workshop. The primary data from the qualitative and quantitative fieldwork are supplemented with desk research, setting the context for the capability review. A detailed account of the methodology used for the review is provided in Appendix 1.
The key insights from the review are summarised below.
Due to the high level of municipal revenue forecasting errors in past years, the central government is attempting to help improve budget credibility at the municipality level by introducing a uniform formula for revenue forecasting. Even if this approach is acknowledged for reining in over-optimistic forecasting, it can also be too stifling and inattentive to local differences. One source of heterogeneity is the significant diversity among municipalities in their capabilities to use data for revenue forecasting. Geographical location and seasonality of economic activities are mentioned as additional reasons why a universal formula may not be appropriate. There appears to be little collective capability for horizontal co-ordination on local tax issues between municipalities since much of this responsibility is left to the central government.4 Most municipalities rely on monetary incentives to motivate tax collection agents. However, they do not seem to have a mechanism in place to prevent significant under-collection or excessive extraction driven by monetary incentives. In the absence of significant policy space to determine tax rates, municipalities are reluctant to use the marginal room for manoeuvre to increase certain taxes for fear of reducing their competitiveness.

Institutional and personnel capabilities for fiscal decentralisation in Benin 5
On the expenditure side, there is a clear link between plan and budget, although the original plans of municipalities may sometimes seem like a wish list. When it comes to budget execution, there are significant shortfalls in the overall rate of municipal budget execution, particularly in capital expenditure. Municipalities have identified the following factors as impediments to capital expenditure planning: lack of own resources to match transfers, delays in release of information and funds from central government, and poor project planning and politicisation at the local level. The capabilities of the central government to properly time the release of transfers to municipalities can have far-reaching consequences in terms of budget execution and project completion. Most municipalities cite delays in release of funds as one of the main challenges in managing local government finances.
When it comes to procurement, although the planning process is sufficiently streamlined, municipalities report that the contracting process can be cumbersome. Internal control capabilities are not fully developed. However, the centralised regulatory capabilities of the inspector general seem to have compensated for the sparse capabilities at the municipal level for internal control. Civil society organisations (CSOs) are shown to be key stakeholders in local government budget processes, despite divergent views regarding their technical capabilities in PFM.
Municipalities report that they have sufficient human-resource capabilities for budgeting and reporting to the central government. However, their track record on the timely transmission of management accounts to the central government is not encouraging. In terms of structures linking central and local governments at the operational level, the tax administration, deconcentrated services and prefectures are cited as key institutions facilitating intergovernmental fiscal relations. However, there is no clear mechanism to deal with matters of boundary delimitation, which can result in various forms of inefficiency and inequity, as well as open dispute.
The personnel survey reveals that a majority of public finance officials responsible for decentralisation-related functions believe their colleagues in the same unit are not sufficiently motivated. However, a much higher proportion of officials
acknowledge that there is professional growth opportunity in their field and that good performance is recognised. The results also show that potential turnover is high, and experience is one of the strongest predictors of potential turnover. It is rather worrying that a significant majority of officials, particularly in local government, believe that their unit’s performance has been hampered by skills mismatch.
When it comes to the reform ecosystem, although it is encouraging that leadership of central government organisations take a lead in originating reform ideas directly for their organisations and indirectly for local government units, the staff of these organisations seem to have only a minor role to play in generating ideas. Similarly, insightful leadership is cited as the most important driver of improved performance at the central government level whereas application of best practices is deemed the key factor behind successful reform in local government.
Overall, many municipalities struggle with weak delivery capabilities as demonstrated by low rates of execution of both budget revenue and expenditures. Although structural factors such as resource endowments and market access play a role in the fiscal outcomes of municipalities, personnel capabilities which are marked by low levels of motivation and high skills mismatch, particularly at the local level, are likely to have an impact on delivery performance. But the delivery capabilities of municipalities cannot be analysed in isolation from the regulatory and coordinative capabilities of the upper tiers of government whose performance in ex-ante control and budget allocation affects the level of execution at the local level. In regard to oversight, capabilities built in central government institutions have been instrumental in ensuring accountability at the local level despite weaknesses in internal control in municipalities. Despite the established structures for vertical coordination of intergovernmental fiscal relations, the horizontal relationship between municipalities appears to suffer from a dearth of collective coordinative capabilities. Finally, the central government is using its comparative advantage in independent analysis to compensate for the gaps in analytical capabilities of local governments in revenue forecasting.

6 PFM CAPABILITIES ASSESMENT REPORT SERIES / NO. 2
1 Background
Economic contextA member of the West African Economic and Monetary Union (WAEMU), Benin is a nation of 11 million inhabitants with a decades-long reputation for being a peaceful and stable democracy despite sporadic instability in recent years. Benin’s economy is strongly dependent on re-export and transit trade (with Nigeria), agriculture and services. The country has been growing at an average rate of 4.87 percent with inflation contained at an average of 0.22 percent between 2015 and 2019. However, poverty remains high and is on an upward trend reaching 40.1 percent as of 2015.
In 2016, the government at the time designed an ambitious five-year development programme to stimulate growth and improve the populations’ living conditions: the Government’s Action Plan (Programme d’Action du Gouvernement – PAG). The PAG is structured around 45 key projects in the following priority sectors: tourism, agriculture, infrastructure, digital economy, energy, environment, WASH (water, sanitation and hygiene) and social protection. Its total cost is estimated at CFAF9 039 billion, and it is expected be financed up to 61 percent by the private sector. Benin’s public debt remains stable with debt-to-GDP ratio of 54.4. percent as of 2017.
Decentralisation frameworkBenin has a relatively long and extensive experience with fiscal decentralisation. Through the adoption of Act No. 97-028 of 15 January 1999, decentralised territorial authorities with legal personality, capacity for decision-making and financial autonomy were established within the structure of the territorial administration of the Republic of Benin.
Benin currently has 77 local authorities called communes (henceforth municipalities), administered by organs composed of local elected officials. The cities of Porto Novo, Cotonou and Parakou, considering the size of their population, surface area and resources, are established as municipalities with special status by Act No. 98-005 of 15 January 1999 on the organisation of municipalities with special status. Each municipality is divided into districts and each district is divided into city or village districts.
Following the deepening of decentralisation, several reforms have been introduced in the legislature including a revision of the Constitution. Key reforms that are relevant for fiscal decentralisation include the territorial subdivision that occurred in 2016, changing the number of prefectures (departments) from 6 to 12, the progressive introduction of a single window for all payments (Guichet unique) in municipalities, and experimentation with the outsourcing of resource mobilisation (Régie autonome) within the municipality.
Act No. 98-007 of 15 January 1999 on the financial regime of municipalities in the Republic of Benin defines the provisions relating to municipal revenues and expenditures as well as the content and modalities for the preparation, adoption, execution and control of local authorities’ budgets. As such, municipalities’ budgets are approved by a vote from the municipal council, and by supervisory authority (the prefecture). Municipalities’ resources come from local taxes, taxes shared between the central state and local authorities, service charges, allocations and subsidies from the central state to municipalities, and donations and bequests from third parties (own resources).
Table 1: Key economic indicators
Average 2015–2019 or most recent year
GDP growth 4.87 2015–19 average
GDP per capita (constant 2010 US$) 1180.36 2019
Poverty headcount 40.1 2015
Inflation 0.22 2015–19 average
Debt to GDP ratio 54.4 2017
Source: World Development Indicators

Institutional and personnel capabilities for fiscal decentralisation in Benin 7
Implementation and challenges of decentralisation reform After a first phase of implementation, during which municipalities did not have the necessary financial resources to exercise the powers transferred to them, the situation changed with the establishment of the Municipal Development Support Fund (FADeC) in 2008. With significant contributions from the central state and technical and financial partners, FADeC is a national financing mechanism for the transfer of resources to municipalities, and contributes to the financing of both operating and capital expenditures.
FADeC funds are allocated to municipalities each year through the National Commission of Local Finance (CONAFIL), which includes representatives of the Ministry of Decentralisation and Local Government, the Ministry of Economy and Finance, and the mayors. CONAFIL allocates operating funds on the basis of the amounts of the three subsidies granted to municipalities up to 2007 (the wage subsidies, the balancing subsidies and the subsidy for the civic tax replacement), which are replaced by the Operating FADeC. In general, due to the composition of CONAFIL, the distribution of the operating subsidy to municipalities is relatively transparent, but is not based on well-defined objective criteria. The transfers of capital funds allocated by the central state to municipalities are of two kinds: an unallocated capital grant, which is included in the budget of the Ministry of Decentralisation and Local Government and is distributed by CONAFIL among the municipalities on the basis of set criteria, and an allocated investment grant, which is included in the budgets of and distributed by the relevant sectoral ministries, namely education, health, energy and water, and agriculture. The criteria for distribution of the allocated investment grant vary from one sectoral ministry to another, but they remain unclear. Appendix 2 presents a table summarising the distribution of operating and investment allocations and conditions for granting FADeC transfers from the central state to municipalities.
5 2017 FADeC management audit.6 This is when transfers fell from 42.05 million to 23.34 million, probably due to disruption in transfer schedules as a result of the supplementary
budget introduced by the new government in May 2016.7 CONAFIL data8 Rapport General Du Forum Des Dix Ans De Decentralisation Au Benin, 2015 (https://decentralisation.gouv.bj/wp-content/uploads/2018/12/6.1-
FORUM-10-ANS-DE-DECENTRALISATION_RAPPORT-GENERAL.pdf).9 2017 FADeC management data /audit.
Transfers to municipalities through FADeC over the period 2014 –2017 averaged CFAF31.44 billion per year, representing 2 percent of central government budget expenditures.5 During this time, municipalities’ own resources increased from CFAF24.95 billion to CFAF29.79 billion, an increase of 19.43 percent over four fiscal years. However, these are all lower than the transfers received from the central state through the FADeC fund, except for 2016,6 when municipalities’ own revenues exceeded transfers by 14.94 percent.7 This trend is indicative of the low capacity municipalities have for mobilising own resources during a fiscal year.
According to the general report of the forum on ‘10 Years of Decentralisation in Benin’, the poor capabilities of municipalities to mobilise own revenues and the great disparities between municipalities are indicative of the inadequacy of current local taxation compared to the realities of local authorities.8 Thus, there remains an imbalance in the operating budget of several municipalities with respect to an increasing number of capital assets and associated running costs, a situation that affects the continuity of services delivery to citizens.
Carryovers of appropriations have increased over the last four years, from 10.5 billion in 2014 (2013 to 2014 carryover) to more than CFAF29 billion in 2017.9 This trend depicts low execution rates of municipal budgets. According to budget conferences for the 2015–2018 period, the average overall level of budget execution at the municipal level is 60 percent, with an execution rate of only 35 percent for capital expenditures.
Finally, the latest PEFA assessment (2014) of intergovernmental budgetary relations in Benin shows the worsening of indicators compared to two years prior (see Table 1). Benin scores an overall D, down from a slight improvement in the previous assessment in 2012.

8 PFM CAPABILITIES ASSESMENT REPORT SERIES / NO. 2
Table 2: PEFA assessment on intergovernmental budgetary relations
2007 2012 2014
Transparency of intergovernmental budgetary relations D+ C+ D+
Transparency and objectivity in the horizontal distribution of allocations between decentralised administrations C A C
Timely and reliable information to decentralised administrations on their allocations C C D
Degree of consolidation of general government budget data by sector category D D D
Extent of central government control over the budgetary situation of decentralised administrations C C D
The Municipal Development Support Fund (FADeC) is a national financing mechanism for the transfer of resources to municipalities, and contributes to the financing of both operating and capital expenditures

Institutional and personnel capabilities for fiscal decentralisation in Benin 9
2 Institutional capabilities
10 See, for example, Cirincione et al (1999).
This section provides key insights into the organisational and systemic capabilities for fiscal decentralisation and intergovernmental fiscal relations based on qualitative data collected through interviews with a series of stakeholders. The themes are organised to reflect the key issues identified by country officials through the scoping exercise. The overall objective is to sift through the qualitative data on various PFM functions in the context of fiscal decentralisation to shine a light on different dimensions of capability, namely delivery capacity, regulatory capacity, coordination capacity and analytical capacity.
2.1 Revenue forecasting and mobilisation The reliability of municipal revenue forecasting has been a notable problem facing fiscal decentralisation in Benin. On the next page, Table 3 shows data from sample municipalities for the 2017 and 2018 fiscal years. The average rate of revenue execution stands at 55.6 percent for 2017 and 53.7 percent for 2018. On top of the substantially low average rate of execution, there is significant volatility over time in the rate of execution at a municipality level. On average, the revenue performance in a municipality varies by over 13 percentage points from one year to the other in either direction. This indicates that municipalities struggle with formulating credible budgets with reliable revenue forecasts. This often emanates from the combination of a lack of analytical capacity at the municipality level and co-ordination capacity at the central government level.
It was against this backdrop CONAFIL instituted a rule requiring municipalities to use a predetermined formula to forecast their revenues. According to the rule introduced in 2018, the forecast for revenue collection in year t should be calculated as the average of revenue realisations in years t-2, t-3 and t-4 plus a 10 percent increase. The rationale behind the current rule is that it restrains municipalities from making over-optimistic forecasts based on unrealistic assumptions. This is expected to help improve overall budget credibility by making municipalities plan their annual expenditures within a realistic spending envelope. A number of municipal officials acknowledged the usefulness of this rule to encourage more prudent budget planning. They also pointed out that the standard framework implemented by the central government helps to reduce local-level political interference in revenue
forecasting. However, there is some criticism of the formula as being too stifling and deprived of sensitivity to local contexts. Municipal officials believe that the framework’s overreliance on historical realisations of revenue may end up discouraging efforts to introduce innovative changes in revenue mobilisation at the local level. Moreover, the application of a uniform formula for all municipalities seems to ignore the diversity of context across the country in terms of natural and environmental conditions, as well as the local-level cyclicality of economic activity in some areas.
Sufficient and reliable data is key to revenue forecasting and management at the local level.10 It appears that the use of a centrally stipulated formula relying on historical realisations has limited the horizon for municipalities to use data and analysis to improve revenue forecasting. For this reason, a majority of interviewed municipalities use only data from administrative accounts to conduct revenue forecasting. However, some municipalities are leveraging their existing capabilities to improve the quality of data on tax potential. For example, two of 17 interviewed municipalities are planning to set up an urban land register, while one is working towards a database of informal traders. There are significant disparities in the approaches used by municipalities to analyse tax potential. For instance, the municipality of Parakou is setting up a tax-tracking system based on GPS technology, whereas the municipality of Zè admits that they conduct little analysis due to perceived limited potential. In general, several municipalities conduct a tax census or similar study every two to five years.
Geographical factors seem to influence the ability or incentive of municipalities to analyse tax potential. For municipalities such as Djougou, limited capability relative to the size of their territories is reported to have hampered their efforts to compile data on economic activities. In Karimama, which is located on the border with Niger, porous borders make it difficult to have an accurate estimate of tax potential. Similarly, Sèmè -Kpodji is adversely affected by its location between the two biggest cities of the country which contributes to limiting the municipality’s revenue potential.
The lack of incentive for Sèmè-Kpodji to analyse revenue potential due to the alleged encroachment of neighbouring municipalities into its economic space suggests that horizontal co-ordination between municipalities can be critical. Given the free movement of people, goods and services across municipal boundaries, some municipalities might find it

10 PFM CAPABILITIES ASSESMENT REPORT SERIES / NO. 2
Table 3: Forecasted and actual budget revenue in sample municipalities (millions CFAF)
2017 2018
Municipality Forecast Actual Rate of execution
Forecast Actual Rate of execution
Abomey Calavi 6 887 3 226 0.468 6 887 4 797 0.696
Banikoara 2 493 1 778 0.713 2 561 1 723 0.673
Cotonou 19 452 13 483 0.693 23 669 16 583 0.701
Glazoué 1 368 905 0.662 1 363 534 0.392
Parakou 3 960 2 089 0.528
Sèmè-Kpodji 3 445 1 617 0.469 4 147 1 524 0.368
Aplahoué 2 422 1 162 0.480 2 372 988 0.416
Athiémé 823 420 0.510 847 446 0.526
Djougou 2 097 1 342 0.640 2 813 922 0.328
Dogbo 1 695 730 0.431
Ifangni 820 408 0.497 1 260 778 0.617
Karimama 1 151 683 0.593 1 461 686 0.470
Natitingou 1 582 763 0.483 1 598 1 151 0.720
Zè 1 236 759 0.614
Mean 0.556 0.537
Standard deviation 0.091 0.142
Source: Compiled by authors

Institutional and personnel capabilities for fiscal decentralisation in Benin 11
difficult to collect taxes on economic activity originating in their territory. Therefore, a co-ordinated approach to the assignment of tax rates and jurisdiction may be needed to ensure equitable and fair distribution of tax revenues between municipalities. A great majority of interviewed municipalities do not have any formal co-ordination arrangements with neighbouring municipalities. Consequently, much of the co-ordination is supposed to be taken care of by the central government. Two municipalities have reported that they have standing agreements to harmonise tax rates. Moreover, two municipalities have joint-operation agreements with neighbouring municipalities in respect of mining activities.
The actual mobilisation of revenue by municipalities depends crucially on the performance of individual tax collection agents. Therefore, the ability of the municipality to manage the principal-agent relationship with tax collectors is key to its overall capabilities for revenue mobilisation. A majority of interviewed municipalities employ some form of monetary incentive to motivate tax collectors to attain their targets. The most common arrangement is offering tax collectors a certain share of the revenue collected above a predetermined threshold (e.g. 80 or 90 percent of target). Alternatively, at least one municipality (Cotonou) is planning to use the above-target portion of revenue collection as a basis for providing monetary incentives. However, one municipality official commented that, in the absence of proportional incentives on all revenue collected, some tax collectors may give up easily and stop making an effort to collect more revenue when they feel that they might not reach the threshold. This may cause a problem for revenue mobilisation, particularly since most municipalities do not have a well-defined penalty for underperformance. On the flip side, municipalities do not seem to have a mechanism to prevent the monetary reward from creating perverse incentives for agents to over-extract resources from taxpayers.
To a certain extent, the capability of municipalities to mobilise revenue is a function of the policy space they have been afforded to experiment with different policy choices. In this regard, municipalities in Benin have limited discretion to set the marginal rate on a few tax types. Several respondents said that they had been careful not to overuse their discretion by raising taxes for fear of rendering their municipalities less competitive. Moreover, some municipality officials felt that the type of taxes left for their discretion are inconsequential since key taxes such as VAT are the domain of the central government.11 In addition to tax policy, the central government is reported to have influence over administrative matters related to local revenue collection, such as the operating hours of road-tax posts. Despite the limited policy space municipalities possess, some of them have come up with tailor-made strategies for revenue mobilisation that
11 Rebates on shared taxation come mainly from the road tax (RT) and value added tax (VAT) collected from customs’ revenues. In accordance with Act No. 2006-24 on the 2007 Finance law, the share of VAT collected from customs’ revenues allocated to local authorities is set at 0.5 percent. The total VAT revenue allocated to local authorities is distributed as follows: 20 percent to municipalities with special status: 60 percent for Cotonou, 24 percent for Porto-Novo and 16 percent for Parakou; 80 percent to the remaining municipalities according to their demographic weight. The distribution key for the VAT revenue accruing to those municipalities is set by Order No. 2004-1145 of 14 September 2004.
suit their context. For instance, the municipality of Glazoué instituted a lump-sum tax on civil registration services, the proceeds of which are ring-fenced for local infrastructure development.
Capability to generate revenue is closely linked to the level of development and composition of economic activity in the municipality. Clientelism can also pose a challenge to revenue mobilisation if the population of the municipality is autochthonous, creating more room for favouritism. As such, trading centres with diverse populations are able to generate higher revenues not only due to the level of economic activity but also because the relationship between local authorities and taxpayers is more arm’s length. Despite the predominance of the informal sector in many local markets, most municipalities lack evidence-based strategies to develop and transform the informal sector to eventually tap its revenue potential. However, it should be noted that there is some effort to leverage microcredit schemes towards developing the informal sector in some municipalities.
2.2 Expenditure planning Annual planning at the municipal level is anchored in the communal development plan (PDC). All capital expenditures can be traced to the PDC and each year the annual tranche is taken to plan expenditures. This practice is universally adhered to by all municipalities interviewed. As such, there appears to be a clear link between plan and budget at a procedural level. However, a key informant from CONAFIL commented that the plan itself can sometimes feel like a wish list of ambitious projects. Therefore, municipalities are often required to prioritise their programmes to fit the allocated budget.
Interviewed municipalities identified the following factors as impediments to capital expenditure planning:
• Lack of own resources: municipalities are required to contribute approximately 20 percent of the total cost of a capital project from their own resources. For some municipalities, this requirement is onerous enough to interfere with effective planning of capital expenditure because the budget for indivisible investment projects is often quite substantial relative to the ability of municipalities to generate own resources.
• Delays in release of information and funds from central government: municipalities report that their capabilities for capital expenditure planning have been undermined by the lack of timely release of information on allocations by the central government. This challenge is compounded by even more problematic delays in releasing funds to municipalities.

12 PFM CAPABILITIES ASSESMENT REPORT SERIES / NO. 2
• Poor project planning and politicisation: some municipalities pointed out that gaps in their overall planning capabilities were to blame for shortcomings in capital expenditure planning. A few respondents added that political interference impinges on their ability to improve capital expenditure planning capabilities.
Capital project management is often subject to significant risk and uncertainty. Accordingly, capital expenditure planning should account sufficiently for the associated risks of investment projects.12 Most municipalities cite delays in project execution as a major risk factor having significant budget implications. They also report that this usually occurs due to weaknesses in the financial and technical capacities of contractors. In certain municipalities, the challenge is more structural in the sense that hazardous weather conditions are combined with poor infrastructure to complicate capital budget planning further. However, some municipalities are confident that standard mechanisms such as feasibility studies and environmental risk assessments equip them with sufficient capabilities to incorporate risk into their planning.
2.3 Budget execution and efficiency There is broad-based consensus that the state of budget execution in Benin’s municipalities leaves a lot to be desired. Table 4 presents data on rates of execution for selected budget categories in 2017 and 2018 for municipalities in our sample. The average rate of execution of total expenditure is only 46 percent in 2017 and 41 percent in 2018. Overall, municipalities have a poorer record on capital budget execution than recurrent budget execution. There is also significant disparity among municipalities in their performance of budget execution, particularly in capital budgets, as shown by the sizeable standard deviations. The earmarked FADeC transfer is characterised by a particularly low rate of execution with just 14.7 percent in 2017 and 26 percent in 2018. In addition to the lack of delivery capability at the local level, this is symptomatic of the gaps in coordination between sector ministries, who are the custodians of earmarked transfers, and municipalities.
The process of budget execution at the local level often begins with the release of allocated funds from the central government treasury. This usually requires effective cash planning and management at the central-government level. A majority of interviewed municipalities commented that delays in release of non-conditional transfers from the central government pose a significant challenge for effective budget implementation. This is one of the areas in the realm of intergovernmental fiscal relations where capabilities in central government systems may have direct implications for the performance of decentralised local government units. Municipality officials remark that delays in disbursement and procurement processes tend to have a ripple effect by
12 Kee and Robins (1991), Flyvbjerg (2016)
reducing the budget execution rate which, in turn, negatively impacts allocation in subsequent years. This problem is further complicated by the additional tier of administration at the prefecture level, which is sometimes responsible for delays in authorisation. However, the view from the prefectures is that municipalities already have low rates of execution of the budget that is released to them on time. This is alleged to be due to political interference at the municipal level. However, as is often the case, there is significant heterogeneity between municipalities in execution performance, which should be taken into account in addressing the perceived lack of synchronisation in releasing funds.
One of the potential challenges of decentralisation is that it may fragment budgetary units so much that it can undermine their ability to attain value-for-money by reducing their bargaining power or balkanising their markets. In this regard, most municipalities are of the opinion that the price directory issued by the central government has helped them improve value for money. However, some of the northern municipalities pointed out that geography does indeed play a role in creating market friction affecting value for money in public expenditure. Accordingly, the capability to ensure value for money tends to suffer as the distance from Cotonou increases and when there is poor accessibility to the municipality.
Municipalities claim to be using a range of methods to monitor budget efficiency. The two main mechanisms are convening regular committee meetings to review performance (weekly, monthly or bi-monthly) and employing software solutions to track performance. However, comments by third-party key informants indicate that these mechanisms might not be entirely effective considering that budget decisions may be subject to exogenous factors such as political gridlocks.
2.4 Procurement and cash managementProcurement planning at the municipal level is an extension of the annual investment planning and budgeting process. Therefore, procurement plans are among the key documents municipalities are required to have in place before budget approval. As a result, these plans are already developed early in the budget cycle, and as soon as the budget is approved, the municipalities can start implementing projects. The municipal procurement plan must be published in the Integrated Public Procurement Management System (SIGMaP), which is housed by the National Directorate for the Control of Public Procurement (DNCMP), by the end of January at the latest.
Although the planning process is sufficiently streamlined, municipalities report that the contracting process can be cumbersome. The involvement of the DNCMP and the prefecture at various stages of the contracting process

Institutional and personnel capabilities for fiscal decentralisation in Benin 13
introduces delays before project implementation can begin. Hence, as is often the case, the control function seems to interfere with the efficiency objective. Considering that the approval process can involve multiple entities across different
tiers of government (DNCMP, prefecture and municipality), ensuring control at the upper tiers may have negative externalities in terms of excessive delays for municipalities.
Table 4: Rates of execution of municipal budget expenditures in sample municipalities
2017 2018
Municipality Total expenditure
Capital expenditure
Earmarked FADeC
Total expenditure
Capital expenditure
Earmarked FADeC
Abomey Calavi 0.437 0.262 0.108 0.556 0.415 0.242
Banikoara 0.804 0.853 0.497 0.436 0.413
Cotonou 0.579 0.648 0.482 0.451
Glazoué 0.447 0.397 0.084 0.354 0.296 0.306
Parakou 0.673 0.686
Sèmè-Kpodji 0.345 0.173 0.081 0.329 0.161 0.041
Aplahoué 0.257 0.188 0.125 0.330 0.277 0.421
Athiémé 0.422 0.398 0.443 0.454
Djougou 0.297 0.162 0.118 0.251 0.165 0.101
Dogbo 0.438 0.384 0.233
Ifangni 0.566 0.435 0.391 0.303
Karimama 0.259 0.213 0.022 0.257 0.233 0.248
Natitingou 0.458 0.382 0.364 0.684 0.684 0.301
Zè 0.495 0.442 0.191
Mean 0.463 0.402 0.147 0.416 0.352 0.259
Standard deviation 0.145 0.193 0.096 0.126 0.147 0.126
Source: Compiled by authors

14 PFM CAPABILITIES ASSESMENT REPORT SERIES / NO. 2
The control procedures are internally consistent and even desirable as far as the upper tiers of administration are concerned. But the negative effect this may have on the budget execution of municipalities is not fully accounted by those who are responsible for control in the upper tiers of administration. As such, internalising such externalities and reducing friction in the contracting process requires adequate co-ordination capabilities by entities in charge of intergovernmental fiscal relations.
In addition to procurement plans, the budget is usually accompanied by cash plans that are developed annually and reviewed regularly by a structure (such as a committee) within the municipalities. As in the case of overall budget efficiency, municipalities attempt to improve cash management by convening review meetings, including with tax collectors, and by employing technological solutions such as tracking software. However, delays in the release of funds from the centre can have the potential to put even the best laid cash plans in jeopardy. It is interesting to note that some interview respondents claim that the size of the municipality plays a role in the performance of the cash management system, as small municipalities are better than the larger ones at adjusting their cash-flow plans quickly.
2.5 Accountability mechanisms As far as monitoring is concerned, municipality budgets are monitored on a monthly basis by the Directorate General of Treasury and Pubic Accounting (GDTPA), which draws up statements of revenue and expenditure for the municipalities. However, this department does not control municipalities’ financial management. In addition, the examination of the management accounts by the GDTPA, which provides an opportunity each year to audit municipalities’ financial management is not regularly carried out because of the late production and transmission of the accounts.13 The GDTPA does not produce a consolidated report on the budgetary situation of all municipalities at the end of the review of the financial accounts.
The annual FADeC audits constitute the principal means of ensuring accountability at the local level. These missions include a performance audit and are sometimes complemented by separate audits by development partners. Most municipalities view the Inspector-General of Finance’s audits as being instrumental in helping to improve their performance over and above the primary purpose of ensuring accountability. In almost all of the municipalities covered by the review, a committee is set up to follow up on the implementation of the audit recommendations. As such, the centralised regulatory capabilities of the inspector general seem to have compensated for the sparse capabilities for internal control at the municipal level. According to CONAFIL,
13 For example, as of 15 May 2014, only 35 out of 77 management accounts were produced for 2011.
the technical capabilities of the audit bodies are matched with the sanctioning power of the central government to ensure enforcement.
The role of CSOs appears to be quite strong in most municipalities. CSOs participate throughout the budgeting process from planning to monitoring as observers. They are also given full access to all reports. However, there is a diversity of opinion on the part of municipalities regarding the capability of CSOs to effectively participate in the budget process. Some respondents feel that CSOs are well equipped to the extent that they sometimes compensate for lack of municipality staff with information and inputs. Other officials are of the opinion that CSOs do not have the technical capabilities to fully understand the budget process. A CSO representative pointed out that they are constantly experimenting with various tools to increase citizen participation and inputs in the budget process.
2.6 Intergovernmental fiscal relations Intergovernmental fiscal relations between municipalities and the central government often rely on the planning and reporting capabilities of local government units and the regulatory and co-ordination capabilities of central government agencies. Most municipalities report that they have sufficiently qualified personnel to conduct planning and budgeting to meet the budget calendar. This is despite a hiring freeze and insufficient personnel capabilities in areas other than the budget. The human-resources capability is supplemented by a nationwide effort to improve the information technology capabilities of municipalities by way of a standardised financial management information system (the GBCO). Municipalities are required to provide periodic reports to the central government (in the form of CONAFIL) and prefectures. Interviewed officials claim that their municipalities have the requisite capabilities to provide good quality reports timeously.
In a decentralised system, the central government may play the role of co-ordinating the vertical interaction between various tiers of government, as well as facilitating the horizontal relationship between municipalities. Interviewed officials identified the following institutional structures as possessing the de jure or de facto mechanisms for co-ordinating intergovernmental fiscal relations, as follows:
• Tax administration: the central government maintains its presence at the local level mainly through the network of tax offices/collectors. As such, the tax administration can potentially play a key role in co-ordinating fiscal policy vertically and horizontally. However, some municipality officials claim that the tax administration does not pay enough attention to this co-ordination function.

Institutional and personnel capabilities for fiscal decentralisation in Benin 15
• Deconcentrated services: the deconcentrated services are responsible for co-ordinating policy implementation in their respective sectors. However, municipality officials have misgivings about the effectiveness of these services in facilitating intergovernmental fiscal relations.
• Prefectures: the prefectures are mandated to monitor municipalities as well as to serve as intermediaries between the central and local governments. Interviewed officials confirm that the prefectures attempt to fulfil their mandate to the best of their ability, including by helping to resolve conflict between municipalities.
Finally, municipalities were asked to reflect on the issues of boundary delimitation, which can have potential implications for equity and efficiency. Out of the 17 municipalities, only
two did not point out economic or administrative problems related to the existing demarcation of municipal boundaries. The most important challenge related to boundary delimitation appears to be that some municipalities have a narrow tax base. Therefore, further boundary rationalisation might be required to ensure equitable distribution of fiscal potential. There seems to be no obvious mechanism – such as a municipal demarcation board – by which to adapt the delimitation of municipal boundaries to changing needs and situations. Several officials mentioned the existence of ongoing disputes between municipalities over tax jurisdiction. Some also claim that there is structural inequality caused by the location of some municipalities next to big cities that sometimes overstep their jurisdiction owing to a much denser tax collection network than that of their smaller neighbours.
In a decentralised system, the central government may play the role of co-ordinating
the vertical interaction between various tiers of government, as well as facilitating the
horizontal relationship between municipalities
16 PFM CAPABILITIES ASSESMENT REPORT SERIES / NO. 2
3 Personnel capabilities
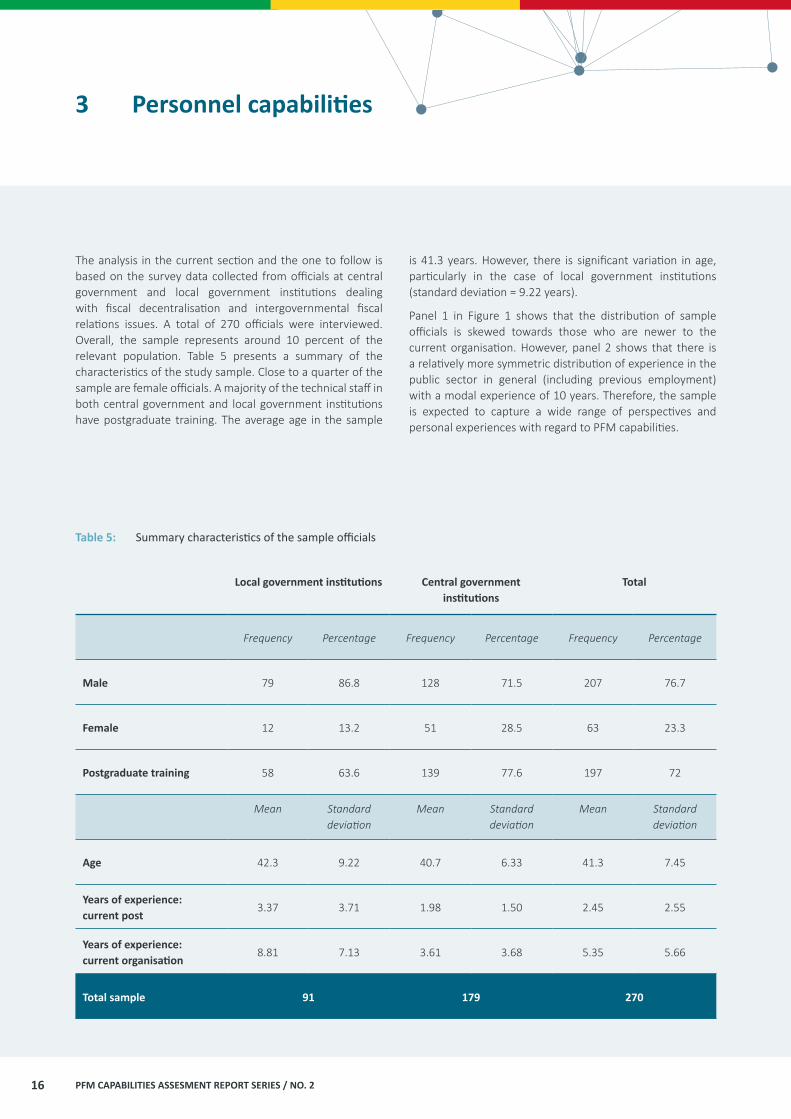
The analysis in the current section and the one to follow is based on the survey data collected from officials at central government and local government institutions dealing with fiscal decentralisation and intergovernmental fiscal relations issues. A total of 270 officials were interviewed. Overall, the sample represents around 10 percent of the relevant population. Table 5 presents a summary of the characteristics of the study sample. Close to a quarter of the sample are female officials. A majority of the technical staff in both central government and local government institutions have postgraduate training. The average age in the sample
is 41.3 years. However, there is significant variation in age, particularly in the case of local government institutions (standard deviation = 9.22 years).
Panel 1 in Figure 1 shows that the distribution of sample officials is skewed towards those who are newer to the current organisation. However, panel 2 shows that there is a relatively more symmetric distribution of experience in the public sector in general (including previous employment) with a modal experience of 10 years. Therefore, the sample is expected to capture a wide range of perspectives and personal experiences with regard to PFM capabilities.
Table 5: Summary characteristics of the sample officials
Local government institutions Central government institutions
Total
Frequency Percentage Frequency Percentage Frequency Percentage
Male 79 86.8 128 71.5 207 76.7
Female 12 13.2 51 28.5 63 23.3
Postgraduate training 58 63.6 139 77.6 197 72
Mean Standard
deviationMean Standard
deviationMean Standard
deviation
Age 42.3 9.22 40.7 6.33 41.3 7.45
Years of experience: current post
3.37 3.71 1.98 1.50 2.45 2.55
Years of experience: current organisation
8.81 7.13 3.61 3.68 5.35 5.66
Total sample 91 179 270

Institutional and personnel capabilities for fiscal decentralisation in Benin 17
Figure 1 : Distribution of years of experience in the sample
0 10
-0.5
0
-1
-1.5
-2
20 30 40
Years of experience in current organisation
Dens
ity
0 10
-0.5
0
-1
-1.5
20 30 40
Years of experience in current organisation
Dens
ity
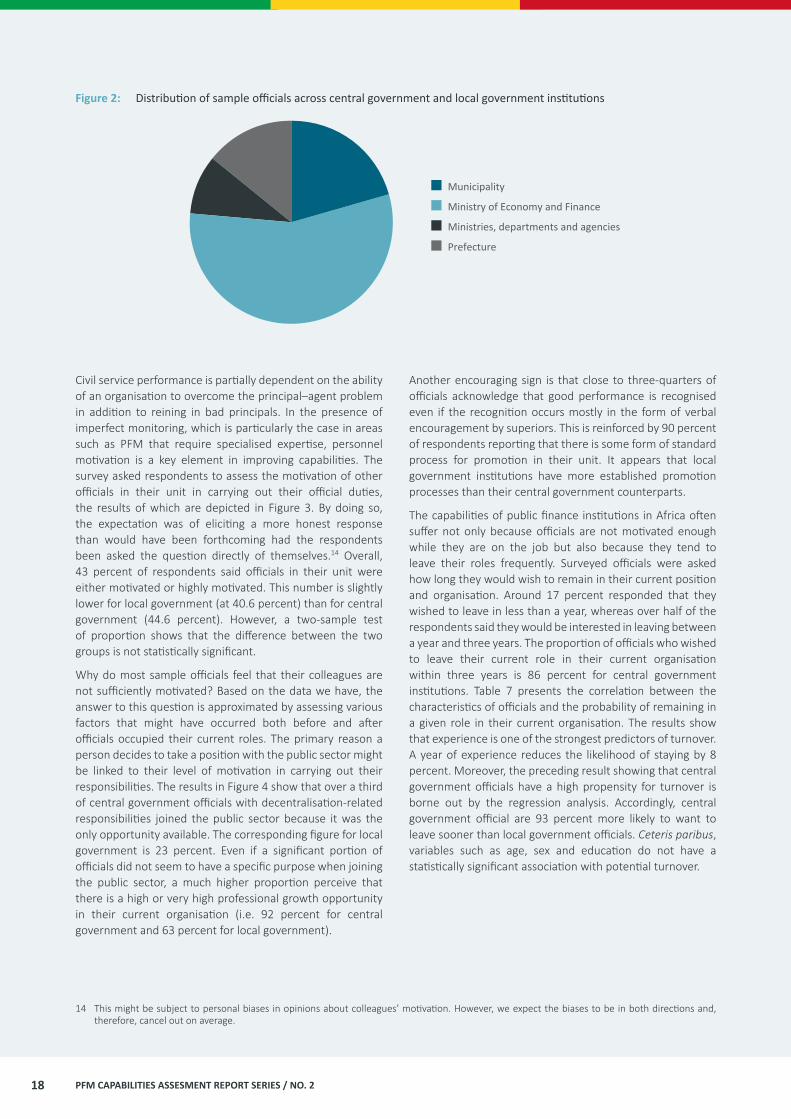
The organisational scope of the personnel survey covers the Ministry of Economy and Finance, MDAs, prefectures and municipalities. It is shown in Figure 2 that over 57 percent of respondents come from units that are responsible for a certain aspect of fiscal decentralisation at the Ministry of Economy and Finance. Given the critical role the ministry plays in analytical, regulatory and co-ordination functions relevant for fiscal decentralisation, the high share of respondents from its units will be useful for capturing a representative picture of overall capabilities for fiscal decentralisation. The remaining share of central government institutions (i.e. 9 percent of the sample) is distributed among officials responsible for decentralisation-related activities in five MDAs: decentralisation and local government, health,
agriculture and fisheries, maternal and primary education, and infrastructure and transport. On the local government side, 19 percent of sample respondents come from municipalities, whereas 15 percent are from prefectures. The full list of directorates, municipalities and prefectures covered by the personnel sample is given in Appendix 3.
Personnel capabilities are defined as a combination of motivation, competencies and resources. The original questionnaire (included in Appendix 4) features more questions that can be used to measure personnel capabilities than are discussed in this report. Table 6 provides a classification of the indicators discussed in this report with respect to the three dimensions of personnel capabilities.
Table 6: Dimensions of personnel capabilities
Dimension Indicator used in report
Motivation
• Perception of level of motivation of colleagues• Main reason for joining public service• Reward and growth opportunities • Staff turnover
Competencies • Skills mismatch in unit
Resources • Mentoring • On-the-job training opportunities
18 PFM CAPABILITIES ASSESMENT REPORT SERIES / NO. 2
Figure 2: Distribution of sample officials across central government and local government institutions
Municipality
Ministry of Economy and Finance
Ministries, departments and agencies
Prefecture
14 This might be subject to personal biases in opinions about colleagues’ motivation. However, we expect the biases to be in both directions and, therefore, cancel out on average.
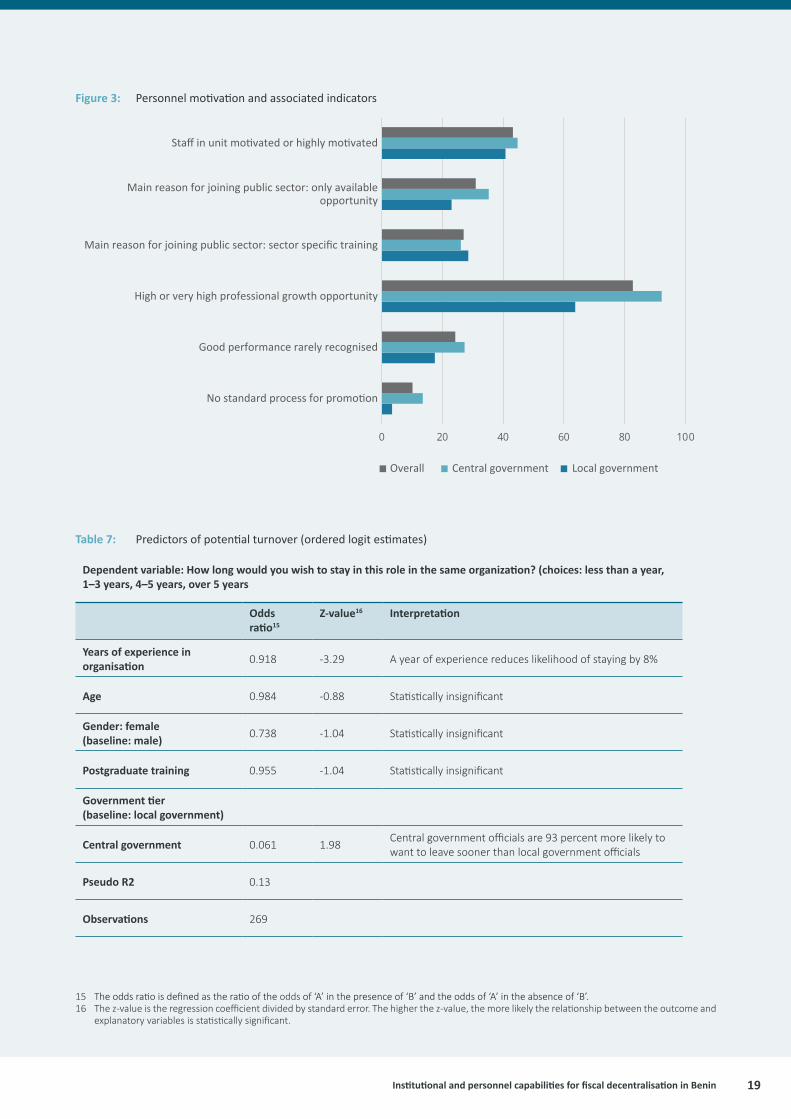
Civil service performance is partially dependent on the ability of an organisation to overcome the principal–agent problem in addition to reining in bad principals. In the presence of imperfect monitoring, which is particularly the case in areas such as PFM that require specialised expertise, personnel motivation is a key element in improving capabilities. The survey asked respondents to assess the motivation of other officials in their unit in carrying out their official duties, the results of which are depicted in Figure 3. By doing so, the expectation was of eliciting a more honest response than would have been forthcoming had the respondents been asked the question directly of themselves.14 Overall, 43 percent of respondents said officials in their unit were either motivated or highly motivated. This number is slightly lower for local government (at 40.6 percent) than for central government (44.6 percent). However, a two-sample test of proportion shows that the difference between the two groups is not statistically significant.
Why do most sample officials feel that their colleagues are not sufficiently motivated? Based on the data we have, the answer to this question is approximated by assessing various factors that might have occurred both before and after officials occupied their current roles. The primary reason a person decides to take a position with the public sector might be linked to their level of motivation in carrying out their responsibilities. The results in Figure 4 show that over a third of central government officials with decentralisation-related responsibilities joined the public sector because it was the only opportunity available. The corresponding figure for local government is 23 percent. Even if a significant portion of officials did not seem to have a specific purpose when joining the public sector, a much higher proportion perceive that there is a high or very high professional growth opportunity in their current organisation (i.e. 92 percent for central government and 63 percent for local government).
Another encouraging sign is that close to three-quarters of officials acknowledge that good performance is recognised even if the recognition occurs mostly in the form of verbal encouragement by superiors. This is reinforced by 90 percent of respondents reporting that there is some form of standard process for promotion in their unit. It appears that local government institutions have more established promotion processes than their central government counterparts.
The capabilities of public finance institutions in Africa often suffer not only because officials are not motivated enough while they are on the job but also because they tend to leave their roles frequently. Surveyed officials were asked how long they would wish to remain in their current position and organisation. Around 17 percent responded that they wished to leave in less than a year, whereas over half of the respondents said they would be interested in leaving between a year and three years. The proportion of officials who wished to leave their current role in their current organisation within three years is 86 percent for central government institutions. Table 7 presents the correlation between the characteristics of officials and the probability of remaining in a given role in their current organisation. The results show that experience is one of the strongest predictors of turnover. A year of experience reduces the likelihood of staying by 8 percent. Moreover, the preceding result showing that central government officials have a high propensity for turnover is borne out by the regression analysis. Accordingly, central government official are 93 percent more likely to want to leave sooner than local government officials. Ceteris paribus, variables such as age, sex and education do not have a statistically significant association with potential turnover.
Institutional and personnel capabilities for fiscal decentralisation in Benin 19
Figure 3: Personnel motivation and associated indicators
0 20 40 60 80 100
Staff in unit motivated or highly motivated
Main reason for joining public sector: only availableopportunity
Main reason for joining public sector: sector specific training
High or very high professional growth opportunity
Good performance rarely recognised
No standard process for promotion
Local governmentCentral governmentOverall
15 The odds ratio is defined as the ratio of the odds of ‘A’ in the presence of ‘B’ and the odds of ‘A’ in the absence of ‘B’. 16 The z-value is the regression coefficient divided by standard error. The higher the z-value, the more likely the relationship between the outcome and
explanatory variables is statistically significant.
Table 7: Predictors of potential turnover (ordered logit estimates)
Dependent variable: How long would you wish to stay in this role in the same organization? (choices: less than a year, 1–3 years, 4–5 years, over 5 years
Odds ratio15
Z-value16 Interpretation
Years of experience in organisation 0.918 -3.29 A year of experience reduces likelihood of staying by 8%
Age 0.984 -0.88 Statistically insignificant
Gender: female (baseline: male) 0.738 -1.04 Statistically insignificant
Postgraduate training 0.955 -1.04 Statistically insignificant
Government tier (baseline: local government)
Central government 0.061 1.98 Central government officials are 93 percent more likely to want to leave sooner than local government officials
Pseudo R2 0.13
Observations 269

20 PFM CAPABILITIES ASSESMENT REPORT SERIES / NO. 2
The survey includes a question on what the main reason for departure would be, if and when the official decided to leave. Figure 4 shows that over 47 percent of respondents said that lack of personal satisfaction would be the reason for leaving. On the surface, it may seem surprising that low salary was not mentioned as one of the top reasons for potential departure, since over three-quarters of respondents do not consider their salaries to be sufficient to cover basic expenses.17 However, on closer examination, this result is consistent with findings relating to inadequate salaries, considering that most officials did not join the organisation for pecuniary reasons in the first place. Just under 3 percent of officials joined the organisation because of better pay and benefits. Moreover, some of the officials attributing potential turnover to lack of personal satisfaction might be conflating the effect of monetary unattractiveness with the more ambiguous notion of personal fulfilment.
With regard to the prospective destination after leaving current organisation, NGOs and international organisations appear to be the most popular, particularly among central government officials, as shown in Figure 4. Over a quarter of local government respondents said they would leave their job to start their own business. Although this result might seem surprising, it is probably because there are fewer outside opportunities and personal connections at the municipality level.
In organisations such as ministries of finance and municipal finance departments, where most roles require specialised
17 This was highlighted as one of the potentially counter-intuitive results at the validation workshop. 18 Regardless of the high level of mismatches, around 43 percent of respondents reported that they receive on-the-job training at least once a year,
and a vast majority of them believe the training is well targeted. However, on the basis of the relatively more objective assessment regarding role mismatches, it can be argued that on-the-job training might not be effective enough to reverse fundamental skills’ misalignments.
skills, the misalignment of skills could hamper performance significantly. Overall, a majority of officials believes that their unit’s performance has been negatively affected by not having the right people in the right roles (see Figure 5). The problem is more severe in local government institutions, where almost 70 percent of officials reported that skills mismatch has hampered performance. This is in line with insights from the qualitative interviews showing that the human-resource capabilities of municipalities are constrained by the hiring freeze instituted by the central government. This level of mismatch could have far-reaching consequences, particularly because the level of perceived motivation is also worryingly low, and there is often no mechanism for perfect monitoring of employees in such positions.18
Mentoring is a key part of building specific human capital for new and younger officials, particularly in a situation where those officials may have come into the role with limited experience. In this regard, central government institutions seem to offer greater opportunity for mentoring than local government institutions (47 percent versus 30 percent). However, as Figure 6 shows, on average, officials in central government institutions spend shorter stints working with other colleagues in the same team in both horizontal and vertical relationships than their local-government counterparts. This means that even if less-experienced officials have better opportunities to be matched with a mentor when they join the organisation, they might not continue to benefit from that relationship for long because of frequent reshuffling.
Figure 4: Potential turnover reasons and destinations
Local governmentCentral governmentOverall
0 10 20 30 40 50 60 70
Turnover reason: low salary
Turnover reason: lack of personal satisfaction
Potential destination: NGOs or international organisations
Potential destination: start own business

Institutional and personnel capabilities for fiscal decentralisation in Benin 21
Figure 5: Share of officials believing that skills mismatch has affected their unit’s performance
0
10
20
30
40
50
60
70
80
OverallCentral governmentLocal government
Figure 6: Length of time worked with supervisors and horizontal colleagues
Local government Central government
0
50
100
150
200
250
Average number of months worked with immediate boss
Average number of months worked with horizontal colleague
22 PFM CAPABILITIES ASSESMENT REPORT SERIES / NO. 2
4 Reform ecosystem
19 This is consistent across subsets of officials regardless of level of experience. This is conceivably because some of the ideas that may have originated with donors were presented as own initiatives.
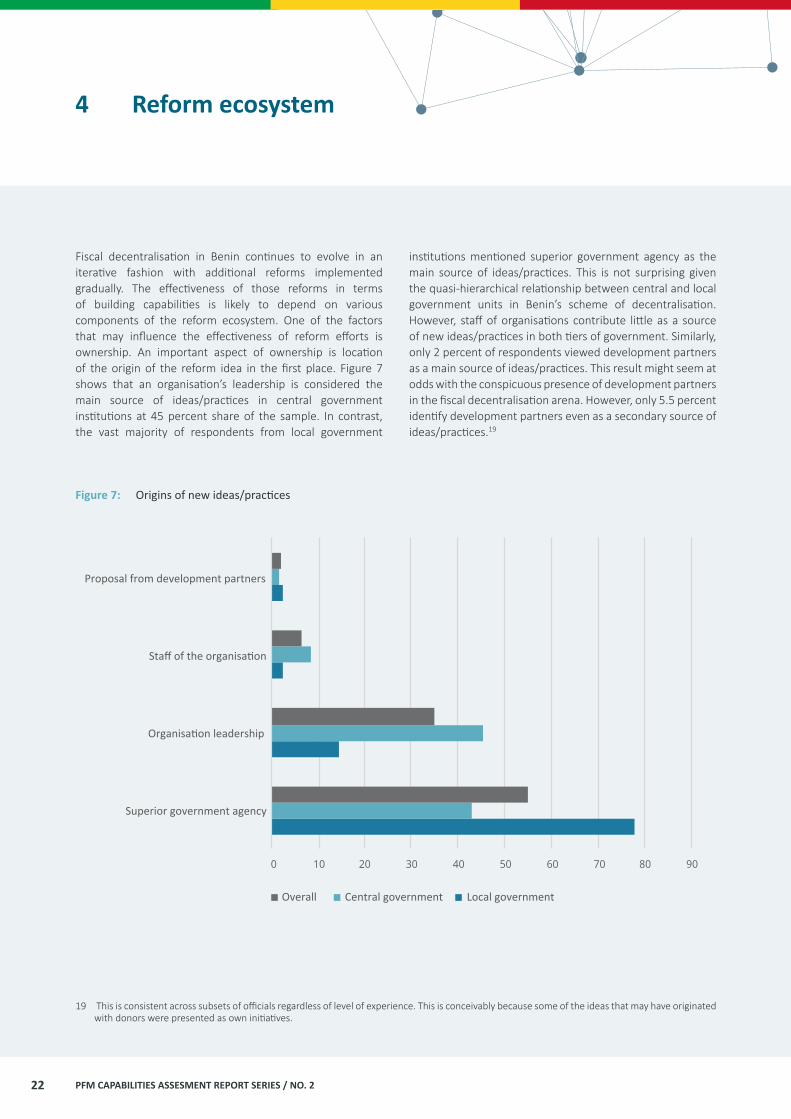
Fiscal decentralisation in Benin continues to evolve in an iterative fashion with additional reforms implemented gradually. The effectiveness of those reforms in terms of building capabilities is likely to depend on various components of the reform ecosystem. One of the factors that may influence the effectiveness of reform efforts is ownership. An important aspect of ownership is location of the origin of the reform idea in the first place. Figure 7 shows that an organisation’s leadership is considered the main source of ideas/practices in central government institutions at 45 percent share of the sample. In contrast, the vast majority of respondents from local government
institutions mentioned superior government agency as the main source of ideas/practices. This is not surprising given the quasi-hierarchical relationship between central and local government units in Benin’s scheme of decentralisation. However, staff of organisations contribute little as a source of new ideas/practices in both tiers of government. Similarly, only 2 percent of respondents viewed development partners as a main source of ideas/practices. This result might seem at odds with the conspicuous presence of development partners in the fiscal decentralisation arena. However, only 5.5 percent identify development partners even as a secondary source of ideas/practices.19
Figure 7: Origins of new ideas/practices
0 10 20 30 40 50 60 70 80 90
Superior government agency
Organisation leadership
Staff of the organisation
Proposal from development partners
Local governmentCentral governmentOverall

Institutional and personnel capabilities for fiscal decentralisation in Benin 23
In complex and multipronged reform exercises such as fiscal decentralisation, the sequence of reforms can be important for the success of the overall effort. However, this does not mean that there is a universal formula with regard to the sequence in which reforms need to be rolled out, even though the balance of the academic argument is for prioritising basic reforms.20 Overall, comprehensive reforms are given priority.
20 See, for example, Schick (1998), Welham and Hadley (2015).21 Premature loadbearing is defined as the capability trap countries may fall into by trying to do too much too soon (Andrews et al, 2016).
As Figure 8 demonstrates, this is particularly the case in local government. Considering the limited capability many municipalities have for comprehensive reform, there is a risk that this may lead to premature loadbearing.21 A ‘basics-first’ approach is more prevalent in central government (at 40.2 percent) than in local government (26.4 percent).
Figure 8: Sequencing of reforms
Local governmentCentral governmentOverall
0 10 20 30 40 50 60 70
Most basic reforms rolled out first
Related reforms rolled out together
Comprehensive reforms prioritised
Reforms rolled out in random order

24 PFM CAPABILITIES ASSESMENT REPORT SERIES / NO. 2
Another issue in terms of rolling out reforms is the nature of engagement with other stakeholders and the stage at which the engagement is initiated. Central and local government units follow somewhat different approaches for engagement. Figure 9 shows that local government units rarely implement reforms on their own, as collaborative planning and sensitisation take the biggest share. On the other hand, central government units either engage others at the planning stage or plan and implement reforms on their own. In general, more than half of the respondents (from both local and central government) claimed that they usually work in cross-department teams, showing that silo mentality might not be as entrenched as it is in some other civil services.
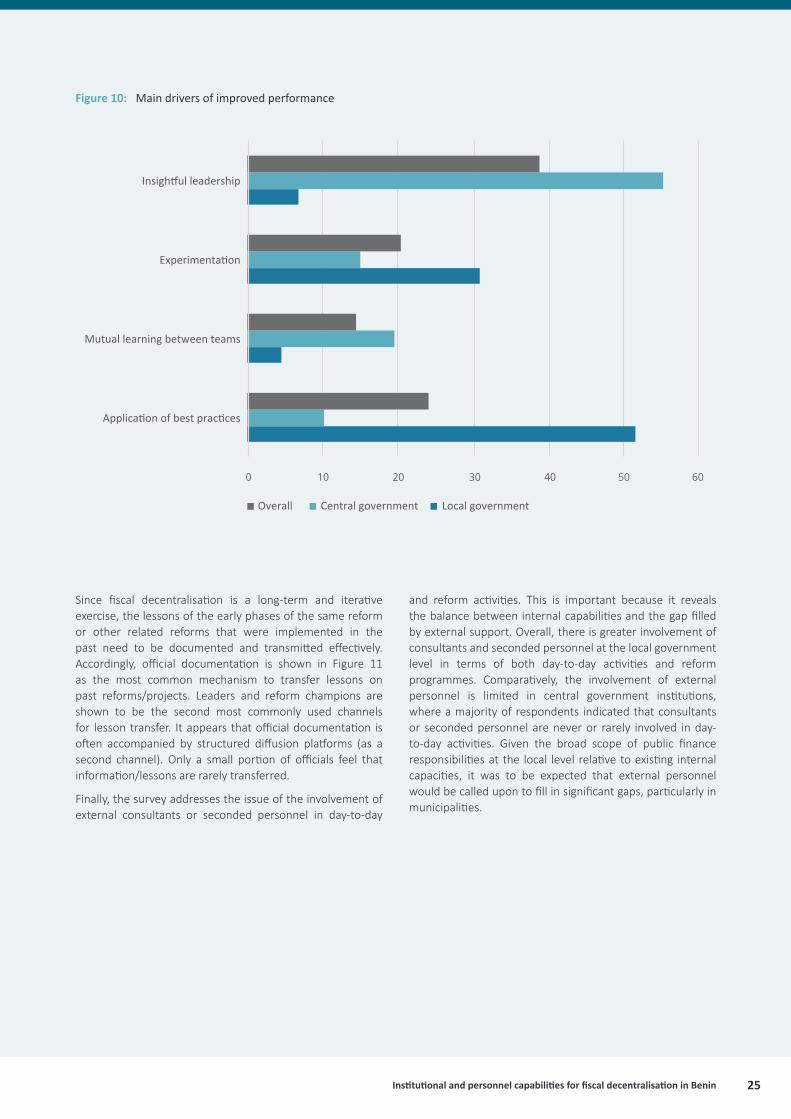
One of the toughest tasks in public policy analysis is disentangling relevant success factors behind reform programmes. Nevertheless, officials implementing reforms are better placed than most external observers to judge factors that may be behind improved performance. The survey revealed that there is significant difference of opinion
regarding the main driver of improved performance between local and central government officials. As shown in Figure 10, insightful leadership is deemed the main driver of success at central government level (at 53 percent), as opposed to 6.5 percent at local government level. On the other hand, application of best practices is considered the main factor behind improved performance in local government (at 52 percent), as opposed to 10 percent at central government level. This is consistent with previous findings showing that an organisation’s leadership is the main source of reform ideas at the central government level, whereas superior agencies with oversight roles, which are likely to package policy lessons in the form of best practices, generate ideas at the local level. Experimentation seems to lead to greater improvement in performance by local government than by central government. Considering the delivery-intensive activities at the municipal level, it is not surprising that experimentation is more effective in local than in central government.
Figure 9: Engaging other units in reform activities
0%
10%
20%
30%
40%
50%
60%
70%
80%
90%
100%
Local government Central government
Involve at planning stage
Sensitisation before implementation
Leaves it to superior authorities
Plans and implements reforms on its own
Other coordination method
Institutional and personnel capabilities for fiscal decentralisation in Benin 25
Figure 10: Main drivers of improved performance
Local governmentCentral governmentOverall
0 10 20 30 40 50 60
Application of best practices
Mutual learning between teams
Experimentation
Insightful leadership
Since fiscal decentralisation is a long-term and iterative exercise, the lessons of the early phases of the same reform or other related reforms that were implemented in the past need to be documented and transmitted effectively. Accordingly, official documentation is shown in Figure 11 as the most common mechanism to transfer lessons on past reforms/projects. Leaders and reform champions are shown to be the second most commonly used channels for lesson transfer. It appears that official documentation is often accompanied by structured diffusion platforms (as a second channel). Only a small portion of officials feel that information/lessons are rarely transferred.
Finally, the survey addresses the issue of the involvement of external consultants or seconded personnel in day-to-day
and reform activities. This is important because it reveals the balance between internal capabilities and the gap filled by external support. Overall, there is greater involvement of consultants and seconded personnel at the local government level in terms of both day-to-day activities and reform programmes. Comparatively, the involvement of external personnel is limited in central government institutions, where a majority of respondents indicated that consultants or seconded personnel are never or rarely involved in day-to-day activities. Given the broad scope of public finance responsibilities at the local level relative to existing internal capacities, it was to be expected that external personnel would be called upon to fill in significant gaps, particularly in municipalities.

26 PFM CAPABILITIES ASSESMENT REPORT SERIES / NO. 2
Figure 11: Means to transfer past reform lessons
0
10
20
30
40
50
60
70
80
90
Officialdocumentation
Leaders and reformchampions
Structured diffusionplatforms
Lesson rarelytransferred
1st most popular 2nd most popular
More than half of the respondents claimed that they usually work in cross-department teams, showing that silo mentality might not be as entrenched as it is in some other civil services

Institutional and personnel capabilities for fiscal decentralisation in Benin 27
5 Capabilities for fiscal decentralisation: Discussion of key results
This section pulls together the key insights from previous sections and interprets the evidence using the typology of capability presented in Lodge and Wegrich (2014). The aim is to jointly look at the institutional and personnel dimensions of key PFM functions for fiscal decentralisation in order to understand the strengths and weaknesses in terms of underlying capabilities for delivery, regulation, coordination and analysis.
Delivery capabilitiesIn the context of fiscal decentralisation, the most salient delivery issues consist in local revenue mobilisation and executing the municipal budget to provide local public goods. This dimension of municipal capabilities is characterised by a feedback loop such that the performance of municipalities in collecting revenue and executing their budgets affects their future capabilities to deliver on the same mandates. In this regard, many municipalities in Benin struggle to mobilise sufficient own revenue and to execute their annual budget, most of which consists of central government transfers. Part of this can be attributed to the significant heterogeneity in endowments and efficiency between municipalities. However, despite differences in endowments, personnel performance can have a substantial effect on the delivery capabilities of local government. There is suggestive evidence that the relatively high level of skills mismatch at the local government level may have contributed to these capability gaps. In this regard, some municipalities have deployed specialised technologies to augment personnel capabilities in a bid to improve efficiency.
The delivery capabilities of municipalities to collect revenue also depends on their ability to manage the contracting relationship with independent tax collectors. This adds a layer of complexity to the effort to improve revenue collection capabilities since municipalities – as principals – may not have full control over the efforts of independent tax collectors – as agents. Ultimately, this leads to the delivery capabilities of municipalities being enmeshed with local level regulatory capabilities. Moreover, the budget execution capabilities of municipalities can be viewed as one part of a continuum of capabilities undergirding the intergovernmental fiscal relations system. In other words, the regulatory and co-ordinative capabilities of the upper tiers of government
can have significant implications for the delivery outcomes at the local level. This is manifest in the realm of procurement and capital budget execution.
Regulatory capabilities A number of central government organisations as well as prefectures are bestowed with an oversight mandate in the context of fiscal decentralisation in Benin. Municipalities, in turn, are expected to play a regulatory role with respect to independent tax collectors and other service providers operating at the local level. The two main domains of oversight central government agencies and prefectures are responsible for are ex-ante control and ex-post external control. There is an elaborately institutionalised procedure to carry out ex-ante control in procurement. Hence, as far as procedural compliance is concerned, there are robust institutional capabilities for ex-ante control supplemented with relevant technologies to streamline the process. However, the capabilities of upper tier units do not appear to go much farther than mere adherence to procedural compliance to reducing the efficiency cost of compliance for municipalities.
When it comes to ex-post external control, there seems to be broad consensus that capabilities built in central government institutions have been instrumental in ensuring accountability at the local level despite weaknesses in internal control. CSOs also are a crucial part of the system of oversight in budget execution and service delivery at the local level, even if they do not have formal enforcement powers. As such, they enhance the overall field of regulatory capabilities in fiscal decentralisation to the extent that their contributions fill gap left by existing government capabilities.
Municipalities are responsible for the intricate task of regulating contracting relationships with private sector agents in the presence of information asymmetries. Considering the disparities in the abilities of municipalities to attract and retain qualified personnel, some municipalities may have a hard time building the necessary capabilities to regulate private sector service providers. Generally, regulatory capabilities require maintaining sufficient institutional memory which can be undermined by the high rate of staff turnover at both central and local government levels.

28 PFM CAPABILITIES ASSESMENT REPORT SERIES / NO. 2
Co-ordinative capabilitiesCo-ordination is at the heart of intergovernmental fiscal relations. As such, vertical and horizontal co-ordination capabilities are critical for fiscal decentralisation. However, municipalities in Benin do not appear to have robust institutional mechanisms for co-ordinating among themselves or resolving disputes. In terms of vertical co-ordination, there are existing structures in the form of the tax administration, prefectures and deconcentrated services with varying levels of co-ordination mandates. However, there is concern on the part of some municipalities that those institutions sometimes neglect their co-ordination function. The poor performance of municipalities in executing their earmarked FADeC budgets is indicative of the gaps in coordination by deconcentrated services.
On top of day-to-day operations, coordinative capabilities are key for the success of reform initiatives.
CONAFIL plays a key role as a focal point to co-ordinate the efforts of government and development partners for PFM reform in municipalities. However, the survey result on the reform experiences of central government public finance units charged with decentralisation-related roles shows that a sizable proportion of them plan and implement reforms on their own. Depending on the types of reforms
and their relevance for local government performance, this can potentially undermine the collective capabilities for co-ordination in intergovernmental fiscal relations.
Analytical capabilitiesThe planning, forecasting and evaluation functions of local government are likely to require some level of analytical capabilities that are often unevenly distributed across local governments. Some municipalities have developed sophisticated data collection technologies whereas others are barely collecting any data on economic potential. This is part of the reason why the central government attempts to compensate for potential weaknesses in analytical capabilities at the local government level by providing pre-packaged solutions such as a revenue forecasting formula.
Central governments do usually have comparative advantage in analytical activities, particularly in the realm of medium to long-term analysis. To the extent that analytical inputs are required for the development of reform ideas, it is only fitting that a great majority of surveyed local government units rely on central government for reform ideas. The relatively low level of reliance on consultants and seconded personnel at the central government level indicates that there is greater potential to foster home-grown analytical capabilities.
The relatively low level of reliance on consultants and seconded personnel at the central government level indicates that there is greater potential to foster home-grown analytical capabilities

Institutional and personnel capabilities for fiscal decentralisation in Benin 29
6 Conclusion
In three years’ time, Benin will mark two decades since it embarked on a journey of extensive decentralisation. Given the level of citizens’ discontent with the quality of service delivery by local government units, it is important to review the underlying capabilities to carry out decentralised governance. As one of the trickiest aspects of decentralisation, fiscal decentralisation often requires a series of well-synchronised capabilities at various tiers of government for local service delivery to run smoothly and efficiently.
This report has reviewed the organizational and personnel dimensions of fiscal decentralisation capabilities in Benin with the aim of identifying gaps contributing to the worryingly low levels of revenue performance and budget execution in municipalities. The main findings of the review point to weaknesses in delivery capabilities at the local level that may
have been caused by a combination of personnel problems and co-ordination failures in the intergovernmental fiscal relations system. However, the central government plays a critical role in compensating for overall gaps and potential disparities in analytical and regulatory capabilities at the municipality level.
When it comes to the reform ecosystem, the leadership of central government organisations are reported to be in firm control of the reform process. This is in line with another finding that central government organisations are less heavily reliant on best practice solutions, while local government units engage in a fair amount of experimentation. This shows that there is fertile ground for implementing effective reforms and fostering organisational learning, provided that key weaknesses in human-resource capabilities are addressed.
The main findings of the review point to weaknesses in delivery capabilities at the
local level that may have been caused by a combination of personnel problems and
co-ordination failures in the intergovernmental fiscal relations system
30 PFM CAPABILITIES ASSESMENT REPORT SERIES / NO. 2
References
Andrews, M., Cangiano, M., Cole, N., De Renzio, P., Krause, P. & Seligmann, R. (2014). This is PFM. CID Working Paper, No. 285. Cambridge MA: Harvard University.
Andrews, M., Pritchett, L. & Woolcock, M. (2016). Building state capability: Evidence, analysis, action. Oxford: Oxford University Press.
Bardhan, P. (2002). Decentralisation of governance and development. Journal of Economic Perspectives, Vol. 16(4): 185–205.
CABRI (Collaborative Africa Budget Reform Initiative). (2007). The capabilities of ministries of finance and planning to coordinate capital and recurrent expenditure: Synthesis report.
Cirincione, C., Gurrieri, G. A. & Van de Sande, B. (1999). Municipal government revenue forecasting: issues of methods and data. Public Budgeting & Finance, Vol. 19(1): 26-46.
Flyvbjerg, B. (2016). The fallacy of beneficial ignorance: A test of Hirschman’s hiding hand. World Development, Vol. 84: 176–189.
Kee, R. & Robins, W. (1991). Capital budgeting in the publica sector: a comparative analysis. Journal of Managerial Issues. Vol. 3(3): 288–301.
Krause, P., Hadley, S., Mustapha, S. & Welham, B. (2016). The capabilities of finance ministries. London: Overseas Development Institute.
Lodge, M. & Wegrich, K. (2014). The problem-solving capacity of the modern state: Governance challenges and administrative capacities. Oxford: Oxford University Press.
Samson, R. & Houessou, R. (2018). Local governance in Benin: a guarantee for sustainable development? Afrobarometer Policy Paper, No. 45.
Schick, A. (1998). Why most developing countries should not try New Zealand reforms. The World Bank Research Observer: 123 –131.
Welham, B. & Hadley, S. (2015). Basic enough budgets: What should you do when you can’t do everything? ODI Working Paper, No. 43. London: Overseas Development Institute.

Institutional and personnel capabilities for fiscal decentralisation in Benin 31
Appendix 1Methodology
The data-collection work conducted for this report proceeded in five stages: scoping, desk research, instrument design, fieldwork and validation.
Scoping The scoping exercise started with consultations with a team of budget officials participating in an action-learning programme organised by CABRI with the specific objective of improving revenue mobilisation and budget execution in municipalities. The purpose of the consultation was to identify priority areas in which officials need more evidence to bolster existing or planned reforms. Accordingly, the officials identified budget formulation, budget execution and budget evaluation as the broad areas in which capability reviews would be needed. They also selected the Ministry of Economy and Finance, Ministry of Decentralisation and Local Government and municipalities for the personnel survey.
The second part of the scoping exercise involved the identification of key informants for the qualitative interview on institutional capabilities as well as sampling of officials from selected ministries and local government organisations for the quantitative survey on personnel capabilities and reform experience.
Desk research The preliminary research consisted of document analysis. The document review was used to extract relevant qualitative and quantitative data from a variety of publications, such as legislative documents, constitutional documents, strategic plans and reports including other assessments (such as PEFA). This was aimed at providing information on the de jure PFM system as well as setting a point of departure for the analysis of de facto practices, which was expected to be conducted through primary data collection.
Instrument design Both the qualitative and quantitative questionnaires for data collection were built upon parts of the generic instruments developed by CABRI for the PFM capability review programme. The main instruments had been pretested for relevance and clarity with a number of public finance officials in four countries. Moreover, a tailored version of the instruments was deployed for a similar review in the Central African Republic. The questionnaires were customised for the Benin capability review using the information provided by the teams of officials as part of the scoping exercise. For example, the section on revenue forecasting and mobilisation was
significantly expanded because the team of officials identified local government revenue mobilisation as a challenge for fiscal decentralisation in Benin.
FieldworkThe fieldwork, consisting of both qualitative and quantitative interviews, was conducted in Benin over a four-week period in December 2019 and January 2020. The qualitative interviews were conducted with 17 municipality representatives and 8 other key informants from prefectures, central government institutions, civil society and the media. Figure 1 displays the map of municipalities included in the qualitative review. As Table 2 shows, the 17 municipalities were selected from two broad categories based on resource potential: ‘with resources’ (viz. municipalities that manage to mobilise significant local resources) versus ‘without resources’ (viz. those that, despite fiscal potential, have difficulties mobilising resources). The interviews covered a range of issues around municipal budget credibility, reliable and efficient resource flows and transactions, and institutionalised accountability.
The personnel survey was conducted by a team of three enumerators under the supervision of a consultant. Stratified random sampling was used to select 154 officials from the budget, tax and treasury departments of the Ministry of Economy and Finance. Officials from the tax department are overrepresented in the sample because the tax department is a key component of the intergovernmental fiscal architecture linking the central and local governments. Additionally, 24 officials were sampled from 5 MDAs that are relevant for fiscal decentralisation. On the local government side, 50 officials from 9 municipalities and 42 officials from 7 prefectures were included in the sample. Efforts were made to ensure the representativeness of the sample in terms of the distribution of senior, mid-level and junior officials within each institution.
Validation The preliminary findings of the assessment were presented at a validation workshop organised in Abomey for a broad set of stakeholders including respondents of the key informant interviews. The objective of the validation workshop was to do further triangulation of key findings and to solicit feedback before the final report was compiled. The assessment team used the opportunity to seek clarification on some issues that were deemed ambiguous or doubtful in the preliminary analysis phase.

32 PFM CAPABILITIES ASSESMENT REPORT SERIES / NO. 2
Figure A1: Map of sample municipalities
BURKINA FASO
Alibori
Borgou
Collines
Plateau
OuéméMono
Couffo
Zou
Donga
Atacora
NIGER
TOGO
NIGERIA
Karimama
Banikoara
Djougou
Kérou
Sinendé Natitingou
Glasoué
AplahouéAbomey
Ifangni
Sèmè-Kpodji
Aguégués
ZèAbomey-Calavi
CotonouAtlantiqueLittoral
Dogbo
Athiémé
Parakou

Institutional and personnel capabilities for fiscal decentralisation in Benin 33
Table A1: Sample municipalities
Economic base Municipalities with resources Municipalities without resources
Agriculture Banikoara, Kérou Sinendé, Zè
Border trade Sèmè Kpodji Karimama, Athiemé, Aplahoué, Ifangni
Regional marketplace Glazoué Djougou, Dogbo
Special status Cotonou, Parakou, Abomey-Calavi*
Tourism and craftmanship Abomey, Natitingou
*Note: Abomey-Calavi does not have a special status but it is often considered an extension of the capital city of Cotonou; thus, for the purposes of the study, it has been categorised as such.

34 PFM CAPABILITIES ASSESMENT REPORT SERIES / NO. 2
Appendix 2Distribution of operating and investment allocations and conditions for granting FADeC transfers from the state to municipalities
22 These are the Ministries of: Kindergarten and Primary Education, Secondary Education and Technical Training, Agriculture-Livestock Fisheries, Health, Living Environment and Sustainable Development, Infrastructure and Transport, Tourism-Culture-Sports, Water-Mines.
National budget Municipal budget Granting conditions
Operation MDLG Unallocated FADeC
Non-affected operating allocation
Allocated FADeC Studies and elaboration of Communal Development Plans (CDPs)
Affected operating allocation (Studies and development of CDPs)
Sectoral ministries22
Allocated FADeC (Maintenance and repair)
Affected operating allocation (Maintenance and repair)
Investment MDLG Unallocated FADeC
Unaffected investment grant following 3 criteria:
- An identical basic allocation for the 77 municipalities accounting for 14% and the remaining 86% distributed as follows:
- An equalisation grant calculated on the basis of the following criteria: size of the population (34%); area of the locality (15%); the incidence of poverty (34%).
- The performance allocation (17%) is based on the performance ratings obtained by each of the 77 municipalities.
- Existence of a PDC and other planning documents
- Achievement of a commitment rate for appropriations of at least 60% for the year N-1
- For the 1st instalment of the FADeC to the PS/CONAFIL of the original budget approved by the supervisory authority, the Annual Investment Plan (PAI) and the Public Procurement Plan (PPMP) of year N.
- For the second instalment of the FADeC the submission to the PS/CONAFIL of the rate of consumption of the credits available on March 31 of the year N.
Sectoral ministries
Allocated FADeC Affected investment allocation
Exclusively used according to the destination predefined by the ministry transferring the resources.
Source: FADeC 2016 Procedural Manual

Institutional and personnel capabilities for fiscal decentralisation in Benin 35
Appendix 3 List of central government directorates, prefectures and municipalities included in the personnel survey
Agriculture Élevage et Pêche
Commune d’Abomey
Commune d’Abomey-Calavi
Commune d’Aplahoué
Commune d’Athiémé
Commune d’Ifangni
Commune de Cotonou
Commune de Sèmè-Kpodji
Commune de Zè
Commune des Aguégués
Décentralisation et gouvernance locale
Enseignements maternel et primaire
Infrastructures et Transports
MEF/DGB (Budget)
MEF/DGID (Impôts)
MEF/DGTCP (Trésor)
MEF/DPP (MEF)
Préfecture de l’Atlantique
Préfecture de L’oueme
Préfecture du Couffo
Préfecture du Littoral
Préfecture du Mono
Préfecture du Plateau
Préfecture du Zou
Santé

36 PFM CAPABILITIES ASSESMENT REPORT SERIES / NO. 2
Appendix 4 Personnel questionnaire
The Collaborative Africa Budget Reform Initiative (CABRI) is partnering with the Ministry of Finance a to conduct a review of key capabilities for Public Financial Management in the Central African Republic. One of the objectives of the review is to examine the motivation, incentives, reform experiences and management practices of public officials working in the broad area of PFM. I am going to ask you some questions about yourself and your work. We are interviewing many officials like yourself in different offices, and no names or information to identify the persons will be recorded. We would, therefore, kindly request you to participate in this survey. The survey usually takes about 45 minutes to complete. Our conversation
here is private, and the researchers at CABRI will not reveal to anyone your name, or any other identifying information. Participation in the survey is voluntary. If any question makes you uncomfortable, please let me know. While participation is voluntary, answering all questions to the best of your knowledge is paramount to the success of the study.
Enumerator note: Additional codes for all questions - 90=Don’t know, 99=Refused to answer.
Enumerator states: Thank you. I would like to start the interview with a few general questions about yourself.
General Information
1.1 Name of the institution |__________________________________________________________|
1.2 Name of division/department/unit |__________________________________________________________|
1.3 Gender 01=Male 02=Female |___ ___|
1.4 Age Number of years |___ ___|
1.5 Current position of the respondent |__________________________________________________________|
1.6 How do you categorize your role in the organization? (Max. two choices, indicate primary and secondary categories)
01: Delivery function02: Regulatory function03: Coordination function04: Analytical function
1.7 How many years in the current position? |__________________________________________________________|
1.8 Previous position of the respondent |__________________________________________________________|
1.9 Years of experience in the current organization
Number of years |___ ___|
1.10 Years of work experience in the public sector
Number of years(including the current institution)
|___ ___|
1.11 Years of experience in the private sector
Number of years |___ ___|

Institutional and personnel capabilities for fiscal decentralisation in Benin 37
1.12 Highest level of education completed
01= Below Secondary02= Secondary 03= Post-secondary (non-degree)
04= Bachelor’s degree05= Master’s degree06= PhD07= Other (specify ________________)
|___ ___|
1.13 What is your field of study in the highest level of education? |__________________________________________________________|
Module I: Personal attributes and experiences
Enumerator states: Thank you. Now, I would like to ask about your career plans and motivations.
Section 1.1: Incentives and Motivation
2.1 What was the main reason you joined the public sector? [DO NOT PROMPT]
01= Training specific to public sector 02= Interest in public service 03= Better pay or benefits04= Only job opportunity available 05= Good career advancement prospect 06= Other (specify ________________)
|___ ___|
2.2 What was the main reason you joined this particular organization? [DO NOT PROMPT]
01= Training specific to organization02= Interest in organization’s work03= Better pay or benefits04= Only job opportunity available 05= Good career advancement prospect 06= Other (specify ________________)
|___ ___|
2.3 What did the hiring process involve when you were appointed to this position first?
01= External vacancy with interview02= Internal vacancy with interview 03= Direct transfer 04= Other (specify ________________)
|___ ___|
2.4 If you must pick one personal quality of yours that might have led to you being appointed to this position, what would it be?
|____________________________________|
2.5 Does your job have the opportunity for professional growth in your current organization?
01= Very high growth potential 02= High growth potential 03= Moderate growth potential04= Low growth opportunity05= Very low growth opportunity
|___ ___|

38 PFM CAPABILITIES ASSESMENT REPORT SERIES / NO. 2
2.6 How long would you wish to stay in the current position with the current organization?
01= less than a year02= 1-3 years 04= 4-5 years05= 6-10 years06= over 10 years
|___ ___|
2.7 If you leave the current organization, what would be the main reason for your departure?
01= Low pay 02= Lack of promotion03= Poor working conditions04= Lack of self-fulfillment 05= Political interference06= Other (specify ________________)
|___ ___|
2.8 Where do you aspire to move to if/when you leave the current organization?
01= Private sector 02= Start own business03= NGOs or International Organizations 04= Retirement 05= Other public sector agencies 06= Migrate to another country 07= Other (specify ________________)
|___ ___|
2.9 What do you think would be the most important contribution of your current job to your future career trajectory?
01= Years of experience 02= Network 03= Completed projects to showcase experience04= Not much contribution05= Other (specify ________________)
|___ ___|
2.10 How would you compare your base salary to those of private sector employees with roughly comparable age, training and responsibilities?
01= Much higher02= Higher03= Comparable04= Lower05= Much lower
|___ ___|
2.11 Do you receive fringe benefits (such as free housing, transport allowance) on top of basic salaries?
01= Yes02= No
|___ ___|
2.12 Considering your salary and fringe benefits, do you think what you earn from your current job is sufficient to meet basic expenses?
01= Yes02= No |___ ___|
2.13 Considering your salary and fringe benefits, do you think what you earn from your current job is fair?
01= Yes 02= No |___ ___|
2.14 What kind of recognition do you usually receive for good performance?
01= Verbal recognition from superiors 02= Written recognition from superiors 03= Pay/benefit raise 04= Fast-track promotion 05= Rarely recognized 06= Other
|___ ___|
2.15 How motivated do you think are public servants in your unit in carrying out their responsibilities?
01= Highly motivated 02= Motivated03= Neither motivated nor unmotivated 04= Unmotivated 05= Highly unmotivated
|___ ___|
2.16 To what extent do you think has your unit’s performance been hampered by not having the right people in the right positions?
01= To a great extent02= To some extent 03= To a small extent 04= Not at all
|___ ___|

Institutional and personnel capabilities for fiscal decentralisation in Benin 39
Enumerator states: Thank you. Now, I would like to ask about your experience with reform activities in your unit.
Section 1.2: Reform and Innovation Experience
3.1 How are new ideas and practices usually introduced in your work environment? (Max two choices; indicate order of importance)
01= Initiated by superior government agency 02= Initiated by organization’s leadership 03= Initiated by organization’s staff 04= Proposed by consultants 05= Proposed by development partners 06= Other (specify ________________)
|___ ___|
3.2 How difficult is it to convince your hierarchy to start implementing a new idea?
01= Very difficult 02= Moderately difficult 03= Neither difficult nor easy04= Moderately easy05= Very easy
|___ ___|
3.3 How difficult is it to convince your colleagues to start implementing a new idea?
01= Very difficult 02= Moderately difficult 03= Neither difficult nor easy04= Moderately easy05= Very easy
|___ ___|
3.4 What does motivate you to initiate or try a new idea or practice? [DO NOT PROMPT] (Max two choices; indicate order of importance)
01= Superior’s pressure to deliver 02= Peer encouragement and recognition 03= External party requirements 04= Potential payoff in career advancement 05= Prospect of attracting additional resources06= Dedication to public service07= Other (specify ________________)
|___ ___|
3.5 What do you think does usually motivate your managers to initiate or try a new idea or practice? [DO NOT PROMPT](Max two choices; indicate order of importance)
01= Political pressure 02= Peer encouragement and recognition 03= External party requirement 04= Potential payoff in career advancement 05= Prospect of attracting additional resources06= Dedication to public service07= Other (specify ________________)
|___ ___|
3.6 What are the most common reasons in your unit for failing to try new ideas that may eventually improve performance?(Max two choices; indicate order of importance)
01= Strong trust in established practices 02= Lack of authorization 03= Uncertainty about effectiveness of new ideas04= Lack of relevant expertise 05= Fear of punishment in case of failure 06= Other (specify ________________)
|___ ___|
3.7 What are the most common drivers behind improved performance in your unit? [DO NOT PROMPT])
01= Successful application of best practices 02= Experimentation 03= Insightful leadership 04= Mutual learning between teams 05= Other (specify ________________)
|___ ___|
3.8 What is the most common consequence of a failed reform in your unit? |_____________________________________|
3.9 How are reform initiatives sequenced in your unit? [DO NOT PROMPT]
01= Most basic reforms are rolled out first 02= Related reforms are rolled out together03= Comprehensive reforms are given priority 03= Reforms are rolled out in random order 04= Other (specify ________________)
|___ ___|
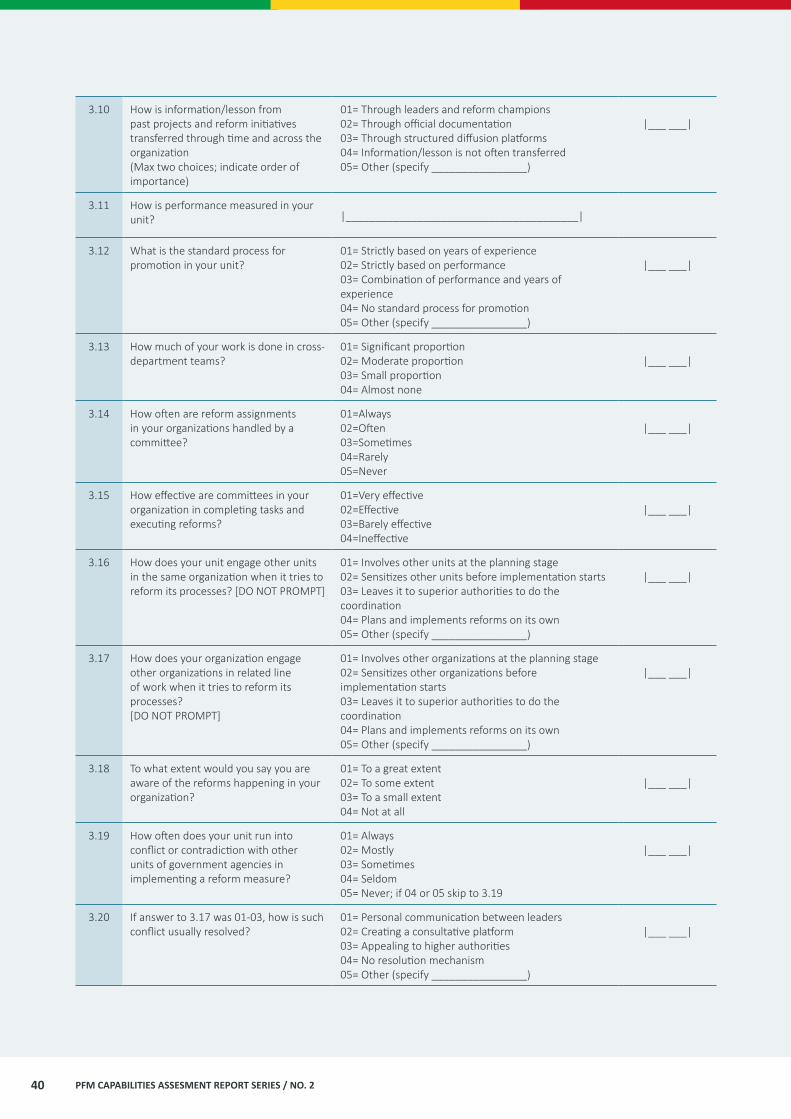
40 PFM CAPABILITIES ASSESMENT REPORT SERIES / NO. 2
3.10 How is information/lesson from past projects and reform initiatives transferred through time and across the organization(Max two choices; indicate order of importance)
01= Through leaders and reform champions02= Through official documentation 03= Through structured diffusion platforms 04= Information/lesson is not often transferred 05= Other (specify ________________)
|___ ___|
3.11 How is performance measured in your unit? |_______________________________________|
3.12 What is the standard process for promotion in your unit?
01= Strictly based on years of experience 02= Strictly based on performance 03= Combination of performance and years of experience 04= No standard process for promotion 05= Other (specify ________________)
|___ ___|
3.13 How much of your work is done in cross-department teams?
01= Significant proportion 02= Moderate proportion 03= Small proportion 04= Almost none
|___ ___|
3.14 How often are reform assignments in your organizations handled by a committee?
01=Always02=Often 03=Sometimes 04=Rarely05=Never
|___ ___|
3.15 How effective are committees in your organization in completing tasks and executing reforms?
01=Very effective02=Effective 03=Barely effective 04=Ineffective
|___ ___|
3.16 How does your unit engage other units in the same organization when it tries to reform its processes? [DO NOT PROMPT]
01= Involves other units at the planning stage02= Sensitizes other units before implementation starts03= Leaves it to superior authorities to do the coordination 04= Plans and implements reforms on its own05= Other (specify ________________)
|___ ___|
3.17 How does your organization engage other organizations in related line of work when it tries to reform its processes?[DO NOT PROMPT]
01= Involves other organizations at the planning stage02= Sensitizes other organizations before implementation starts03= Leaves it to superior authorities to do the coordination 04= Plans and implements reforms on its own05= Other (specify ________________)
|___ ___|
3.18 To what extent would you say you are aware of the reforms happening in your organization?
01= To a great extent02= To some extent 03= To a small extent 04= Not at all
|___ ___|
3.19 How often does your unit run into conflict or contradiction with other units of government agencies in implementing a reform measure?
01= Always02= Mostly03= Sometimes04= Seldom05= Never; if 04 or 05 skip to 3.19
|___ ___|
3.20 If answer to 3.17 was 01-03, how is such conflict usually resolved?
01= Personal communication between leaders02= Creating a consultative platform03= Appealing to higher authorities 04= No resolution mechanism 05= Other (specify ________________)
|___ ___|

Institutional and personnel capabilities for fiscal decentralisation in Benin 41
3.21 What are the most common modalities for your organization to engage with development partners?
01= Direct funding of programs and projects 02= Technical assistance 03= Combination of funding and technical assistance 04= Other (specify ________________)
|___ ___|
3.22 How often do external consultants or seconded personnel involve in the day to day activities of your unit?
01= Always02= Mostly03= Sometimes04= Seldom05= Never
|___ ___|
3.23 How often do external consultants or seconded personnel involve in reform initiatives of your unit?
01= Always02= Mostly03= Sometimes04= Seldom05= Never
|___ ___|
3.24 In general, how much of the work done by consultants or seconded personnel do you think can be done by internal staff?
01= Almost all02= A significant portion 03= Some of it04= A limited amount05= None
|___ ___|
Enumerator states: Thank you. Now, I would like to ask about training and capacity building issues.
Section 1.3: Capacity Building
4.1 How often do you take on-the-job training in subject areas relevant for your core activities?
01=Quarterly 02=Twice a year03=Annually04=Rarely 05=Never; if 05 skip to 4.3
|___ ___|
4.2 Do you think the trainings you usually receive are well targeted to meet your needs?
01= Well targeted 02= Partially targeted03= Not targeted
|___ ___|
4.3 What are the top two areas in which you need further training to work more effectively?
|______________________________________________|
|______________________________________________|
4.4 How well do the capacity building activities of your organization keep up with reforms that require new or refresher training?
01=Very well02=Fairly well 03=Not that well04=Poorly
|___ ___|
4.5 What other mediums do you use to increase your capacity and keep your knowledge up-to-date?
01= Online course 02= Continuing education classes 03= Conferences 04= Books and other publications05= Other (specify ________________)
|___ ___|
4.6 What technologies do you use on a regular basis to carry out your duties?
01= Customized software packages02= Standard spreadsheet and word 03= Internet and web-based services 04= Little technology used 05= Other (specify ________________)
|___ ___|

42 PFM CAPABILITIES ASSESMENT REPORT SERIES / NO. 2
4.7 Where do you normally get data that you may need for analysis or decision making in your work?
01= Internally generated within the organization 02= Other government agencies 03= Universities and civil society04= International organisations 05= Other (specify ________________)
|___ ___|
4.8 How reliable is the data you receive through government channels for the purpose of your work?
01= Very reliable 02= Somehow reliable 03= Poorly reliable 04= Unreliable
|___ ___|
4.9 Did you have a senior colleague who mentored you professionally when you got into your current position for the first time?
01=Yes02=No skip to 4.10 |___ ___|
4.10 If yes, is the senior colleague still working with the organization?
01= Yes skip to 4.1002= No |___ ___|
4.11 If no, why do you think s/he left the organization?
01= Transferred to another public agency02= Got better offer in the private sector03= Retired 04= Fired 05= Migrated to another country06= Other (specify ________________)
|___ ___|
4.12 How long have you worked with your current immediate colleagues in months?
4.10.1. Immediate boss: _____ months
4.10.2. Horizontal colleagues (on average): _____ months
4.10.3. Immediate subordinates (on average): _____ months
4.13 How often do you have to attend meetings and trainings without direct connection to your current responsibility?
01= Always02= Mostly03= Sometimes04= Seldom05= Never
|___ ___|
4.14 How do you evaluate the contributions of these meetings in discharging your responsibility effectively?
01= Very high contribution 02= High contribution03= Moderate contribution04= Low contribution05= Very low contribution
|___ ___|

Institutional and personnel capabilities for fiscal decentralisation in Benin 43

44 PFM CAPABILITIES ASSESMENT REPORT SERIES / NO. 2
For information on CABRI, or to obtain copies of this publication, please contact:
CABRI Secretariat Cnr John Vorster & Nellmapius Drive, Centurion, 0062 South Africa
Telephone: +27 (0)12 492 0022 Email: [email protected] www.cabri-sbo.org