PFIZER REPORTS THIRD-QUARTER 2010 RESULTS
24
PFIZER REPORTS THIRD-QUARTER 2010 RESULTS Third-Quarter 2010 Revenues of $16.2 Billion Third-Quarter 2010 Adjusted Diluted EPS (1) of $0.54; Reported Diluted EPS (2) of $0.11 Tightens Ranges for 2010 Financial Guidance Components, Increases Range for Adjusted Diluted EPS (1) and Reduces Range for Reported Diluted EPS (2) ; Reaffirms 2012 Financial Targets Advances Strategic Priorities with Agreement to Acquire King Pharmaceuticals, Inc., Acquisition of FoldRx, Alliance with Biocon and Pending Alliance with Laboratorio Teuto Brasileiro S.A.; Reviewing Alternatives for Capsugel ($ in millions, except per share amounts) Third-Quarter Year-to-Date 2010 2009 Change 2010 2009 Change Reported Revenues $ 16,171 $ 11,621 39% $ 50,248 $ 33,472 50% Reported Net Income (2) 866 2,878 (70%) 5,367 7,868 (32%) Reported Diluted EPS (2) 0.11 0.43 (74%) 0.66 1.16 (43%) Adjusted Income (1) 4,372 3,461 26% 14,213 10,377 37% Adjusted Diluted EPS (1) 0.54 0.51 6% 1.76 1.54 14% See end of text prior to tables for notes. NEW YORK, N.Y., Tuesday, November 2, 2010 – Pfizer Inc. (NYSE: PFE) today reported financial results for third-quarter 2010. Since the acquisition of Wyeth was completed on October 15, 2009, legacy Wyeth products and operations are reflected in the first three quarters of 2010, but not reflected in the first three quarters of 2009. Third-quarter 2010 revenues were $16.2 billion, an increase of 39% compared with $11.6 billion in the year-ago quarter. Revenues for third-quarter 2010 compared with the year-ago quarter were favorably impacted by $5.2 billion, or 44%, due to the addition of the legacy Wyeth products, negatively impacted by $458 million, or 4%, due to legacy Pfizer products, and negatively impacted by $160 million, or 1%, due to foreign exchange. For third-quarter 2010, U.S. revenues were $7.1 billion, an increase of 48% compared with the year-ago quarter. International revenues were $9.1 billion, an increase of 33% compared with the prior-year quarter, which reflected 35% operational growth partially offset by a 2% unfavorable impact of foreign exchange. U.S. revenues represented 44% of total revenues in third-quarter 2010 compared with 41% in the year-ago quarter, while international revenues represented 56% of total revenues in third-quarter 2010 compared with 59% in the year-ago quarter.
Transcript of PFIZER REPORTS THIRD-QUARTER 2010 RESULTS

PFIZER REPORTS THIRD-QUARTER 2010 RESULTS Third-Quarter 2010 Revenues of $16.2 Billion
Third-Quarter 2010 Adjusted Diluted EPS(1) of $0.54; Reported Diluted EPS(2) of $0.11
Tightens Ranges for 2010 Financial Guidance Components, Increases Range for Adjusted
Diluted EPS(1) and Reduces Range for Reported Diluted EPS(2); Reaffirms 2012 Financial Targets
Advances Strategic Priorities with Agreement to Acquire King Pharmaceuticals, Inc.,
Acquisition of FoldRx, Alliance with Biocon and Pending Alliance with Laboratorio Teuto Brasileiro S.A.; Reviewing Alternatives for Capsugel
($ in millions, except per share amounts) Third-Quarter Year-to-Date 2010 2009 Change 2010 2009 Change Reported Revenues $ 16,171 $ 11,621 39% $ 50,248 $ 33,472 50% Reported Net Income(2) 866 2,878 (70%) 5,367 7,868 (32%) Reported Diluted EPS(2) 0.11 0.43 (74%) 0.66 1.16 (43%) Adjusted Income(1) 4,372 3,461 26% 14,213 10,377 37% Adjusted Diluted EPS(1) 0.54 0.51 6% 1.76 1.54 14%
See end of text prior to tables for notes.
NEW YORK, N.Y., Tuesday, November 2, 2010 – Pfizer Inc. (NYSE: PFE) today reported
financial results for third-quarter 2010. Since the acquisition of Wyeth was completed on
October 15, 2009, legacy Wyeth products and operations are reflected in the first three quarters
of 2010, but not reflected in the first three quarters of 2009. Third-quarter 2010 revenues were
$16.2 billion, an increase of 39% compared with $11.6 billion in the year-ago quarter. Revenues
for third-quarter 2010 compared with the year-ago quarter were favorably impacted by $5.2
billion, or 44%, due to the addition of the legacy Wyeth products, negatively impacted by $458
million, or 4%, due to legacy Pfizer products, and negatively impacted by $160 million, or 1%,
due to foreign exchange. For third-quarter 2010, U.S. revenues were $7.1 billion, an increase of
48% compared with the year-ago quarter. International revenues were $9.1 billion, an increase
of 33% compared with the prior-year quarter, which reflected 35% operational growth partially
offset by a 2% unfavorable impact of foreign exchange. U.S. revenues represented 44% of total
revenues in third-quarter 2010 compared with 41% in the year-ago quarter, while international
revenues represented 56% of total revenues in third-quarter 2010 compared with 59% in the
year-ago quarter.

- 2 -
For the first nine months of 2010, revenues were $50.2 billion, an increase of 50% compared with $33.5
billion in the same period in 2009. Revenues for the first nine months of 2010 compared with the year-
ago period were favorably impacted by $15.9 billion, or 48%, due to the addition of the legacy Wyeth
products, and by $1.2 billion, or 3%, due to foreign exchange, and negatively impacted by $285 million,
or 1%, due to legacy Pfizer products. U.S. revenues were $21.8 billion, an increase of 52% compared
with the first nine month of 2009. International revenues were $28.4 billion, an increase of 48%
compared with the same period last year, which reflected 42% operational growth and a 6% favorable
impact of foreign exchange. U.S. revenues represented 43% and international revenues represented 57%
of total revenues in the first nine months of 2010, comparable with the first nine months of 2009. Business Revenues
Pfizer operates two distinct commercial organizations: Biopharmaceutical and Diversified.
Biopharmaceutical includes the Primary Care, Specialty Care, Established Products, Emerging Markets
and Oncology customer-focused units, while Diversified includes Animal Health, Consumer Healthcare,
Nutrition and Capsugel.
Third-Quarter(13) Operational
($ in millions) 2010 2009(13) Change Foreign Exchange
Total Legacy Pfizer
Primary Care(3) $ 5,653 $ 5,540 2% (1%) 3% (3%) Specialty Care(4) 3,717 1,577 136% (6%) 142% (1%) Established Products(5) 2,168 1,657 31% (1%) 32% (13%) Emerging Markets(6) 2,072 1,529 36% 2% 34% -- Oncology(7) 335 374 (10%) (4%) (6%) (15%)
Biopharmaceutical 13,945 10,677 31% (2%) 33% (4%)
Animal Health(8) 860 678 27% (1%) 28% 5% Consumer Healthcare(9) 673 -- N/A N/A N/A N/A Nutrition(10) 441 -- N/A N/A N/A N/A Capsugel(11) 176 177 (1%) (3%) 2% 2%
Diversified 2,150 855 151% -- 151% 4%
Other(12) 76 89 (15%) 16% (31%) (31%)
Total $ 16,171 $ 11,621 39% (1%) 40% (4%)
See end of text prior to tables for notes.
N/A – Not applicable

- 3 -
For third-quarter 2010, revenues from Biopharmaceutical were $13.9 billion, an increase of 31%
compared with $10.7 billion in the year-ago quarter. Operationally, revenues increased $3.4 billion, or
33%, which included $3.9 billion, or 37%, attributable to legacy Wyeth products, primarily Premarin in
the Primary Care unit, Enbrel and the Prevnar/Prevenar franchise in the Specialty Care unit, Protonix
and Zosyn/Tazocin in the Established Products unit as well as Enbrel and the Prevenar franchise in the
Emerging Markets unit, partially offset by a decline of $468 million, or 4%, due to legacy Pfizer
products. In addition, foreign exchange unfavorably impacted Biopharmaceutical revenues by 2% or
$173 million.
Within the Biopharmaceutical units, legacy Pfizer operational performance was impacted in third-
quarter 2010 compared with the year-ago quarter primarily by the loss of exclusivity of certain products
and by the resulting reclassification of Camptosar European revenues among the units. Legacy Pfizer
Primary Care unit revenues in third-quarter 2010 were negatively impacted by 4% due to the loss of
exclusivity of Lipitor in Canada in May 2010 and in Spain in July 2010. Legacy Pfizer Oncology unit
revenues no longer include Camptosar’s European revenues due to its loss of exclusivity in July 2009.
Camptosar’s European revenues are included in the Established Products unit beginning in first-quarter
2010. This reclassification of revenues negatively impacted the legacy Pfizer Oncology unit’s
performance by 16% in third-quarter 2010 compared with the prior-year quarter. Further, legacy Pfizer
Established Products unit revenues in third-quarter 2010 were adversely impacted by 6% due to the loss
of exclusivity for Norvasc in Canada in July 2009, partially offset by the favorable impact of 1% due to
the addition of Camptosar’s European revenues. Finally, legacy Pfizer Emerging Markets unit revenues
in third-quarter 2010 were essentially flat reflecting solid growth in key priority countries, most notably
China, offset by Eastern European pricing pressure and wholesaler purchasing patterns driven by
economic conditions.
For third-quarter 2010, revenues from Diversified were $2.2 billion, an increase of 151% compared with
$855 million in the year-ago quarter. This increase of $1.3 billion was primarily attributable to legacy
Wyeth products, principally Centrum, Advil and Caltrate in Consumer Healthcare and infant and toddler
Nutrition products. The impact of foreign exchange on Diversified revenues was immaterial.
- 4 -
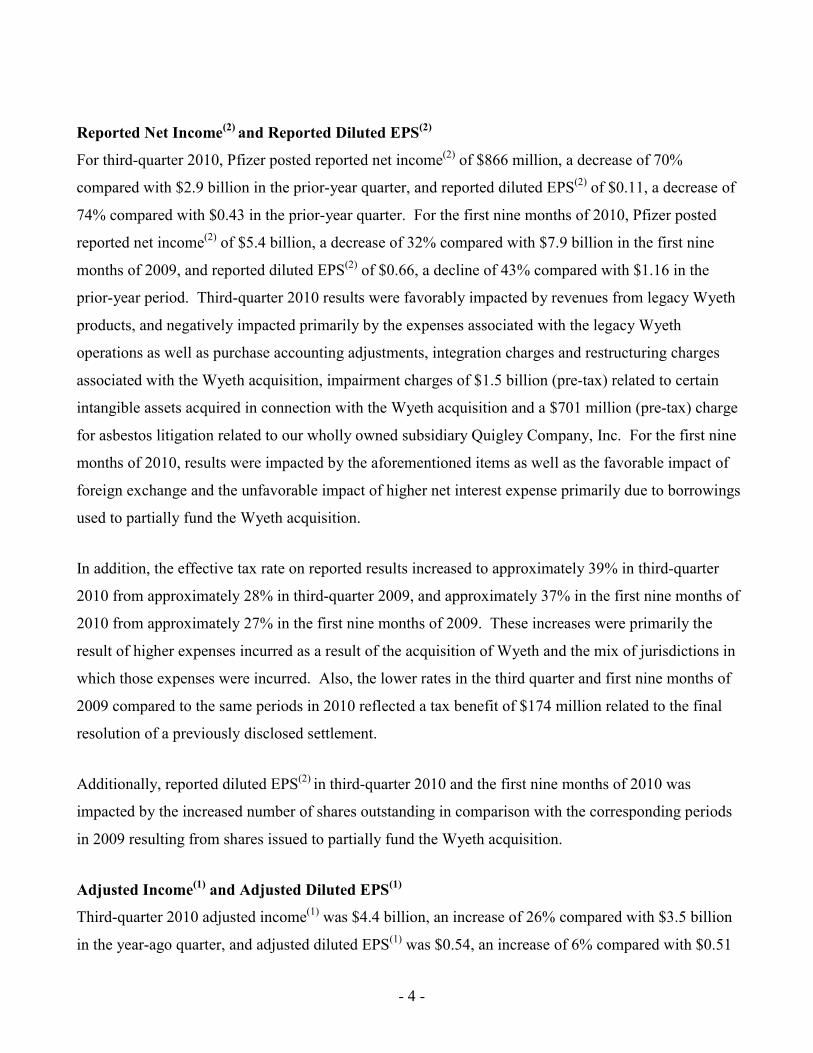
Reported Net Income(2) and Reported Diluted EPS(2)
For third-quarter 2010, Pfizer posted reported net income(2) of $866 million, a decrease of 70%
compared with $2.9 billion in the prior-year quarter, and reported diluted EPS(2) of $0.11, a decrease of
74% compared with $0.43 in the prior-year quarter. For the first nine months of 2010, Pfizer posted
reported net income(2) of $5.4 billion, a decrease of 32% compared with $7.9 billion in the first nine
months of 2009, and reported diluted EPS(2) of $0.66, a decline of 43% compared with $1.16 in the
prior-year period. Third-quarter 2010 results were favorably impacted by revenues from legacy Wyeth
products, and negatively impacted primarily by the expenses associated with the legacy Wyeth
operations as well as purchase accounting adjustments, integration charges and restructuring charges
associated with the Wyeth acquisition, impairment charges of $1.5 billion (pre-tax) related to certain
intangible assets acquired in connection with the Wyeth acquisition and a $701 million (pre-tax) charge
for asbestos litigation related to our wholly owned subsidiary Quigley Company, Inc. For the first nine
months of 2010, results were impacted by the aforementioned items as well as the favorable impact of
foreign exchange and the unfavorable impact of higher net interest expense primarily due to borrowings
used to partially fund the Wyeth acquisition. In addition, the effective tax rate on reported results increased to approximately 39% in third-quarter
2010 from approximately 28% in third-quarter 2009, and approximately 37% in the first nine months of
2010 from approximately 27% in the first nine months of 2009. These increases were primarily the
result of higher expenses incurred as a result of the acquisition of Wyeth and the mix of jurisdictions in
which those expenses were incurred. Also, the lower rates in the third quarter and first nine months of
2009 compared to the same periods in 2010 reflected a tax benefit of $174 million related to the final
resolution of a previously disclosed settlement.
Additionally, reported diluted EPS(2) in third-quarter 2010 and the first nine months of 2010 was
impacted by the increased number of shares outstanding in comparison with the corresponding periods
in 2009 resulting from shares issued to partially fund the Wyeth acquisition.
Adjusted Income(1) and Adjusted Diluted EPS(1)
Third-quarter 2010 adjusted income(1) was $4.4 billion, an increase of 26% compared with $3.5 billion
in the year-ago quarter, and adjusted diluted EPS(1) was $0.54, an increase of 6% compared with $0.51

- 5 -
in the year-ago quarter. For the first nine months of 2010, Pfizer posted adjusted income(1) of $14.2
billion, an increase of 37% compared with $10.4 billion in the first nine months of 2009, and adjusted
diluted EPS(1) of $1.76, an increase of 14% compared with $1.54 in the prior-year period. Results were
favorably impacted by revenues from legacy Wyeth products and, to a lesser extent, foreign exchange,
which were partially offset by the expenses associated with the legacy Wyeth operations as well as
lower overall revenues from legacy Pfizer products and higher net interest expense primarily due to
borrowings used to partially fund the acquisition of Wyeth.
In addition, the effective tax rate on adjusted income(1) decreased to approximately 30% in third-quarter
2010 compared with approximately 32% in third-quarter 2009, and increased to approximately 31% in
the first nine months of 2010 compared with approximately 30% in the first nine months of 2009. The
changes in the effective tax rate on adjusted income(1) were primarily the result of the change in the
jurisdictional mix of earnings in the respective periods.
Additionally, adjusted diluted EPS(1) in third-quarter 2010 and the first nine months of 2010 was
impacted by the increased number of shares outstanding in comparison with the corresponding periods
in 2009 resulting from shares issued to partially fund the Wyeth acquisition.
In third-quarter 2010, adjusted cost of sales(1) as a percentage of revenues was 18.3% compared with
15.4% in third-quarter 2009. This increase primarily reflects the change in the mix of products and
businesses as a result of the Wyeth acquisition. Excluding the impact of foreign exchange, adjusted cost
of sales(1) as a percentage of revenues was 19.7% in third-quarter 2010.
Adjusted SI&A expenses(1) were $4.6 billion in third-quarter 2010, an increase of 43% compared with
$3.2 billion in the prior-year quarter. This increase was attributable primarily to the addition of the
legacy Wyeth operations. Foreign exchange decreased third-quarter 2010 adjusted SI&A expenses(1) by
$32 million compared with the year-ago quarter.
Adjusted R&D expenses(1) were $2.2 billion in third-quarter 2010, an increase of 33% compared with
$1.6 billion in the prior-year period. This increase was attributable primarily to the addition of the legacy
Wyeth operations and continued investment in the late-stage development portfolio. Foreign exchange

- 6 -
decreased third-quarter 2010 adjusted R&D expenses(1) by $15 million compared with the year-ago
quarter.
Overall, foreign exchange decreased adjusted total costs(14) by $298 million, or 4%, in third-quarter 2010
compared with the prior-year period.
Executive Commentary
Jeff Kindler, Chairman and Chief Executive Officer, stated, “It’s been just over a year since the closing
of the Wyeth acquisition. I am particularly pleased with the speed of the integration, the cost synergies
achieved to date as well as our solid financial performance this quarter and year-to-date in this difficult
economic environment. This combination is clearly creating opportunities to provide greater value for
our shareholders.”
“We continue to carefully evaluate and make prudent capital allocation decisions. We recently
announced several business development transactions that we believe will enhance shareholder value by
enabling continued growth in several of our business units. Our pending acquisition of King
Pharmaceuticals, Inc. is consistent with our stated objective of seeking a larger presence in the pain
market within the Primary Care unit, while our acquisition of FoldRx enhances the orphan and rare
disease pipeline portfolio of our Specialty Care unit. Further, our alliance with Biocon is expected to
advance our biosimilars strategy by positioning us competitively in the diabetes market over time, while
our agreement with Laboratorio Teuto Brasileiro S.A. is expected to broaden our Emerging Markets
presence. Also, we are reviewing strategic alternatives for Capsugel in order to optimize the value of
this asset. We believe these actions, taken together, will serve to improve our business profile and
provide both near-term and longer-term financial benefit,” continued Mr. Kindler.
Frank D’Amelio, Chief Financial Officer, stated, “Given our solid year-to-date performance and
continued confidence in the business, we are once again reaffirming our 2012 financial targets, and we
are narrowing the ranges for the components of our 2010 financial guidance. Additionally, we are
increasing our 2010 adjusted diluted EPS(1) guidance to a range of $2.17 to $2.22 from a range of $2.10
to $2.20. Further, we repurchased approximately $500 million, or 30 million shares, of our common

- 7 -
stock in the third quarter, and we continue to review our capital allocation options with the goal of
maximizing value for our shareholders.”
2010 Financial Guidance(16)
For full-year 2010, Pfizer’s financial guidance, at current exchange rates(15), is summarized below.
Reported Revenues $67.0 to $68.0 billion (previously $67.0 to $69.0 billion)
Adjusted Cost of Sales(1) as a Percentage of Revenues 18.5% to 19.0% (previously 19.0% to 20.0%)
Adjusted SI&A Expenses(1) $19.2 to $19.7 billion (previously $19.0 to $20.0 billion)
Adjusted R&D Expenses(1) $9.1 to $9.5 billion (previously $9.1 to $9.6 billion)
Adjusted Other (Income)/Deductions(1) Approximately $1.0 billion (previously $1.2 to $1.4 billion)
Effective Tax Rate on Adjusted Income(1) Approximately 30% Reported Diluted EPS(2) $0.84 to $0.94
(previously $0.95 to $1.10) Adjusted Diluted EPS(1) $2.17 to $2.22
(previously $2.10 to $2.20)
2012 Financial Targets
The Company is reaffirming all elements of its 2012 financial targets. As previously stated, given the
longer-term nature of these targets, they are subject to greater variability and less certainty as a result of
potential material impacts related to foreign exchange fluctuations, macroeconomic activity including
inflation, and industry-specific challenges including changes to government healthcare policy, among
others.
For 2012, at current exchange rates(15), Pfizer is targeting reported revenues between $65.2 and $67.7
billion, reported diluted EPS(2) between $1.58 and $1.73, adjusted diluted EPS(1) between $2.25 and
$2.35, adjusted R&D expenses(1) between $8.0 and $8.5 billion, adjusted operating margin(1) in a range
of the high 30%s to low 40%s and adjusted other (income)/deductions(1) between $1.0 and $1.2 billion in
deductions. The effective tax rate on adjusted income(1) is targeted at approximately 30%, while
operating cash flow is expected to be at least $19.0 billion.

- 8 -
Additionally, the Company remains on-track to achieve the cost-reduction target of approximately $4 to
$5 billion, by the end of 2012, at 2008 average foreign exchange rates, in comparison with the 2008 pro-
forma adjusted total costs(14) of the legacy Pfizer and legacy Wyeth operations.
For additional details, please see the attached financial schedules, product revenue tables,
supplemental information and disclosure notice.
(1) "Adjusted Income" and its components and "Adjusted Diluted Earnings Per Share (EPS)" are
defined as reported net income(2) and its components and reported diluted EPS(2) excluding purchase accounting adjustments, acquisition-related costs, discontinued operations and certain significant items. Adjusted Cost of Sales, Adjusted SI&A expenses, Adjusted R&D expenses and Adjusted Other (Income)/Deductions are income statement line items prepared on the same basis, and therefore, components of the overall adjusted income measure. As described under Adjusted Income in the Management’s Discussion and Analysis of Financial Condition and Results of Operations section of Pfizer's Form 10-Q for the fiscal quarter ended July 4, 2010, management uses adjusted income, among other factors, to set performance goals and to measure the performance of the overall company. We believe that investors' understanding of our performance is enhanced by disclosing this measure. Reconciliations of third-quarter 2010 and 2009 and the first nine months of 2010 and 2009 adjusted income and its components and adjusted diluted EPS to reported net income(2) and its components and reported diluted EPS(2), as well as reconciliations of full-year 2010 guidance and 2012 targets for adjusted income and adjusted diluted EPS to full-year 2010 guidance and 2012 targets for reported net income(2) and reported diluted EPS(2), are provided in the materials accompanying this report. The adjusted income and its components and adjusted diluted EPS measures are not, and should not be viewed as, substitutes for U.S. generally accepted accounting principles (GAAP) net income and its components and diluted EPS.
(2) “Reported Net Income” is defined as net income attributable to Pfizer Inc. in accordance with U.S. generally accepted accounting principles. “Reported Diluted EPS” is defined as reported diluted EPS attributable to Pfizer Inc. common shareholders in accordance with U.S. GAAP.
(3) The Primary Care unit includes revenues from human pharmaceutical products primarily
prescribed by primary-care physicians, and may include, but are not limited to, products in the following therapeutic and disease areas: Alzheimer’s disease, anxiety, cardiovascular (excluding pulmonary arterial hypertension), diabetes, pain, genitourinary, obesity, osteoporosis and respiratory. Examples of products in this unit include, but are not limited to, Celebrex, Lipitor, Lyrica, Premarin, Pristiq and Viagra. All revenues for such products are allocated to the Primary Care unit, except those generated in emerging markets(6) and those that are managed by the Established Products(5) unit.
(4) The Specialty Care unit includes revenues from human pharmaceutical products primarily
prescribed by physicians who are specialists, and may include, but are not limited to, products in the following therapeutic and disease areas: antibacterials, antifungals, antivirals, bone, inflammation, gastrointestinal, growth hormones, multiple sclerosis, ophthalmology, pulmonary

- 9 -
arterial hypertension and psychosis. Examples of products in this unit include, but are not limited to, Enbrel, Genotropin, Geodon, the Prevnar/Prevenar franchise, Xalatan and Zyvox. All revenues for such products are allocated to the Specialty Care unit, except those generated in emerging markets(6) and those that are managed by the Established Products(5) unit.
(5) The Established Products unit generally includes revenues from human prescription
pharmaceutical products that have lost patent protection or marketing exclusivity in certain countries and/or regions. In certain situations, products may be transferred to this unit before losing patent protection or marketing exclusivity in order to maximize their value. This unit also excludes revenues generated in emerging markets(6). Examples of products in this unit include, but are not limited to, Arthrotec, Effexor, Medrol, Norvasc, Protonix, Relpax and Zosyn/Tazocin.
(6) The Emerging Markets unit includes revenues from all human prescription pharmaceutical
products sold in emerging markets, including, but not limited to, Asia (excluding Japan and South Korea), Latin America, Middle East, Africa, Central and Eastern Europe, Russia and Turkey.
(7) The Oncology unit includes revenues from human oncology and oncology-related products. Examples of products in this unit include, but are not limited to, Aromasin, Sutent and Torisel. All revenues for such products are allocated to the Oncology unit, except those generated in emerging markets(6) and those that are managed by the Established Products(5) unit.
(8) Animal Health includes worldwide revenues from products to prevent and treat disease in
livestock and companion animals, including vaccines, paraciticides and anti-infectives. (9) Consumer Healthcare generally includes worldwide revenues from non-prescription medicines
and vitamins and may include, but are not limited to, products in the following therapeutic categories: pain management, nutritionals, respiratory and GI-topicals. Examples of products in Consumer Healthcare include, but are not limited to, Advil, Centrum, Caltrate, ChapStick and Robitussin.
(10) Nutrition generally includes revenues from a full line of infant and toddler nutritional products
sold outside of North America. Examples of products in Nutrition include, but are not limited to, the S-26 and SMA product lines as well as formula for infants with special nutritional needs.
(11) Capsugel generally includes worldwide revenues from capsule products and services for the
pharmaceutical and associated healthcare industries. On October 6, 2010, the Company announced that it is reviewing strategic alternatives for Capsugel, which may include a divestiture.
(12) Includes revenues generated primarily from Pfizer Centersource.
(13) In Biopharmaceutical, revenues from South Korea in 2009 have been reclassified from the
Emerging Markets unit to the appropriate developed market units to conform to the current-year
- 10 -
presentation, which reflects the fact that the commercial operations of South Korea, effective January 1, 2010, are managed within the appropriate developed market units.
(14) Represents the total of Adjusted Cost of Sales(1), Adjusted SI&A expenses(1) and Adjusted R&D expenses(1).
(15) The current exchange rates assumed in connection with the 2010 financial guidance are a blend
of the average of the actual exchange rates in effect from December 2009 through September 2010 and the mid-October 2010 exchange rates for the remainder of the year. The current exchanges rates assumed in connection with the 2012 financial targets are the mid-October 2010 exchange rates.
(16) This guidance does not assume the completion of any business-development transactions not
completed as of October 3, 2010, with the exception of the Biocon transaction. This guidance also excludes the potential effects of the resolution of litigation-related matters not substantially resolved as of October 3, 2010.
Contacts: Media Investors Joan Campion 212.733.2798 Suzanne Harnett 212.733.8009 Jennifer Davis 212.733.0717

Third Quarter % Incr. / Nine Months % Incr. /2010 2009 (Decr.) 2010 2009 (Decr.)
Revenues $ 16,171 $ 11,621 39 $ 50,248 $ 33,472 50Costs and expenses:
Cost of sales (a) 3,896 1,789 118 11,997 4,953 142
Selling, informational and administrative expenses (a) 4,633 3,282 41 13,876 9,508 46
Research and development expenses (a) 2,194 1,632 34 6,607 5,032 31Amortization of intangible assets 1,156 594 95 3,972 1,755 126Acquisition-related in-process research and development charges - - - 74 20 270Restructuring charges and certain acquisition-related costs 499 193 159 2,091 1,206 73Other deductions--net 2,353 160 * 3,038 175 *
Income from continuing operations before provisionfor taxes on income 1,440 3,971 (64) 8,593 10,823 (21)
Provision for taxes on income 564 1,092 (48) 3,198 2,952 8Income from continuing operations 876 2,879 (70) 5,395 7,871 (31)Discontinued operations--net of tax (5) 2 * (4) 6 *Net income before allocation to noncontrolling interests 871 2,881 (70) 5,391 7,877 (32)Less: Net income attributable to noncontrolling interests 5 3 67 24 9 167Net income attributable to Pfizer Inc. $ 866 $ 2,878 (70) $ 5,367 $ 7,868 (32)
Earnings per share - basic:Income from continuing operations attributable to Pfizer Inc. common shareholders $ 0.11 $ 0.43 (74) $ 0.67 $ 1.17 (43)Discontinued operations--net of tax - - -- - - --Net income attributable to Pfizer Inc. common shareholders $ 0.11 $ 0.43 (74) $ 0.67 $ 1.17 (43)
Earnings per share - diluted:Income from continuing operations attributable to Pfizer Inc. common shareholders $ 0.11 $ 0.43 (74) $ 0.66 $ 1.16 (43)Discontinued operations--net of tax - - -- - - --Net income attributable to Pfizer Inc. common shareholders $ 0.11 $ 0.43 (74) $ 0.66 $ 1.16 (43)
Basic 8,027 6,730 8,045 6,727 Diluted 8,057 6,762 8,079 6,758
(a) Exclusive of amortization of intangible assets, except as discussed in footnote 3 below.* Calculation not meaningful.
Certain amounts and percentages may reflect rounding adjustments.
1. The above financial statements present the three-month and nine-month periods ended October 3, 2010 and September 27, 2009. Subsidiaries operating outside the United States are included for the three-month and nine-month periods ended August 29, 2010 and August 23, 2009. Wyeth's results are included in our consolidated financial statements commencing from the acquisition date of October 15, 2009, in accordancewith Pfizer's domestic and international year-ends. Therefore, our results of operations for the three-month and nine-month periods ended September 27, 2009 do not include Wyeth's results of operations. Cost of sales for 2010 includes the significant impacts of purchase accounting adjustments associated with inventory acquired from Wyeth that was sold in 2010 as well as a write-off of certain Wyeth-related inventory. Amortization of intangible assets for 2010 includes the amortization of intangible assets acquired from Wyeth. Other deductions-net includes impairment charges related to certain intangible assets acquired as part of our acquisition of Wyeth. See Supplemental Information that accompanies these materials for additional details related to the impairment charges and inventory write-off recorded in the third quarter of 2010 that impacted Other deductions-net and Cost of sales.
2. The financial results for the three-month and nine-month periods ended October 3, 2010, are not necessarily indicative of the results which could ultimately be achieved for the current year.
3. Amortization expense related to acquired intangible assets that contribute to our ability to sell, manufacture, research, market and distribute ourproducts is included in Amortization of intangible assets as these intangible assets benefit multiple business functions. Amortization expense related to acquired intangible assets that are associated with a single function is included in Cost of sales, Selling, informational and administrative expenses or Research and development expenses, as appropriate.
(millions, except per common share data)
Weighted-average shares used to calculate earnings per common share:
PFIZER INC. AND SUBSIDIARY COMPANIESCONSOLIDATED STATEMENTS OF INCOME
(UNAUDITED)

Purchase Acquisition- Certain
Accounting Related Discontinued SignificantReported Adjustments Costs(2) Operations Items(3) Adjusted
Revenues $ 16,171 $ - $ - $ - $ (5) $ 16,166 Costs and expenses:
Cost of sales (b) 3,896 (487) (241) - (209) 2,959
Selling, informational and administrative expenses (b) 4,633 8 (28) - 2 4,615
Research and development expenses (b) 2,194 (8) (26) - - 2,160 Amortization of intangible assets 1,156 (1,124) - - - 32 Acquisition-related in-process research and development charges - - - - - - Restructuring charges and certain acquisition-related costs 499 - (499) - - - Other (income)/deductions--net 2,353 (14) - - (2,208) 131
Income from continuing operations before provisionfor taxes on income 1,440 1,625 794 - 2,410 6,269
Provision for taxes on income 564 379 232 - 717 1,892 Income from continuing operations 876 1,246 562 - 1,693 4,377 Discontinued operations--net of tax (5) - - 5 - - Net income before allocation to noncontrolling interests 871 1,246 562 5 1,693 4,377 Less: Net income attributable to noncontrolling interests 5 - - - - 5 Net income attributable to Pfizer Inc. $ 866 $ 1,246 $ 562 $ 5 $ 1,693 $ 4,372 Earnings per common share - diluted:
Income from continuing operations attributable to Pfizer Inc. common shareholders $ 0.11 $ 0.15 $ 0.07 $ - $ 0.21 $ 0.54 Discontinued operations--net of tax - - - - - - Net income attributable to Pfizer Inc. common shareholders $ 0.11 $ 0.15 $ 0.07 $ - $ 0.21 $ 0.54
Purchase Acquisition- Certain
Accounting Related Discontinued SignificantReported Adjustments Costs(2) Operations Items(3) Adjusted
Revenues $ 50,248 $ - $ - $ - $ (18) $ 50,230 Costs and expenses:
Cost of sales (b) 11,997 (2,564) (367) - (221) 8,845
Selling, informational and administrative expenses (b) 13,876 17 (190) - 14 13,717
Research and development expenses (b) 6,607 (23) (46) - - 6,538 Amortization of intangible assets 3,972 (3,880) - - - 92 Acquisition-related in-process research and development charges 74 (74) - - - - Restructuring charges and certain acquisition-related costs 2,091 - (2,091) - - - Other (income)/deductions--net 3,038 (40) - - (2,500) 498
Income from continuing operations before provisionfor taxes on income 8,593 6,564 2,694 - 2,689 20,540
Provision for taxes on income 3,198 1,631 695 - 779 6,303 Income from continuing operations 5,395 4,933 1,999 - 1,910 14,237 Discontinued operations--net of tax (4) - - 4 - - Net income before allocation to noncontrolling interests 5,391 4,933 1,999 4 1,910 14,237 Less: Net income attributable to noncontrolling interests 24 - - - - 24 Net income attributable to Pfizer Inc. $ 5,367 $ 4,933 $ 1,999 $ 4 $ 1,910 $ 14,213 Earnings per common share - diluted:
Income from continuing operations attributable to Pfizer Inc. common shareholders $ 0.66 $ 0.61 $ 0.25 $ - $ 0.24 $ 1.76 Discontinued operations--net of tax - - - - - - Net income attributable to Pfizer Inc. common shareholders $ 0.66 $ 0.61 $ 0.25 $ - $ 0.24 $ 1.76
(a) Adjusted income and its components and adjusted diluted EPS are not, and should not be viewed as, substitutes for U.S. GAAP net income andits components and diluted EPS.
(b) Exclusive of amortization of intangible assets, except as discussed in note 1.
See end of tables for notes.Certain amounts may reflect rounding adjustments.
PFIZER INC. AND SUBSIDIARY COMPANIESRECONCILIATION OF REPORTED NET INCOME ATTRIBUTABLE TO PFIZER INC. AND ITS COMPONENTS
AND REPORTED DILUTED EPS ATTRIBUTABLE TO PFIZER INC. COMMON SHAREHOLDERS TO ADJUSTED INCOME AND ITS COMPONENTS AND ADJUSTED DILUTED EPS (a)
Nine Months Ended October 3, 2010
(UNAUDITED)(millions of dollars, except per common share data)
Quarter Ended October 3, 2010

Purchase Acquisition- CertainAccounting Related Discontinued Significant
Reported Adjustments Costs(2) Operations Items(3) AdjustedRevenues $ 11,621 $ - $ - $ - $ (18) $ 11,603 Costs and expenses:
Cost of sales (b) 1,789 - - - (2) 1,787
Selling, informational and administrative expenses (b) 3,282 3 - - (60) 3,225
Research and development expenses (b) 1,632 (8) - - (5) 1,619 Amortization of intangible assets 594 (560) - - - 34 Acquisition-related in-process research and development charges - - - - - - Restructuring charges and certain acquisition-related costs 193 - (132) - (61) - Other (income)/deductions--net 160 1 - - (303) (142)
Income from continuing operations before provisionfor taxes on income 3,971 564 132 - 413 5,080
Provision for taxes on income 1,092 167 45 - 312 1,616 Income from continuing operations 2,879 397 87 - 101 3,464 Discontinued operations--net of tax 2 - - (2) - - Net income before allocation to noncontrolling interests 2,881 397 87 (2) 101 3,464 Less: Net income attributable to noncontrolling interests 3 - - - - 3 Net income attributable to Pfizer Inc. $ 2,878 $ 397 $ 87 $ (2) $ 101 $ 3,461 Earnings per common share - diluted:
Income from continuing operations attributable to Pfizer Inc. common shareholders $ 0.43 $ 0.06 $ 0.01 $ - $ 0.01 $ 0.51 Discontinued operations--net of tax - - - - - - Net income attributable to Pfizer Inc. common shareholders $ 0.43 $ 0.06 $ 0.01 $ - $ 0.01 $ 0.51
Purchase Acquisition- CertainAccounting Related Discontinued Significant
Reported Adjustments Costs(2) Operations Items(3) AdjustedRevenues $ 33,472 $ - $ - $ - $ (58) $ 33,414 Costs and expenses:
Cost of sales (b) 4,953 - - - (166) 4,787
Selling, informational and administrative expenses (b) 9,508 9 - - (195) 9,322
Research and development expenses (b) 5,032 (22) - - (70) 4,940 Amortization of intangible assets 1,755 (1,656) - - - 99 Acquisition-related in-process research and development charges 20 (20) - - - - Restructuring charges and certain acquisition-related costs 1,206 - (814) - (392) - Other (income)/deductions--net 175 (2) - - (731) (558)
Income from continuing operations before provisionfor taxes on income 10,823 1,691 814 - 1,496 14,824
Provision for taxes on income 2,952 524 290 - 672 4,438 Income from continuing operations 7,871 1,167 524 - 824 10,386 Discontinued operations--net of tax 6 - - (6) - - Net income before allocation to noncontrolling interests 7,877 1,167 524 (6) 824 10,386 Less: Net income attributable to noncontrolling interests 9 - - - - 9 Net income attributable to Pfizer Inc. $ 7,868 $ 1,167 $ 524 $ (6) $ 824 $ 10,377 Earnings per common share - diluted:
Income from continuing operations attributable to Pfizer Inc. common shareholders $ 1.16 $ 0.17 $ 0.08 $ - $ 0.13 $ 1.54 Discontinued operations--net of tax - - - - - - Net income attributable to Pfizer Inc. common shareholders $ 1.16 $ 0.17 $ 0.08 $ - $ 0.13 $ 1.54
(a) Adjusted income and its components and adjusted diluted EPS are not, and should not be viewed as, substitutes for U.S. GAAP net income andits components and diluted EPS.
(b) Exclusive of amortization of intangible assets, except as discussed in note 1.
See end of tables for notes.Certain amounts may reflect rounding adjustments.
Quarter Ended September 27, 2009
Nine Months Ended September 27, 2009
(UNAUDITED)(millions of dollars, except per common share data)
PFIZER INC. AND SUBSIDIARY COMPANIESRECONCILIATION OF REPORTED NET INCOME ATTRIBUTABLE TO PFIZER INC. AND ITS COMPONENTS
AND REPORTED DILUTED EPS ATTRIBUTABLE TO PFIZER INC. COMMON SHAREHOLDERS TO ADJUSTED INCOME AND ITS COMPONENTS AND ADJUSTED DILUTED EPS (a)

1) Amortization expense related to acquired intangible assets that contribute to our ability to sell, manufacture, research, market and distribute our productsis included in Amortization of intangible assets as these intangible assets benefit multiple business functions. Amortization expense related to acquiredintangible assets that are associated with a single function is included in Cost of sales, Selling, informational and administrative expensesor Researchand development expenses, as appropriate.
2)
(millions of dollars) 2010 2009 2010 2009
-$ 19$ 13$ 572$ 231 113 650 242 268 - 1,428 - 295 - 603 -
Total acquisition-related costs -- pre-tax 794 132 2,694 814 (232) (45) (695) (290)
Total acquisition-related costs -- net of tax 562$ 87$ 1,999$ 524$
(a) Transaction costs include costs directly related to our acquisition of Wyeth, such as banking, legal, accounting and other similar costs. Integration costs represent external, incremental costs directly related to integrating Wyeth and primarily include expenditures for consulting and systems integration. Restructuring charges relate to our acquisition of Wyeth and include employee termination costs, asset impairments and exit costs.
(b) Represents the impact of changes in the estimated useful lives of assets involved in restructuring actions related to our acquisition of Wyeth. Included in Cost of Sales ($241 million), Selling, informational and administrative expenses ($28 million), and Research and development expenses ($26 million)for the three months ended October 3, 2010. Included in Cost of sales ($367 million), Selling, informational and administrative expenses ($190 million) and Research and development expenses ($46 million) for the nine months ended October 3, 2010.
(c)
3)
(millions of dollars) 2010 2009 2010 2009
-$ 61$ -$ 392$ - 80 - 410
701 40 843 170 - 299 - 528
1,468 - 1,668 66 212 - 212 -
29 (67) (34) (70) 2,410 413 2,689 1,496 (717) (312) (779) (672)
1,693$ 101$ 1,910$ 824$
(a) Included in Restructuring charges and certain acquisition-related costs.
(b) Included in Cost of sales ($23 million), Selling, informational and administrative expenses ($51 million), Research and development expenses ($5 million), and Other deductions - net ($1 million) for the three months ended September 27, 2009. Included in Cost of sales ($144 million), Selling, informational and administrative expenses ($182 million), Research and development expenses ($78 million), and Other deductions - net ($6 million) for the nine months ended September 27, 2009.
(c) Included in Other deductions - net . The three-month and nine-month periods ended October 3, 2010 include an additional $701 million charge for asbestos litigation related to our wholly owned subsidiary, Quigley Company, Inc.
(d) Included in Other deductions - net . Includes interest expense on the senior unsecured notes issued in connection with our acquisition of Wyeth less interest income earned on the proceeds of those notes.
(e) Included in Other deductions - net . Amounts in 2010 represent impairment charges related to certain intangible assets acquired as part ofour acquisition of Wyeth (see Supplemental Information that accompanies these materials).
(f) Included in Cost of sales (see Supplemental Information that accompanies these materials).
(g) Primarily included in Other deductions - net . Amounts in the nine-month period of 2010 include the gain on the sale of certain Pfizer AnimalHealth products.
(h) Included in Provision for taxes on income . The three-month and nine-month periods ended September 27, 2009 include a tax benefit of
raised our assessment of the likelihood of prevailing on the technical merits of our tax position.
* Adjusted income and its components and adjusted diluted EPS are not, and should not be viewed as, substitutes for U.S. GAAP net income and itscomponents and diluted EPS.
(UNAUDITED)
Acquisition-related costs includes the following:
Third Quarter Nine Months
PFIZER INC. AND SUBSIDIARY COMPANIESRECONCILIATION OF REPORTED NET INCOME ATTRIBUTABLE TO PFIZER INC. AND ITS COMPONENTS
AND REPORTED DILUTED EPS ATTRIBUTABLE TO PFIZER INC. COMMON SHAREHOLDERS TO ADJUSTED INCOME AND ITS COMPONENTS AND ADJUSTED DILUTED EPS*
Income taxes(c)
Included in Provision for taxes on income .
Certain significant items includes the following:Third Quarter Nine Months
Transaction costs(a)
Integration costs(a)
Restructuring charges(a)
Additional depreciation - asset restructuring(b)
Certain asset impairment charges(e)
Other(g)
Total certain significant items -- pre-taxIncome taxes(h)
Inventory write-off(f)
Restructuring charges - Cost-reduction initiatives(a)
Implementation costs - Cost-reduction initiatives(b)
Certain legal matters(c)
Net interest expense(d)
Total certain significant items -- net of tax
approximately $174 million related to the final resolution of a previously disclosed settlement that resulted in the receipt of information that
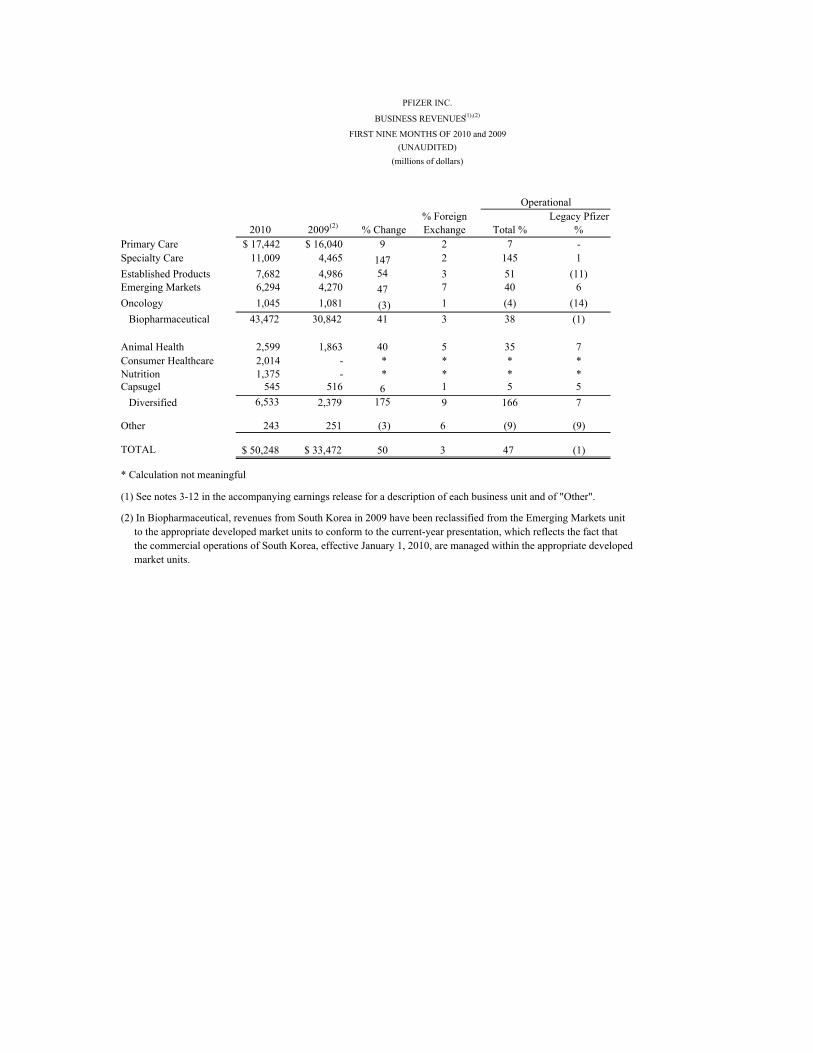
2010 2009(2) % Change% Foreign Exchange Total %
Legacy Pfizer %
Primary Care $ 17,442 $ 16,040 9 2 7 -Specialty Care 11,009 4,465 147 2 145 1 Established Products 7,682 4,986 54 3 51 (11)Emerging Markets 6,294 4,270 47 7 40 6 Oncology 1,045 1,081 (3) 1 (4) (14) Biopharmaceutical 43,472 30,842 41 3 38 (1)
Animal Health 2,599 1,863 40 5 35 7 Consumer Healthcare 2,014 - * * * *Nutrition 1,375 - * * * *Capsugel 545 516 6 1 5 5 Diversified 6,533 2,379 175 9 166 7
Other 243 251 (3) 6 (9) (9)
TOTAL 50,248$ 33,472$ 50 3 47 (1)
* Calculation not meaningful
(1) See notes 3-12 in the accompanying earnings release for a description of each business unit and of "Other".
(2) In Biopharmaceutical, revenues from South Korea in 2009 have been reclassified from the Emerging Markets unit to the appropriate developed market units to conform to the current-year presentation, which reflects the fact that the commercial operations of South Korea, effective January 1, 2010, are managed within the appropriate developed market units.
PFIZER INC.
Operational
BUSINESS REVENUES(1),(2)
FIRST NINE MONTHS OF 2010 and 2009(UNAUDITED)
(millions of dollars)

PFIZER INC.REVENUES
THIRD QUARTER 2010 and 2009(UNAUDITED)
(millions of dollars)
% ChangeTotal Oper. Total Total Oper.
TOTAL REVENUES $16,171 $11,621 39% 40% $7,112 $4,816 48% $9,059 $6,805 33% 35%
TOTAL BIOPHARMACEUTICAL: $13,945 $10,677 31% 33% $6,298 $4,448 42% $7,647 $6,229 23% 26%
Lipitor 2,534 2,853 (11%) (10%) 1,298 1,379 (6%) 1,236 1,474 (16%) (14%)Enbrel (Outside the U.S. and Canada)*** 799 - * * - - - 799 - * *Lyrica 757 708 7% 10% 356 352 1% 401 356 13% 19%Celebrex 578 602 (4%) (5%) 390 421 (7%) 188 181 4% 1%Prevnar / Prevenar 13*** 735 - * * 540 - * 195 - * *Effexor*** 175 - * * 58 - * 117 - * *Viagra 459 466 (2%) - 242 232 4% 217 234 (7%) (5%)Xalatan / Xalacom 416 436 (5%) (3%) 157 143 10% 259 293 (12%) (9%)Norvasc 330 488 (32%) (35%) - 14 * 330 474 (30%) (32%)Prevnar / Prevenar 7*** 179 - * * - - - 179 - * *Zyvox 285 271 5% 6% 148 146 1% 137 125 10% 12%Premarin Family*** 263 - * * 241 - * 22 - * *Sutent 257 246 4% 9% 67 69 (3%) 190 177 7% 12%Geodon / Zeldox 262 252 4% 4% 224 210 7% 38 42 (10%) (9%)Detrol / Detrol LA 237 283 (16%) (16%) 163 197 (17%) 74 86 (14%) (12%)Zosyn / Tazocin*** 255 - * * 177 - * 78 - * *Genotropin 211 232 (9%) (6%) 51 56 (9%) 160 176 (9%) (6%)Vfend 200 196 2% 5% 64 61 5% 136 135 1% 4%Protonix*** 203 - * * 203 - * - - - - Chantix / Champix 163 155 5% 5% 74 75 (1%) 89 80 11% 11%Benefix*** 156 - * * 67 - * 89 - * *Zoloft 126 128 (2%) (3%) 18 19 (5%) 108 109 (1%) (3%)Caduet 127 130 (2%) (3%) 86 91 (5%) 41 39 5% 5%Aromasin 111 123 (10%) (6%) 39 40 (3%) 72 83 (13%) (6%)Revatio 116 111 5% 7% 72 71 1% 44 40 10% 15%Pristiq*** 118 - * * 102 - * 16 - * *Medrol 119 106 12% 13% 33 29 14% 86 77 12% 13%Cardura 95 109 (13%) (11%) 1 1 - 94 108 (13%) (11%)Aricept** 100 108 (7%) (5%) - - - 100 108 (7%) (5%)Zithromax / Zmax 90 85 6% 4% 4 2 100% 86 83 4% 2%BMP2*** 101 - * * 98 - * 3 - * *Rapamune*** 104 - * * 55 - * 49 - * *Refacto AF/Xyntha*** 102 - * * 22 - * 80 - * *Fragmin 84 82 2% 5% 13 14 (7%) 71 68 4% 6%Tygacil*** 78 - * * 40 - * 38 - * *Alliance Revenue**** 1,042 692 51% 51% 741 422 76% 301 270 11% 12%All Other Biopharmaceutical 1,978 1,815 9% 11% 454 404 12% 1,524 1,411 8% 9% All Other Established Products 1,680 1,502 12% 13% 377 361 4% 1,303 1,141 14% 15% Legacy Pfizer Other Established Products 1,452 1,502 (3%) (3%) 368 361 2% 1,084 1,141 (5%) (4%)
TOTAL DIVERSIFIED: $2,150 $855 151% 151% $792 $347 128% $1,358 $508 167% 168%
ANIMAL HEALTH*** 860 678 27% 28% 369 294 26% 491 384 28% 29% CONSUMER HEALTHCARE*** 673 - * * 374 - * 299 - * * NUTRITION*** 441 - * * - - - 441 - * * CAPSUGEL 176 177 (1%) 2% 49 53 (8%) 127 124 2% 7%
OTHER***** $76 $89 (15%) (31%) $22 $21 5% $54 $68 (21%) (18%)
* - Calculation not meaningful.** - Includes direct sales under license agreement with Eisai Co., Ltd.*** - Legacy Wyeth products and operations. Animal Health results for the third quarter of 2010 also reflect the addition of legacy Wyeth products. Wyeth's results are included in our financial statements commencing from the acquisition date of October 15, 2009, in accordance with Pfizer's domestic and international year-ends. Therefore, our results for the third quarter of 2009 do not include Wyeth's results of operations.**** - Enbrel (in the U.S. and Canada)***, Aricept, Rebif, and Exforge.***** - Includes revenues generated primarily from Pfizer Centresource.Certain amounts and percentages may reflect rounding adjustments.
(1) Total International represents Developed Europe region + Developed Rest of World region + Emerging Markets region. Details for these regions are located on the following page.
2010 2009% Change
2009% Change
WORLDWIDE UNITED STATES TOTAL INTERNATIONAL(1)
2010 2009 2010

PFIZER INC.REVENUES
DETAIL OF INTERNATIONAL REVENUES BY GEOGRAPHIC REGIONTHIRD QUARTER 2010 and 2009
(UNAUDITED)(millions of dollars)
Total Oper. Total Oper. Total Oper.TOTAL INTERNATIONAL REVENUES $3,840 $3,137 22% 35% $2,377 $1,958 21% 12% $2,842 $1,710 66% 64%
TOTAL INTERNATIONAL BIOPHARMACEUTICAL: $3,466 $2,853 21% 34% $2,109 $1,847 14% 6% $2,072 $1,529 36% 34%Lipitor 628 752 (16%) (8%) 397 512 (22%) (28%) 211 210 - (2%)Enbrel (Outside the U.S. and Canada)*** 531 - * * 97 - * * 171 - * *Lyrica 268 256 5% 16% 63 42 50% 40% 70 58 21% 17%Celebrex 42 53 (21%) (13%) 86 64 34% 22% 60 64 (6%) (6%)Prevnar / Prevenar 13*** 129 - * * 21 - * * 45 - * *Effexor*** 55 - * * 37 - * * 25 - * *Viagra 95 109 (13%) (5%) 47 42 12% 5% 75 83 (10%) (11%)Xalatan / Xalacom 134 155 (14%) (5%) 81 92 (12%) (18%) 44 46 (4%) (6%)Norvasc 45 58 (22%) (12%) 178 311 (43%) (47%) 107 105 2% 2%Prevnar / Prevenar 7*** 23 - * * 56 - * * 100 - * *Zyvox 69 71 (3%) 6% 32 27 19% 7% 36 27 33% 30%Premarin Family*** 3 - * * 7 - * * 12 - * *Sutent 104 108 (4%) 6% 36 27 33% 27% 50 42 19% 19%Geodon / Zeldox 19 25 (24%) (16%) 5 3 67% - 14 14 - - Detrol / Detrol LA 39 50 (22%) (18%) 22 22 - - 13 14 (7%) (7%)Zosyn / Tazocin*** 22 - * * 5 - * * 51 - * *Genotropin 90 100 (10%) - 42 45 (7%) (15%) 28 31 (10%) (10%)Vfend 70 75 (7%) 3% 30 28 7% 4% 36 32 13% 13%Protonix*** - - - - - - - - - - - - Chantix / Champix 35 38 (8%) 3% 46 32 44% 31% 8 10 (20%) (27%)Benefix*** 62 - * * 24 - * * 3 - * *Zoloft 21 24 (13%) (8%) 57 54 6% - 30 31 (3%) (3%)Caduet 5 6 (17%) (17%) 22 21 5% 5% 14 12 17% 17%Aromasin 44 55 (20%) (9%) 15 14 7% - 13 14 (7%) (7%)Revatio 30 31 (3%) 10% 8 4 100% 60% 6 5 20% - Pristiq*** - - - - 10 - * * 6 - * *Medrol 22 27 (19%) (4%) 12 11 9% (9%) 52 39 33% 33%Cardura 36 43 (16%) (9%) 36 42 (14%) (20%) 22 23 (4%) - Aricept** 53 65 (18%) (11%) 39 34 15% 9% 8 9 (11%) (10%)Zithromax / Zmax 15 22 (32%) (19%) 34 27 26% 19% 37 34 9% 6%BMP2*** 3 - * * - - - - - - - - Rapamune*** 14 - * * 4 - * * 31 - * *Refacto AF/Xyntha*** 73 - * * 7 - * * - - - - Fragmin 33 35 (6%) 3% 18 16 13% 6% 20 17 18% 18%Tygacil*** 19 - * * 1 - * * 18 - * *Alliance Revenue**** 130 137 (5%) 5% 153 116 32% 21% 18 17 6% 13%All Other Biopharmaceutical 505 558 (9%) - 381 261 46% 33% 638 592 8% 7% All Other Established Products 390 376 4% 14% 329 223 48% 37% 584 542 8% 7% Legacy Pfizer Other Established Products 314 376 (16%) (8%) 237 223 6% (1%) 533 542 (2%) (3%)
TOTAL INTERNATIONAL DIVERSIFIED: $336 $245 37% 51% $260 $97 168% 138% $762 $166 * *
OTHER INTERNATIONAL***** $38 $39 (3%) 3% $8 $14 (43%) (38%) $8 $15 (47%) (50%)
* - Calculation not meaningful.** - Includes direct sales under license agreement with Eisai Co., Ltd.*** - Legacy Wyeth products and operations. Animal Health results for the third quarter of 2010 also reflect the addition of legacy Wyeth products. Wyeth's results are included in our financial statements commencing from the acquisition date of October 15, 2009, in accordance with Pfizer's domestic and international year-ends. Therefore, our results for the third quarter of 2009 do not do not include Wyeth's results of operations.**** - Enbrel (in the U.S. and Canada)***, Aricept, Rebif, and Exforge.***** - Includes revenues generated primarily from Pfizer Centresource.Certain amounts and percentages may reflect rounding adjustments.
(1) Developed Europe region includes the following markets: Western Europe and the Scandinavian countries.(2) Developed Rest of World region includes the following markets: Australia, Canada, Japan, New Zealand, and South Korea.(3) Emerging Markets region includes, but is not limited to, the following markets: Asia (excluding Japan and South Korea), Latin America, Middle East, Africa, Central and Eastern Europe, Russia and Turkey. In Biopharmaceutical, revenues from South Korea in 2009 have been reclassified from the Emerging Markets unit to the appropriate developed market units to conform to the current-year presentation, which reflects the fact that the commercial operations of South Korea, effective January 1, 2010, are managed within the appropriate developed market units.
EMERGING MARKETS(3)
2010 2009% Change
2010 2009% Change
2010 2009% Change
DEVELOPED EUROPE(1) DEVELOPED REST OF WORLD(2)

PFIZER INC.REVENUES
FIRST NINE MONTHS OF 2010 and 2009(UNAUDITED)
(millions of dollars)
% ChangeTotal Oper. Total Total Oper.
TOTAL REVENUES $50,248 $33,472 50% 47% $21,807 $14,309 52% $28,441 $19,163 48% 42%TOTAL BIOPHARMACEUTICAL: $43,472 $30,842 41% 38% $19,554 $13,347 47% $23,918 $17,495 37% 31%Lipitor 8,104 8,259 (2%) (5%) 3,921 4,145 (5%) 4,183 4,114 2% (4%)Enbrel (Outside the U.S. and Canada)*** 2,409 - * * - - * 2,409 - * *Lyrica 2,242 2,020 11% 10% 1,073 1,094 (2%) 1,169 926 26% 24%Celebrex 1,752 1,714 2% - 1,176 1,230 (4%) 576 484 19% 11%Prevnar / Prevenar 13*** 1,590 - * * 1,231 - * 359 - * *Effexor*** 1,512 - * * 1,142 - * 370 - * *Viagra 1,429 1,343 6% 4% 729 697 5% 700 646 8% 3%Xalatan / Xalacom 1,287 1,238 4% 2% 453 414 9% 834 824 1% (2%)Norvasc 1,120 1,487 (25%) (28%) 24 49 (51%) 1,096 1,438 (24%) (27%)Prevnar / Prevenar 7*** 1,030 - * * 214 - * 816 - * *Zyvox 876 811 8% 7% 463 459 1% 413 352 17% 14%Premarin Family*** 779 - * * 713 - * 66 - * *Sutent 771 671 15% 13% 198 192 3% 573 479 20% 17%Geodon / Zeldox 763 713 7% 6% 642 597 8% 121 116 4% - Detrol / Detrol LA 758 845 (10%) (12%) 515 600 (14%) 243 245 (1%) (5%)Zosyn / Tazocin*** 749 - * * 505 - * 244 - * *Genotropin 650 636 2% - 156 160 (3%) 494 476 4% 1%Vfend 595 555 7% 5% 187 177 6% 408 378 8% 5%Protonix*** 535 - * * 535 - * - - - - Chantix / Champix 522 524 - (4%) 252 303 (17%) 270 221 22% 14%Benefix*** 474 - * * 211 - * 263 - * *Zoloft 390 368 6% 2% 54 62 (13%) 336 306 10% 5%Caduet 388 392 (1%) (5%) 256 294 (13%) 132 98 35% 20%Aromasin 361 347 4% 3% 122 121 1% 239 226 6% 4%Revatio 352 319 10% 9% 216 212 2% 136 107 27% 24%Pristiq*** 341 - * * 301 - * 40 - * *Medrol 341 334 2% - 88 105 (16%) 253 229 10% 8%Cardura 312 330 (5%) (8%) 11 4 175% 301 326 (8%) (10%)Aricept** 310 311 - (6%) - - - 310 311 - (6%)Zithromax / Zmax 303 299 1% (2%) 10 10 - 293 289 1% (2%)BMP2*** 298 - * * 286 - * 12 - * *Rapamune*** 292 - * * 150 - * 142 - * *Refacto AF/Xyntha*** 290 - * * 61 - * 229 - * *Fragmin 258 244 6% 2% 40 51 (22%) 218 193 13% 8%Tygacil*** 250 - * * 133 - * 117 - * *Alliance Revenue**** 3,107 1,872 66% 64% 2,211 1,133 95% 896 739 21% 17%All Other Biopharmaceutical 5,932 5,210 14% 11% 1,275 1,238 3% 4,657 3,972 17% 13% All Other Established Products 5,071 4,325 17% 14% 1,106 1,101 - 3,965 3,224 23% 18% Legacy Pfizer Other Established Products 4,351 4,325 1% (2%) 1,084 1,101 (2%) 3,267 3,224 1% (3%)
TOTAL DIVERSIFIED: $6,533 $2,379 175% 166% $2,168 $901 141% $4,365 $1,478 195% 181%
ANIMAL HEALTH*** 2,599 1,863 40% 35% 1,006 749 34% 1,593 1,114 43% 35% CONSUMER HEALTHCARE*** 2,014 - * * 1,016 - * 998 - * * NUTRITION*** 1,375 - * * - - - 1,375 - * * CAPSUGEL 545 516 6% 5% 146 152 (4%) 399 364 10% 9%
OTHER***** $243 $251 (3%) (9%) $85 $61 39% $158 $190 (17%) (16%)
* - Calculation not meaningful.** - Includes direct sales under license agreement with Eisai Co., Ltd.*** - Legacy Wyeth products and operations. Animal Health results for the first nine months of 2010 also reflect the addition of legacy Wyeth products. Wyeth's results are included in our financial statements commencing from the acquisition date of October 15, 2009, in accordance with Pfizer's domestic and international year-ends. Therefore, our results for the first nine months of 2009 do not include Wyeth's results of operations.**** - Enbrel (in the U.S. and Canada)***, Aricept, Rebif, and Exforge.***** - Includes revenues generated primarily from Pfizer Centresource.Certain amounts and percentages may reflect rounding adjustments.
(1) Total International represents Developed Europe region + Developed Rest of World region + Emerging Markets region. Details for these regions are located on the following page.
2010 2009 20102010 2009% Change
2009% Change
WORLDWIDE UNITED STATES TOTAL INTERNATIONAL(1)

PFIZER INC.REVENUES
DETAIL OF INTERNATIONAL REVENUES BY GEOGRAPHIC REGIONFIRST NINE MONTHS OF 2010 and 2009
(UNAUDITED)(millions of dollars)
Total Oper. Total Oper. Total Oper.TOTAL INTERNATIONAL REVENUES $12,313 $8,726 41% 41% $7,401 $5,648 31% 18% $8,727 $4,789 82% 73%TOTAL INTERNATIONAL BIOPHARMACEUTICAL: $10,974 $7,892 39% 39% $6,650 $5,333 25% 13% $6,294 $4,270 47% 40%Lipitor 1,987 2,049 (3%) (3%) 1,505 1,450 4% (10%) 691 615 12% 5%Enbrel (Outside the U.S. and Canada)*** 1,659 - * * 288 - * * 462 - * *Lyrica 802 666 20% 21% 162 107 51% 33% 205 153 34% 27%Celebrex 132 142 (7%) (7%) 245 170 44% 29% 199 172 16% 9%Prevnar / Prevenar 13*** 274 - * * 23 - * * 62 - * *Effexor*** 184 - * * 113 - * * 73 - * *Viagra 299 299 - - 143 119 20% 7% 258 228 13% 7%Xalatan / Xalacom 430 424 1% 2% 265 272 (3%) (10%) 139 128 9% 2%Norvasc 154 171 (10%) (9%) 601 940 (36%) (40%) 341 327 4% 2%Prevnar / Prevenar 7*** 230 - * * 172 - * * 414 - * *Zyvox 215 194 11% 12% 93 83 12% 5% 105 75 40% 31%Premarin Family*** 8 - * * 21 - * * 37 - * *Sutent 322 304 6% 7% 100 62 61% 47% 151 113 34% 28%Geodon / Zeldox 66 67 (1%) (1%) 13 9 44% 10% 42 40 5% (5%)Detrol / Detrol LA 129 143 (10%) (11%) 71 62 15% 3% 43 40 8% 3%Zosyn / Tazocin*** 83 - * * 12 - * * 149 - * *Genotropin 277 266 4% 4% 133 131 2% (5%) 84 79 6% - Vfend 219 210 4% 5% 92 81 14% 6% 97 87 11% 6%Protonix*** - - - - - - - - - - - - Chantix / Champix 123 109 13% 12% 124 88 41% 22% 23 24 (4%) (8%)Benefix*** 187 - * * 65 - * * 11 - * *Zoloft 66 69 (4%) (4%) 181 151 20% 13% 89 86 3% - Caduet 15 14 7% 14% 79 52 52% 27% 38 32 19% 16%Aromasin 146 148 (1%) (1%) 45 40 13% 5% 48 38 26% 21%Revatio 94 81 16% 16% 24 14 71% 53% 18 12 50% 33%Pristiq*** - - * * 27 - * * 13 - * *Medrol 74 76 (3%) (1%) 34 36 (6%) (14%) 145 117 24% 21%Cardura 114 124 (8%) (8%) 116 131 (11%) (15%) 71 71 - (3%)Aricept** 172 190 (9%) (10%) 111 90 23% 7% 27 31 (13%) (16%)Zithromax / Zmax 61 86 (29%) (30%) 115 103 12% 6% 117 100 17% 13%BMP2*** 12 - * * - - - - - - - - Rapamune*** 41 - * * 13 - * * 88 - * *Refacto AF/Xyntha*** 209 - * * 20 - * * - - - - Fragmin 110 97 13% 11% 48 41 17% 2% 60 55 9% 5%Tygacil***. 60 - * * 3 - * * 54 - * *Alliance Revenue**** 399 377 6% 7% 442 317 39% 29% 55 45 22% 16%All Other Biopharmaceutical 1,621 1,586 2% 2% 1,151 784 47% 35% 1,885 1,602 18% 12% All Other Established Products 1,273 1,082 18% 18% 1,008 670 50% 38% 1,684 1,472 14% 10% Legacy Pfizer Other Established Products 1,030 1,082 (5%) (5%) 706 670 5% (4%) 1,531 1,472 4% -
TOTAL INTERNATIONAL DIVERSIFIED: $1,238 $725 71% 71% $728 $281 159% 123% $2,399 $472 * *
OTHER INTERNATIONAL***** $101 $109 (7%) (7%) $23 $34 (32%) (24%) $34 $47 (28%) (30%)
* - Calculation not meaningful.** - Includes direct sales under license agreement with Eisai Co., Ltd.*** - Legacy Wyeth products and operations. Animal Health results for the first nine months of 2010 also reflect the addition of legacy Wyeth products. Wyeth's results are included in our financial statements commencing from the acquisition date of October 15, 2009, in accordance with Pfizer's domestic and international year-ends. Therefore, our results for the first nine months of 2009 do not include Wyeth's results of operations.**** - Enbrel (in the U.S. and Canada)***, Aricept, Rebif, and Exforge.***** - Includes revenues generated primarily from Pfizer Centresource.Certain amounts and percentages may reflect rounding adjustments.
(1) Developed Europe region includes the following markets: Western Europe and the Scandinavian countries.(2) Developed Rest of World region includes the following markets: Australia, Canada, Japan, New Zealand, and South Korea.(3) Emerging Markets region includes, but is not limited to, the following markets: Asia (excluding Japan and South Korea), Latin America, Middle East, Africa, Central and Eastern Europe, Russia and Turkey. In Biopharmaceutical, revenues from South Korea in 2009 have been reclassified from the Emerging Markets unit to the appropriate developed market units to conform to the current-year presentation, which reflects the fact that the commercial operations of South Korea, effective January 1, 2010, are managed within the appropriate developed market units.
EMERGING MARKETS(3)
2010 2009% Change
2010 2009% Change
2010 2009% Change
DEVELOPED EUROPE(1) DEVELOPED REST OF WORLD(2)

1
PFIZER INC. SUPPLEMENTAL INFORMATION
1. Change in Reported Cost of Sales Reported cost of sales increased 118% in the third quarter of 2010, compared to the same period in 2009, and increased 142% in the first nine months of 2010, compared to the same period in 2009. The increases primarily reflect purchase accounting adjustments associated with the Wyeth acquisition, a write-off of Wyeth-related inventory of $212 million (which includes a purchase accounting fair value adjustment of $104 million), the addition of Wyeth manufacturing costs, as well as the change in the mix of products and businesses as a result of the Wyeth acquisition, partially offset by a favorable impact of foreign exchange for both the third quarter and first nine months of 2010. The write-off of inventory primarily relates to unfinished inventory acquired from Wyeth that became unusable after the acquisition date. Reported cost of sales as a percentage of revenues increased 8.7 percentage points to 24.1% in third-quarter 2010, compared to the same period in 2009, reflecting the aforementioned factors. 2. Change in Reported Selling, Informational & Administrative (SI&A) Expenses and Reported Research & Development (R&D) Expenses Reported SI&A expenses increased 41% in the third quarter of 2010, compared to the same period in 2009, and increased 46% in the first nine months of 2010, compared to the same period in 2009. The increases primarily reflect the addition of Wyeth operating costs. Foreign exchange had a favorable impact on reported SI&A expenses in the third quarter of 2010 and an unfavorable impact for the first nine months of 2010. Reported R&D expenses increased 34% in the third quarter of 2010, compared to the same period in 2009, and increased 31% in the first nine months of 2010, compared to the same period in 2009. The increases are primarily due to the addition of legacy Wyeth operations and continued investment in the late-stage development portfolio. Foreign exchange had a favorable impact on reported R&D expenses in the third quarter of 2010 and an unfavorable impact for the first nine months of 2010. 3. Other (Income)/Deductions - Net
($ in millions) Third Quarter Nine Months 2010 2009 2010 2009 Interest income(a)
i$ (100) $ (171) $ (297) $ (620)
Interest expense(a) 428 369 1,339 769 Net interest expense 328 198 1,042 149 Royalty-related income (158) (35) (395) (142) Net gain on asset disposals (13) (40) (243) (81) Legal matters, net(b) 712 54 886 130 Certain asset impairment charges(c) 1,478 6 1,710 96 Other, net 6 (23) 38 23 Other deductions-net $ 2,353 $ 160 $ 3,038 $ 175
(a) Interest expense increased in 2010 due to our issuance of $13.5 billion of senior unsecured notes on March 24, 2009 and $10.5 billion of senior unsecured notes on June 3, 2009, primarily related to the acquisition of Wyeth. Interest income decreased in 2010 due to lower interest rates coupled with lower average cash balances.
(b) The three-month and nine-month periods ended October 3, 2010 include an additional $701 million charge for asbestos litigation related to our wholly owned subsidiary, Quigley Company, Inc.
(c) Amounts in 2010 represent impairment charges related to intangible assets, including certain in-process research and development (“IPR&D”) intangible assets, that were acquired in connection with our acquisition of Wyeth. These impairment charges primarily resulted from our current estimate of the fair value of these assets based upon updated forecasts of these Wyeth assets as compared to their assigned fair values at the closing of the Wyeth acquisition last year. Our updated forecasts are based on projected development and regulatory timeframes, and for brand assets and developed technology, the current market environment as well as planned investment support.

2
4. Effective Tax Rate Reported The effective tax rate on reported Income from continuing operations before provision for taxes on income for third-quarter 2010 was 39.2% compared to 27.5% in the third quarter of 2009, and in the first nine months of 2010 was 37.2% compared to 27.3% in the first nine months of 2009. The higher tax rates in the third quarter and first nine months of 2010 are primarily the result of:
• higher expenses, incurred as a result of our acquisition of Wyeth, and the mix of jurisdictions in which those expenses were incurred;
• the expiration of the U.S. research and development tax credit; and • the non-recurrence of a tax benefit of $174 million that was recorded in the third quarter of 2009 related to the final
resolution of a previously disclosed settlement that resulted in the receipt of information that raised our assessment of the likelihood of prevailing on the technical merits of our tax position;
partially offset by:
• the tax impact of the charge incurred for asbestos litigation.
The effective tax rate for the first nine months of 2010 was additionally impacted by the write-off of the deferred tax asset of approximately $270 million related to the Medicare Part D subsidy for retiree prescription drug coverage, resulting from changes in the U.S. healthcare legislation enacted in March 2010 concerning the tax treatment of that subsidy effective for tax years beginning after December 31, 2012, offset by $460 million in tax benefits for the resolution of certain tax positions pertaining to prior years with various foreign tax authorities. Adjusted The effective tax rate on adjusted income(1) decreased to 30.2% in third-quarter 2010 compared to 31.8% in third-quarter 2009, as a result of the change in the jurisdictional mix of earnings, partially offset by the expiration of the U.S. research and development tax credit.
The effective tax rate on adjusted income(1) for the first nine months of 2010 was 30.7% compared to 29.9% in the first nine months of 2009. In addition to the aforementioned factors, the effective tax rate on adjusted income(1) for the first nine months of 2010 was impacted by the write-off of the deferred tax asset of approximately $270 million related to the Medicare Part D subsidy for retiree prescription drug coverage, resulting from changes in the U.S. healthcare legislation enacted in March 2010 concerning the tax treatment of that subsidy effective for tax years beginning after December 31, 2012, offset by $460 million in tax benefits for the resolution of certain tax positions pertaining to prior years with various foreign tax authorities. 5. Reconciliation of 2010 Adjusted Income(1) and Adjusted Diluted EPS(1) Guidance to 2010 Reported Net Income Attributable to Pfizer Inc. and Reported Diluted EPS Attributable to Pfizer Inc. Common Shareholders Guidance (a)
Full-Year 2010 Guidance ($ in billions, except per share amounts) Net Income(b) Diluted EPS(b) Income/(Expense) Adjusted Income/Diluted EPS(1) Guidance ~$17.6 - $18.0 ~$2.17 - $2.22 Purchase Accounting Impacts of Transactions Completed as of 10/3/10 (6.1) (0.75) Acquisition-Related Costs (2.4 – 2.8) (0.29 – 0.34) Certain Significant Items (1.9) (0.24) Reported Net Income Attributable to Pfizer Inc./Diluted EPS Guidance ~$6.8 - $7.6 ~$0.84 - $0.94
(a) The current exchange rates assumed in connection with the 2010 financial guidance are a blend of the average of the actual exchange rates in effect from December 2009 through September 2010 and the mid-October 2010 exchange rates
for the remainder of the year. (b) Does not assume the completion of any business-development transactions not completed as of October 3, 2010 with the
exception of the Biocon transaction. Amounts exclude the potential effects of the resolution of litigation-related matters not substantially resolved as of October 3, 2010.

3
6. Reconciliation of 2012 Adjusted Income(1) and Adjusted Diluted EPS(1) Targets to 2012 Reported Net Income Attributable to Pfizer Inc. and Reported Diluted EPS Attributable to Pfizer Inc. Common Shareholders Targets (a)
Full-Year 2012 Targets ($ in billions, except per share amounts) Net Income(b) Diluted EPS(b) Income/(Expense) Adjusted Income/Diluted EPS(1) Targets ~$18.3 - $19.1 ~$2.25 - $2.35 Purchase Accounting Impacts of Transactions Completed as of 10/3/10 (3.8) (0.47) Acquisition-Related Costs (1.2 – 1.6) (0.15 – 0.20) Reported Net Income Attributable to Pfizer Inc./Diluted EPS Targets ~$12.9 - $14.1 ~$1.58 - $1.73
(a) The current exchange rates assumed in connection with the 2012 financial targets are the mid-October 2010 exchange rates.
(b) Given the longer-term nature of these targets, they are subject to greater variability and less certainty as a result of potential material impacts related to foreign exchange fluctuations, macroeconomic activity including
inflation, and industry-specific challenges including changes to government healthcare policy, among others. _______________
(1) “Adjusted income” and “adjusted diluted earnings per share (EPS)” are defined as reported net income attributable to Pfizer Inc. and reported diluted EPS attributable to Pfizer Inc. common shareholders excluding purchase accounting adjustments, acquisition-related costs, discontinued operations and certain significant items. As described under Adjusted Income in the Management’s Discussion and Analysis of Financial Condition and Results of Operations section of Pfizer’s Form 10-Q for the fiscal quarter ended July 4, 2010, management uses adjusted income, among other factors, to set performance goals and to measure the performance of the overall company. We believe that investors’ understanding of our performance is enhanced by disclosing this measure. The adjusted income and adjusted diluted EPS measures are not, and should not be viewed as, substitutes for U.S. GAAP net income and diluted EPS.

DISCLOSURE NOTICE: The information contained in this earnings release and the attachments is as of November 2, 2010. The Company assumes no obligation to update forward-looking statements contained in this earnings release or the attachments as a result of new information or future events or developments.
This earnings release and the attachments contain forward-looking information about the Company’s financial results and estimates, business plans and prospects, in-line products and product candidates that involves substantial risks and uncertainties. You can identify these statements by the fact that they use words such as “will,” “anticipate,” “estimate,” “expect,” “project,” “intend,” “plan,” “believe,” “target,” “forecast” and other words and terms of similar meaning in connection with any discussion of future operating or financial performance or business plans and prospects. Among the factors that could cause actual results to differ materially are the following: the success of research and development activities, including, without limitation, the ability to meet anticipated clinical trial completion dates and regulatory submission dates for product candidates; decisions by regulatory authorities regarding whether and when to approve our drug applications as well as their decisions regarding labeling, ingredients and other matters that could affect the availability or commercial potential of our products; the speed with which regulatory authorizations, pricing approvals and product launches may be achieved; the success of external business development activities; competitive developments, including the impact on our competitive position of new product entrants, in-line branded products, generic products, private label products and product candidates that treat diseases and conditions similar to those treated by our in-line drugs and drug candidates; the ability to meet generic and branded competition after the loss of patent protection for our products or competitor products; the ability to successfully market both new and existing products domestically and internationally; difficulties or delays in manufacturing; trade buying patterns; the impact of existing and future legislation and regulatory provisions on product exclusivity; trends toward managed care and healthcare cost containment; the impact of U.S. healthcare legislation enacted in 2010 – the Patient Protection and Affordable Care Act, as amended by the Health Care and Education Reconciliation Act; U.S. legislation or regulatory action affecting, among other things, pharmaceutical product pricing, reimbursement or access, including under Medicaid, Medicare and other publicly funded or subsidized health programs, the importation of prescription drugs from outside the U.S. at prices that are regulated by governments of various foreign countries, direct-to-consumer advertising and interactions with healthcare professionals, and the use of comparative effectiveness methodologies that could be implemented in a manner that focuses primarily on the cost differences and minimizes the therapeutic differences among pharmaceutical

products and restricts access to innovative medicines; legislation or regulatory action in markets outside the U.S. affecting pharmaceutical product pricing, reimbursement or access; contingencies related to actual or alleged environmental contamination; claims and concerns that may arise regarding the safety or efficacy of in-line products and product candidates; significant breakdown, infiltration, or interruption of our information technology systems and infrastructure; legal defense costs, insurance expenses, settlement costs and the risk of an adverse decision or settlement related to product liability, patent protection, government investigations, consumer, commercial, securities, environmental and tax issues, ongoing efforts to explore various means for resolving asbestos litigation, and other legal proceedings; the Company’s ability to protect its patents and other intellectual property both domestically and internationally; interest rate and foreign currency exchange rate fluctuations; governmental laws and regulations affecting domestic and foreign operations, including, without limitation, tax obligations and changes affecting the tax treatment by the U.S. of income earned outside of the U.S. that result from the enactment in August 2010 of the Education Jobs and Medicaid Assistance Act of 2010 and that may result from pending and possible future proposals; changes in U.S. generally accepted accounting principles; uncertainties related to general economic, political, business, industry, regulatory and market conditions including, without limitation, uncertainties related to the impact on us, our lenders, our customers, our suppliers and counterparties to our foreign exchange and interest rate agreements of weak global economic conditions and recent and possible future changes in global financial markets; any changes in business, political and economic conditions due to actual or threatened terrorist activity in the U.S. and other parts of the world, and related U.S. military action overseas; growth in costs and expenses; changes in our product, segment and geographic mix; and the impact of acquisitions, divestitures, restructurings, product withdrawals and other unusual items, including our ability to realize the projected benefits of our acquisition of Wyeth and of our cost-reduction initiatives. A further list and description of risks, uncertainties and other matters can be found in the Company’s Annual Report on Form 10-K for the fiscal year ended December 31, 2009, and in its reports on Forms 10-Q and 8-K. This earnings release may include discussion of certain clinical studies relating to various in-line products and/or product candidates. These studies typically are part of a larger body of clinical data relating to such products or product candidates, and the discussion herein should be considered in the context of the larger body of data.