Pfizer Little Island IEL Groundwater Monitoring - epa.ie · Pfizer Ireland Pharmaceuticals - Pfizer...
47
Pfizer Little Island IEL Groundwater Monitoring April 2015 47092917 / CKRP0001 Issue No. 2 Final Prepared for: Pfizer Ireland Pharmaceuticals For inspection purposes only. Consent of copyright owner required for any other use. EPA Export 29-05-2016:01:10:08
-
Upload
duongthien -
Category
Documents
-
view
228 -
download
0
Transcript of Pfizer Little Island IEL Groundwater Monitoring - epa.ie · Pfizer Ireland Pharmaceuticals - Pfizer...

Pfizer Little Island IEL Groundwater Monitoring April 2015
47092917 / CKRP0001
Issue No. 2 Final
Prepared for: Pfizer Ireland Pharmaceuticals
For
insp
ectio
n pur
pose
s only
.
Conse
nt of
copy
right
owne
r req
uired
for a
ny ot
her u
se.
EPA Export 29-05-2016:01:10:08

Pfizer Ireland Pharmaceuticals - Pfizer Little Island IEL Groundwater Monitoring April 2015
47092917/CKRP0001/ISSUE NO. 2/FINAL
28 April 2015 Page i
DOCUMENT PRODUCTION / APPROVAL RECORD
Issue No. 2 Name Signature Date Position
Prepared by Alex Orrell
28 April 2015 Environmental Scientist
Checked by Fergus O’Regan
28 April 2015 Project Environmental
Scientist
Approved by Kevin Forde
28 April 2015 Principal Hydrogeologist
Project Name:
Pfizer Little Island IEL
Groundwater Monitoring
Sub Title:
Round 1 (April) 2015
Project No.
47092917
Status:
Final
Client Contact Name:
Marian Slattery
Client Company Name:
Pfizer Ireland Pharmaceuticals
Issued by:
AECOM Infrastructure &
Environment Ireland Limited
Douglas Business Centre
Carrigaline Road
Douglas
Cork
www.aecom.com
DOCUMENT ISSUE RECORD
Issue No. Date Details
1 27 April 2015
Draft Issue for Client Review
2 28 April 2015
Final Issue
For
insp
ectio
n pur
pose
s only
.
Conse
nt of
copy
right
owne
r req
uired
for a
ny ot
her u
se.
EPA Export 29-05-2016:01:10:08

Pfizer Ireland Pharmaceuticals - Pfizer Little Island IEL Groundwater Monitoring April 2015
47092917/CKRP0001/ISSUE NO. 2/FINAL
28 April 2015 Page ii
Limitations
AECOM Infrastructure & Environment Ireland Limited1 (hereafter referred to as “AECOM”) has prepared this Report for
the sole use of Pfizer Ireland Pharmaceuticals in accordance with the Agreement under which our services were performed (Proposal No. P864234, dated 27 January 2015). No other warranty, expressed or implied, is made as to the professional advice included in this Report or any other services provided by AECOM. This Report is confidential and may not be disclosed by the Client or relied upon by any other party without the prior and express written agreement of AECOM. The information contained in this Report is based upon information provided by others and upon the assumption that all relevant information has been provided by those parties from whom it has been requested and that such information is accurate. Information obtained by AECOM has not been independently verified by AECOM, unless otherwise stated in the Report. The methodology adopted and the sources of information used by AECOM in providing its services are outlined in this Report. The work described in this Report is based on the conditions encountered and the information available during the said period of time. The scope of this Report and the services are accordingly factually limited by these circumstances. AECOM disclaim any undertaking or obligation to advise any person of any change in any matter affecting the Report, which may come or be brought to AECOM’s attention after the date of the Report. Certain statements made in the Report that are not historical facts may constitute estimates, projections or other forward-looking statements and even though they are based on reasonable assumptions as of the date of the Report, such forward-looking statements by their nature involve risks and uncertainties that could cause actual results to differ materially from the results predicted. AECOM specifically does not guarantee or warrant any estimate or projections contained in this Report. Unless otherwise stated in this Report, the assessments made assume that the sites and facilities will continue to be used for their current purpose without significant changes.
Copyright
© This Report is the copyright of AECOM Infrastructure & Environment Ireland Limited a wholly owned subsidiary of AECOM. Any unauthorised reproduction or usage by any person other than the addressee is strictly prohibited.
1On 16 March 2015 the name of URS Ireland Limited changed to AECOM Infrastructure & Environment Ireland Limited to reflect the
company’s status as a wholly owned subsidiary through which AECOM operates in Ireland
For
insp
ectio
n pur
pose
s only
.
Conse
nt of
copy
right
owne
r req
uired
for a
ny ot
her u
se.
EPA Export 29-05-2016:01:10:08

Pfizer Ireland Pharmaceuticals - Pfizer Little Island IEL Groundwater Monitoring April 2015
47092917/CKRP0001/ISSUE NO. 2/FINAL
28 April 2015 Page iii
TABLE OF CONTENTS
EXECUTIVE SUMMARY 1
1. INTRODUCTION 3
1.1.1 Background Information 3
1.1.2 Site History 3
1.1.3 Site Description, Topography and Setting 3
1.1.4 Hydrology 4
1.1.5 Soils and Geology 4
1.1.6 Hydrogeology 5
1.1.7 Groundwater Flow 5
1.1.8 Groundwater Redox Chemistry 5
1.1.9 Chemicals of Potential Concern 6
1.1.10 Source-Pathway-Receptor Linkages 6
1.1.11 Monitoring Network and Sampling Schedule 7
1.2 Project Objectives 7
1.3 Scope of Works 7
1.3.1 Sampling Methodology 8
1.3.2 Laboratory Analyses 8
2. RESULTS AND DISCUSSION OF MONITORING PROGRAMME 9
2.1 Site Hydrogeology and Groundwater Flow 9
2.1.1 Water Quality Parameters 9
2.1.2 Groundwater Flow Gradient 9
2.1.3 Field Observations 9
2.2 Laboratory Analysis of Groundwater Samples 10
2.2.1 Assessment Guidelines 10
2.2.2 Groundwater Monitoring Results 10
2.2.3 Temporal Trends in Chemicals of Potential Concern 11
2.3 Conceptual Site Model 12
2.3.1 Potential Pollutant Linkages 13
3. SUMMARY, CONCLUSIONS AND RECOMMENDATIONS 14
3.1 Summary and Conclusion 14
3.2 Recommended Way Forward 14
FIGURES
TABLES
APPENDIX A – LABORTORY CERTIFICATES
For
insp
ectio
n pur
pose
s only
.
Conse
nt of
copy
right
owne
r req
uired
for a
ny ot
her u
se.
EPA Export 29-05-2016:01:10:08

Pfizer Ireland Pharmaceuticals - Pfizer Little Island IEL Groundwater Monitoring April 2015
47092917/CKRP0001/ISSUE NO. 2/FINAL
28 April 2015 Page iv
TABLE OF TABLES
TABLE 1 - Sample Inventory, Pfizer Little Island - April 2015
TABLE 2 - Volatile Organic Compound Results (mg/L), Pfizer Little Island - April 2015
TABLE 3 - Semi Volatile Organic Compound Results (mg/L), Pfizer Little Island - April 2015
TABLE 4 - Major Ion Concentrations (mg/L), Pfizer Little Island - April 2015
TABLE 5 - Groundwater Quality Measurements, Pfizer Little Island - April 2015
TABLE 6 - Groundwater Level Data, Pfizer Little Island - 08 April 2015
TABLE 7 - Key Contaminant Concentration Trends in Monitored Wells (mg/L), Pfizer Little Island to April 2015
TABLE OF FIGURES
FIGURE 1 - Site Location Plan
FIGURE 2 - Site Layout Plan Showing Borehole Locations
FIGURE 3 - Groundwater Contour Map - Gravel Aquifer (08 April 2015)
FIGURE 4 - Schematic Conceptual Site Model Illustration
FIGURE 5 - Historical Toluene and MTBE Concentration Trend Data for Well 203
FIGURE 6 - Historical Toluene and MTBE Concentration Trend Data for Well 301
FIGURE 7 - Historical Toluene and MTBE Concentration Trend Data for Well 302
FIGURE 8 - Historical Toluene and MTBE Concentration Trend Data for Well 304
FIGURE 9 - Historical Toluene and MTBE Concentration Trend Data for Well 404
For
insp
ectio
n pur
pose
s only
.
Conse
nt of
copy
right
owne
r req
uired
for a
ny ot
her u
se.
EPA Export 29-05-2016:01:10:08

Pfizer Ireland Pharmaceuticals - Pfizer Little Island IEL Groundwater Monitoring April 2015
47092917/CKRP0001/ISSUE NO. 2/FINAL
28 April 2015 Page 1
EXECUTIVE SUMMARY
The first groundwater monitoring round for 2015 was conducted by AECOM on 08 April 2015 at the Pfizer Ireland Pharmaceuticals Limited site, Little Island, Co. Cork. The monitoring was completed in accordance with the site’s Industrial Emissions Licence (IEL) and is reported in accordance with Stage 1 - Step 2 of the Environmental Protection Agency’s (EPA) Guidance on the Management of Contaminated Land and Groundwater at EPA Sites, issued in 2013.
During April 2015, groundwater from the following monitoring wells was sampled:
• 200-series wells – well 203 (plus duplicate Dup 01) and well 207
• 300-series wells – wells 301, 302, 304 and 305
• 400-series wells – well 404
• 600-series wells – well 604
No floating/sinking non-aqueous phase liquid layer was detected in any of the groundwater monitoring wells.
The site is underlain by sand and gravel fill, overlying natural gravelly silt, which in turn overlies limestone gravels. Depth to bedrock has not been proven (>16 m below ground level) on the Pfizer Little Island site. The general groundwater flow direction in the gravel aquifer in April 2015 was to the north and north-west (toward Bury’s Bridge Basin).
Field measurements of water quality parameters and low nitrate concentrations are consistent with results of previous monitoring rounds and indicate that groundwater beneath the site is low in dissolved oxygen and is reducing (anaerobic). However, groundwater is not sufficiently reducing for the widespread generation of hydrogen sulphide gas – hydrogen sulphide odours were detected at only one well (well 203) during purging and sampling in April 2015.
Groundwater analytical results for methyl tertiary butyl ether (MTBE) in April 2015 are higher than the previous monitoring round in October 2014. Volatile organic compound results are still amongst the lowest recorded in recent years, with MTBE concentrations being recorded at below the laboratory method detection limit at two of the eight wells monitored. Between October 2014 and April 2015, the MTBE concentration increased to above the Draft Interim Guideline Value (IGV) (0.030 mg/L) in groundwater from well 203 (from 0.002 mg/L to 0.047 mg/L) and at well 404 (from 0.020 mg/L to 0.164 mg/L).
In April 2014, the EPA requested that well 604, (drilled on the Buffer Property in November 2013) be included in all future groundwater monitoring rounds. Well 604 recorded the highest MTBE concentrations in both monitoring rounds in 2014. The recorded MTBE concentration in April 2015 (0.064 mg/L) was similar to October 2014 (0.062 mg/L). The continual detection of MTBE in groundwater from well 604 since it was drilled and installed in November 2013 indicates that MTBE is continuing to be flushed through the sand and gravel aquifer beneath the site towards Bury’s Bridge Basin.
The IGV for MTBE (0.03 mg/L) was exceeded at three of the wells sampled, well 203 (0.047 mg/L), well 404 (0.164 mg/L) and well 604 (0.064 mg/L). However, the April 2015 groundwater monitoring results continue to demonstrate the general long-term declining trend in MTBE concentrations observed since significant upgrades to the site effluent drainage system between 2006 and 2008.
Toluene was not detected in groundwater from any well sampled in April 2015; the most recent toluene detection was in March 2009 at well 203 (0.002 mg/L).
In April 2015, chloroform was detected at a concentration of 0.024 mg/L in groundwater from well 404. This represents a decrease in concentration compared to October 2014, when chloroform was detected at a concentration of 0.271 mg/L. Prior to 2014, chloroform was previously detected in groundwater from well 404 in May 2012 (0.309 mg/L).
The site does not currently use chloroform and concentrations of chloroform were historically higher when chloroform was being used on site.
For
insp
ectio
n pur
pose
s only
.
Conse
nt of
copy
right
owne
r req
uired
for a
ny ot
her u
se.
EPA Export 29-05-2016:01:10:08

Pfizer Ireland Pharmaceuticals - Pfizer Little Island IEL Groundwater Monitoring April 2015
47092917/CKRP0001/ISSUE NO. 2/FINAL
28 April 2015 Page 2
In the 2000 Qualitative Risk Assessment, AECOM (then URS Dames & Moore) estimated that worst-case MTBE concentrations of up to 10 mg/L in Bury’s Bridge Basin would not cause significant harm to the aquatic ecosystem
2.
Given that MTBE concentration along the down-gradient site boundary in April 2015 is more than two orders of magnitude lower than 10 mg/L (0.064 mg/L at well 604) and the potential for dilution in the basin is great, potential environmental impact of MTBE in groundwater discharging to the basin under April 2015 conditions is considered to be negligible.
Based on the Round 1 2015 groundwater monitoring results, AECOM continue to recommend that the frequency of groundwater sampling be reduced from biannually to annually.
2 URS Dames & Moore (AECOM legacy company) report, 13218-123-447, dated January 2001
For
insp
ectio
n pur
pose
s only
.
Conse
nt of
copy
right
owne
r req
uired
for a
ny ot
her u
se.
EPA Export 29-05-2016:01:10:08

Pfizer Ireland Pharmaceuticals - Pfizer Little Island IEL Groundwater Monitoring April 2015
47092917/CKRP0001/ISSUE NO. 2/FINAL
28 April 2015 Page 3
1. INTRODUCTION
AECOM Infrastructure & Environment Ireland Limited (AECOM) was requested by Pfizer Ireland Pharmaceuticals (Pfizer) to conduct biannual groundwater monitoring during 2015 at their Little Island facility, Co. Cork. The groundwater monitoring programme was detailed in AECOM Proposal P864234, dated 27 January 2015 and authorised by Pfizer under their purchase order number N-3544316, dated 28 January 2015.
The AECOM team for Round 1 April 2015 comprised the following:
• Project Director: Kevin Forde, Principal Hydrogeologist
• Project Manager: Fergus O’Regan, Project Environmental Scientist
• Field Scientist: Alex Orrell, Environmental Scientist
Laboratory analysis of samples was subcontracted to Jones Environmental, Flintshire, U.K.; an-AECOM approved laboratory with UKAS accreditation.
1.1.1 Background Information
1.1.2 Site History
The Pfizer Little Island facility is situated in an industrial estate approximately 8 kilometres east of Cork City. A site location plan is presented as Figure 1.
The facility, originally developed in 1978 by Plaistow Limited, manufactures synthetic chemicals of bulk active pharmaceutical ingredients (API) for use in the pharmaceutical industry. Warner Lambert acquired the site in 1997 and merged with Pfizer in 2000.
The site was granted an Integrated Pollution, Prevention and Control (IPPC) licence (P0136-01) in December 1996 by the Environmental Protection Agency (EPA). This licence was most recently revised in 2010 (P0136-04). IPPC licence P0136-04 was converted by the EPA in January 2014 to an Industrial Emissions Licence (IEL) in line with provisions and requirements of Council Directive 2010/75/EU.
Groundwater and localised soil contamination by organic solvents, predominantly methyl tertiary butyl ether (MTBE) and toluene have been previously identified at the Pfizer Little Island facility. Groundwater discharges from the facility to a surface water body adjacent to the site called Bury’s Bridge Basin.
Significant upgrades to the sites effluent drainage system were made between 2006 and 2008 by Pfizer, including bringing effluent drainage above ground where feasible.
Based on the decline in MTBE concentrations across the site, risk assessment of the presence of MTBE in groundwater predicted no significant environmental impacts on the aquatic flora and fauna in Bury’s Bridge Basin due to exposure to low concentrations of MTBE
3.
1.1.3 Site Description, Topography and Setting
The main site comprises a manufacturing facility with associated administration buildings, on-site and off-site car parks and a waste water treatment plant (WWTP). The site manufactures bulk API and is often referred to as the API site. The API site is approximately 4.5 ha in area.
In 2005, Pfizer acquired approximately 2.26 ha of land located to the west of the API site. This area is referred to as the ‘Buffer Property’ (BP) and was incorporated within a revised site boundary in the IPPC licence revision for the main site in 2007/2008 (IPPC licence revision P0136-03).
In general, the API site slopes upwards to the north, before sloping down towards Bury’s Bridge Basin, a tidal channel located immediately north of the site. Ground elevation at the site varies between approximately 2 m and 11 m above Ordnance Datum (aOD).
3 AECOM report, Assessment of MTBE Persistence in the Source Area, Pfizer, Little Island, Cork, dated 14 November 2002, ref. 17717-
113-447/KF
For
insp
ectio
n pur
pose
s only
.
Conse
nt of
copy
right
owne
r req
uired
for a
ny ot
her u
se.
EPA Export 29-05-2016:01:10:08

Pfizer Ireland Pharmaceuticals - Pfizer Little Island IEL Groundwater Monitoring April 2015
47092917/CKRP0001/ISSUE NO. 2/FINAL
28 April 2015 Page 4
By contrast, the BP is relatively flat and is at a general elevation of less than 5 m aOD (Malin). The BP is at a lower elevation than surrounding lands to the west, south and east, which reach elevations of approximately 10 m aOD to the south and east and up to 15 m aOD to the west.
Land use in the vicinity of the main API site is predominantly commercial/industrial, as summarised below:
North – Bury’s Bridge Basin and N25 dual carriageway.
South – Cara Partners (IEL P0017-02, a homeopathic medicine production facility) is located to the south. Further south is the Little Island main road, with the shoreline of Cork Harbour 75 m beyond that.
East – Empty industrial units (including the former Showerlux site) are to the east. Further to the east is a major development of office and light industrial facilities (Eastgate Business Park).
West – Cara Partners fire water retention pond and a Bord Gais Eireann above ground installation (AGI, gas transmission infrastructure) immediately to the west. Further to the west is the BP, and beyond that Tapella Limited (Integrated Pollution Control (IPC) licence P0103-02, former pharmaceutical facility), where a number of small start-up businesses occupy the former office, laboratory and warehouse buildings (now termed the Hoffman Science Technology Enterprise Park). The other buildings associated with the former pharmaceutical facility have been demolished.
The BP has not been developed since it was acquired in 2005, other than fencing-off the boundaries of the area and some improvements to the surface water drainage. Bury’s Bridge Basin lies on the northern boundary of the BP and beyond that is the N25 dual carriageway.
Other nearby chemical/pharmaceutical facilities includes:
• Janssen Pharmaceuticals, (IEL P016-02)
• Irotec (pharmaceutical)
• FMC (pharmaceutical)
• Thornbush Holdings Limited, (IPC licence P0389-01)
Little Island is also shared by a small number of residences. Within 1 km of the facility there is a population of approximately 500 people and a primary school is located approximately 1 km to the east of the facility.
A site layout plan is presented as Figure 2.
1.1.4 Hydrology
Little Island is located in the northern part of Cork Harbour called Lough Mahon. Bury’s Bridge Basin, a tidal channel on the sites northern boundary, eventually flows into Lough Mahon, which is located approximately 750 m west of the site. The basin comprises of a mudflat, and a narrow intertidal channel.
The estuarine water quality in Lough Mahon is classified as ‘Intermediate’ by the EPA4.
Under the Water Framework Directive (WFD) (2007-2009 data), Lough Mahon, a Transitional Waterbody, is classified as ‘Good’.
There are no significant rivers in close proximity to the API production site or BP. The nearest river is the Glashaboy River, which is located approximately 1.5 km north-west of the industrial estate and which flows from north to south into Lough Mahon.
1.1.5 Soils and Geology
Geological Survey of Ireland (GSI) data5 indicate that the bedrock aquifer underlying the site
consists of ‘Dinantian Pure Unbedded Limestone’. According to the GSI, the majority of the site is
4 www.epa.ie, accessed on 09 April 2015
5 www.gsi.ie, accessed on 09 April 2015
For
insp
ectio
n pur
pose
s only
.
Conse
nt of
copy
right
owne
r req
uired
for a
ny ot
her u
se.
EPA Export 29-05-2016:01:10:08

Pfizer Ireland Pharmaceuticals - Pfizer Little Island IEL Groundwater Monitoring April 2015
47092917/CKRP0001/ISSUE NO. 2/FINAL
28 April 2015 Page 5
covered with made ground overlying bedrock with glacial sandstone tills occupying a small section in the eastern part of the site, however site specific geological data contradicts the GSI information and indicates tills overlying sands and gravels below the fill across the entire site.
Subsoil thickness varies across the Pfizer Little Island site, with actual drilling records indicating sand and gravel fill overlying natural gravelly silts overlying limestone gravels. Drilling on site has not proven depth to bedrock (>16 m below ground level (bgl)). Limestone rock outcrop and subcrop are also located in the vicinity of the Inchera House and Quarry, located approximately 600 m west of the site boundary.
1.1.6 Hydrogeology
According to the GSI online maps, the Waulsortian bedrock aquifer in the region is classified as a Regionally Important Aquifer – karstified, diffuse (Rkd). Northern sections of the site boarder a “locally important aquifer (LI), which is moderately productive in local zones”. The GSI classifies the interim vulnerability of the underlying aquifer as ‘High’.
There is a groundwater abstraction well on the API production site. The well was drilled in 2010 on the eastern side of the site to approximately 16 m bgl and installed within the gravel aquifer. Water from the well (referred to in this report as the Production Well) was being used for cooling purposes in the WWTP. The daily average volume of water abstracted from the Production Well during 2014 was 23 m
3/d, with elevated salinity. There has been no abstraction of groundwater from the well
since early December 2014.
Two wells are recorded in the GSI database within a 1 km radius of the API site. One borehole is identified approximately 300 m to the south, with a second well (industrial use) approximately 650 m to the south-east of the site. No details are available as to whether the wells are currently in use; what geological unit the wells abstract groundwater from; or, the depth from which they abstract groundwater. Given that groundwater in this coastal area is likely to be brackish and, as they are situated in a heavily commercial/industrial area, it is unlikely that wells for potable use are located in the vicinity of the site. It is considered that wells in the vicinity of the site are likely to be groundwater monitoring wells or used for industrial supply purposes.
There are four wells reported on the GSI database within 2 km radius of the BP, all of which are groundwater monitoring wells installed at industrial sites as part of the conditions attached to EPA regulatory licences.
Groundwater vulnerability in the general Wallingstown area is assessed as “High” by the GSI because of the predominantly thin and permeable subsoils present, with areas of “Extreme” vulnerability immediately to the west of the BP (rock mapped at, or close to, the surface, there is an old limestone quarry in this area).
1.1.7 Groundwater Flow
Depth to groundwater ranges from 2.5 m to 6.5 m below casing top (m bct); with groundwater flow directions in the limestone gravel aquifer beneath the main site to the north and north-west (towards Bury’s Bridge Basin).
The majority of the API site is covered by either concrete hard standing or tarmac at ground level, which restricts infiltration of rainfall to the gravel aquifer beneath.
Given proximity to the tidal Bury’s Bridge Basin, groundwater beneath the BP is anticipated to show tidal fluctuations. Groundwater is interpreted to follow the topography and flow from more elevated lands surrounding the BP, possibly converging on the BP from the west, south and east.
Groundwater from beneath the BP is expected to discharge northward to Bury’s Bridge Basin. There is historical direct evidence of groundwater discharge to the basin via coarser areas within the mud flats to the immediate north-west of the main site at low tide however; these areas have been subsequently infilled and developed.
1.1.8 Groundwater Redox Chemistry
Field measurements of dissolved oxygen and oxidation redox potential (ORP), together with low nitrate concentrations suggest groundwater conditions are both reducing and anaerobic down-gradient of the former Aeration Basin area of the site. However, groundwater is not sufficiently reducing for the widespread generation of hydrogen sulphide gas – hydrogen sulphide odours were detected during purging and sampling of only one of the wells monitored (well 203) in April 2015.
For
insp
ectio
n pur
pose
s only
.
Conse
nt of
copy
right
owne
r req
uired
for a
ny ot
her u
se.
EPA Export 29-05-2016:01:10:08

Pfizer Ireland Pharmaceuticals - Pfizer Little Island IEL Groundwater Monitoring April 2015
47092917/CKRP0001/ISSUE NO. 2/FINAL
28 April 2015 Page 6
1.1.9 Chemicals of Potential Concern
Groundwater monitoring results are available going back to 1997 for selected wells (see Table 7). MTBE is the only remaining chemical of concern detected in groundwater at the site.
Toluene has historically been detected in groundwater beneath the site, but has remained below the laboratory method detection limit (MDL) since March 2009.
Other volatile organic compounds (VOCs), such as chloroform, are occasionally detected in groundwater from monitoring wells, but generally at low concentrations.
Since significant upgrades to the site effluent drainage system between 2006 and 2008, the general trend has been for VOC concentrations in groundwater to decrease.
The highest VOC concentration historically reported was for MTBE, historically detected in groundwater from monitoring well 404 at a peak concentration of 1,098 mg/L in May 2005. This well is located in the south western corner of the site, in the area of the former Aeration Basin. Since May 2011, MTBE concentrations in groundwater from well 404 have been below 0.20 mg/L.
The highest concentration historically reported for toluene was 190 mg/L, detected in groundwater from monitoring well 203 in November 1997. Since September 2009, toluene results from well 203 have been consistently below the laboratory MDL.
1.1.10 Source-Pathway-Receptor Linkages
A summary of potential Source-Pathway-Receptor (SPR) linkages are outlined in the table below.
POTENTIAL SPR LINKAGES
Sources Pathways Receptor
S1 MTBE and other VOCs in soil and groundwater related to historical leaks from underground pipelines
Human Health
P1 Ingestion of soil/dust, groundwater or surface water
P2 Dermal contact with soil, dust, and groundwater
P3 Inhalation of indoor and outdoor contaminant vapours which can arise directly from residual contaminants in the unsaturated overburden itself and indirectly via the dissolved phase in groundwater
Human Health
R1 On-site workers
R2 Off-site workers
R3 Workers on-site undertaking subsurface works
Controlled Waters
P4 Lateral migration of contaminants through the gravel aquifer
Water Supply Well
There are no known potable water supplies within 300 m of site
On-site production well – used for cooling purposes not potable supply
Controlled Waters
R4 Bury’s Bridge Basin
R5 Cork Harbour SPA (No. 004030)
R6 Dunkettle Shore (pNHA)
For
insp
ectio
n pur
pose
s only
.
Conse
nt of
copy
right
owne
r req
uired
for a
ny ot
her u
se.
EPA Export 29-05-2016:01:10:08

Pfizer Ireland Pharmaceuticals - Pfizer Little Island IEL Groundwater Monitoring April 2015
47092917/CKRP0001/ISSUE NO. 2/FINAL
28 April 2015 Page 7
1.1.11 Monitoring Network and Sampling Schedule
Over several years of site investigation, Pfizer has built up a network of monitoring wells on the API site. Monitoring wells on-site are screened at various depths but all are within subsoils; there are no monitoring wells screened within the bedrock aquifer.
In November 2013, four boreholes were drilled on the BP to a maximum depth of 10 m bgl, to assist in the preparation of a hydrogeological assessment report
6. All four groundwater monitoring wells
were screened within the gravel aquifer.
Former IPPC and IPC licence requirements included monitoring of groundwater on a monthly and quarterly basis across the site from selected wells.
Due to improvements in infrastructure and groundwater quality at the site, the EPA agreed in 2007 to reduce groundwater monitoring frequency from quarterly to biannually, under a revised IPPC licence.
In May 2010, the EPA further agreed to remove wells 403 and 501 from the sampling schedule and requested that wells 206 and 303 be monitored biennially as opposed to biannually.
As agreed with the EPA in August 2012, wells 201, 202, 205A and 405 were removed from monitoring schedule.
Groundwater from the following wells is sampled in accordance with the site’s IEL:
• Biannual sampling: 203, 207, 301, 302, 304, 305, 404
• Biennial sampling: 206 and 303
In February 2014, the EPA requested that well 604 be sampled in all future groundwater monitoring rounds.
The suite of parameters analysed for in each monitoring round generally includes:
• VOCs
• Semi-Volatile Organic Compounds (SVOCs), including polycyclic aromatic hydrocarbons (PAHs)
• Major Ions (calcium, magnesium, potassium, sodium, sulphate, chloride, nitrate and total alkalinity)
• pH
• Electrical conductivity (EC)
1.2 Project Objectives
The main objective of groundwater monitoring is to ensure that the Pfizer Little Island site complies with groundwater monitoring requirements detailed in the site’s IEL and as agreed with the EPA.
Secondary objectives of the monitoring are:
• To assess short and long-term concentration trends in key chemicals of potential concern for the selected wells
• To assess groundwater flow direction in the gravel aquifer
1.3 Scope of Works
Fieldwork for Round 1 (April) 2015 monitoring was carried out on 08 April 2015.
6 AECOM Report, CKRP0003/47092578, Issue 4/Final, dated 28 March 2014
For
insp
ectio
n pur
pose
s only
.
Conse
nt of
copy
right
owne
r req
uired
for a
ny ot
her u
se.
EPA Export 29-05-2016:01:10:08
Pfizer Ireland Pharmaceuticals - Pfizer Little Island IEL Groundwater Monitoring April 2015
47092917/CKRP0001/ISSUE NO. 2/FINAL
28 April 2015 Page 8
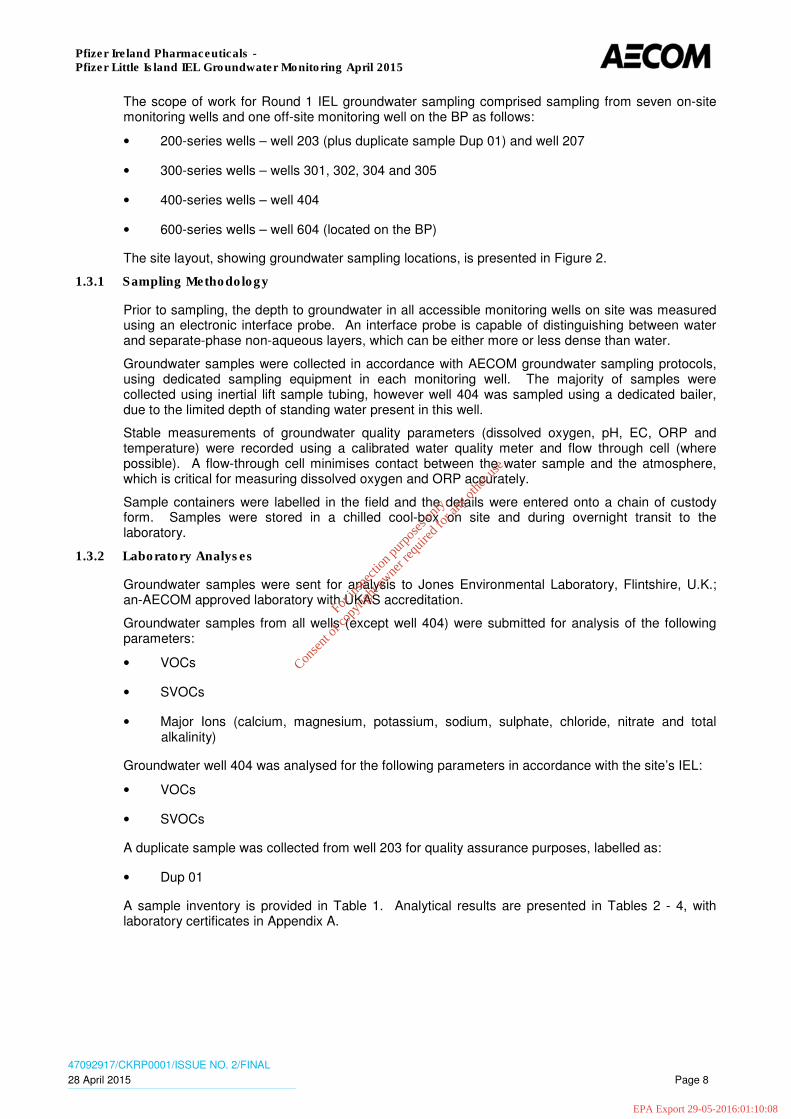
The scope of work for Round 1 IEL groundwater sampling comprised sampling from seven on-site monitoring wells and one off-site monitoring well on the BP as follows:
• 200-series wells – well 203 (plus duplicate sample Dup 01) and well 207
• 300-series wells – wells 301, 302, 304 and 305
• 400-series wells – well 404
• 600-series wells – well 604 (located on the BP)
The site layout, showing groundwater sampling locations, is presented in Figure 2.
1.3.1 Sampling Methodology
Prior to sampling, the depth to groundwater in all accessible monitoring wells on site was measured using an electronic interface probe. An interface probe is capable of distinguishing between water and separate-phase non-aqueous layers, which can be either more or less dense than water.
Groundwater samples were collected in accordance with AECOM groundwater sampling protocols, using dedicated sampling equipment in each monitoring well. The majority of samples were collected using inertial lift sample tubing, however well 404 was sampled using a dedicated bailer, due to the limited depth of standing water present in this well.
Stable measurements of groundwater quality parameters (dissolved oxygen, pH, EC, ORP and temperature) were recorded using a calibrated water quality meter and flow through cell (where possible). A flow-through cell minimises contact between the water sample and the atmosphere, which is critical for measuring dissolved oxygen and ORP accurately.
Sample containers were labelled in the field and the details were entered onto a chain of custody form. Samples were stored in a chilled cool-box on site and during overnight transit to the laboratory.
1.3.2 Laboratory Analyses
Groundwater samples were sent for analysis to Jones Environmental Laboratory, Flintshire, U.K.; an-AECOM approved laboratory with UKAS accreditation.
Groundwater samples from all wells (except well 404) were submitted for analysis of the following parameters:
• VOCs
• SVOCs
• Major Ions (calcium, magnesium, potassium, sodium, sulphate, chloride, nitrate and total alkalinity)
Groundwater well 404 was analysed for the following parameters in accordance with the site’s IEL:
• VOCs
• SVOCs
A duplicate sample was collected from well 203 for quality assurance purposes, labelled as:
• Dup 01
A sample inventory is provided in Table 1. Analytical results are presented in Tables 2 - 4, with laboratory certificates in Appendix A.
For
insp
ectio
n pur
pose
s only
.
Conse
nt of
copy
right
owne
r req
uired
for a
ny ot
her u
se.
EPA Export 29-05-2016:01:10:08

Pfizer Ireland Pharmaceuticals - Pfizer Little Island IEL Groundwater Monitoring April 2015
47092917/CKRP0001/ISSUE NO. 2/FINAL
28 April 2015 Page 9
2. RESULTS AND DISCUSSION OF MONITORING PROGRAMME
2.1 Site Hydrogeology and Groundwater Flow
2.1.1 Water Quality Parameters
Table 5 presents field water quality measurements of dissolved oxygen, pH, ORP, EC and temperature for all wells sampled in April 2015.
In Round 1 2015, dissolved oxygen readings were low across the site, ranging between 1.11 mg/L (well 301) and 4.11 mg/L (shallow well 404).
Field readings of ORP (relative to Ag/AgCl) were compensated as per the manufacturer’s instructions, giving adjusted Eh readings of between 102 mV (well 203) and 224 mV (well 305).
Dissolved oxygen readings and field ORP results indicate anaerobic groundwater conditions beneath the site.
Groundwater pH readings were all below neutral, ranging between 6.01 (well 304) and 6.99 (well 207) in April 2015. All readings were within the typical range for Irish groundwater (6 - 9 pH units).
EC values measured in the field ranged from 304 µS/cm (well 305) to 2,664 µS/cm (well 207). The recorded EC values for April 2015 are comparable to those recorded in previous monitoring rounds. The higher EC reading for well 207 confirms analytical results, which show elevated major ion concentrations.
Groundwater temperatures recorded in Round 1 2015 were between 11.1 °C (well 305) and 14.0 °C (well 304). Groundwater temperature values were generally slightly above the normal range for groundwater in Ireland of 10.0 ºC to 12.0 ºC. All groundwater temperatures were within previously observed ranges at the site.
2.1.2 Groundwater Flow Gradient
Depth to groundwater measurements and calculated water table elevations from all accessible wells in Round 1 2015 are presented in Table 6. Depth to groundwater ranged from 2.68 m bct in well 403 to 6.43 m bct in well 301. The Production Well (installed in 2010) was dipped during Round 1 2015 and the water level was gauged at 6.36 m bct. Site personnel have informed AECOM that the Pfizer Production Well has not been pumped since late December 2014.
A piezometric surface contour map for the deeper gravel aquifer is presented as Figure 3.
The overall direction of groundwater flow is interpreted from the groundwater elevation data to be to the north and north-west, toward Bury’s Bridge Basin. This is consistent with previous interpretations of groundwater flow across the site.
2.1.3 Field Observations
During the water level measurement round, no light/dense NAPL layers were identified in any of the wells.
Considerable amounts of silt have entered the well-head chamber at well 207. As recommended by AECOM in previous monitoring reports, the cover and headworks of the well have now been re-sealed, to prevent further ingress of silt and surface water run-off.
The total depth of each well, as measured on 08 April 2015, has been compared to the reported well depths on installation (Table 6). Some siltation has occurred in most wells, with the thickness of silt accumulating in the base of each well ranging from 0.02 m (wells 402 and 403) to 2.98 m (well 207). The accumulation of silt in the base of wells 202 and 207 is greater than 30% of the total screen length in these wells (99% of screen in well 207).
During the October 2011 monitoring round, a surge block was used to try to remove this accumulated silt from well 207. The well was purged for over an hour and it was considered that the removal of silt was not occurring at a quick enough rate to continue.
In May 2012, a surge block was used to try and remove accumulated silt from well 202. Well 202 is located in the production area. Site safety restrictions prevented the use of a petrol powered pump and so well rehabilitation was attempted by purging the well by hand. Over 30 litres of water was purged from the well. Fine silt, but mostly coarse black sand was removed
For
insp
ectio
n pur
pose
s only
.
Conse
nt of
copy
right
owne
r req
uired
for a
ny ot
her u
se.
EPA Export 29-05-2016:01:10:08

Pfizer Ireland Pharmaceuticals - Pfizer Little Island IEL Groundwater Monitoring April 2015
47092917/CKRP0001/ISSUE NO. 2/FINAL
28 April 2015 Page 10
from the well. During well rehabilitation the total depth of the well decreased slightly rather than increased. It is considered possible that the base of the well is damaged and that coarse silica sand, now coated with organic deposits, that was used as a filter pack during the construction of the well, is entering at the base of the well.
2.2 Laboratory Analysis of Groundwater Samples
The results of laboratory analysis of groundwater samples are presented in Tables 2 to 4.
2.2.1 Assessment Guidelines
Preliminary assessment of groundwater field and analytical data was completed by comparing the results with a range of generic groundwater assessment criteria, specifically the Groundwater Threshold Values (GTVs), Draft Interim Guideline Values (IGVs) and the Dutch Intervention Values (DIVs).
GTVs are defined in Irish law in Statutory Instrument No. 9 of 2010, European Communities Environmental Objectives (Groundwater) Regulations, 2010. The GTVs are statutory Irish regulatory guidelines which were developed to give effect to the European Union Groundwater Directive. Exceedance of a threshold value triggers further investigation to confirm whether a ‘Poor’ groundwater chemical status for the groundwater body as a whole is indicated.
The IGVs were developed by the EPA using a number of existing water quality guidelines in use in Ireland, including existing national environmental quality standards, proposed common indicators for the new groundwater directive, drinking water standards and GSI trigger values.
The DIVs represent concentrations, above which there may be a risk to human receptors, and above which more detailed site-specific risk assessment or remediation may be required in the Netherlands. These guidelines have no legal standing in Ireland and are used as a screening tool for assessment of potential contaminants only.
2.2.2 Groundwater Monitoring Results
2.2.2.1 Volatile Organic Compounds
Based on historical data, MTBE is the primary chemical of concern at the site. MTBE concentrations reported at each well sampled in April 2015 are presented in Table 2 and historic results are presented in Table 7.
MTBE concentrations in groundwater from well 207 and well 305 were below the laboratory MDL of 0.0001 mg/L in April 2015.
In groundwater from wells 301, 302 and 304 MTBE was detected above the MDL but at concentrations that did not exceed the IGV (0.03 mg/L) or DIV (9.20 mg/L).
In April 2015, the MTBE results for wells 203 (and Dup 1), 404 and 604, exceeded the IGV but were considerably below the DIV. The highest concentration of MTBE was recorded at well 404 (0.164 mg/L).
There is no GTV defined for MTBE.
In April 2015, chloroform was detected in groundwater from well 404 at a concentration of 0.024 mg/L. The result exceeds the IGV (0.012 mg/L), but is below both the GTV (0.075 mg/L) and the DIV (0.40 mg/L). Chloroform was detected in groundwater from well 404 in April 2014 (0.096 mg/L) and October 2014 (0.271 mg/L) and previously in May 2012 (0.309 mg/L).
In April 2015, all other VOCs concentrations were below their respective MDLs (see Table 2).
Other VOCs which have been occasionally detected in groundwater at the site include: 1,1-dichloroethane, 1,1,1-trichloroethane and 1,2-dichlorobenzene.
2.2.2.2 Semi-Volatile Organic Compounds
SVOC results are presented in Table 3. No SVOCs were detected above MDLs in April 2015.
2.2.2.3 Major Ions
As required by the EPA, seven monitoring wells (200- and 300- series wells, plus well 604) were analysed for selected major ions in April 2015. Major ion results are presented in Table 4.
For
insp
ectio
n pur
pose
s only
.
Conse
nt of
copy
right
owne
r req
uired
for a
ny ot
her u
se.
EPA Export 29-05-2016:01:10:08

Pfizer Ireland Pharmaceuticals - Pfizer Little Island IEL Groundwater Monitoring April 2015
47092917/CKRP0001/ISSUE NO. 2/FINAL
28 April 2015 Page 11
Major ion results in April 2015 were within previously reported concentration ranges for all of the wells.
In April 2015, elevated concentrations (relative to the other wells on site) of magnesium (83 mg/L), potassium (15 mg/L), sodium (348 mg/L), sulphate (500 mg/L) and chloride (571 mg/L) were reported in groundwater from up-gradient well 207. Each of the listed five major ion concentrations in groundwater from well 207 exceeded their respective IGVs (and GTVs where applicable).
Historically, groundwater from well 207 consistently records the highest major ion concentrations at the site. Well 207 is the deepest monitoring well on site and is likely to be intersecting groundwater from the transition zone between shallow fresh water and deeper more brackish/saline water, which would account for the higher major ion concentrations. The higher major ion concentrations are also consistent with the higher field reading of EC (2,664 µS/cm) for well 207. The nearby Production Well is of similar depth to well 207 and also records brackish/saline water.
2.2.2.4 Duplicate Sample
Duplicate sample analyses of groundwater from well 203 showed good correlation. The majority of the Relative Percentage Differences (RPDs) including the MTBE results for the primary and duplicate samples were <5%. The highest RPD was 14% for sulphate for well 203 and Dup 01.
2.2.3 Temporal Trends in Chemicals of Potential Concern
Groundwater monitoring results are available going back to 1997 for selected wells (see Table 7 and Figures 5 to 9).
MTBE is the only remaining compound of concern in groundwater at the Pfizer Little Island site.
The following trends in MTBE concentrations were noted in April 2015:
• The MTBE concentration in groundwater from well 203 increased from 0.002 mg/L in October 2014 to 0.047 mg/L in April 2015. The April 2015 MTBE result exceeds the IGV (0.03 mg/L) but is considerably lower than the DIV (9.20 mg/L). During recent monitoring rounds, MTBE concentrations in groundwater from well 203 are frequently below the IGV and were last detected above the DIV in September 2006 (Figure 5)
• MTBE remains below the MDL (<0.0001 mg/L) in groundwater from up-gradient well 207
• In groundwater from well 301 the MTBE concentration increased marginally from below the MDL (<0.0001 mg/L) in October 2014 to 0.002 mg/L in April 2015 (Figure 6)
• The MTBE concentration in groundwater from well 302 decreased between October 2014 (0.007 mg/L) and April 2015 (0.001 mg/L). The MTBE concentration in groundwater from well 302 has been below the IGV since October 2011 (Figure 7)
• In groundwater from well 304, MTBE increased marginally from 0.001 mg/L in April 2014 to 0.002 mg/L in April 2015. MTBE concentrations in groundwater from well 304 have been below the DIV since December 2005 and below the IGV since April 2010 (Figure 8)
• MTBE remains below the MDL in groundwater from well 305
• At well 404, the MTBE concentration increased from 0.020 mg/L in October 2014 to 0.164 mg/L in April 2015. The reported MTBE concentration exceeds the IGV but is below the DIV. Between April 2003 and Jun 2007 and from November 2008 to March 2009, the MTBE concentration at well 404 exceeded the DIV (Figure 9)
• Well 604 was installed and first sampled in November 2013, when an MTBE concentration of 0.139 mg/L was recorded. In 2014, the concentration of MTBE in groundwater from well 604 increased to 0.162 mg/L in April then decreased to 0.062 mg/L in October. The concentration of MTBE in groundwater at well 404 in April 2015 was 0.064 mg/L, similar to the October 2014 concentration
Toluene had historically been detected in groundwater at the site, but has been below the MDL in all wells since March 2009. In April 2015, toluene remained below the laboratory MDL (0.0005 mg/L) in groundwater from all wells sampled.
For
insp
ectio
n pur
pose
s only
.
Conse
nt of
copy
right
owne
r req
uired
for a
ny ot
her u
se.
EPA Export 29-05-2016:01:10:08

Pfizer Ireland Pharmaceuticals - Pfizer Little Island IEL Groundwater Monitoring April 2015
47092917/CKRP0001/ISSUE NO. 2/FINAL
28 April 2015 Page 12
2.3 Conceptual Site Model
A schematic representation of the conceptual site model (CSM) is presented in Figure 4.
Groundwater and localised soil impacted by VOCs, predominantly toluene and MTBE, have been identified on the API site and, to a lesser extent, on the BP.
Since 1997, toluene concentrations have decreased site-wide due to source removal and natural attenuation in the aquifer. The source of toluene is considered to have been from historic drum storage on the API site and no flux of toluene to the basin is currently occurring. Toluene is no longer detected in groundwater and is no longer considered to pose a threat to Bury’s Bridge Basin.
Data from groundwater analysis indicate that there are no current, sustained elevated concentrations of organic compounds.
The source area for MTBE was largely restricted to the northern and western margins of the Main Production Building and an area south of the Production Building (OP1), which formerly contained the site’s WWTP. Groundwater impacts in this area are believed to have been related to broken effluent drains leading to the WWTP.
A drains survey in 1999 identified a damaged section of drain in this area, which was subsequently repaired. The site strong stream and weak stream effluent systems were significantly altered and upgraded between 2006 and 2008, bringing effluent drains above ground where possible. MTBE concentrations across the API site have subsequently reduced substantially from peak concentrations recorded in late 1990s and early 2000s, and MTBE is frequently below the MRL in recent monitoring rounds. Based on monitoring data reviewed from surrounding industrial sites, there does not appear to be an alternative source of MTBE in the immediate area.
There are no significant rivers or streams in close proximity to the Little Island facility. The nearest surface water body is Bury’s Bridge Basin, a shallow tidal inlet of Lough Mahon. Groundwater is unconfined within the gravel unit. Depth to groundwater is typically between 2 m and 6.5 m bgl, with equivalent groundwater elevations generally <1 m aOD. Groundwater flow direction across the API and BP portions of the site is towards the north and north-west.
Based on the available data, MTBE appears to be migrating from the area of the Main Production Building via groundwater in a generally north-western direction, discharging to the Bury’s Bridge Basin. MBTE movement towards the north-west of the site is under low head difference and groundwater follows the path of least resistance. The gravel aquifer itself is considered to be the main migration pathway, rather than a receptor, because of its lack of resource potential and the fact that groundwater is brackish to saline down-gradient of the site. Beneath the site, the fresh groundwater lens is expected to be relatively thin, given that the groundwater elevation is <1 m aOD. Natural biodegradation of MTBE is not believed to be occurring to any significant extent along the groundwater flow path in the anaerobic gravel aquifer.
Concerns about MTBE arise from the fact that its properties differ significantly from other gasoline constituents such as benzene, toluene, ethyl benzene and xylene (BTEX) compounds. MTBE is highly soluble in water, has low biodegradation potential and low sorption properties, which means that MTBE dissolves rapidly on contact with groundwater and the resulting MTBE plumes migrate rapidly, thereby threatening potential down gradient receptors. The toxicity of MTBE is low, but its low taste and odour threshold (5 –15 µg/L in water) makes it an undesirable contaminant in water used for potable water production
7.
Human toxicological data derived from both inhalation and oral routes of exposure suggest that MTBE is of low acute and sub-acute toxicity. It does not appear to be either a reproductive toxicant or to be mutagenic. The Environment Agency in the U.K., has accepted a target criterion of 0.300 mg/L (a factor of 10 higher than the Irish IGV) for a site with no nearby potable groundwater abstractions, similar to the Pfizer site
8. All April 2015 MTBE results for the Pfizer Little Island site are
below this EA criterion for MTBE.
7 Chisala BN, Tait NG, Lerner DN, 2007. Evaluating the Risks of MTBE Pollution of Urban Groundwater. Journal of Contaminant
Hydrology 91:128-145
8 Environment Agency, 2000. A Review of the Current MTBE Usage and Occurrence in Groundwater in England and Wales. R&D
Project Report No. 97
For
insp
ectio
n pur
pose
s only
.
Conse
nt of
copy
right
owne
r req
uired
for a
ny ot
her u
se.
EPA Export 29-05-2016:01:10:08

Pfizer Ireland Pharmaceuticals - Pfizer Little Island IEL Groundwater Monitoring April 2015
47092917/CKRP0001/ISSUE NO. 2/FINAL
28 April 2015 Page 13
Seepages of MTBE-impacted groundwater to the Bury’s Bridge Basin have been historically identified (i.e. AECOM, 2001 - Quantitative Risk Assessment). However, due to its low aquatic toxicity and high volatility, MTBE is not considered to pose a significant threat to the aquatic ecosystem in Bury’s Bridge Basin, even at concentrations significantly higher than those detected in groundwater from the Little Island site in recent years.
The ongoing detections of MTBE at well 604 since it was drilled and installed in November 2013, indicates that MTBE is continuing to be flushed through the sand and gravel aquifer beneath the site north-westward towards the basin. MTBE in groundwater entering Bury’s Bridge Basin is greatly diluted by tidal flushing and is expected to be transported throughout the basin and into Cork Harbour/Lough Mahon by tidal mixing. MTBE is not considered to be coming from Bury’s Bridge Basin back into the adjacent sand and gravel aquifer.
Detected concentrations of some major ions (potassium, sodium, magnesium, sulphate and chloride) are considered to be related to the site’s location adjacent to the tidal Bury’s Bridge Basin. The mixing of groundwater and more saline surface water results in higher concentrations of these major ions in certain wells (Production Well and well 207).
2.3.1 Potential Pollutant Linkages
A summary of potential Source-Pathway-Receptor (SPR) linkages is outlined in the table below.
POTENTIAL SPR LINKAGES
Sources Pathways Receptor
S1 MTBE and other VOCs in soil and groundwater related to historical leaks from underground pipelines
Human Health
P1 Ingestion of soil/dust, groundwater or surface water
P2 Dermal contact with soil, dust, and groundwater
P3 Inhalation of indoor and outdoor contaminant vapours which can arise directly from residual contaminants in the unsaturated overburden itself and indirectly via the dissolved phase in groundwater
Human Health
R1 On-site workers
R2 Off-site workers
R3 Workers on-site undertaking subsurface works
Controlled Waters
P4 Lateral migration of contaminants through the gravel aquifer
Water Supply Well
There are no known potable water supplies within 300 m of site
On-site production well – used for cooling purposes not potable supply
Controlled Waters
R4 Bury’s Bridge Basin
R5 Cork Harbour SPA (No. 004030)
R6 Dunkettle Shore (pNHA)
In 2001, AECOM estimated that worst-case MTBE concentrations of up to 10 mg/L in Bury’s Bridge Basin would not cause significant harm to the aquatic ecosystem
1.
Given that MTBE concentrations in the sand and gravel unit across the site in April 2015 are up to three orders of magnitude lower than 10 mg/L (0.001 mg/L in well 302 and 0.064 mg/L in well 604) and the potential for dilution in the basin is great, the potential environmental impact of MTBE in groundwater discharging to the basin under April 2015 conditions is considered to be negligible.
For
insp
ectio
n pur
pose
s only
.
Conse
nt of
copy
right
owne
r req
uired
for a
ny ot
her u
se.
EPA Export 29-05-2016:01:10:08

Pfizer Ireland Pharmaceuticals - Pfizer Little Island IEL Groundwater Monitoring April 2015
47092917/CKRP0001/ISSUE NO. 2/FINAL
28 April 2015 Page 14
3. SUMMARY, CONCLUSIONS AND RECOMMENDATIONS
3.1 Summary and Conclusion
The general groundwater flow direction in April 2015 was to the north and north-west (toward Bury’s Bridge Basin) and is consistent with previous monitoring rounds.
Groundwater analytical results for MTBE in April 2015 are amongst the lowest recorded in recent years, with MTBE concentrations being below the laboratory MDL in groundwater from two of the eight wells monitored.
The IGV for MTBE (0.03 mg/L) was exceeded at three of the wells sampled, well 203 (0.047 mg/L), well 404 (0.164 mg/L) and well 604 (0.064 mg/L). The MTBE concentrations recorded in groundwater from wells 203 and 404 in April 2015 represented minor increases compared to concentrations in October 2014; they are however considerably (i.e. several orders of magnitude) lower than concentrations previously recorded. The concentration of MTBE in groundwater from well 604 on the BP was similar to that recorded in October 2014, which is the lowest of the four sampling results to date.
The April 2015 analytical results continue to demonstrate the long-term declining trend in MTBE concentrations observed since significant upgrades to the site effluent drainage system between 2006 and 2008.
Toluene was not detected above the MDL in groundwater from any well sampled in Round 1 April 2015.
In April 2015, chloroform was detected in groundwater from well 404 at a concentration of 0.024 mg/L, a decrease from 0.271 mg/L in October 2014. Between September 2009 and May 2012, chloroform was detected in groundwater from well 404 at concentrations of up to 0.414 mg/L, having been only intermittently detected prior to that.
3.2 Recommended Way Forward
Attempted well rehabilitation of wells 202 and 207 in 2012 was unsuccessful. Despite the degree of siltation in the base of well 207, it remains a functioning monitoring well and the rate of recharge to the well during purging does not appear to have decreased. Therefore, it is not recommended that more aggressive rehabilitation methods be undertaken at this stage.
Based on the first round of 2015 biannual groundwater monitoring, conducted in April 2015, AECOM continue to recommend that the groundwater monitoring frequency be reduced from biannually to annually.
For
insp
ectio
n pur
pose
s only
.
Conse
nt of
copy
right
owne
r req
uired
for a
ny ot
her u
se.
EPA Export 29-05-2016:01:10:08

Pfizer Ireland Pharmaceuticals - Pfizer Little Island IEL Groundwater Monitoring April 2015
47092917/CKRP0001/ISSUE NO. 2/FINAL
28 April 2015
FIGURES
For
insp
ectio
n pur
pose
s only
.
Conse
nt of
copy
right
owne
r req
uired
for a
ny ot
her u
se.
EPA Export 29-05-2016:01:10:08

N.T.SJob No.SCALE
AO
CLIENT
PROJECT LOCATION
DRAWING TITLEAPR 2015
A
PFIZER IRELAND PHARMACEUTICALS
FO’R KF
47092917FIGURE 1 - SITE LOCATION PLAN
CORK
LITTLE ISLAND CO. CORK
SITELOCATION
Contains Ordnance Survey Data Crown Copyright and database right 2015. Reproduced from Ordnance Survey digital map data. Crown copyright 2015. All rights reserved.
2015. Material is reproduced with the permission of Natural England 2015. Copyright English Heritage 2015. Reproduced under the terms of the Click-Use Licence.(C) AECOM 2015.
Licence number 0100031673. Copyright Natural England
DOUGLAS BUSINESS CENTRE, CARRIGALINE ROAD,DOUGLAS, CORK
TEL: +353 (0)21 436 5006 WWW.AECOM.COM
North
For
insp
ectio
n pur
pose
s only
.
Conse
nt of
copy
right
owne
r req
uired
for a
ny ot
her u
se.
EPA Export 29-05-2016:01:10:08

Job No.SCALE
TRACED CHECKED
REV.
DRAWN APPROVED
AODATE
A
APR 2015
Key
LITTLE ISLAND, CO. CORK
CLIENT
PROJECT LOCATION
FOR KF
As Shown 47092917
API SITE
BUFFER PROPERTY
207207
PFIZER IRELAND PHARMACEUTICALS
201
302
301 206
201
302
301 206
201
302
301 206
DOUGLAS BUSINESS CENTRE, CARRIGALINE ROAD,DOUGLAS, CORK
TEL: +353 (0)21 436 5006 WWW.AECOM.COM
304 304
DRAWING TITLE FIGURE 2SITE LAYOUT PLAN SHOWING BOREHOLE LOCATIONS
PRODUCTION WELL
GROUNDWATER MONITORING WELL
BOUNDARY OF UNDEVELOPED SITE (BP)
0.80 m AOD
0.85 m AOD
0.75 m AOD
0.70 m AOD
0.65 m AOD
0.76
0.790.71
0.73
0.870.81
0.65
0.63
0.61
0.65
0.67
0.62
0.63
0.68
0.71
0.65
0.73
0.62
0.76
0.790.71
0.73
0.870.81
0.65
0.63
0.61
0.65
0.67
0.62
0.63
0.68
0.71
0.65
0.73
0.62
For
insp
ectio
n pur
pose
s only
.
Conse
nt of
copy
right
owne
r req
uired
for a
ny ot
her u
se.
EPA Export 29-05-2016:01:10:08

Job No.SCALE
TRACED CHECKED
REV.
DRAWN APPROVED
AODATE
A
APR 2015
Key
LITTLE ISLAND, CO. CORK
CLIENT
PROJECT LOCATION
FIGURE 3GROUNDWATER CONTOUR MAP - GRAVEL AQUIFER - 08 April 2015
FOR KF
47092917 RELATIVE WATER LEVEL (m AOD)
INFERRED GROUNDWATER FLOW
GROUNDWATER CONTOUR
GROUNDWATER MONITORING WELL
BOUNDARY OF UNDEVELOPED SITE (BP)
API SITE
BUFFER PROPERTY
207207
PFIZER IRELAND PHARMACEUTICALS
DRAWING TITLE
302
301 206
201
302
301 206
201
302
301 206
DOUGLAS BUSINESS CENTRE, CARRIGALINE ROAD,DOUGLAS, CORK
TEL: +353 (0)21 436 5006 WWW.AECOM.COM
304304
As Shown
0.80 m AOD
0.85 m AOD
0.75 m AOD
0.70 m AOD
0.65 m AOD
0.76
0.790.71
0.73
0.870.81
0.65
0.63
0.61
0.65
0.67
0.62
0.63
0.68
0.71
0.65
0.73
0.62
0.76
0.790.71
0.73
0.870.81
0.65
0.63
0.61
0.65
0.67
0.62
0.63
0.68
0.71
0.65
0.73
0.62
202402
202402
For
insp
ectio
n pur
pose
s only
.
Conse
nt of
copy
right
owne
r req
uired
for a
ny ot
her u
se.
EPA Export 29-05-2016:01:10:08

30m
40m
50m
60m
12
3
A
B
4
D
3
A
31
2
?
?
?
YR
AD
NU
OB
FO’R 09/04/2015
OTHER ITEMS
Job No: REVAN.T.S
KF
SILT/CLAY SUBSOILSAND/GRAVEL SUBSOIL
PIEZOMETRIC SURFACE
PFIZER IRELAND PHARMACEUTICALS 47092917
VOCS IN SOIL VOCS IN GROUNDWATER IN BEDROCK AQUIFER
INGESTION OF SOIL AND DUST
DERMAL CONTACT WITH SOIL AND DUST INHALATION OF VAPOURS INDOORS AND OUTDOORSLATERIAL MIGRATION THROUGH SAND AND GRAVEL AQUIFER TO BURYS BRIDGE BASIN
ON-SITE WORKERS BURYS BRIDGE BASIN
11
1
2
3
AB
HISTORIC SOURCES
2
4
POTENTIAL RECEPTORS
POTENTIAL PATHWAYS
SML
LIMESTONE BEDROCK
10 m
5m
IEL GROUNDWATER MONITORING ROUND 1 (APRIL) 2015
47092917/FIGURE 4DOUGLAS BUSINESS CENTRE, CARRIGALINE ROAD,
DOUGLAS, CORKTEL: +353 (0)21 436 5006 WWW.AECOM.COM
A
BURYS BRIDGE BASIN
Fill Material
PRODUCTIONTANK FARM AREA
CONTRACTORS COMPOUND
FORMER WWTP AREA
Fill Material
SILT/CLAY
SAND/GRAVEL AQUIFER
NORTH WESTSOUTH EAST
LIMESTONE BEDROCK (UNPROVEN)
? ????
B
1
2
31 2
4
A A
For
insp
ectio
n pur
pose
s only
.
Conse
nt of
copy
right
owne
r req
uired
for a
ny ot
her u
se.
EPA Export 29-05-2016:01:10:08

Figure 5: Historical Toluene and MTBE Concentration Trend Data for Well 203
AECOM Pfizer Little Island Round 1 (April) 2015 Tables Final.xls
0
20
40
60
80
100
120
140
160
180
200S
ep-9
7
Jun-9
8
Feb
-99
Oct-
99
Jun-0
0
Feb
-01
No
v-0
1
Jul-0
2
Ma
r-0
3
No
v-0
3
Aug-0
4
Apr-
05
De
c-0
5
Aug-0
6
Apr-
07
Jan-0
8
Sep-0
8
Ma
y-0
9
Jan-1
0
Sep-1
0
Jun-1
1
Feb
-12
Oct-
12
Jun-1
3
Ma
r-1
4
No
v-1
4
Jul-1
5
Co
ncen
trati
on
(m
g/L
)
Toluene
MTBE
For
insp
ectio
n pur
pose
s only
.
Conse
nt of
copy
right
owne
r req
uired
for a
ny ot
her u
se.
EPA Export 29-05-2016:01:10:08
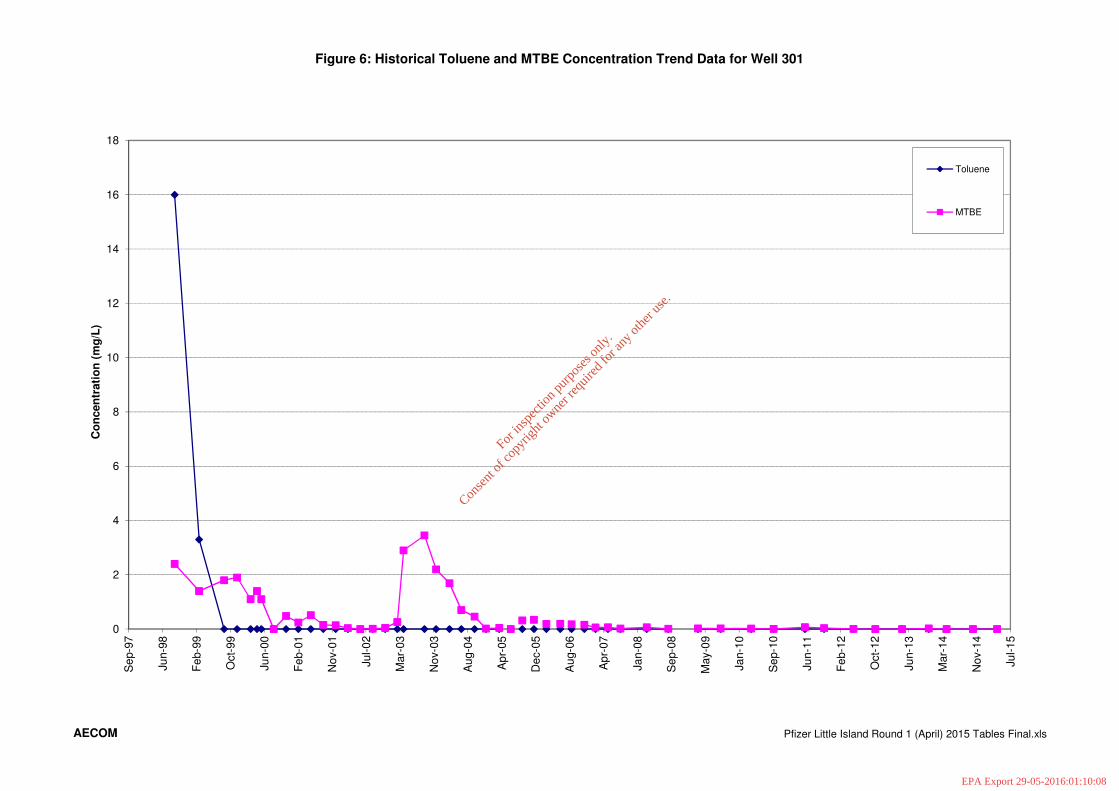
Figure 6: Historical Toluene and MTBE Concentration Trend Data for Well 301
AECOM Pfizer Little Island Round 1 (April) 2015 Tables Final.xls
0
2
4
6
8
10
12
14
16
18S
ep-9
7
Ju
n-9
8
Fe
b-9
9
Oct-
99
Ju
n-0
0
Fe
b-0
1
No
v-0
1
Ju
l-0
2
Mar-
03
No
v-0
3
Au
g-0
4
Ap
r-05
De
c-0
5
Au
g-0
6
Ap
r-07
Ja
n-0
8
Se
p-0
8
May-0
9
Ja
n-1
0
Se
p-1
0
Ju
n-1
1
Fe
b-1
2
Oct-
12
Ju
n-1
3
Mar-
14
No
v-1
4
Ju
l-1
5
Co
ncen
trati
on
(m
g/L
)
Toluene
MTBE
For
insp
ectio
n pur
pose
s only
.
Conse
nt of
copy
right
owne
r req
uired
for a
ny ot
her u
se.
EPA Export 29-05-2016:01:10:08
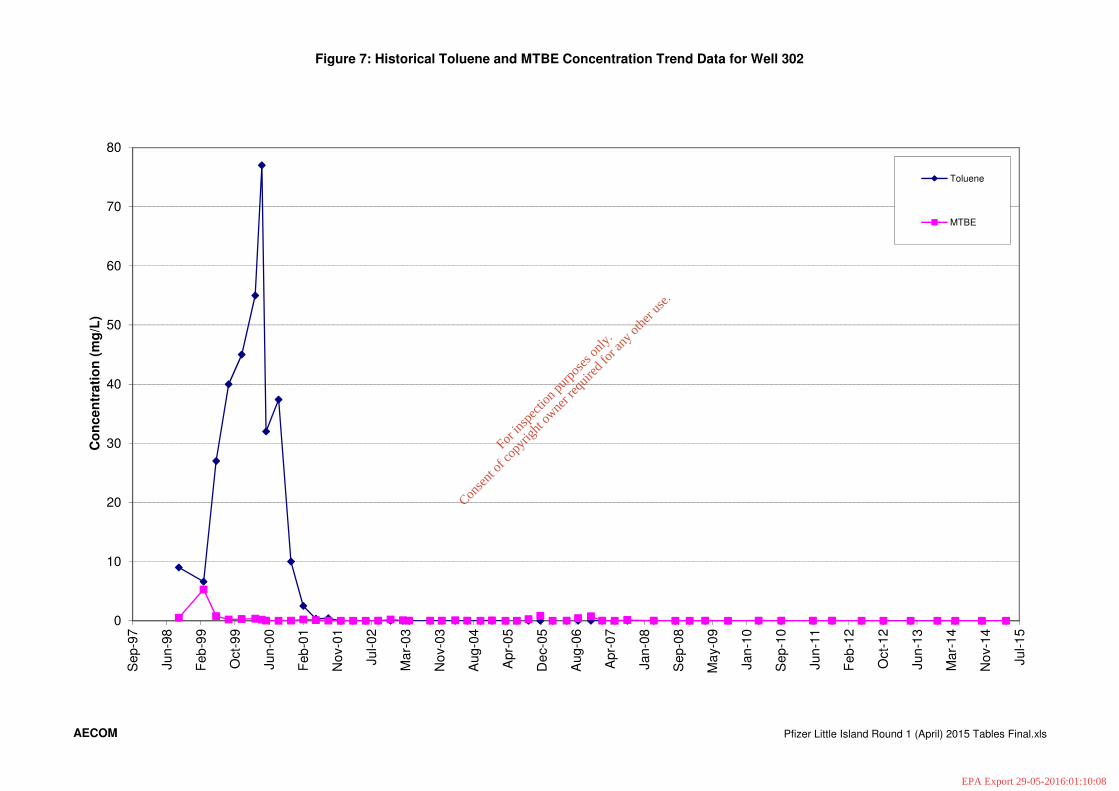
Figure 7: Historical Toluene and MTBE Concentration Trend Data for Well 302
AECOM Pfizer Little Island Round 1 (April) 2015 Tables Final.xls
0
10
20
30
40
50
60
70
80S
ep-9
7
Jun-9
8
Feb
-99
Oct-
99
Jun-0
0
Feb
-01
No
v-0
1
Jul-0
2
Ma
r-0
3
No
v-0
3
Aug-0
4
Apr-
05
De
c-0
5
Aug-0
6
Apr-
07
Jan-0
8
Sep-0
8
Ma
y-0
9
Jan-1
0
Sep-1
0
Jun-1
1
Feb
-12
Oct-
12
Jun-1
3
Ma
r-1
4
No
v-1
4
Jul-1
5
Co
ncen
trati
on
(m
g/L
)
Toluene
MTBE
For
insp
ectio
n pur
pose
s only
.
Conse
nt of
copy
right
owne
r req
uired
for a
ny ot
her u
se.
EPA Export 29-05-2016:01:10:08

Figure 8: Historical Toluene and MTBE Concentration Trend Data for Well 304
AECOM Pfizer Little Island Round 1 (April) 2015 Tables Final.xls
0
20
40
60
80
100
120
140
Sep-9
7
Jun-9
8
Feb
-99
Oct-
99
Jun-0
0
Feb
-01
No
v-0
1
Jul-0
2
Ma
r-0
3
No
v-0
3
Aug-0
4
Apr-
05
De
c-0
5
Aug-0
6
Apr-
07
Jan-0
8
Sep-0
8
Ma
y-0
9
Jan-1
0
Sep-1
0
Jun-1
1
Feb
-12
Oct-
12
Jun-1
3
Ma
r-1
4
No
v-1
4
Jul-1
5
Co
ncen
trati
on
(m
g/L
)
Toluene
MTBE
For
insp
ectio
n pur
pose
s only
.
Conse
nt of
copy
right
owne
r req
uired
for a
ny ot
her u
se.
EPA Export 29-05-2016:01:10:08

Figure 9: Historical Toluene and MTBE Concentration Trend Data for Well 404
AECOM Pfizer Little Island Round 1 (April) 2015 Tables Final.xls
0
200
400
600
800
1000
1200M
ar-
03
No
v-0
3
Aug-0
4
Apr-
05
De
c-0
5
Aug-0
6
Apr-
07
Jan-0
8
Sep-0
8
Ma
y-0
9
Jan-1
0
Sep-1
0
Jun-1
1
Feb
-12
Oct-
12
Jun-1
3
Ma
r-1
4
No
v-1
4
Jul-1
5
Co
ncen
trati
on
(m
g/L
)
Toluene
MTBE
For
insp
ectio
n pur
pose
s only
.
Conse
nt of
copy
right
owne
r req
uired
for a
ny ot
her u
se.
EPA Export 29-05-2016:01:10:08

Pfizer Ireland Pharmaceuticals - Pfizer Little Island IEL Groundwater Monitoring April 2015
47092917/CKRP0001/ISSUE NO. 2/FINAL
28 April 2015
TABLES
For
insp
ectio
n pur
pose
s only
.
Conse
nt of
copy
right
owne
r req
uired
for a
ny ot
her u
se.
EPA Export 29-05-2016:01:10:08

Compiled by: AO
Checked by: FO'RTable 1 - Sample Inventory, Pfizer Little Island - April 2015
VOCs SVOCs Major Ions
203 (plus duplicate
Dup 01)X X X X
207 X X X X
301 X X X X
302 X X X X
304 X X X X
305 X X X X
404 X X NA X
201+ NA NA NA NA
202+ NA NA NA NA
205A+ NA NA NA NA
206* NA NA NA NA
303* NA NA NA NA
402 NA NA NA NA
403^ NA NA NA NA
405+ NA NA NA NA
501^ NA NA NA NA
502 NA NA NA NA
503 NA NA NA NA
503 NA NA NA NA
Production Well NA NA NA NA
601~ NA NA NA NA
602~ NA NA NA NA
603~ NA NA NA NA
604~ X X X X
Notes:
VOCs : Volatile Organic Compounds
SVOCs: Semi Volatile Organic Compounds
Major Ions: Calcium, magnesium, potassium, sodium, sulphate, chloride, nitrate and total alkalinity
Field Parameters: Dissolved oxygen, oxidation-reduction potential, pH, electrical conductivity and temperature
NA: Analysis not required
^ As agreed with the EPA (May 2010), wells 403 and 501 were removed from monitoring schedule+ As agreed with the EPA (August 2012), wells 201, 202, 205A and 405 were removed from monitoring schedule
* As agreed with the EPA (May 2010), wells 206 and 303 are monitored biennially, next
~600 Series wells drilled in the Overflow Car Park and Buffer Property in November 2013.
Well 604 is now included in the biannual monitoring schedule
Additional monitoring wells onsite - not included in IEL monitoring.
Monitoring
Well
IEL C.6 Monitoring Requirements
Laboratory ParametersField
Parameters
AECOM Pfizer Little Island Round 1 (April) 2015 Tables.xls
For
insp
ectio
n pur
pose
s only
.
Conse
nt of
copy
right
owne
r req
uired
for a
ny ot
her u
se.
EPA Export 29-05-2016:01:10:08

Compiled by: AO
Checked by: FO'RTable 2 - Volatile Organic Compound Results (mg/L), Pfizer Little Island - April 2015
203 Dup 01 207 301 302 304 305 404 604
8-Apr-15 8-Apr-15 8-Apr-15 8-Apr-15 8-Apr-15 8-Apr-15 8-Apr-15 8-Apr-15 8-Apr-15
---- ---- ---- <0.002 <0.002 <0.002 <0.002 <0.002 <0.002 <0.002 <0.002 <0.002---- ---- ---- <0.003 <0.003 <0.003 <0.003 <0.003 <0.003 <0.003 <0.003 <0.003---- ---- ---- <0.003 <0.003 <0.003 <0.003 <0.003 <0.003 <0.003 <0.003 <0.003---- ---- ---- <0.001 <0.001 <0.001 <0.001 <0.001 <0.001 <0.001 <0.001 <0.001---- ---- ---- <0.003 <0.003 <0.003 <0.003 <0.003 <0.003 <0.003 <0.003 <0.003
0.030 1 0.010 ---- <0.003 <0.003 <0.003 <0.003 <0.003 <0.003 <0.003 <0.003 <0.003
0.010 1 ---- <0.003 <0.003 <0.003 <0.003 <0.003 <0.003 <0.003 <0.003 <0.003---- 0.9 ---- <0.003 <0.003 <0.003 <0.003 <0.003 <0.003 <0.003 <0.003 <0.003
0.030 1 0.020* ---- <0.003 <0.003 <0.003 <0.003 <0.003 <0.003 <0.003 <0.003 <0.003
---- 0.080** ---- <0.001 <0.001 <0.001 <0.001 <0.001 <0.001 <0.001 <0.001 <0.001
0.012 0.400 0.075 B <0.002 <0.002 <0.002 <0.002 <0.002 <0.002 <0.002 0.024 <0.002
---- ---- ---- <0.002 <0.002 <0.002 <0.002 <0.002 <0.002 <0.002 <0.002 <0.002
0.500 0.300 ---- <0.002 <0.002 <0.002 <0.002 <0.002 <0.002 <0.002 <0.002 <0.002
---- ---- ---- <0.003 <0.003 <0.003 <0.003 <0.003 <0.003 <0.003 <0.003 <0.003
0.003 0.400 0.00225 <0.002 <0.002 <0.002 <0.002 <0.002 <0.002 <0.002 <0.002 <0.002
0.001 0.030 0.00075 <0.0005 <0.0005 <0.0005 <0.0005 <0.0005 <0.0005 <0.0005 <0.0005 <0.0005
---- 0.080** ---- <0.002 <0.002 <0.002 <0.002 <0.002 <0.002 <0.002 <0.002 <0.002
0.070, 0.010 4 0.500 0.0075
A <0.003 <0.003 <0.003 <0.003 <0.003 <0.003 <0.003 <0.003 <0.003
---- ---- 0.075 B <0.002 <0.002 <0.002 <0.002 <0.002 <0.002 <0.002 <0.002 <0.002
---- ---- ---- <0.003 <0.003 <0.003 <0.003 <0.003 <0.003 <0.003 <0.003 <0.003
---- ---- ---- <0.002 <0.002 <0.002 <0.002 <0.002 <0.002 <0.002 <0.002 <0.002
0.010 1 ---- <0.0005 <0.0005 <0.0005 <0.0005 <0.0005 <0.0005 <0.0005 <0.0005 <0.0005
---- ---- ---- <0.002 <0.002 <0.002 <0.002 <0.002 <0.002 <0.002 <0.002 <0.002
---- 0.130 ---- <0.002 <0.002 <0.002 <0.002 <0.002 <0.002 <0.002 <0.002 <0.002
0.020 0.01 ---- <0.002 <0.002 <0.002 <0.002 <0.002 <0.002 <0.002 <0.002 <0.002
---- 0.005 0.000375 <0.0001 <0.0001 <0.0001 <0.0001 <0.0001 <0.0001 <0.0001 <0.0001 <0.0001
---- 0.080** ---- <0.002 <0.002 <0.002 <0.002 <0.002 <0.002 <0.002 <0.002 <0.002
0.010, 0.040 2 0.04 0.0075
A <0.003 <0.003 <0.003 <0.003 <0.003 <0.003 <0.003 <0.003 <0.003
---- ---- 0.075 B <0.002 <0.002 <0.002 <0.002 <0.002 <0.002 <0.002 <0.002 <0.002
---- ---- ---- <0.002 <0.002 <0.002 <0.002 <0.002 <0.002 <0.002 <0.002 <0.002
0.001 0.18 ---- <0.002 <0.002 <0.002 <0.002 <0.002 <0.002 <0.002 <0.002 <0.002
---- ---- ---- <0.002 <0.002 <0.002 <0.002 <0.002 <0.002 <0.002 <0.002 <0.002
0.010 0.15 ---- <0.0005 <0.0005 <0.0005 <0.0005 <0.0005 <0.0005 <0.0005 <0.0005 <0.0005
0.010 5 0.070***** ---- <0.001 <0.001 <0.001 <0.001 <0.001 <0.001 <0.001 <0.001 <0.001
0.010 5 0.070***** ---- <0.0005 <0.0005 <0.0005 <0.0005 <0.0005 <0.0005 <0.0005 <0.0005 <0.0005
---- 0.300 ---- <0.002 <0.002 <0.002 <0.002 <0.002 <0.002 <0.002 <0.002 <0.002
---- 0.630 0.075 B <0.002 <0.002 <0.002 <0.002 <0.002 <0.002 <0.002 <0.002 <0.002
0.030 1 0.020* ---- <0.003 <0.003 <0.003 <0.003 <0.003 <0.003 <0.003 <0.003 <0.003
---- ---- ---- <0.003 <0.003 <0.003 <0.003 <0.003 <0.003 <0.003 <0.003 <0.003
---- ---- ---- <0.004 <0.004 <0.004 <0.004 <0.004 <0.004 <0.004 <0.004 <0.004
---- ---- ---- <0.003 <0.003 <0.003 <0.003 <0.003 <0.003 <0.003 <0.003 <0.003
---- ---- ---- <0.003 <0.003 <0.003 <0.003 <0.003 <0.003 <0.003 <0.003 <0.003
---- ---- ---- <0.002 <0.002 <0.002 <0.002 <0.002 <0.002 <0.002 <0.002 <0.002
---- ---- ---- <0.003 <0.003 <0.003 <0.003 <0.003 <0.003 <0.003 <0.003 <0.003
---- ---- ---- <0.003 <0.003 <0.003 <0.003 <0.003 <0.003 <0.003 <0.003 <0.003
---- ---- ---- <0.003 <0.003 <0.003 <0.003 <0.003 <0.003 <0.003 <0.003 <0.003
---- ---- ---- <0.003 <0.003 <0.003 <0.003 <0.003 <0.003 <0.003 <0.003 <0.003
---- ---- ---- <0.003 <0.003 <0.003 <0.003 <0.003 <0.003 <0.003 <0.003 <0.003
---- ---- ---- <0.003 <0.003 <0.003 <0.003 <0.003 <0.003 <0.003 <0.003 <0.003
---- ---- ---- <0.003 <0.003 <0.003 <0.003 <0.003 <0.003 <0.003 <0.003 <0.003
---- 0.050*** ---- <0.003 <0.003 <0.003 <0.003 <0.003 <0.003 <0.003 <0.003 <0.003
---- 0.050*** ---- <0.003 <0.003 <0.003 <0.003 <0.003 <0.003 <0.003 <0.003 <0.003
---- ---- ---- <0.003 <0.003 <0.003 <0.003 <0.003 <0.003 <0.003 <0.003 <0.003
0.01 0.050*** ---- <0.003 <0.003 <0.003 <0.003 <0.003 <0.003 <0.003 <0.003 <0.003
---- ---- ---- <0.002 <0.002 <0.002 <0.002 <0.002 <0.002 <0.002 <0.002 <0.002
0.0004 3 0.010*** ---- <0.003 <0.003 <0.003 <0.003 <0.003 <0.003 <0.003 <0.003 <0.003
0.0001 ---- ---- <0.003 <0.003 <0.003 <0.003 <0.003 <0.003 <0.003 <0.003 <0.003
0.001 0.070 ---- <0.002 <0.002 <0.002 <0.002 <0.002 <0.002 <0.002 <0.002 <0.002
0.0004 3 0.010*** ---- <0.003 <0.003 <0.003 <0.003 <0.003 <0.003 <0.003 <0.003 <0.003
0.030 9.20 ---- 0.0467 0.0479 <0.0001 0.0023 0.0014 0.0016 <0.0001 0.1643 0.0643
Shaded Indicates Result is above Dutch Intervention Value (DIV) A: Guideline Threshold Value is for the sum of tetrachloroethene and trichloroethene.
BOLD Indicates Result is above draft Interim Guideline value (IGV) B: Guideline Threshold Value is for the sum of trihalomethanes.
Italics Indicates Result is above Guideline Threshold Value (GTV)
`
Monitoring Well ID
1,1-DichloroetheneDichloromethane
VOCDutch Intervention
Value
EPA Draft Interim
Guideline Values
Guideline
Threshold Value
DichlorodifluoromethaneChloromethaneChloroethaneBromomethane
MTBE
1,2,3-Trichlorobenzene
Trichlorofluoromethane
Vinyl Chloride
1,1-Dichloroethane
1,1-Dichloropropene
cis-1,2-Dichloroethene
2,2-Dichloropropane
Chloroform
Bromochloromethane
1,1,1-Trichloroethane
Notes:
1,2-Dichloropropane
Trichloroethene
Bromodichloromethane
Dibromomethane
1,2-Dichloroethane
Benzene
cis-1,3-Dichloropropene
Toluene
1,1,2-Trichloroethane
Carbon tetrachloride
1,3-Dichloropropane
trans-1,3-Dichloropropene
1,2,3-Trichloropropane
Tetrachloroethene
Dibromochloromethane
1,2-Dibromoethane
Chlorobenzene
Propylbenzene
Bromobenzene
2-Chlorotoluene
p/m-Xylene
o-Xylene
Styrene
1,1,2,2-Tetrachloroethane
1,1,1,2-Tetrachloroethane
Bromoform
trans-1,2-Dichloroethene
Isopropylbenzene
Ethylbenzene
Naphthalene
1,3,5-Trimethylbenzene
4-Chlorotoluene
1,3-Dichlorobenzene
1,4-Dichlorobenzene
1,2-Dibromo-3-chloropropane
1,2,4-Trichlorobenzene
Hexachlorobutadiene
tert-Butylbenzene
n-Butylbenzene
1,2-Dichlorobenzene
sec-Butylbenzene
4-Isopropyltoluene
1,2,4-Trimethylbenzene
5: IGV is for the sum of xylenes.
**** DIV is for the sum of all trichlorobenezenes.
***** DIV is for the sum of all xylenes.
* DIV is for both cis and trans 1,2-dichloroethene.
*** DIV is for the sum of all dichlorobenzenes.
2: Two IGVs are given for tetrachloroethene.
3: IGV is for the sum of trichlorobenzenes.
4: Two IGVs are given for trichloroethene.
1: The IGV is given for dichloroethene, it is assumed that this applies to the sum of all dichlororethenes.
** DIV is for the sum of dichloropropanes.
AECOM Pfizer Little Island Round 1 (April) 2015 Tables.xls
For
insp
ectio
n pur
pose
s only
.
Conse
nt of
copy
right
owne
r req
uired
for a
ny ot
her u
se.
EPA Export 29-05-2016:01:10:08

Compiled by: AO
Checked by: FO'RTable 3 - Semi Volatile Organic Compound Results (mg/L), Pfizer Little Island - April 2015
203 Dup 01 207 301 302 304 305 404 604
8-Apr-15 8-Apr-15 8-Apr-15 8-Apr-15 8-Apr-15 8-Apr-15 8-Apr-15 8-Apr-15 8-Apr-15
Phenols
2-Chlorophenol 0.2 0.1 ---- <0.001 <0.001 <0.001 <0.001 <0.001 <0.001 <0.001 <0.001 <0.001
2-Methylphenol 0.0005 1 ---- ---- <0.0005 <0.0005 <0.0005 <0.0005 <0.0005 <0.0005 <0.0005 <0.0005 <0.0005
2-Nitrophenol 0.0005 1 ---- ---- <0.0005 <0.0005 <0.0005 <0.0005 <0.0005 <0.0005 <0.0005 <0.0005 <0.0005
2,4-Dichlorophenol 0.0005 1 0.03 ---- <0.0005 <0.0005 <0.0005 <0.0005 <0.0005 <0.0005 <0.0005 <0.0005 <0.0005
2,4-Dimethylphenol 0.0005 1 ---- ---- <0.001 <0.001 <0.001 <0.001 <0.001 <0.001 <0.001 <0.001 <0.001
2,4,6-Trichlorophenol 0.2 ---- <0.001 <0.001 <0.001 <0.001 <0.001 <0.001 <0.001 <0.001 <0.001
2,4,5-Trichlorophenol 0.0005 1 ---- <0.0005 <0.0005 <0.0005 <0.0005 <0.0005 <0.0005 <0.0005 <0.0005 <0.0005
4-Chloro-3-MethylPhenol 0.0005 1 ---- ---- <0.0005 <0.0005 <0.0005 <0.0005 <0.0005 <0.0005 <0.0005 <0.0005 <0.0005
4-Methylphenol 0.0005 1 ---- ---- <0.001 <0.001 <0.001 <0.001 <0.001 <0.001 <0.001 <0.001 <0.001
4-Nitrophenol 0.0005 1 ---- ---- <0.01 <0.01 <0.01 <0.01 <0.01 <0.01 <0.01 <0.01 <0.01
Pentachlorophenol 0.002 0.003 ---- <0.001 <0.001 <0.001 <0.001 <0.001 <0.001 <0.001 <0.001 <0.001
Phenol 0.0005 1 0.2 ---- <0.001 <0.001 <0.001 <0.001 <0.001 <0.001 <0.001 <0.001 <0.001
PAHs
2-Chloronaphthalene ---- 0.006 ---- <0.001 <0.001 <0.001 <0.001 <0.001 <0.001 <0.001 <0.001 <0.001
2-Methylnaphthalene ---- ---- ---- <0.001 <0.001 <0.001 <0.001 <0.001 <0.001 <0.001 <0.001 <0.001
Naphthalene 0.001 0.07 ---- <0.001 <0.001 <0.001 <0.001 <0.001 <0.001 <0.001 <0.001 <0.001
Acenaphthylene ---- ---- ---- <0.0005 <0.0005 <0.0005 <0.0005 <0.0005 <0.0005 <0.0005 <0.0005 <0.0005
Acenaphthene ---- ---- ---- <0.001 <0.001 <0.001 <0.001 <0.001 <0.001 <0.001 <0.001 <0.001
Fluorene ---- ---- ---- <0.0005 <0.0005 <0.0005 <0.0005 <0.0005 <0.0005 <0.0005 <0.0005 <0.0005
Phenanthrene ---- 0.005 ---- <0.0005 <0.0005 <0.0005 <0.0005 <0.0005 <0.0005 <0.0005 <0.0005 <0.0005
Anthracene 10 0.005 ---- <0.0005 <0.0005 <0.0005 <0.0005 <0.0005 <0.0005 <0.0005 <0.0005 <0.0005
Fluoranthene 0.001 0.001 ---- <0.0005 <0.0005 <0.0005 <0.0005 <0.0005 <0.0005 <0.0005 <0.0005 <0.0005
Pyrene ---- ---- ---- <0.0005 <0.0005 <0.0005 <0.0005 <0.0005 <0.0005 <0.0005 <0.0005 <0.0005
Benzo(a)anthracene ---- 0.0005 ---- <0.0005 <0.0005 <0.0005 <0.0005 <0.0005 <0.0005 <0.0005 <0.0005 <0.0005
Chrysene ---- 0.0002 ---- <0.0005 <0.0005 <0.0005 <0.0005 <0.0005 <0.0005 <0.0005 <0.0005 <0.0005
Benzo(bk)fluoranthene 0.00005 0.00005 0.000075 A <0.001 <0.001 <0.001 <0.001 <0.001 <0.001 <0.001 <0.001 <0.001
Benzo(a)pyrene 0.00001 0.00005 0.0000075 <0.001 <0.001 <0.001 <0.001 <0.001 <0.001 <0.001 <0.001 <0.001
Indeno(1,2,3-cd)pyrene 0.00005 0.00005 0.000075 A <0.001 <0.001 <0.001 <0.001 <0.001 <0.001 <0.001 <0.001 <0.001
Dibenz(a,h)anthracene ---- ---- ---- <0.0005 <0.0005 <0.0005 <0.0005 <0.0005 <0.0005 <0.0005 <0.0005 <0.0005
Benzo(ghi)perylene 0.00005 0.00005 0.000075 A <0.0005 <0.0005 <0.0005 <0.0005 <0.0005 <0.0005 <0.0005 <0.0005 <0.0005
Phthalates
bis(2-ethylhexyl)phthalate 0.008 0.005 *** ---- <0.005 <0.005 <0.005 <0.005 <0.005 <0.005 <0.005 <0.005 <0.005
Butyl benzyl phthalate 0.005 2 0.005 *** ---- <0.001 <0.001 <0.001 <0.001 <0.001 <0.001 <0.001 <0.001 <0.001
di-n-Butyl phthalate 0.002 0.005 *** ---- <0.0015 <0.0015 <0.0015 <0.0015 <0.0015 <0.0015 <0.0015 <0.0015 <0.0015
di-n-octyl phthalate 0.005 2 0.005 *** ---- <0.001 <0.001 <0.001 <0.001 <0.001 <0.001 <0.001 <0.001 <0.001
Diethyl phthalate 0.005 2 0.005 *** ---- <0.001 <0.001 <0.001 <0.001 <0.001 <0.001 <0.001 <0.001 <0.001
Dimethyl phthalate 0.005 2 0.005 *** ---- <0.001 <0.001 <0.001 <0.001 <0.001 <0.001 <0.001 <0.001 <0.001
Other SVOCs
1,2 Dichlorobenzene 0.01 Sum(0.05) * ---- <0.001 <0.001 <0.001 <0.001 <0.001 <0.001 <0.001 <0.001 <0.001
1,2,4-Trichlorobenzene 0.0004 0.01 ---- <0.001 <0.001 <0.001 <0.001 <0.001 <0.001 <0.001 <0.001 <0.001
1,3 Dichlorobenzene ---- ---- <0.001 <0.001 <0.001 <0.001 <0.001 <0.001 <0.001 <0.001 <0.001
1,4 Dichlorobenzene ---- ---- <0.001 <0.001 <0.001 <0.001 <0.001 <0.001 <0.001 <0.001 <0.001
2-Nitroaniline ---- ---- ---- <0.001 <0.001 <0.001 <0.001 <0.001 <0.001 <0.001 <0.001 <0.001
2,4-Dinitrotoluene ---- ---- ---- <0.0005 <0.0005 <0.0005 <0.0005 <0.0005 <0.0005 <0.0005 <0.0005 <0.0005
2,6-Dinitrotoluene ---- ---- ---- <0.001 <0.001 <0.001 <0.001 <0.001 <0.001 <0.001 <0.001 <0.001
3-Nitroaniline ---- ---- ---- <0.001 <0.001 <0.001 <0.001 <0.001 <0.001 <0.001 <0.001 <0.001
4-Bromophenyl phenyl ether ---- ---- ---- <0.001 <0.001 <0.001 <0.001 <0.001 <0.001 <0.001 <0.001 <0.001
4-Chloroaniline ---- ---- ---- <0.001 <0.001 <0.001 <0.001 <0.001 <0.001 <0.001 <0.001 <0.001
4-Chlorophenyl phenylether ---- ---- ---- <0.001 <0.001 <0.001 <0.001 <0.001 <0.001 <0.001 <0.001 <0.001
4-Nitroaniline ---- ---- ---- <0.0005 <0.0005 <0.0005 <0.0005 <0.0005 <0.0005 <0.0005 <0.0005 <0.0005
Azobenzene ---- ---- ---- <0.0005 <0.0005 <0.0005 <0.0005 <0.0005 <0.0005 <0.0005 <0.0005 <0.0005
bis(2-chloroethoxy)methane ---- ---- ---- <0.0005 <0.0005 <0.0005 <0.0005 <0.0005 <0.0005 <0.0005 <0.0005 <0.0005
Bis(2-chloroethyl) ether ---- ---- ---- <0.001 <0.001 <0.001 <0.001 <0.001 <0.001 <0.001 <0.001 <0.001
Carbazole ---- ---- ---- <0.0005 <0.0005 <0.0005 <0.0005 <0.0005 <0.0005 <0.0005 <0.0005 <0.0005
Dibenzofuran ---- ---- ---- <0.0005 <0.0005 <0.0005 <0.0005 <0.0005 <0.0005 <0.0005 <0.0005 <0.0005
Hexachlorobenzene 0.00003 0.0005 ---- <0.001 <0.001 <0.001 <0.001 <0.001 <0.001 <0.001 <0.001 <0.001
Hexachlorobutadiene 0.0001 ---- ---- <0.001 <0.001 <0.001 <0.001 <0.001 <0.001 <0.001 <0.001 <0.001
Hexachlorocyclopentadine 0.0001 ---- ---- <0.001 <0.001 <0.001 <0.001 <0.001 <0.001 <0.001 <0.001 <0.001
Hexachloroethane ---- ---- ---- <0.001 <0.001 <0.001 <0.001 <0.001 <0.001 <0.001 <0.001 <0.001
Isophorone ---- ---- ---- <0.0005 <0.0005 <0.0005 <0.0005 <0.0005 <0.0005 <0.0005 <0.0005 <0.0005
N-nitrosodi-n-propylamine ---- ---- ---- <0.0005 <0.0005 <0.0005 <0.0005 <0.0005 <0.0005 <0.0005 <0.0005 <0.0005
Nitrobenzene 0.01 ---- ---- <0.001 <0.001 <0.001 <0.001 <0.001 <0.001 <0.001 <0.001 <0.001
Notes:
Shaded Indicates Result is above Dutch Intervention Value (DIV)
BOLD Indicates Result is above draft Interim Guideline value (IGV)
Italics Indicates Result is above Guideline Threshold Value (GTV)
1 IGV is for the sum of phenols
2 IGV is for the sum of phthalates
* DIV is for the sum of dichlorobenzenes
** DIV is for the sum of all trichlorophenols
*** DIV is for the sum of all phthalates
A PAH compounds specified in GTV
Monitoring Well ID
SVOCEPA Draft Interim
Guideline Value
Sum(0.05) *
Guideline
Threshold
Value
sum(0.01) **
Dutch
Intervention
Value
AECOM Pfizer Little Island Round 1 (April) 2015 Tables.xls
For
insp
ectio
n pur
pose
s only
.
Conse
nt of
copy
right
owne
r req
uired
for a
ny ot
her u
se.
EPA Export 29-05-2016:01:10:08

Compiled by: AO
Checked by: FO'RTable 4 - Major Ion Concentrations (mg/L), Pfizer Little Island - April 2015
203 Dup 01 207 301 302 304 305 604
8-Apr-15 8-Apr-15 8-Apr-15 8-Apr-15 8-Apr-15 8-Apr-15 8-Apr-15 8-Apr-15
Calcium 0.2 200 ---- 50 49 135 107 72 73 37 86
Magnesium 0.1 50 ---- 5 5 83 38 5 6 6 42
Potassium 0.1 5 ---- 3 3 15 4 3 8 1 15
Sodium 0.1 150 150 25 25 348 40 19 26 13 272
Sulphate 0.05 200 187.5 22 25 500 282 41 162 10 96
Chloride 0.3 30 24 - 187.5 35 35 571 61 33 49 23 247
Nitrate (as NO3) 0.2 25 37.5 0.4 0.4 5.4 0.4 37.3 1.7 37.3 0.5
Total Alkalinity (as
CaCO3)1.0 ---- ---- 152 156 248 168 146 90 84 580
Notes:
--- Indicates no guideline value define
BOLD Indicates Result is above draft Interim Guideline value (IGV)
Italics indicates Result is above Guideline Threshold Value (GTV)
Parameter
Method
Detection
Limit
Interim
Guideline
Value
Guideline
Threshold
Value
Monitoring Well
AECOM Pfizer Little Island Round 1 (April) 2015 Tables.xls
For
insp
ectio
n pur
pose
s only
.
Conse
nt of
copy
right
owne
r req
uired
for a
ny ot
her u
se.
EPA Export 29-05-2016:01:10:08

Compiled by: AO
Checked by: FO'RTable 5 - Groundwater Quality Measurements, Pfizer Little Island - April 2015
Monitoring
Well
DO
(mg/L)pH
Field ORP
(mV)
Eh
(mV)
EC
(µµµµS/cm)
Temperature
( oC)
Description
203 1.44 6.33 -98 102 381 13.4Cloudy brown water with black suspended
solids, slight hydrogen sulphide odour.
207 2.11 6.99 4 204 2,664 12.4 Slightly cloudy grey water, no odour.
301 1.11 6.07 -64 136 544 12.9Slightly cloudy orange-brown water, no
odour.
302 1.25 6.19 -23 177 477 11.9 Slightly cloudy red-brown water, no odour.
304 1.76 6.01 10 210 525 14.0Dark grey water with black suspended
solids, no odour.
305 3.14 6.34 24 224 304 11.1 Cloudy brown water, no odour.
404 4.11 6.58 -6 150 906 12.7 Cloudy brown water, no odour.
604 2.87 6.71 -21 179 1,753 11.4 Silty, slightly cloudy grey water, no odour.
Notes:
EC: Electrical Conductivity µs/cm: Microsiemens per centimetre
ORP: Oxidation-Reduction Potential
Eh: Redox Potential
Field readings of ORP adjusted as per manufacturer's recommendations to give Eh
DO: Dissolved Oxygen mg/L: Milligrams per Litre
oC: Degrees Celsius
mV: Millivolts
AECOM Pfizer Little Island Round 1 (April) 2015 Tables.xls
For
insp
ectio
n pur
pose
s only
.
Conse
nt of
copy
right
owne
r req
uired
for a
ny ot
her u
se.
EPA Export 29-05-2016:01:10:08

Compiled by: AO
Checked by: FO'RTable 6 - Groundwater Level Data, Pfizer Little Island - 08 April 2015
Monitoring
Well
Screen
Interval
m bct
Top of Well
Casing
m AOD
SWL
m bct
SWL
m AOD
Total Depth
m bct
Total Depth
Installed
m bct
Thickness of
Silt
m
% of Screen
Section
Silted-Up
201 4.5-10.0 5.341 4.610 0.73 8.64 10.00 1.36 25%
202 6.0-10.0 6.115 5.323 0.79 8.51 10.00 1.49 37%
203 4.5-10.0 6.397 5.783 0.61 8.24 9.24 1.00 18%
205A 3.4-7.4 6.649 6.023 0.63 7.22 7.15 NA NA
206 7.0-13.0 6.953 6.272 0.68 12.44 13.00 0.56 9%
207 10.5-13.5 6.774 6.018 0.76 10.52 13.50 2.98 99%
301 6.0-10.0 7.079 6.429 0.65 10.39 10.00 NA NA
302 2.0-7.0 4.006 3.384 0.62 7.41 7.00 NA NA
303 3.2-6.2 4.190 3.520 0.67 6.51 6.20 NA NA
304 2.9-6.9 6.535 5.881 0.65 9.47 9.60 0.13 3%
305 2.6-6.9 4.395 3.772 0.62 7.15 6.90 NA NA
402 5.0-6.5 6.001 5.294 0.71 6.48 6.50 0.02 1%
403 1.5-3.0 5.453 2.676 2.78 2.99 3.00 0.02 1%
404 1.7-4.7 5.628 3.550 2.08 4.62 4.70 0.08 3%
405 5.1-6.1 5.856 5.150 0.71 5.98 6.10 0.12 12%
501 2.1-4.1 5.584 2.875 2.71 3.69 4.10 0.41 21%
601 8.1-10.1 4.494 3.620 0.87 10.09 10.17 0.08 4%
602 8.45-9.4 5.385 4.572 0.81 9.38 9.47 0.09 9%
603 9.6-10.6 5.171 4.517 0.65 10.56 10.60 0.04 4%
604 7.6-9.1 4.790 4.162 0.63 9.02 9.16 0.14 9%
Production Well - 7.080 6.355 0.73 NM 16.05 NA NA
Notes:
m AOD: Metres above Ordnance Datum
SWL: Static Water Level
m bct: Metres below casing top
NM: Not Measured
NA: Not Applicable
-: Not Known
AECOM Pfizer Little Island Round 1 (April) 2015 Tables.xls
For
insp
ectio
n pur
pose
s only
.
Conse
nt of
copy
right
owne
r req
uired
for a
ny ot
her u
se.
EPA Export 29-05-2016:01:10:08

Compiled by: AO
Checked by: FO'RTable 7 - Key Contaminant Concentration Trends in Monitored Wells (mg/L), Pfizer Little Island - to April 2015
201
MTBE 9.200
Toluene 1.000
202
MTBE 9.200
Toluene 1.000
203
MTBE 9.200
Toluene 1.000
205A
MTBE 9.200
Toluene 1.000
301
MTBE 9.200
Toluene 1.000
302
MTBE 9.200
Toluene 1.000
304
MTBE 9.200
Toluene 1.000
402
MTBE 9.200
Toluene 1.000
403
MTBE 9.200
Toluene 1.000
501
MTBE 9.200
Toluene 1.000
502
MTBE 9.200
Toluene 1.000
503
MTBE 9.200
Toluene 1.000
604
MTBE 9.200
Toluene 1.000
404
MTBE 9.200
Toluene 1.000
Chloroform 0.400
405
MTBE 9.200
Toluene 1.000
Notes:
Indicates well not sampled
Indicates result above DIV
-* Indicates sample not
analysed due to matrix
affects
Well / VOC DIV
Well / VOC DIV
- Indicates result below
method reporting limit
Jan-06 Feb-06 Mar-06 Apr-06 May-06 Jun-06 Jul-06 Aug-06 Sep-06 Oct-06 Nov-06 Dec-06 Mar-07 Jun-07 Sep-07 Mar-08 Aug-08 Dec-08 Mar-09 Sep-09 Apr-10 Oct-10 May-11 Oct-11 May-12 Oct-12 May-13 Nov-13 Apr-14 Oct-14 Apr-15
2.90 2.71 5.34 3.18 2.95 3.76 1.50 2.12 1.68 3.26 2.89 2.00 1.61 1.50 0.504 0.061 0.024 0.017 0.013 0.018 0.010 0.006 0.005 0.002
- - - - - - - - - - - - - - - - - - - - - - - -
0.637 0.555 0.428 0.359 0.758 0.399 0.081 0.078 0.296 0.058 0.125 0.050 0.036 0.034 0.022 0.024 0.083 0.006 0.009 0.004 0.011 0.006
- - - - - - - - - - - - - - - - - - - - - -
8.67 6.57 8.81 9.29 29.0 13.7 14.9 14.8 10.7 7.72 2.95 3.36 1.78 4.02 4.24 1.54 0.259 0.420 0.504 0.064 0.256 0.062 0.087 0.017 0.031 0.015 - 0.018 0.067 0.002 0.047
- - - - - - - - - - - - - - - - - - 0.002 - - - - - - - - - - - -
16.6 21.9 17.1 8.62 28.8 15.1 10.8 9.66 14.3 17.5 11.4 11.7 2.94 2.36 0.809 5.75 0.345 0.026 0.002 - - - - -
- - - - - - - - - - - - - - - - - - - - - - - -
0.190 0.192 0.175 0.159 0.060 0.063 0.020 0.063 0.010 0.026 0.022 0.018 0.005 0.069 0.035 0.004 0.001 - 0.020 0.002 - 0.002
- - - - - - - - - - - - - - - - - - - - - -
- 0.029 0.432 0.748 0.040 - 0.128 0.023 0.003 0.003 0.028 0.014 0.040 0.022 0.023 0.034 0.007 0.004 - 0.007 0.003 0.007 0.001
- - - - - - - - - - - - - - - - - - - - - - -
3.52 1.64 1.97 3.75 7.06 5.16 4.33 1.99 1.08 0.482 0.993 3.98 0.094 0.096 0.330 0.041 0.030 0.023 0.095 0.084 0.005 0.004 0.003 0.005 0.004 - - - 0.006 0.001 0.002
- - - - - - - - - - - - - - - - - - - - - - - - - - - - - - -
4.07 5.11 3.52 6.86 6.26 2.26 2.02 0.465 0.719 0.355 0.321 0.810 0.780
- - - - - - - - - - - - -
0.609 1.39 0.797 4.76 2.36 2.51 2.28 2.08 1.42 1.96 3.63 1.18 1.75 0.004 0.015
- 0.054 0.054 0.159 0.092 0.114 0.100 0.012 - - 0.017 - - - -
4.19 5.28 2.42 3.21 7.04 8.20 7.69 7.84 3.96 4.27 1.16 0.405 0.003 0.003
- 0.314 0.104 0.175 0.187 0.298 - 0.135 0.163 0.117 0.010 - - -
2.66 2.36 3.55 2.96 4.86 2.95 1.78 2.60 3.05 0.494 1.40 1.41 3.22
- 0.003 0.013 - - 0.013 - - - - 0.106 0.006 -
4.13 3.45 19.7 12.8 7.90 10.6 8.37 3.15 1.42 2.00 5.07
- - 0.018 - - - - - - - -
0.139 0.162 0.062 0.064
- - - -
Jan-06 Feb-06 Mar-06 Apr-06 May-06 Jun-06 Jul-06 Aug-06 Sep-06 Oct-06 Nov-06 Dec-06 Jan-07 Feb-07 Mar-07 Apr-07 May-07 Jun-07 Jul-07 Aug-07 Sep-07 Oct-07 Mar-08 Aug-08 Nov-08 Dec-08 Mar-09 Sep-09 Apr-10 Oct-10 May-11 Oct-11 May-12 Oct-12 May-13 Nov-13 Apr-14 Oct-14 Apr-15
151 300 215 266 94.6 121.246 89.4 102 122 33.2 44.4 47.6 59.4 58.9 249 552 59.3 60.5 - 0.082 0.035 0.005 146 106 14 1 1 - 0.123 0.157 0.065 0.018 - 0.171 0.004 0.020 0.164
4.00 1.13 0.831 1.25 2.43 1.96 2.59 2.07 1.97 1.15 0.789 0.651 0.385 0.570 0.983 0.723 1.02 0.692 - 0.002 0.005 - - - - - - - - - - - - - - - -
- - - - - - - - - 0.034 - 0.031 0.046 - - - 0.414 0.008 0.087 0.212 0.045 0.309 - - - 0.096 0.271 0.024
3.41 9.28 9.31 7.31 3.22 5.13 14.3 9.71 17.6 11.4 7.24 11.3 11.2 6.94 5.15 9.27 5.11 0.667 1.43 2.00 5.25 1.62 0.015 0.057 0.519 0.038 0.005 0.004 0.005 0.004 -
- - - - - - - - - - - - - - - - - - - - - - - - - - - - - - -
Monitoring Round
Monitoring Round
AECOM Pfizer Little Island Round 1 (April) 2015 Tables.xls
For
insp
ectio
n pur
pose
s only
.
Conse
nt of
copy
right
owne
r req
uired
for a
ny ot
her u
se.
EPA Export 29-05-2016:01:10:08

Pfizer Ireland Pharmaceuticals - Pfizer Little Island IEL Groundwater Monitoring April 2015
47092917/CKRP0001/ISSUE NO. 2/FINAL
28 April 2015
APPENDIX A –
LABORTORY CERTIFICATES
For
insp
ectio
n pur
pose
s only
.
Conse
nt of
copy
right
owne
r req
uired
for a
ny ot
her u
se.
EPA Export 29-05-2016:01:10:08

Unit 3 Deeside Point
Zone 3
Deeside Industrial Park
Deeside
AECOM
Attention :
Date :
Your reference :
Our reference :
Location :
Date samples received :
Status :
Issue :
Bob Millward BSc FRSC
Principal Chemist
Nine samples were received for analysis on 10th April, 2015 of which nine were scheduled for analysis. Please find attached our Test Report which
should be read with notes at the end of the report and should include all sections if reproduced. Interpretations and opinions are outside the scope
of any accreditation, and all results relate only to samples supplied.
All analysis is carried out on as received samples and reported on a dry weight basis unless stated otherwise. Results are not surrogate corrected.
Simon Gomery BSc
Project Manager
17th April, 2015
47092917
Little Island
10th April, 2015
Final report
Compiled By:
Test Report 15/5932 Batch 1
1
Jones Environmental Laboratory
CH5 2UA
Tel: +44 (0) 1244 833780
Fax: +44 (0) 1244 833781
Fergus O'Regan
Acorn Business Campus
Mahon Industrial Park
Black Rock
Cork
Ireland
Registered Address : Unit 3 Deeside Point, Zone 3, Deeside Industrial Park, Deeside, CH5 2UA. UK
QF-PM 3.1.1 v16Please include all sections of this report if it is reproduced
All solid results are expressed on a dry weight basis unless stated otherwise. 1 of 8
For
insp
ectio
n pur
pose
s only
.
Conse
nt of
copy
right
owne
r req
uired
for a
ny ot
her u
se.
EPA Export 29-05-2016:01:10:08

Client Name: Report : Liquid
Reference:
Location:
Contact: Liquids/products: V=40ml vial, G=glass bottle, P=plastic bottle
JE Job No.: 15/5932 H=H2SO4, Z=ZnAc, N=NaOH, HN=HN03
J E Sample No. 1-6 7-12 13-18 19-24 25-30 31-36 37-42 46-51
Sample ID 203 207 301 302 304 305 604 DUP1
Depth
COC No / misc
Containers V H HN P G V H HN P G V H HN P G V H HN P G V H HN P G V H HN P G V H HN P G V H HN P G
Sample Date 08/04/2015 08/04/2015 08/04/2015 08/04/2015 08/04/2015 08/04/2015 08/04/2015 08/04/2015
Sample Type Ground Water Ground Water Ground Water Ground Water Ground Water Ground Water Ground Water Ground Water
Batch Number 1 1 1 1 1 1 1 1
Date of Receipt 10/04/2015 10/04/2015 10/04/2015 10/04/2015 10/04/2015 10/04/2015 10/04/2015 10/04/2015
Dissolved Calcium # 49.5 135.2 106.8 72.3 72.8 36.7 86.1 49.4 <0.2 mg/l TM30/PM14
Dissolved Magnesium # 4.7 82.9 38.4 5.3 5.7 5.9 42.1 4.6 <0.1 mg/l TM30/PM14
Dissolved Potassium # 2.8 15.1 3.8 3.0 7.9 1.2 14.6 2.8 <0.1 mg/l TM30/PM14
Dissolved Sodium # 24.8 347.8A 40.4 18.8 25.5 12.9 272.1A 24.5 <0.1 mg/l TM30/PM14
Sulphate # 22.09 499.88 281.96 41.41 162.08 10.39 95.83 25.39 <0.05 mg/l TM38/PM0
Chloride # 34.6 570.8 60.9 32.8 48.5 22.7 246.8 34.8 <0.3 mg/l TM38/PM0
Nitrate as NO3 # 0.4 5.4 0.4 37.3 1.7 37.3 0.5 0.4 <0.2 mg/l TM38/PM0
Total Alkalinity as CaCO3 # 152 248 168 146 90 84 580 156 <1 mg/l TM75/PM0
Total Cations 4.01 29.08 10.34 4.94 5.41 2.91 19.97 3.98 <0.00 mmolc/l TM0/PM0
Total Anions 4.48 31.56 10.95 5.31 6.57 3.14 20.56 4.64 <0.00 mmolc/l TM0/PM0
% Cation Excess -5.54 -4.09 -2.87 -3.61 -9.68 -3.80 -1.46 -7.66 % TM0/PM0
Little Island
Fergus O'Regan
Please see attached notes for all
abbreviations and acronyms
LOD/LOR UnitsMethod
No.
Jones Environmental Laboratory
AECOM
47092917
QF-PM 3.1.2 v11Please include all sections of this report if it is reproduced
All solid results are expressed on a dry weight basis unless stated otherwise. 2 of 8
For
insp
ectio
n pur
pose
s only
.
Conse
nt of
copy
right
owne
r req
uired
for a
ny ot
her u
se.
EPA Export 29-05-2016:01:10:08

Client Name: SVOC Report : Liquid
Reference:
Location:
Contact:
JE Job No.: 15/5932
J E Sample No. 1-6 7-12 13-18 19-24 25-30 31-36 37-42 43-45 46-51
Sample ID 203 207 301 302 304 305 604 404 DUP1
Depth
COC No / misc
Containers V H HN P G V H HN P G V H HN P G V H HN P G V H HN P G V H HN P G V H HN P G V G V H HN P G
Sample Date 08/04/2015 08/04/2015 08/04/2015 08/04/2015 08/04/2015 08/04/2015 08/04/2015 08/04/2015 08/04/2015
Sample Type Ground Water Ground Water Ground Water Ground Water Ground Water Ground Water Ground Water Ground Water Ground Water
Batch Number 1 1 1 1 1 1 1 1 1
Date of Receipt 10/04/2015 10/04/2015 10/04/2015 10/04/2015 10/04/2015 10/04/2015 10/04/2015 10/04/2015 10/04/2015
SVOC MS
Phenols
2-Chlorophenol # <1 <1 <1 <1 <1 <1 <1 <1 <1 <1 ug/l TM16/PM30
2-Methylphenol # <0.5 <0.5 <0.5 <0.5 <0.5 <0.5 <0.5 <0.5 <0.5 <0.5 ug/l TM16/PM30
2-Nitrophenol <0.5 <0.5 <0.5 <0.5 <0.5 <0.5 <0.5 <0.5 <0.5 <0.5 ug/l TM16/PM30
2,4-Dichlorophenol # <0.5 <0.5 <0.5 <0.5 <0.5 <0.5 <0.5 <0.5 <0.5 <0.5 ug/l TM16/PM30
2,4-Dimethylphenol <1 <1 <1 <1 <1 <1 <1 <1 <1 <1 ug/l TM16/PM30
2,4,5-Trichlorophenol # <0.5 <0.5 <0.5 <0.5 <0.5 <0.5 <0.5 <0.5 <0.5 <0.5 ug/l TM16/PM30
2,4,6-Trichlorophenol <1 <1 <1 <1 <1 <1 <1 <1 <1 <1 ug/l TM16/PM30
4-Chloro-3-methylphenol # <0.5 <0.5 <0.5 <0.5 <0.5 <0.5 <0.5 <0.5 <0.5 <0.5 ug/l TM16/PM30
4-Methylphenol <1 <1 <1 <1 <1 <1 <1 <1 <1 <1 ug/l TM16/PM30
4-Nitrophenol <10 <10 <10 <10 <10 <10 <10 <10 <10 <10 ug/l TM16/PM30
Pentachlorophenol <1 <1 <1 <1 <1 <1 <1 <1 <1 <1 ug/l TM16/PM30
Phenol <1 <1 <1 <1 <1 <1 <1 <1 <1 <1 ug/l TM16/PM30
PAHs
2-Chloronaphthalene # <1 <1 <1 <1 <1 <1 <1 <1 <1 <1 ug/l TM16/PM30
2-Methylnaphthalene # <1 <1 <1 <1 <1 <1 <1 <1 <1 <1 ug/l TM16/PM30
Naphthalene # <1 <1 <1 <1 <1 <1 <1 <1 <1 <1 ug/l TM16/PM30
Acenaphthylene # <0.5 <0.5 <0.5 <0.5 <0.5 <0.5 <0.5 <0.5 <0.5 <0.5 ug/l TM16/PM30
Acenaphthene # <1 <1 <1 <1 <1 <1 <1 <1 <1 <1 ug/l TM16/PM30
Fluorene # <0.5 <0.5 <0.5 <0.5 <0.5 <0.5 <0.5 <0.5 <0.5 <0.5 ug/l TM16/PM30
Phenanthrene # <0.5 <0.5 <0.5 <0.5 <0.5 <0.5 <0.5 <0.5 <0.5 <0.5 ug/l TM16/PM30
Anthracene # <0.5 <0.5 <0.5 <0.5 <0.5 <0.5 <0.5 <0.5 <0.5 <0.5 ug/l TM16/PM30
Fluoranthene # <0.5 <0.5 <0.5 <0.5 <0.5 <0.5 <0.5 <0.5 <0.5 <0.5 ug/l TM16/PM30
Pyrene # <0.5 <0.5 <0.5 <0.5 <0.5 <0.5 <0.5 <0.5 <0.5 <0.5 ug/l TM16/PM30
Benzo(a)anthracene # <0.5 <0.5 <0.5 <0.5 <0.5 <0.5 <0.5 <0.5 <0.5 <0.5 ug/l TM16/PM30
Chrysene # <0.5 <0.5 <0.5 <0.5 <0.5 <0.5 <0.5 <0.5 <0.5 <0.5 ug/l TM16/PM30
Benzo(bk)fluoranthene # <1 <1 <1 <1 <1 <1 <1 <1 <1 <1 ug/l TM16/PM30
Benzo(a)pyrene <1 <1 <1 <1 <1 <1 <1 <1 <1 <1 ug/l TM16/PM30
Indeno(123cd)pyrene <1 <1 <1 <1 <1 <1 <1 <1 <1 <1 ug/l TM16/PM30
Dibenzo(ah)anthracene # <0.5 <0.5 <0.5 <0.5 <0.5 <0.5 <0.5 <0.5 <0.5 <0.5 ug/l TM16/PM30
Benzo(ghi)perylene # <0.5 <0.5 <0.5 <0.5 <0.5 <0.5 <0.5 <0.5 <0.5 <0.5 ug/l TM16/PM30
Phthalates
Bis(2-ethylhexyl) phthalate <5 <5 <5 <5 <5 <5 <5 <5 <5 <5 ug/l TM16/PM30
Butylbenzyl phthalate <1 <1 <1 <1 <1 <1 <1 <1 <1 <1 ug/l TM16/PM30
Di-n-butyl phthalate # <1.5 <1.5 <1.5 <1.5 <1.5 <1.5 <1.5 <1.5 <1.5 <1.5 ug/l TM16/PM30
Di-n-Octyl phthalate <1 <1 <1 <1 <1 <1 <1 <1 <1 <1 ug/l TM16/PM30
Diethyl phthalate # <1 <1 <1 <1 <1 <1 <1 <1 <1 <1 ug/l TM16/PM30
Dimethyl phthalate <1 <1 <1 <1 <1 <1 <1 <1 <1 <1 ug/l TM16/PM30
Little Island
Fergus O'Regan
Please see attached notes for all
abbreviations and acronyms
LOD/LOR UnitsMethod
No.
Jones Environmental Laboratory
AECOM
47092917
QF-PM 3.1.3 v11Please include all sections of this report if it is reproduced
All solid results are expressed on a dry weight basis unless stated otherwise. 3 of 8
For
insp
ectio
n pur
pose
s only
.
Conse
nt of
copy
right
owne
r req
uired
for a
ny ot
her u
se.
EPA Export 29-05-2016:01:10:08
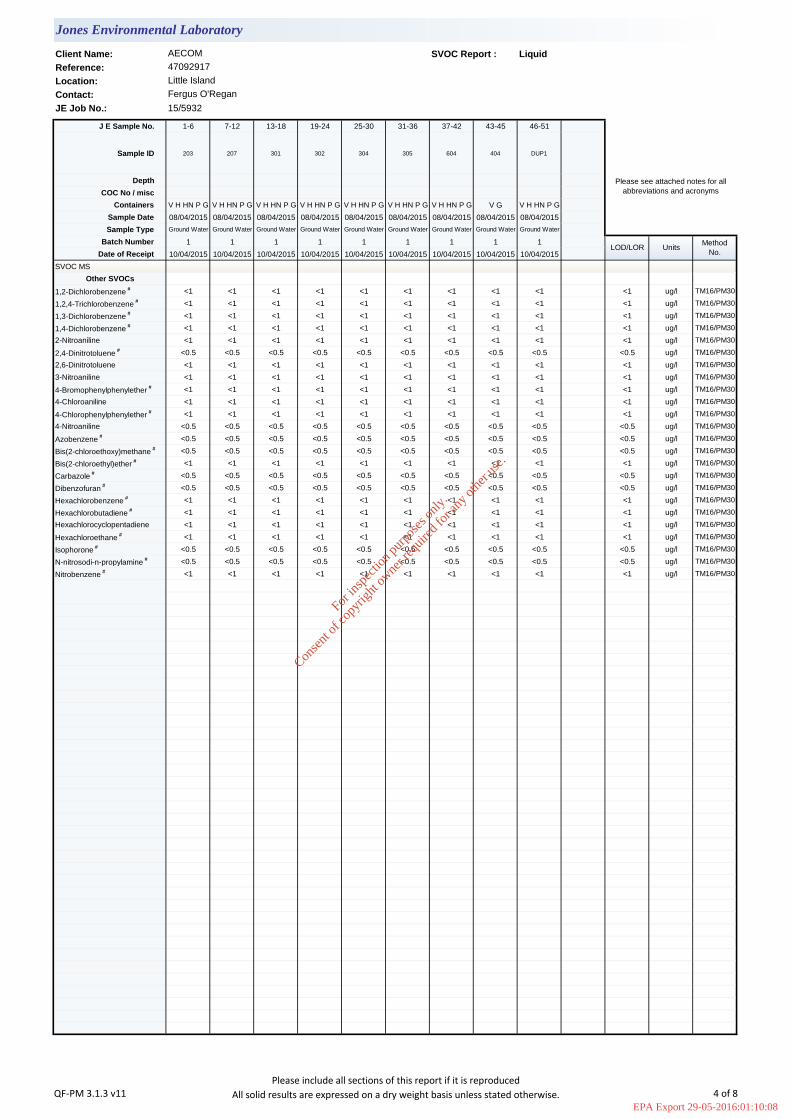
Client Name: SVOC Report : Liquid
Reference:
Location:
Contact:
JE Job No.: 15/5932
J E Sample No. 1-6 7-12 13-18 19-24 25-30 31-36 37-42 43-45 46-51
Sample ID 203 207 301 302 304 305 604 404 DUP1
Depth
COC No / misc
Containers V H HN P G V H HN P G V H HN P G V H HN P G V H HN P G V H HN P G V H HN P G V G V H HN P G
Sample Date 08/04/2015 08/04/2015 08/04/2015 08/04/2015 08/04/2015 08/04/2015 08/04/2015 08/04/2015 08/04/2015
Sample Type Ground Water Ground Water Ground Water Ground Water Ground Water Ground Water Ground Water Ground Water Ground Water
Batch Number 1 1 1 1 1 1 1 1 1
Date of Receipt 10/04/2015 10/04/2015 10/04/2015 10/04/2015 10/04/2015 10/04/2015 10/04/2015 10/04/2015 10/04/2015
SVOC MS
Other SVOCs
1,2-Dichlorobenzene # <1 <1 <1 <1 <1 <1 <1 <1 <1 <1 ug/l TM16/PM30
1,2,4-Trichlorobenzene # <1 <1 <1 <1 <1 <1 <1 <1 <1 <1 ug/l TM16/PM30
1,3-Dichlorobenzene # <1 <1 <1 <1 <1 <1 <1 <1 <1 <1 ug/l TM16/PM30
1,4-Dichlorobenzene # <1 <1 <1 <1 <1 <1 <1 <1 <1 <1 ug/l TM16/PM30
2-Nitroaniline <1 <1 <1 <1 <1 <1 <1 <1 <1 <1 ug/l TM16/PM30
2,4-Dinitrotoluene # <0.5 <0.5 <0.5 <0.5 <0.5 <0.5 <0.5 <0.5 <0.5 <0.5 ug/l TM16/PM30
2,6-Dinitrotoluene <1 <1 <1 <1 <1 <1 <1 <1 <1 <1 ug/l TM16/PM30
3-Nitroaniline <1 <1 <1 <1 <1 <1 <1 <1 <1 <1 ug/l TM16/PM30
4-Bromophenylphenylether # <1 <1 <1 <1 <1 <1 <1 <1 <1 <1 ug/l TM16/PM30
4-Chloroaniline <1 <1 <1 <1 <1 <1 <1 <1 <1 <1 ug/l TM16/PM30
4-Chlorophenylphenylether # <1 <1 <1 <1 <1 <1 <1 <1 <1 <1 ug/l TM16/PM30
4-Nitroaniline <0.5 <0.5 <0.5 <0.5 <0.5 <0.5 <0.5 <0.5 <0.5 <0.5 ug/l TM16/PM30
Azobenzene # <0.5 <0.5 <0.5 <0.5 <0.5 <0.5 <0.5 <0.5 <0.5 <0.5 ug/l TM16/PM30
Bis(2-chloroethoxy)methane # <0.5 <0.5 <0.5 <0.5 <0.5 <0.5 <0.5 <0.5 <0.5 <0.5 ug/l TM16/PM30
Bis(2-chloroethyl)ether # <1 <1 <1 <1 <1 <1 <1 <1 <1 <1 ug/l TM16/PM30
Carbazole # <0.5 <0.5 <0.5 <0.5 <0.5 <0.5 <0.5 <0.5 <0.5 <0.5 ug/l TM16/PM30
Dibenzofuran # <0.5 <0.5 <0.5 <0.5 <0.5 <0.5 <0.5 <0.5 <0.5 <0.5 ug/l TM16/PM30
Hexachlorobenzene # <1 <1 <1 <1 <1 <1 <1 <1 <1 <1 ug/l TM16/PM30
Hexachlorobutadiene # <1 <1 <1 <1 <1 <1 <1 <1 <1 <1 ug/l TM16/PM30
Hexachlorocyclopentadiene <1 <1 <1 <1 <1 <1 <1 <1 <1 <1 ug/l TM16/PM30
Hexachloroethane # <1 <1 <1 <1 <1 <1 <1 <1 <1 <1 ug/l TM16/PM30
Isophorone # <0.5 <0.5 <0.5 <0.5 <0.5 <0.5 <0.5 <0.5 <0.5 <0.5 ug/l TM16/PM30
N-nitrosodi-n-propylamine # <0.5 <0.5 <0.5 <0.5 <0.5 <0.5 <0.5 <0.5 <0.5 <0.5 ug/l TM16/PM30
Nitrobenzene # <1 <1 <1 <1 <1 <1 <1 <1 <1 <1 ug/l TM16/PM30
LOD/LOR UnitsMethod
No.
Jones Environmental Laboratory
AECOM
47092917
Little Island
Fergus O'Regan
Please see attached notes for all
abbreviations and acronyms
QF-PM 3.1.3 v11Please include all sections of this report if it is reproduced
All solid results are expressed on a dry weight basis unless stated otherwise. 4 of 8
For
insp
ectio
n pur
pose
s only
.
Conse
nt of
copy
right
owne
r req
uired
for a
ny ot
her u
se.
EPA Export 29-05-2016:01:10:08

Client Name: VOC Report : Liquid
Reference:
Location:
Contact:
JE Job No.: 15/5932
J E Sample No. 1-6 7-12 13-18 19-24 25-30 31-36 37-42 43-45 46-51
Sample ID 203 207 301 302 304 305 604 404 DUP1
Depth
COC No / misc
Containers V H HN P G V H HN P G V H HN P G V H HN P G V H HN P G V H HN P G V H HN P G V G V H HN P G
Sample Date 08/04/2015 08/04/2015 08/04/2015 08/04/2015 08/04/2015 08/04/2015 08/04/2015 08/04/2015 08/04/2015
Sample Type Ground Water Ground Water Ground Water Ground Water Ground Water Ground Water Ground Water Ground Water Ground Water
Batch Number 1 1 1 1 1 1 1 1 1
Date of Receipt 10/04/2015 10/04/2015 10/04/2015 10/04/2015 10/04/2015 10/04/2015 10/04/2015 10/04/2015 10/04/2015
VOC MS
Dichlorodifluoromethane <2 <2 <2 <2 <2 <2 <2 <2 <2 <2 ug/l TM15/PM10
Methyl Tertiary Butyl Ether # 46.7 <0.1 2.3 1.4 1.6 <0.1 64.3 164.3 47.9 <0.1 ug/l TM15/PM10
Chloromethane # <3 <3 <3 <3 <3 <3 <3 <3 <3 <3 ug/l TM15/PM10
Vinyl Chloride # <0.1 <0.1 <0.1 <0.1 <0.1 <0.1 <0.1 <0.1 <0.1 <0.1 ug/l TM15/PM10
Bromomethane <1 <1 <1 <1 <1 <1 <1 <1 <1 <1 ug/l TM15/PM10
Chloroethane # <3 <3 <3 <3 <3 <3 <3 <3 <3 <3 ug/l TM15/PM10
Trichlorofluoromethane # <3 <3 <3 <3 <3 <3 <3 <3 <3 <3 ug/l TM15/PM10
1,1-Dichloroethene (1,1 DCE) # <3 <3 <3 <3 <3 <3 <3 <3 <3 <3 ug/l TM15/PM10
Dichloromethane (DCM) # <3 <3 <3 <3 <3 <3 <3 <3 <3 <3 ug/l TM15/PM10
trans-1-2-Dichloroethene # <3 <3 <3 <3 <3 <3 <3 <3 <3 <3 ug/l TM15/PM10
1,1-Dichloroethane # <3 <3 <3 <3 <3 <3 <3 5 <3 <3 ug/l TM15/PM10
cis-1-2-Dichloroethene # <3 <3 <3 <3 <3 <3 <3 <3 <3 <3 ug/l TM15/PM10
2,2-Dichloropropane <1 <1 <1 <1 <1 <1 <1 <1 <1 <1 ug/l TM15/PM10
Bromochloromethane # <2 <2 <2 <2 <2 <2 <2 <2 <2 <2 ug/l TM15/PM10
Chloroform # <2 <2 <2 <2 <2 <2 <2 24 <2 <2 ug/l TM15/PM10
1,1,1-Trichloroethane # <2 <2 <2 <2 <2 <2 <2 <2 <2 <2 ug/l TM15/PM10
1,1-Dichloropropene # <3 <3 <3 <3 <3 <3 <3 <3 <3 <3 ug/l TM15/PM10
Carbon tetrachloride # <2 <2 <2 <2 <2 <2 <2 <2 <2 <2 ug/l TM15/PM10
1,2-Dichloroethane # <2 <2 <2 <2 <2 <2 <2 <2 <2 <2 ug/l TM15/PM10
Benzene # <0.5 <0.5 <0.5 <0.5 <0.5 <0.5 <0.5 <0.5 <0.5 <0.5 ug/l TM15/PM10
Trichloroethene (TCE) # <3 <3 <3 <3 <3 <3 <3 <3 <3 <3 ug/l TM15/PM10
1,2-Dichloropropane # <2 <2 <2 <2 <2 <2 <2 <2 <2 <2 ug/l TM15/PM10
Dibromomethane # <3 <3 <3 <3 <3 <3 <3 <3 <3 <3 ug/l TM15/PM10
Bromodichloromethane # <2 <2 <2 <2 <2 <2 <2 <2 <2 <2 ug/l TM15/PM10
cis-1-3-Dichloropropene <2 <2 <2 <2 <2 <2 <2 <2 <2 <2 ug/l TM15/PM10
Toluene # <0.5 <0.5 <0.5 <0.5 <0.5 <0.5 <0.5 <0.5 <0.5 <0.5 ug/l TM15/PM10
trans-1-3-Dichloropropene <2 <2 <2 <2 <2 <2 <2 <2 <2 <2 ug/l TM15/PM10
1,1,2-Trichloroethane # <2 <2 <2 <2 <2 <2 <2 <2 <2 <2 ug/l TM15/PM10
Tetrachloroethene (PCE) # <3 <3 <3 <3 <3 <3 <3 <3 <3 <3 ug/l TM15/PM10
1,3-Dichloropropane # <2 <2 <2 <2 <2 <2 <2 <2 <2 <2 ug/l TM15/PM10
Dibromochloromethane # <2 <2 <2 <2 <2 <2 <2 <2 <2 <2 ug/l TM15/PM10
1,2-Dibromoethane # <2 <2 <2 <2 <2 <2 <2 <2 <2 <2 ug/l TM15/PM10
Chlorobenzene # <2 <2 <2 <2 <2 <2 <2 <2 <2 <2 ug/l TM15/PM10
1,1,1,2-Tetrachloroethane # <2 <2 <2 <2 <2 <2 <2 <2 <2 <2 ug/l TM15/PM10
Ethylbenzene # <0.5 <0.5 <0.5 <0.5 <0.5 <0.5 <0.5 <0.5 <0.5 <0.5 ug/l TM15/PM10
p/m-Xylene # <1 <1 <1 <1 <1 <1 <1 <1 <1 <1 ug/l TM15/PM10
o-Xylene # <0.5 <0.5 <0.5 <0.5 <0.5 <0.5 <0.5 <0.5 <0.5 <0.5 ug/l TM15/PM10
Styrene <2 <2 <2 <2 <2 <2 <2 <2 <2 <2 ug/l TM15/PM10
Bromoform # <2 <2 <2 <2 <2 <2 <2 <2 <2 <2 ug/l TM15/PM10
Isopropylbenzene # <3 <3 <3 <3 <3 <3 <3 <3 <3 <3 ug/l TM15/PM10
1,1,2,2-Tetrachloroethane <4 <4 <4 <4 <4 <4 <4 <4 <4 <4 ug/l TM15/PM10
Bromobenzene # <2 <2 <2 <2 <2 <2 <2 <2 <2 <2 ug/l TM15/PM10
1,2,3-Trichloropropane # <3 <3 <3 <3 <3 <3 <3 <3 <3 <3 ug/l TM15/PM10
Propylbenzene # <3 <3 <3 <3 <3 <3 <3 <3 <3 <3 ug/l TM15/PM10
2-Chlorotoluene # <3 <3 <3 <3 <3 <3 <3 <3 <3 <3 ug/l TM15/PM10
1,3,5-Trimethylbenzene # <3 <3 <3 <3 <3 <3 <3 <3 <3 <3 ug/l TM15/PM10
4-Chlorotoluene # <3 <3 <3 <3 <3 <3 <3 <3 <3 <3 ug/l TM15/PM10
tert-Butylbenzene # <3 <3 <3 <3 <3 <3 <3 <3 <3 <3 ug/l TM15/PM10
1,2,4-Trimethylbenzene # <3 <3 <3 <3 <3 <3 <3 <3 <3 <3 ug/l TM15/PM10
sec-Butylbenzene # <3 <3 <3 <3 <3 <3 <3 <3 <3 <3 ug/l TM15/PM10
4-Isopropyltoluene # <3 <3 <3 <3 <3 <3 <3 <3 <3 <3 ug/l TM15/PM10
1,3-Dichlorobenzene # <3 <3 <3 <3 <3 <3 <3 <3 <3 <3 ug/l TM15/PM10
1,4-Dichlorobenzene # <3 <3 <3 <3 <3 <3 <3 <3 <3 <3 ug/l TM15/PM10
n-Butylbenzene # <3 <3 <3 <3 <3 <3 <3 <3 <3 <3 ug/l TM15/PM10
1,2-Dichlorobenzene # <3 <3 <3 <3 <3 <3 <3 <3 <3 <3 ug/l TM15/PM10
1,2-Dibromo-3-chloropropane <2 <2 <2 <2 <2 <2 <2 <2 <2 <2 ug/l TM15/PM10
1,2,4-Trichlorobenzene <3 <3 <3 <3 <3 <3 <3 <3 <3 <3 ug/l TM15/PM10
Hexachlorobutadiene <3 <3 <3 <3 <3 <3 <3 <3 <3 <3 ug/l TM15/PM10
Naphthalene <2 <2 <2 <2 <2 <2 <2 <2 <2 <2 ug/l TM15/PM10
1,2,3-Trichlorobenzene <3 <3 <3 <3 <3 <3 <3 <3 <3 <3 ug/l TM15/PM10
Surrogate Recovery Toluene D8 99 95 99 99 98 98 94 96 98 <0 % TM15/PM10
Surrogate Recovery 4-Bromofluorobenzene 99 95 105 103 101 100 96 97 101 <0 % TM15/PM10
Little Island
Fergus O'Regan
Please see attached notes for all
abbreviations and acronyms
LOD/LOR UnitsMethod
No.
Jones Environmental Laboratory
AECOM
47092917
QF-PM 3.1.4 v11Please include all sections of this report if it is reproduced
All solid results are expressed on a dry weight basis unless stated otherwise. 5 of 8
For
insp
ectio
n pur
pose
s only
.
Conse
nt of
copy
right
owne
r req
uired
for a
ny ot
her u
se.
EPA Export 29-05-2016:01:10:08

JE Job No.:
SOILS
DEVIATING SAMPLES
SURROGATES
DILUTIONS
NOTE
Where a CEN 10:1 ZERO Headspace VOC test has been carried out, a 10:1 ratio of water to wet (as received) soil has been used.
All samples will be discarded one month after the date of reporting, unless we are instructed to the contrary. If we are instructed to keep samples, a
storage charge of £1 (1.5 Euros) per sample per month will be applied until we are asked to dispose of them.
Surrogate compounds are added during the preparation process to monitor recovery of analytes. However low recovery in soils is often due to peat,
clay or other organic rich matrices. For waters this can be due to oxidants, surfactants, organic rich sediments or remediation fluids. Acceptable
limits for most organic methods are 70 - 130% and for VOCs are 50 - 150%. When surrogate recoveries are outside the performance criteria but
the associated AQC passes this is assumed to be due to matrix effect. Results are not surrogate corrected.
A dilution suffix indicates a dilution has been performed and the reported result takes this into account. No further calculation is required.
NOTES TO ACCOMPANY ALL SCHEDULES AND REPORTS
Please note we are only MCERTS accredited for sand, loam and clay and any other matrix is outside our scope of accreditation.
Where Mineral Oil or Fats, Oils and Grease is quoted, this refers to Total Aliphatics C10-C40.
15/5932
WATERS
Where an MCERTS report has been requested, you will be notified within 48 hours of any samples that have been identified as being outside our
MCERTS scope. As validation has been performed on clay, sand and loam, only samples that are predominantly these matrices, or combinations
of them will be within our MCERTS scope. If samples are not one of a combination of the above matrices they will not be marked as MCERTS
accredited.
Where appropriate please make sure that our detection limits are suitable for your needs, if they are not, please notify us immediately.
It is assumed that you have taken representative samples on site and require analysis on a representative subsample. Stones will generally be
included unless we are requested to remove them.
Data is only reported if the laboratory is confident that the data is a true reflection of the samples analysed. Data is only reported as accredited when
all the requirements of our Quality System have been met. In certain circumstances where all the requirements of the Quality System have not been
met, for instance if the associated AQC has failed, the reason is fully investigated and documented. The sample data is then evaluated alongside
the other quality control checks performed during analysis to determine its suitability. Following this evaluation, provided the sample results have not
been effected, the data is reported but accreditation is removed. It is a UKAS requirement for data not reported as accredited to be considered
indicative only, but this does not mean the data is not valid.
Where possible, and if requested, samples will be re-extracted and a revised report issued with accredited results. Please do not hesitate to contact
the laboratory if further details are required of the circumstances which have led to the removal of accreditation.
If you have not already done so, please send us a purchase order if this is required by your company.
% Asbestos in Asbestos Containing Materials (ACMs) is determined by reference to HSG 264 The Survey Guide - Appendix 2 : ACMs in buildings
listed in order of ease of fibre release.
All analysis is reported on a dry weight basis unless stated otherwise. Results are not surrogate corrected. Samples are dried at 35°C ±5°C unless
otherwise stated. Moisture content for CEN Leachate tests are dried at 105°C ±5°C.
Where Mineral Oil or Fats, Oils and Grease is quoted, this refers to Total Aliphatics C10-C40.
Please note we are not a Drinking Water Inspectorate (DWI) Approved Laboratory . It is important that detection limits are carefully considered
when requesting water analysis.
UKAS accreditation applies to surface water and groundwater and one other matrix which is analysis specific, any other liquids are outside our
scope of accreditation
As surface waters require different sample preparation to groundwaters the laboratory must be informed of the water type when submitting samples.
Samples must be received in a condition appropriate to the requested analyses. All samples should be submitted to the laboratory in suitable
containers with sufficient ice packs to sustain an appropriate temperature for the requested analysis. If this is not the case you will be informed and
any test results that may be compromised highlighted on your deviating samples report.
QF-PM 3.1.9 v30Please include all sections of this report if it is reproduced
All solid results are expressed on a dry weight basis unless stated otherwise. 6 of 8
For
insp
ectio
n pur
pose
s only
.
Conse
nt of
copy
right
owne
r req
uired
for a
ny ot
her u
se.
EPA Export 29-05-2016:01:10:09

JE Job No.:
#
B
DR
M
NA
NAD
ND
NDP
SS
SV
W
+
++
*
AD
CO
LOD/LOR
ME
NFD
OC
A x5 Dilution
ABBREVIATIONS and ACRONYMS USED
Outside Calibration Range
No Fibres Detected
Result outside calibration range, results should be considered as indicative only and are not accredited.
Results expressed on as received basis.
Surrogate recovery outside performance criteria. This may be due to a matrix effect.
Matrix Effect
None Detected (usually refers to VOC and/SVOC TICs).
Limit of Detection (Limit of Reporting) in line with ISO 17025 and MCERTS
Dilution required.
Analysis subcontracted to a Jones Environmental approved laboratory.
Calibrated against a single substance
Not applicable
MCERTS accredited.
UKAS accredited.
15/5932
AQC failure, accreditation has been removed from this result, if appropriate, see 'Note' on previous page.
Suspected carry over
Samples are dried at 35°C ±5°C
Indicates analyte found in associated method blank.
No Asbestos Detected.
No Determination Possible
QF-PM 3.1.9 v30Please include all sections of this report if it is reproduced
All solid results are expressed on a dry weight basis unless stated otherwise. 7 of 8
For
insp
ectio
n pur
pose
s only
.
Conse
nt of
copy
right
owne
r req
uired
for a
ny ot
her u
se.
EPA Export 29-05-2016:01:10:09

JE Job No: 15/5932
Test Method No. Description
Prep Method
No. (if
appropriate)
Description UKAS
MCERTS
(soils
only)
Analysis done
on As Received
(AR) or Dried
(AD)
Reported on
dry weight
basis
TM0 Not available PM0 No preparation is required.
TM15Modified USEPA 8260. Quantitative Determination of Volatile Organic Compounds
(VOCs) by Headspace GC-MS.PM10
Modified US EPA method 5021. Preparation of solid and liquid samples for GC
headspace analysis.
TM15Modified USEPA 8260. Quantitative Determination of Volatile Organic Compounds
(VOCs) by Headspace GC-MS.PM10
Modified US EPA method 5021. Preparation of solid and liquid samples for GC
headspace analysis. Yes
TM16Modified USEPA 8270. Quantitative determination of Semi-Volatile Organic compounds
(SVOCs) by GC-MS. PM30 Water samples are extracted with solvent using a magnetic stirrer to create a vortex.
TM16Modified USEPA 8270. Quantitative determination of Semi-Volatile Organic compounds
(SVOCs) by GC-MS. PM30 Water samples are extracted with solvent using a magnetic stirrer to create a vortex. Yes
TM30Determination of Trace Metal elements by ICP-OES (Inductively Coupled Plasma -
Optical Emission Spectrometry). Modified US EPA Method 200.7PM14
Analysis of waters and leachates for metals by ICP OES. Samples are filtered for
dissolved metals and acidified if required.Yes
TM38Soluble Ion analysis using the Thermo Aquakem Photometric Automatic Analyser.
Modified US EPA methods 325.2, 375.4, 365.2, 353.1, 354.1PM0 No preparation is required. Yes
TM75Modified US EPA method 310.1. Determination of Alkalinity by Metrohm automated
titration analyser.PM0 No preparation is required. Yes
Jones Environmental Laboratory Method Code Appendix
QF-PM 3.1.10 v14 Please include all sections of this report if it is reproduced 8 of 8
For
insp
ectio
n pur
pose
s only
.
Conse
nt of
copy
right
owne
r req
uired
for a
ny ot
her u
se.
EPA Export 29-05-2016:01:10:09

Pfizer Ireland Pharmaceuticals - Pfizer Little Island IEL Groundwater Monitoring April 2015
47092917/CKRP0001/ISSUE NO. 2/FINAL
28 April 2015
ABOUT AECOM In a complex and unpredictable world, where growing demands have to be met with finite resources, AECOM brings experience gained from improving quality of life in hundreds of places. We bring together economists, planners, engineers, designers and project managers to work on projects at every scale. We engineer energy efficient buildings and we build new links between cities. We design new communities and regenerate existing ones. We are the first whole environments business, going beyond buildings and infrastructure. Our Europe teams form an important part of our worldwide network of nearly 100,000 staff in 150 countries. Through 360 ingenuity, we develop pioneering solutions that help our clients to see further and go further. www.aecom.com Follow us on Twitter: @aecom
For
insp
ectio
n pur
pose
s only
.
Conse
nt of
copy
right
owne
r req
uired
for a
ny ot
her u
se.
EPA Export 29-05-2016:01:10:09