PFIZER FACTS The Bu rden of Pain Among Adults in … · Joint pain prevalence is in the past month;...
104
PFIZER FACTS The Burden of Pain Among Adults in the United States Findings from the National Health and Nutrition Examination Survey, the National Health Care Surveys, and the National Health Interview Survey
Transcript of PFIZER FACTS The Bu rden of Pain Among Adults in … · Joint pain prevalence is in the past month;...

P F I Z E R F A C T S
Medical Division
PG283560© 2008 Pfizer Inc. All rights reserved.
Printed in USA/December 2008
The Burden of PainAmong Adultsin the United StatesFindings from the National Health and Nutrition Examination Survey,the National Health Care Surveys, and the National Health Interview Survey


The burden of pain among adults in theUnited States
Over 100 million adults in the United States—51% of the estimated 215 millionpopulation aged 20 years and older—report pain at one or more body sites includingthe joints, low back, neck, face/jaw, or experience dental pain or headaches/migraines.Over one-quarter of adults aged 40 years and older report low back pain in the past
3 months. One-quarter of women aged 20–39 years report having severe headaches or migrainesin the past 3 months.
Numerous diseases and conditions are also associated with pain, including arthritis, peripheralneuropathy, fibromyalgia, and shingles. Annually, there are 5.4 million ambulatory and inpatienthealth care visits with a diagnosis of fibromyalgia, 1.9 million diabetic neuropathy visits, and 1.5million shingles visits. 50% of adults with diabetes who have peripheral neuropathy reportsymptoms of pain/tingling in their feet or numbness/loss of feeling in the past 3 months. 44% ofadults with arthritis report limitations in their usual activities due to their arthritis or joint pain.
Pain may also be caused by bodily injury or harm. In 2006, there were approximately 34 millioninjury-related physician office visits. Analgesic drug therapy was reported at 40% of these injury-related visits.
Adults with pain have worse health status and experience more disability in terms of lost workdays, activity limitations, reduced sleep, and increased psychological distress than adults withoutpain. One in 3 adults with face or jaw pain report fair or poor health status, nearly 1 in 5 adultswith neck pain report being unable to work, and 1 in 9 adults with severe headaches/migrainesreport psychological distress.
This issue of Pfizer Facts presents new analyses of national data sources to gain insight into theburden of pain among adults in the United States. We present information on the prevalence ofpain at specific body sites and certain pain-related diseases and conditions such as arthritis,peripheral neuropathy, fibromyalgia, and shingles, as well as information on associated healthstatus and health care resource utilization. We present analyses of the National Health InterviewSurvey (NHIS), the National Health Care Surveys, and the National Health and NutritionExamination Survey (NHANES). We provide this information in an effort to heighten awarenessand encourage discussion pertaining to pain among adults.
Ryne Paulose, PhDDirector
Robin P. Hertz, PhDSenior Director/Team Leader
Comparative Effectiveness &Population StudiesEvidence-Based Strategies


Table of contents
Highlights 1
Pain at selected body sites 7
Joint pain 9Low back pain 25Neck pain 37Severe headaches or migraines 47Dental pain 57Face or jaw pain 58
Pain and selected diseases or conditions 61
Arthritis 61Peripheral neuropathy 73Diabetic neuropathy 75Fibromyalgia 79Shingles 83Injury 87
Appendix 91


HighlightsPain at selected body sites
• Over one-half of adults aged 20 years and older report feeling pain at one ormore body locations including the joints, back, neck, head, mouth, or face/jaw.Joint pain (28%) and low back pain (26%) are most prevalent.
• Joint pain increases with age and is generally more prevalent among women(31%) than men (26%), and among white, non-Hispanic adults (31%), thanblack, non-Hispanic adults (26%) and Hispanic adults (18%). 29% of adultswith joint pain report having severe pain. The knee is the most common site ofjoint pain regardless of age or gender.
• One in 3 older women and 1 in 4 older men report low back pain in the past 3months. Prevalence increases with body weight—low back pain is reported by about1 in 5 normal weight adults, 1 in 4 overweight adults, and 1 in 3 obese adults.
• 13% of adults report neck pain in the past 3 months. Neck pain is reportedmore often by women (15%) than men (11%) and white, non-Hispanic adults(14%) then black, non-Hispanic adults (10%) or Hispanic adults (11%).
• One in 8 adults report severe headaches or migraines in the past 3 months. It ismore prevalent among women (17%) than men (7%) and adults aged 20–39(15%) and 40–64 (13%) years than adults 65 and older (5%).
• One in 8 adults report dental pain in the past year. Men and women have asimilar prevalence of dental pain regardless of age.
• 4% of adults report facial ache or pain in the jaw muscles or the joint in frontof the ear. Regardless of age, more women (6%) than men (2%) report havingthis type of pain.
Pain at selected body sites and health status
• 25–33% of adults with pain at selected body sites report fair or poor health,15–22% report being unable to work, 12–17% report sleeping less than 6 hoursper day, and 6–13% report psychological distress.
• Also, 29–39% of adults with joint pain, low back pain, and neck pain reportarthritis-attributable activity limitations.
The burden of pain among adults in the United States
1

Pain at selected body sites and health care utilization
• Annually, adults have an average of 11 million physician office visits with adiagnosis of joint pain, over 1.1 million outpatient hospital visits, about 1.5 millionemergency department visits, and have over 177 thousand inpatient hospitalizations.
• Annually, adults have an average of 7 million physician office visits with adiagnosis of back pain, 762 thousand outpatient hospital visits, over 1.5 millionemergency department visits, and have about 227 thousand inpatienthospitalizations.
• Annually, adults have an average of 11 million physician visits with a headachediagnosis, over 1 million outpatient hospital visits, 3.3 million emergencydepartment visits, and 445 thousand inpatient hospitalizations.
• The majority of health care utilization for joint pain, back pain, and headacheswas by women and white, non-Hispanic adults.
Pain at selected body sites and analgesic drug use
• 23–27% of adults with joint pain, low back pain, neck pain, or severeheadaches/migraines report prescription analgesic drug use in the past month.
• 15–22% of adults with joint pain, low back pain, neck pain, or severeheadaches/migraines report using a non-prescription analgesic or certainnon-narcotic prescription analgesics nearly every day for a month or longer.
The burden of pain among adults in the United States
2
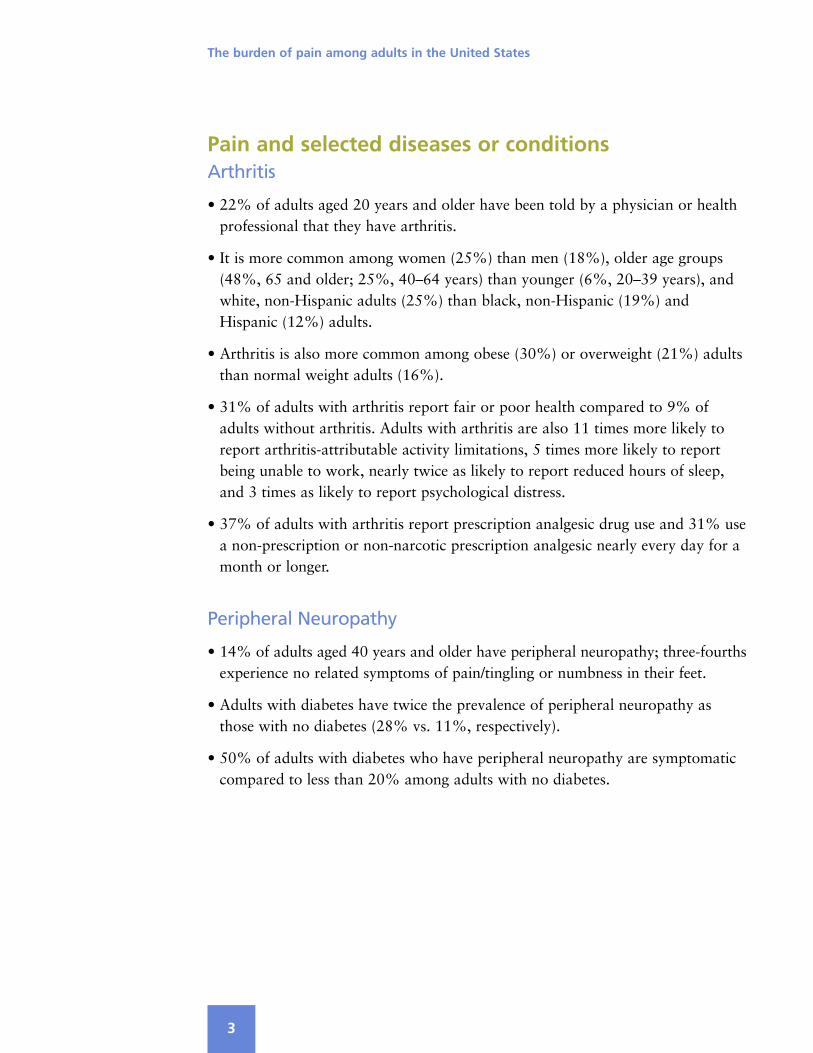
Pain and selected diseases or conditionsArthritis
• 22% of adults aged 20 years and older have been told by a physician or healthprofessional that they have arthritis.
• It is more common among women (25%) than men (18%), older age groups(48%, 65 and older; 25%, 40–64 years) than younger (6%, 20–39 years), andwhite, non-Hispanic adults (25%) than black, non-Hispanic (19%) andHispanic (12%) adults.
• Arthritis is also more common among obese (30%) or overweight (21%) adultsthan normal weight adults (16%).
• 31% of adults with arthritis report fair or poor health compared to 9% ofadults without arthritis. Adults with arthritis are also 11 times more likely toreport arthritis-attributable activity limitations, 5 times more likely to reportbeing unable to work, nearly twice as likely to report reduced hours of sleep,and 3 times as likely to report psychological distress.
• 37% of adults with arthritis report prescription analgesic drug use and 31% usea non-prescription or non-narcotic prescription analgesic nearly every day for amonth or longer.
Peripheral Neuropathy
• 14% of adults aged 40 years and older have peripheral neuropathy; three-fourthsexperience no related symptoms of pain/tingling or numbness in their feet.
• Adults with diabetes have twice the prevalence of peripheral neuropathy asthose with no diabetes (28% vs. 11%, respectively).
• 50% of adults with diabetes who have peripheral neuropathy are symptomaticcompared to less than 20% among adults with no diabetes.
The burden of pain among adults in the United States
3

The burden of pain among adults in the United States
4
Diabetic Neuropathy
• Annually, adults have an average of 1.4 million physician office visits with adiagnosis of diabetic neuropathy, 132 thousand outpatient hospital visits, 40thousand emergency department visits, and 392 thousand inpatienthospitalizations.
• The majority of ambulatory and inpatient visits for diabetic neuropathy are bywomen (46–65%), adults aged 40–64 (46–57%), and white, non-Hispanicadults (54–70%).
• An analgesic drug was prescribed, administered, or continued at 37% ofphysician office visits with a primary diagnosis of diabetic neuropathy.
Fibromyalgia
• Annually, there are about 5.4 million health care visits with a fibromyalgiadiagnosis: 4.5 million physician office visits, 390 thousand outpatient hospitalvisits, 413 thousand emergency department visits, and 157 thousand inpatienthospitalizations.
• The majority of this health care utilization is by women, adults aged 40–64 years,and white, non-Hispanic adults. However, emergency departments have relativelymore visits by men, adults aged 20–39, and black, non-Hispanic adults.
• An analgesic drug was prescribed, administered, or continued at 71% of thephysician office visits with a primary diagnosis of fibromyalgia; 29% of officevisits had an antidepressant drug mention and 14% had an anxiolytic, sedative,or hypnotic drug mention.

Shingles
• Annually, adults have about 1.2 million physician office visits and 33 thousandinpatient hospitalizations with a diagnosis of shingles.
• The majority of health care visits are by women, adults aged 40–64 years, andwhite, non-Hispanic adults, with the exception of inpatient hospitalizationswhere over two-thirds are by adults aged 65 and older.
• At over half of all physician office visits with a primary diagnosis of shingles,an analgesic drug was prescribed, administered, or continued.
Injury
• There are ~34 million injury-related physician office visits because of bodysprains or strains, fractures, contusions, dislocations, crushes, or burns.
• Sprains and strains are most common (~17 million office visits), followed byfractures (8 million) and contusions (7 million).
• Analgesic drugs are prescribed, administered, or continued at 40% of injury-related physician office visits.
The burden of pain among adults in the United States
5


The burden of pain among adults in the United States
7
Pain at selected body sites
51% of all adults aged 20 years and older report feeling pain at a joint, theirback, neck, head, mouth, or face/jaw. Joint pain and low back pain are mostprevalent (28% and 26%, respectively).
Percent of adult populationSource: NHIS 2007
The Any pain category includes all other pain sites listed. Joint pain prevalence is in the past month; Dental pain is in the past year;all other body sites are in the past 3 months.
Bars with the same values may have different lengths because of rounding.
Any pain
Joint
Low back
Neck
Headache/migraine
Dental
Face/jaw
Prevalence of pain at selected body sites among adults
4
12
12
13
26
28
51
0 10 20 30 40 50 60


Joint pain28% of adults report joint pain, aching, or stiffness in the past month. Joint painincreases with age: 15% among adults aged 20–39 years; 34% among adults aged40–64 years; 44% among those aged 65 and older. Nearly 50% of older women(47%) and older black, non-Hispanic adults (47%) report joint pain.
The burden of pain among adults in the United States
9
Age, years
Total
20–39
40–64
65+
Prevalence of joint pain in the past month among adults, by gender and age
Percent of adultsSource: NHIS 2007
Bars with the same values may have different lengths because of rounding.
0 10 20 30 40 50
2826
31
151515
3431
37
4439
47
TotalMenWomen
Age, years
Total
20–39
40–64
65+
Prevalence of joint pain in the past month among adults, by race/ethnicity and age
Percent of adultsSource: NHIS 2007
White, non-HispanicBlack, non-HispanicHispanic
1712
9
3534
27
4547
38
0 10 20 30 40 50
3126
18

One in 4 men and 1 in 3 women with joint pain report having severe pain.
Black, non-Hispanic (44%), and Hispanic (41%) adults with joint pain reportmore severe pain than white, non-Hispanic adults who have joint pain (26%).
The burden of pain among adults in the United States
10
Percent of adults with joint painSource: NHIS 2006
Bars with the same values may have different lengths because of rounding.
Total
Men
Women
White,non-Hispanic
Black,non-Hispanic
Hispanic
Prevalence of severe pain among adults with joint pain
12
33
26
29
0 10 20 30 40 50
41
44
26

Weight is associated with joint pain—22% among normal weight adults; 28%among overweight adults; 37% among obese adults.
The burden of pain among adults in the United States
11
Total
Men
Women
Prevalence of joint pain in the past month among adults, by body weight and gender
Percent of adultsSource: NHIS 2007
Bars with the same values may have different lengths because of rounding.
0 10 20 30 40 50
2228
37
2226
31
2331
43
NormalOverweightObese
White,non-Hispanic
Black,non-Hispanic
Hispanic
Prevalence of joint pain in the past month among adults, by body weight and race/ethnicity
Percent of adultsSource: NHIS 2007
0 10 20 30 40 50
NormalOverweightObese
2531
42
1925
33
1319
24

The knee is the most common site of joint pain regardless of age or gender. This isfollowed by the shoulder for men aged 40 years and older.
Prevalence of joint pain at specific body sites among men aged 20 years and olderby age groups
The burden of pain among adults in the United States
12
PercentSource: NHIS 2007
ShoulderTotal 820–39 440–64 1065+ 11
ElbowTotal 420–39 240–64 665+ 4
WristTotal 420–39 240–64 565+ 6
HipTotal 420–39 140–64 565+ 9
AnkleTotal 520–39 440–64 665+ 6
KneeTotal 1520–39 840–64 1865+ 23
FingersTotal 520–39 240–64 665+ 9
ToesTotal 220–39 140–64 365+ 3

After the knee, the fingers are the most common site of joint pain for women aged65 years and older.
The burden of pain among adults in the United States
13
Prevalence of joint pain at specific body sites among women aged 20 years and olderby age groups
PercentSource: NHIS 2007
ShoulderTotal 920–39 340–64 1165+ 15
ElbowTotal 420–39 240–64 665+ 6
WristTotal 620–39 340–64 865+ 8
HipTotal 920–39 340–64 1165+ 14
AnkleTotal 720–39 440–64 865+ 8
KneeTotal 1820–39 940–64 2265+ 29
FingersTotal 920–39 240–64 1165+ 17
ToesTotal 320–39 140–64 465+ 6

Joint pain and health statusJoint pain is associated with substantial activity limitation, work disability, andreduced quality of life. Adults with joint pain are more than 3 times as likely toreport fair/poor health than those with no joint pain (27% vs. 8%, respectively),20 times more likely to report arthritis-attributable activity limitations, 4 timesas likely to report being unable to work, twice as likely to report reduced sleep(<6 hours per day), and 3 times more likely to report psychological distress.
The burden of pain among adults in the United States
14
Fair/poor health
Limitation of activity due toarthritis or joint symptoms
Unable to work
<6 hours of sleep
Psychological distress
Prevalence of selected health status indicators among adults with or without joint pain
Percent of adultsSource: NHIS 2007
Bars with the same values may have different lengths because of rounding.
No joint painJoint pain
0 10 20 30 40
8
27
2
39
4
16
6
12
2
6
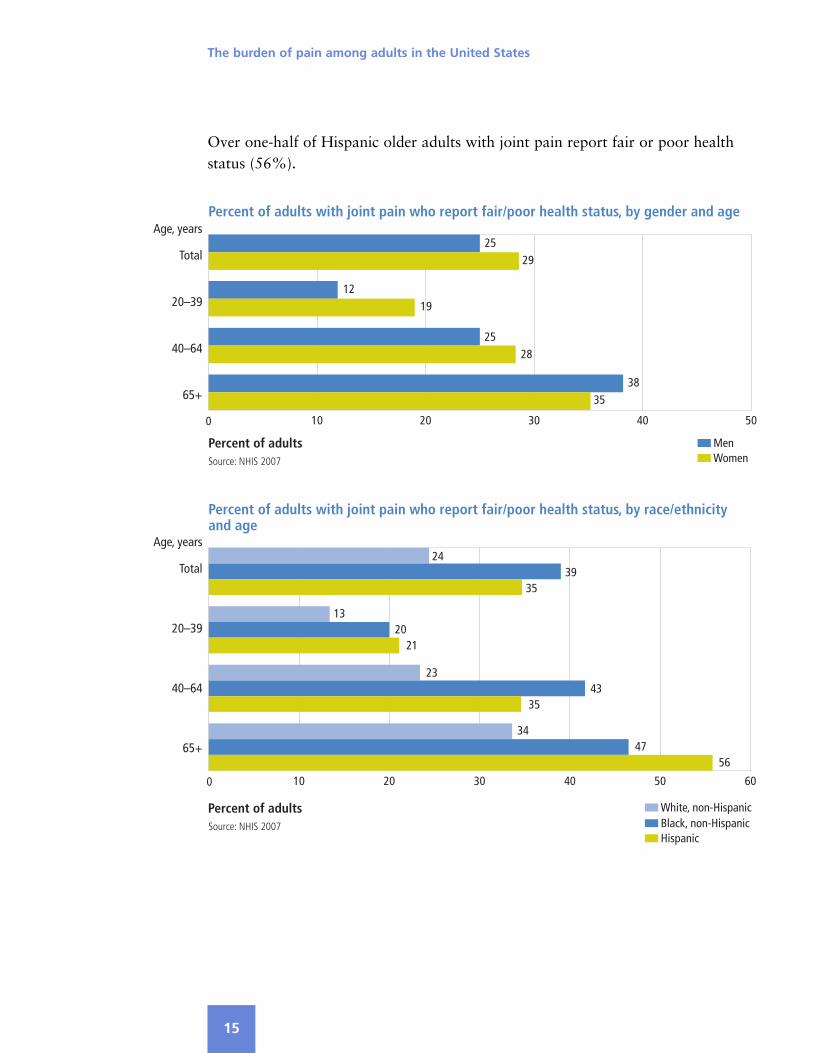
Over one-half of Hispanic older adults with joint pain report fair or poor healthstatus (56%).
The burden of pain among adults in the United States
15
Age, years
Total
20–39
40–64
65+
Percent of adults with joint pain who report fair/poor health status, by race/ethnicityand age
Percent of adultsSource: NHIS 2007
White, non-HispanicBlack, non-HispanicHispanic
0 10 20 30 40 50 60
2439
35
1320
21
2343
35
3447
56
Age, years
Total
20–39
40–64
65+
Percent of adults with joint pain who report fair/poor health status, by gender and age
Percent of adultsSource: NHIS 2007
0 10 20 30 40 50
MenWomen
2529
1219
2528
3835

The burden of pain among adults in the United States
16
About half of all older adults with joint pain report arthritis-attributable activitylimitations.
Age, years
Total
20–39
40–64
65+
Percent of adults with joint pain who report activity limitations because of arthritis orjoint symptoms, by gender and age
Percent of adultsSource: NHIS 2007
0 10 20 30 40 50 60
MenWomen
3642
1927
3841
4852
Age, years
Total
20–39
40–64
65+
Percent of adults with joint pain who report activity limitations because of arthritis orjoint symptoms, by race/ethnicity and age
Percent of adultsSource: NHIS 2007
White, non-HispanicBlack, non-HispanicHispanic
0 10 20 30 40 50 60
3945
37
2423
20
3848
39
5058
55

The burden of pain among adults in the United States
17
More younger adults with joint pain report reduced daily sleep hours (11–16%)than older adults with joint pain (6–9%).
Age, years
Total
20–39
40–64
65+
Percent of adults with joint pain who report less than 6 usual hours of sleep, byrace/ethnicity and age
Percent of adultsSource: NHIS 2007
Bars with the same values may have different lengths because of rounding.
White, non-HispanicBlack, non-HispanicHispanic
0 5 10 15 20 25
1018
16
1221
15
1219
18
71212
Age, years
Total
20–39
40–64
65+
Percent of adults with joint pain who report less than 6 usual hours of sleep, by genderand age
Percent of adultsSource: NHIS 2007
Bars with the same values may have different lengths because of rounding.
0 2 4 6 8 10 12 14 16 18
MenWomen
1212
1116
1412
69

The burden of pain among adults in the United States
18
Nearly one-third of black, non-Hispanic adults aged 40–64 years with joint painreport being unable to work.
0 5 10 15 20 25 30 35
Age, years
Total
20–39
40–64
Percent of adults with joint pain who report being unable to work, by race/ethnicityand age
Percent of adultsSource: NHIS 2007
Bars with the same values may have different lengths because of rounding.
White, non-HispanicBlack, non-HispanicHispanic
1526
17
1012
10
1631
20
Age, years
Total
20–39
40–64
Percent of adults with joint pain who report being unable to work, by gender and age
MenWomen
0 2 4 6 8 10 12 14 16 18 20Percent of adultsSource: NHIS 2007
Bars with the same values may have different lengths because of rounding.
15
16
9
11
18
18

The burden of pain among adults in the United States
19
More young women with joint pain experience psychological distress than youngmen with joint pain (9% vs. 4%, respectively).
Age, years
Total
20–39
40–64
65+
Percent of adults with joint pain who report psychological distress, by gender and age
Percent of adultsSource: NHIS 2007
Bars with the same values may have different lengths because of rounding.
0 1 2 3 4 5 6 7 8 9 10
MenWomen
47
49
58
24
Age, years
Total
20–39
40–64
65+
Percent of adults with joint pain who report psychological distress, by race/ethnicityand age
Percent of adultsSource: NHIS 2007
Bars with the same values may have different lengths because of rounding.
White, non-HispanicBlack, non-HispanicHispanic
0 2 4 6 8 10 12 14
56
10
76
8
68
12
33
8

Joint pain and health care utilizationIn 2006, adults made over 11 million physician office visits with a diagnosis ofjoint pain, over 1.1 million outpatient hospital visits, about 1.5 million emergencydepartment visits, and 177 thousand inpatient hospitalizations.
The majority of health care visits for joint pain were by women, adults aged40–64 years, and white, non-Hispanic adults.
The burden of pain among adults in the United States
20
Percent of physician office visits among adults with a diagnosis of joint pain
Source: NAMCS 2006
20–3940–6465+
White, non-HispanicBlack, non-HispanicHispanic
MenWomen
Other0% 20% 40% 60% 80% 100%
25 48 27
67 13 14 6
42 58
Percent of outpatient hospital visits among adults with a diagnosis of joint pain
Source: NHAMCS 2006
Totals may not add to 100% because of rounding.
20–3940–6465+
White, non-HispanicBlack, non-HispanicHispanic
MenWomen
0% 20% 40% 60% 80% 100%
19 54 26
73 17 10
42 58

The burden of pain among adults in the United States
21
Percent of emergency department visits among adults with a diagnosis of joint pain
Source: NHAMCS 2006
Totals may not add to 100% because of rounding.
20–3940–6465+
White, non-HispanicBlack, non-HispanicHispanic
MenWomen
Other0% 20% 40% 60% 80% 100%
37 43 20
58 26 12 3
43 57
Percent of inpatient hospitalizations among adults with a diagnosis of joint pain
Source: NHDS 2006
Totals may not add to 100% because of rounding.
20–3940–6465+
MenWomen
0% 20% 40% 60% 80% 100%
15 34 50
37 63

The burden of pain among adults in the United States
22
Joint pain and analgesic drug use24% of adults with joint pain report prescription analgesic drug use in the pastmonth.
22% of adults with joint pain report using a non-prescription analgesic or certainnon-narcotic prescription analgesics nearly every day for a month or longer.
Age, years
Total
20–39
40–64
65+
Prevalence of prescription analgesic drug use in the past month among adults withjoint pain in the past year, by gender and age
Percent of adults with joint painSource: NHANES 2003–2004
*Estimate is unreliable due to small sample size.
Bars with the same values may have different lengths because of rounding.
TotalMenWomen
0 5 10 15 20 25 30 35
2419
28
1610*
22
2521
29
3129
33

The burden of pain among adults in the United States
23
Age, years
Total
20–39
40–64
65+
Prevalence of frequent monthly use of non-prescription and select prescriptionanalgesics among adults with joint pain in the past year, by gender and age
Percent of adults with joint painSource: NHANES 2003–2004
*Estimate is unreliable due to small sample size.
TotalMenWomen
0 5 10 15 20 25 30 35 40 45
2219
24
107*
12*
2220
23
3840
37


Low back painOver one-quarter of adults report low back pain in the past 3 months (26%). Onein 3 older women and 1 in 4 older men report low back pain.
The burden of pain among adults in the United States
25
Age, years
Total
20–39
40–64
65+
Prevalence of low back pain in the past 3 months among adults, by gender and age
Percent of adultsSource: NHIS 2007
Bars with the same values may have different lengths because of rounding.
TotalMenWomen
0 5 10 15 20 25 30 35
2624
28
2220
24
2827
29
3025
33
Age, years
Total
20–39
40–64
65+
Prevalence of low back pain in the past 3 months among adults, by race/ethnicity and age
Percent of adultsSource: NHIS 2007
Bars with the same values may have different lengths because of rounding.
White, non-HispanicBlack, non-HispanicHispanic
0 5 10 15 20 25 30 35
282323
2518
19
2827
28
302727

The burden of pain among adults in the United States
26
Low back pain increases as body weight increases—about 1 in 5 normal weightadults, 1 in 4 overweight adults, and 1 in 3 obese adults report low back pain.
Total
Men
Women
Prevalence of low back pain in the past 3 months among adults, by body weight andgender
Percent of adultsSource: NHIS 2007
0 10 20 30 40
2225
33
2124
28
2327
38
NormalOverweightObese
Total
Men
Women
Prevalence of low back pain in the past 3 months among adults, by body weight andrace/ethnicity
Percent of adultsSource: NHIS 2007
Bars with the same values may have different lengths because of rounding.
0 10 20 30 40
2428
34
2020
29
2021
30
NormalOverweightObese

Low back pain and health statusAdults with low back pain are nearly 3 times as likely to report fair or poorhealth than those without back pain (26% vs. 9%, respectively), more than 4times as likely to report arthritis-attributable activity limitations, 4 times as likelyto be unable to work, twice as likely to report reduced sleep (<6 hours per day),and 7 times more likely to report psychological distress.
The burden of pain among adults in the United States
27
Fair/poor health
Limitation of activity due toarthritis or joint symptoms
Unable to work
<6 hours of sleep
Psychological distress
Prevalence of selected health status indicators among adults with or without low back pain
Percent of adultsSource: NHIS 2007
No low back painLow back pain
0 10 20 30
9
26
7
29
4
15
6
13
1
7

Self-rated fair or poor health is reported by about one-half of black, non-Hispanicadults aged 40 years and older and 58% of Hispanic adults aged 65 years andolder with low back pain.
The burden of pain among adults in the United States
28
Age, years
Total
20–39
40–64
65+
Percent of adults with low back pain who report fair/poor health status, by gender andage
Percent of adultsSource: NHIS 2007
0 10 20 30 40 50
MenWomen
2527
915
2931
4338
Age, years
Total
20–39
40–64
65+
Percent of adults with low back pain who report fair/poor health status, byrace/ethnicity and age
Percent of adultsSource: NHIS 2007
White, non-HispanicBlack, non-HispanicHispanic
0 10 20 30 40 50 60
2439
27
1020
13
2649
34
3851
58

Arthritis-attributable activity limitations are reported by 50% of older women andabout 60% of older black, non-Hispanic, and Hispanic adults with low back pain.
The burden of pain among adults in the United States
29
Age, years
Total
20–39
40–64
65+
Percent of adults with low back pain who report activity limitations because of arthritisor joint symptoms, by gender and age
Percent of adultsSource: NHIS 2007
0 10 20 30 40 50 60
MenWomen
26
32
31
38
44
50
9
12
Age, years
Total
20–39
40–64
65+
Percent of adults with low back pain who report activity limitations because of arthritisor joint symptoms, by race/ethnicity and age
Percent of adultsSource: NHIS 2007
White, non-HispanicBlack, non-HispanicHispanic
0 10 20 30 40 50 60
3034
23
129
5
3444
32
4657
60

Reduced daily sleep hours are reported by 1 in 5 black, non-Hispanic adults withlow back pain, 1 in 7 Hispanic adults, and 1 in 9 white, non-Hispanic adults.
The burden of pain among adults in the United States
30
Age, years
Total
20–39
40–64
65+
Percent of adults with low back pain who report less than 6 usual hours of sleep, bygender and age
Percent of adultsSource: NHIS 2007
0 2 4 6 8 10 12 14 16 18
MenWomen
1213
1013
1615
69
Age, years
Total
20–39
40–64
65+
Percent of adults with low back pain who report less than 6 usual hours of sleep, byrace/ethnicity and age
Percent of adultsSource: NHIS 2007
Bars with the same values may have different lengths because of rounding.
White, non-HispanicBlack, non-HispanicHispanic
0 5 10 15 20 25
1120
14
1118
11
1322
18
713
12

The burden of pain among adults in the United States
31
About 1 in 5 adults aged 40–64 years with low back pain report being unable towork regardless of gender or race-ethnicity. The exception is black, non-Hispanicadults aged 40–64 years, where over one-third of those with low back pain reportbeing unable to work (35%).
Age, years
Total
20–39
40–64
Percent of adults with low back pain who report being unable to work, by gender and age
Percent of adultsSource: NHIS 2007
MenWomen
0 5 10 15 20 25
1416
58
1922
Age, years
Total
20–39
40–64
Percent of adults with low back pain who report being unable to work, by race/ethnicityand age
Percent of adultsSource: NHIS 2007
Bars with the same values may have different lengths because of rounding.
White, non-HispanicBlack, non-HispanicHispanic
0 5 10 15 20 25 30 35 40
1425
12
1935
19
710
5

Older Hispanic adults with low back pain are about 3 times more likely to reportpsychological distress (12%) than older white, non-Hispanic (4%) and black,non-Hispanic (5%) adults with low back pain.
The burden of pain among adults in the United States
32
Age, years
Total
20–39
40–64
65+
Percent of adults with low back pain who report psychological distress, by gender and age
Percent of adultsSource: NHIS 2007
Bars with the same values may have different lengths because of rounding.
0 2 4 6 8 10 12
MenWomen
58
47
610
35
Age, years
Total
20–39
40–64
65+
Percent of adults with low back pain who report psychological distress, by race/ethnicityand age
Percent of adultsSource: NHIS 2007
Bars with the same values may have different lengths because of rounding.
White, non-HispanicBlack, non-HispanicHispanic
0 2 4 6 8 10 12 14
688
66
5
711
11
45
12

Low back pain and health care utilizationIn 2006, adults made about 7 million physician office visits with a diagnosis ofback pain, 762 thousand outpatient hospital visits, over 1.5 million emergencydepartment visits, and 227 thousand hospitalizations.
The majority of health care visits for back pain were by women, adults aged40–64 years, and white, non-Hispanic adults.
The burden of pain among adults in the United States
33
Percent of physician office visits among adults with a diagnosis of low back pain
Source: NAMCS 2006
Totals may not add to 100% because of rounding.
20–3940–6465+
White, non-HispanicBlack, non-HispanicHispanic
MenWomen
Other0% 20% 40% 60% 80% 100%
22 59 19
76 15 6 2
45 55
Percent of outpatient hospital visits among adults with a diagnosis of low back pain
Source: NHAMCS 2006
Totals may not add to 100% because of rounding.
20–3940–6465+
White, non-HispanicBlack, non-HispanicHispanic
MenWomen
Other0% 20% 40% 60% 80% 100%
29 58 14
71 18 8
39 61
2

The burden of pain among adults in the United States
34
Percent of emergency department visits among adults with a diagnosis of low back pain
Source: NHAMCS 2006
20–3940–6465+
White, non-HispanicBlack, non-HispanicHispanic
MenWomen
Other0% 20% 40% 60% 80% 100%
41 48 10
66 23 8 3
49 51
Percent of inpatient hospitalizations among adults with a diagnosis of low back pain
Source: NHDS 2006
20–3940–6465+
MenWomen
0% 20% 40% 60% 80% 100%
21 45 34
38 62

Low back pain and analgesic drug use24% of adults with low back pain report prescription analgesic drug use in thepast month.
18% of adults with low back pain report using a non-prescription analgesic orcertain non-narcotic prescription analgesics nearly every day for a month or longer.
The burden of pain among adults in the United States
35
Age, years
Total
20–39
40–64
65+
Prevalence of prescription analgesic drug use in the past month among adults withlow back pain in the past 3 months, by gender and age
Percent of adults with low back painSource: NHANES 2003–2004; *Estimate is unreliable due to small sample size.
TotalMenWomen
0 5 10 15 20 25 30 35
2421
27
1510*
19
2927
30
3230
32
Age, years
Total
20–39
40–64
65+
Prevalence of frequent monthly use of nonprescription and select prescription analgesicsamong adults with low back pain in the past 3 months, by gender and age
Percent of adults with low back painSource: NHANES 2003–2004; *Estimate is unreliable due to small sample size.
Bars with the same values may have different lengths because of rounding.
TotalMenWomen
0 5 10 15 20 25 30 35 40 45
1818
19
86*
9*
1921
18
4141
40


Neck pain13% of adults report neck pain in the past 3 months. Neck pain is reported moreoften by women than men (15% vs. 11%, respectively) and white, non-Hispanicadults (14%) than black, non-Hispanic adults (10%) or Hispanic adults (11%).
The burden of pain among adults in the United States
37
Age, years
Total
20–39
40–64
65+
Prevalence of neck pain in the past 3 months among adults, by gender and age
Percent of adultsSource: NHIS 2007
Bars with the same values may have different lengths because of rounding.
TotalMenWomen
0 5 10 15 20 25
1311
15
108
12
1613
18
1412
16
Age, years
Total
20–39
40–64
65+
Prevalence of neck pain in the past 3 months among adults, by race/ethnicity and age
Percent of adultsSource: NHIS 2007
Bars with the same values may have different lengths because of rounding.
White, non-HispanicBlack, non-HispanicHispanic
0 2 4 6 8 10 12 14 16 18 20
1410
11
126
7
1613
16
1412
17

The burden of pain among adults in the United States
38
Neck pain and health statusAdults with neck pain are more than twice as likely to report fair or poor healththan those without neck pain (29% vs. 11%, respectively), nearly 4 times as likelyto report arthritis-attributable activity limitations, nearly 4 times as likely toreport being unable to work, more than twice as likely to report reduced sleep(<6 hours per day), and 4 times more likely to report psychological distress.
Fair/poor health
Limitation of activity due toarthritis or joint symptoms
Unable to work
<6 hours of sleep
Psychological distress
Prevalence of selected health status indicators among adults with or without neck pain
Percent of adultsSource: NHIS 2007
No neck painNeck pain
0 10 20 30 40
11
29
9
34
5
18
6
14
2
8

The burden of pain among adults in the United States
39
Self-rated fair/poor health is reported by 55% of black, non-Hispanic adults aged40–64 years and 60% of Hispanic adults aged 65 years and older with neck pain.
Age, years
Total
20–39
40–64
65+
Percent of adults with neck pain who report fair/poor health status, by gender and age
Percent of adultsSource: NHIS 2007
0 10 20 30 40 50
MenWomen
2930
1017
3533
4339
Age, years
Total
20–39
40–64
65+
Percent of adults with neck pain who report fair/poor health status, by race/ethnicityand age
Percent of adultsSource: NHIS 2007
White, non-HispanicBlack, non-HispanicHispanic
0 10 20 30 40 50 60 70
2648
36
1228
14
3055
45
3759
60

The burden of pain among adults in the United States
40
Arthritis-attributable activity limitations are reported by nearly two-thirds ofolder black, non-Hispanic and Hispanic adults (64%), and one-half of olderwhite, non-Hispanic adults (48%) with neck pain.
Age, years
Total
20–39
40–64
65+
Percent of adults with neck pain who report activity limitations because of arthritis orjoint symptoms, by gender and age
Percent of adultsSource: NHIS 2007
Bars with the same values may have different lengths because of rounding.
0 10 20 30 40 50 60
MenWomen
3336
4040
4654
1116
Age, years
Total
20–39
40–64
65+
Percent of adults with neck pain who report activity limitations because of arthritis orjoint symptoms, by race/ethnicity and age
Percent of adultsSource: NHIS 2007
Bars with the same values may have different lengths because of rounding.
White, non-HispanicBlack, non-HispanicHispanic
0 10 20 30 40 50 60 70
3446
35
1515
11
3956
44
4864
64

The burden of pain among adults in the United States
41
Reduced daily sleep hours are reported by 1 in 4 black, non-Hispanic adults withneck pain, 1 in 5 Hispanic adults, and 1 in 8 white, non-Hispanic adults withneck pain.
Age, years
Total
20–39
40–64
65+
Percent of adults with neck pain who report less than 6 usual hours of sleep, by genderand age
Percent of adultsSource: NHIS 2007
Bars with the same values may have different lengths because of rounding.
0 2 4 6 8 10 12 14 16 18
MenWomen
1415
1214
1717
611
Age, years
Total
20–39
40–64
65+
Percent of adults with neck pain who report less than 6 usual hours of sleep, byrace/ethnicity and age
Percent of adultsSource: NHIS 2007
Bars with the same values may have different lengths because of rounding.
White, non-HispanicBlack, non-HispanicHispanic
0 5 10 15 20 25 30
1325
19
1224
16
1527
21
817
15

The burden of pain among adults in the United States
42
Nearly one-quarter of adults aged 40–64 years with neck pain and one-third ofblack, non-Hispanic adults with neck pain report being unable to work.
Age, years
Total
20–39
40–64
Percent of adults with neck pain who report being unable to work, by gender and age
Percent of adultsSource: NHIS 2007
Bars with the same values may have different lengths because of rounding.
MenWomen
0 5 10 15 20 25 30
18
18
6
8
24
24
0 5 10 15 20 25 30 35 40 45
Age, years
Total
20–39
40–64
Percent of adults with neck pain who report being unable to work, by race/ethnicityand age
Percent of adultsSource: NHIS 2007
White, non-HispanicBlack, non-HispanicHispanic
1733
17
2241
25
715
5

More women with neck pain report psychological distress than men (10% vs.5%, respectively).
More black, non-Hispanic adults (13%) and Hispanic adults (12%) with neckpain report psychological distress than white, non-Hispanic adults (7%).
The burden of pain among adults in the United States
43
Age, years
Total
20–39
40–64
65+
Percent of adults with neck pain who report psychological distress, by gender and age
Percent of adultsSource: NHIS 2007
0 2 4 6 8 10 12
MenWomen
510
49
712
26
Age, years
Total
20–39
40–64
65+
Percent of adults with neck pain who report psychological distress, by race/ethnicityand age
Percent of adultsSource: NHIS 2007
Bars with the same values may have different lengths because of rounding.
White, non-HispanicBlack, non-HispanicHispanic
0 2 4 6 8 10 12 14 16 18
713
12
610
7
817
16
45
12

The burden of pain among adults in the United States
44
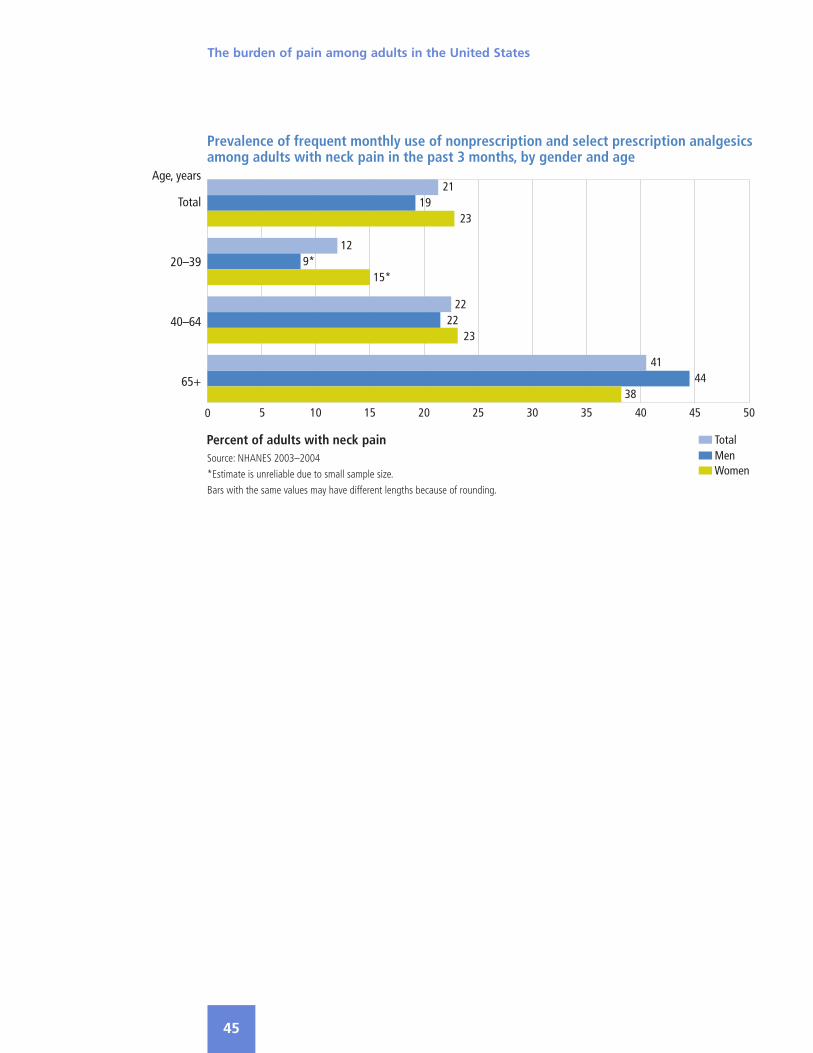
Neck pain and analgesic drug use27% of adults with neck pain report prescription analgesic drug use in the past month.
21% of adults with neck pain report using a non-prescription analgesic or certainnon-narcotic prescription analgesics nearly every day for a month or longer.
Age, years
Total
20–39
40–64
65+
Prevalence of prescription analgesic drug use in the past month among adults withneck pain in the past 3 months, by gender and age
Percent of adults with neck painSource: NHANES 2003–2004
*Estimate is unreliable due to small sample size.
TotalMenWomen
0 5 10 15 20 25 30 35 40
2722
31
179*
24
3533
36
2825
30
The burden of pain among adults in the United States
45
Age, years
Total
20–39
40–64
65+
Prevalence of frequent monthly use of nonprescription and select prescription analgesicsamong adults with neck pain in the past 3 months, by gender and age
Percent of adults with neck painSource: NHANES 2003–2004
*Estimate is unreliable due to small sample size.
Bars with the same values may have different lengths because of rounding.
TotalMenWomen
0 5 10 15 20 25 30 35 40 45 50
2119
23
129*
15*
2222
23
4144
38


Severe headaches or migrainesOne in 8 adults report severe headaches or migraines in the past 3 months. Womenare more than twice as likely as men to report severe headaches or migraines (17%vs. 7%, respectively). Older adults are less likely to report severe headaches ormigraines (5%) than adults aged 20–39 (15%) and 40–64 (13%) years.
The burden of pain among adults in the United States
47
Age, years
Total
20–39
40–64
65+
Prevalence of severe headaches or migraines in the past 3 months among adults, bygender and age
Percent of adultsSource: NHIS 2007
TotalMenWomen
0 5 10 15 20 25
127
17
158
22
138
18
53
6
Age, years
Total
20–39
40–64
65+
Prevalence of severe headaches or migraines in the past 3 months, by race/ethnicityand age
Percent of adultsSource: NHIS 2007
Bars with the same values may have different lengths because of rounding.
White, non-HispanicBlack, non-HispanicHispanic
0 2 4 6 8 10 12 14 16 18
1212
12
1613
10
1312
14
47
8

The burden of pain among adults in the United States
48
Severe headaches or migraines and health statusAdults with severe headaches or migraines are more than twice as likely to reportfair or poor health than those without headaches or migraines (25% vs. 12%,respectively), more than 3 times as likely to be unable to work, about 3 times aslikely to report reduced sleep (<6 hours per day), and 5 times as likely to reportpsychological distress.
Fair/poor health
Unable to work
<6 hours of sleep
Psychological distress
Percent of selected health status indicators among adults with or without severeheadaches or migraines
Percent of adultsSource: NHIS 2007
No headache/migraineHeadache/migraine
0 10 20 30
12
25
5
16
6
16
2
10

Self-rated fair or poor health is reported by one-third of adults aged 40–64 yearsand 49% of older adults with severe headaches or migraines. 60% of older black,non-Hispanic adults and 69% of older Hispanic adults with severe headaches ormigraines report fair or poor health status.
The burden of pain among adults in the United States
49
Age, years
Total
20–39
40–64
65+
Percent of adults with severe headaches or migraines who report fair or poor healthstatus, by gender and age
Percent of adultsSource: NHIS 2007
0 10 20 30 40 50 60
MenWomen
25
26
8
17
36
32
48
49
Age, years
Total
20–39
40–64
65+
Percent of adults with severe headaches or migraines who report fair or poor healthstatus, by race/ethnicity and age
Percent of adultsSource: NHIS 2007
White, non-HispanicBlack, non-HispanicHispanic
0 10 20 30 40 50 60 70 80
2335
32
1222
17
3045
44
4460
69

The burden of pain among adults in the United States
50
Men aged 65 years and older with severe headaches or migraines are twice aslikely to report reduced daily sleep hours than women aged 65 years and older(14% vs. 7%, respectively).
Age, years
Total
20–39
40–64
65+
Percent of adults with severe headaches or migraines who report less than 6 usual hoursof sleep, by gender and age
Percent of adultsSource: NHIS 2007
0 5 10 15 20 25
MenWomen
17
15
1612
1918
147
Age, years
Total
20–39
40–64
65+
Percent of adults with severe headaches or migraines who report less than 6 usual hoursof sleep, by race/ethnicity and age
Percent of adultsSource: NHIS 2007
White, non-HispanicBlack, non-HispanicHispanic
0 5 10 15 20 25 30
1521
16
1418
11
1726
22
810
14

The burden of pain among adults in the United States
51
One in 3 black, non-Hispanic adults aged 40–64 years with severe headaches ormigraines, 1 in 4 Hispanic adults, and 1 in 5 white, non-Hispanic adults reportbeing unable to work.
Age, years
Total
20–39
40–64
Percent of adults with severe headaches or migraines who report being unable to work,by gender and age
Percent of adultsSource: NHIS 2007
MenWomen
0 5 10 15 20 25 30
1815
68
2721
Age, years
Total
20–39
40–64
Percent of adults with severe headaches or migraines who report being unable to work,by race/ethnicity and age
Percent of adultsSource: NHIS 2007
White, non-HispanicBlack, non-HispanicHispanic
0 5 10 15 20 25 30 35 40
1522
16
2134
26
810
6

The burden of pain among adults in the United States
52
Older women with severe headaches or migraines are 55% more likely to reportpsychological distress (14%) than older men (9%). Nearly one-third of Hispanicolder adults with severe headaches or migraines report psychological distresscompared to 19% of older black, non-Hispanic adults and 9% of older white,non-Hispanic adults.
Age, years
Total
20–39
40–64
65+
Percent of adults with severe headaches or migraines who report psychological distress,by gender and age
Percent of adultsSource: NHIS 2007
Bars with the same values may have different lengths because of rounding.
0 2 4 6 8 10 12 14 16
MenWomen
1110
109
1211
914
Age, years
Total
20–39
40–64
65+
Percent of adults with severe headaches or migraines who report psychological distress,by race/ethnicity and age
Percent of adultsSource: NHIS 2007
Bars with the same values may have different lengths because of rounding.
White, non-HispanicBlack, non-HispanicHispanic
0 5 10 15 20 25 30 35
1013
14
109
7
1016
18
919
30

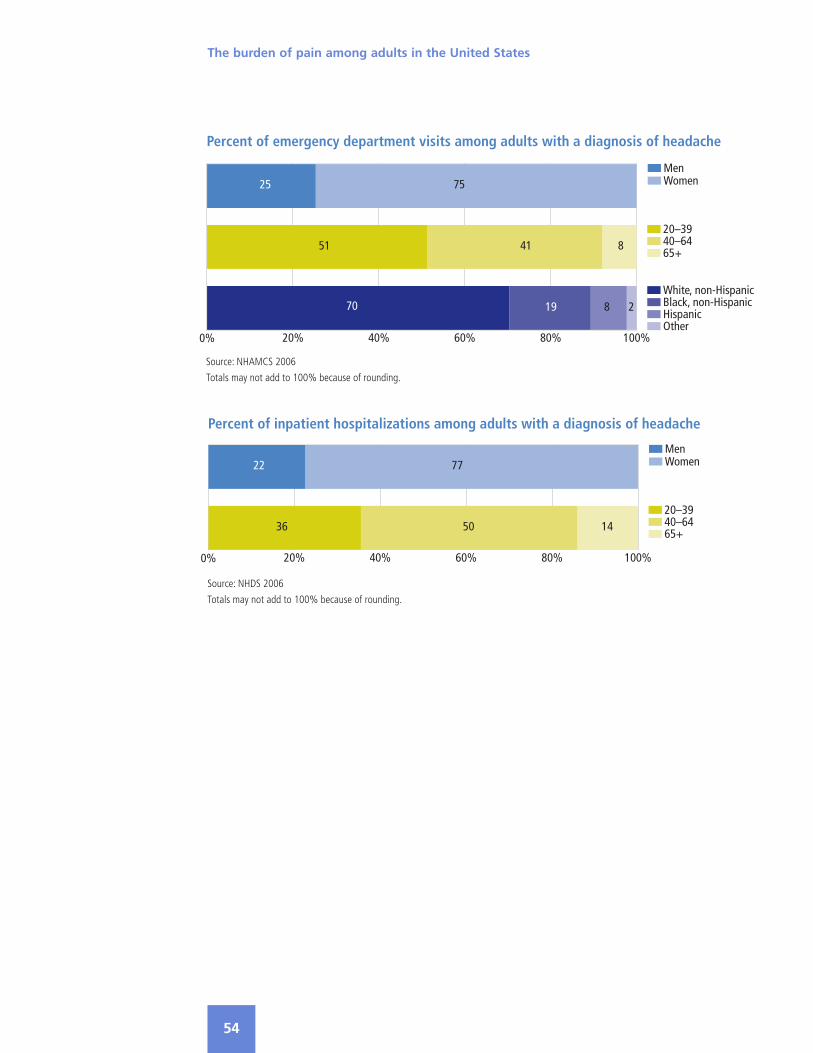
Severe headaches or migraines and health careutilizationIn 2006, adults made nearly 11 million physician visits with a headache diagnosis,over 1 million outpatient hospital visits, 3.3 million emergency department visits,and 445 thousand inpatient hospitalizations.
The majority of health care visits for headaches were by women and white, non-Hispanic adults. Physician office visits and inpatient hospitalizations were mostlymade by adults aged 40–64 years, whereas a larger proportion of outpatienthospital and emergency department visits were by those aged 20–39 years.
The burden of pain among adults in the United States
53
Percent of outpatient hospital visits among adults with a diagnosis of headache
Source: NHAMCS 2006
Totals may not add to 100% because of rounding.
20–3940–6465+
White, non-HispanicBlack, non-HispanicHispanic
MenWomen
Other0% 20% 40% 60% 80% 100%
46 44 10
66 16 14
30 70
3
Percent of physician office visits among adults with a diagnosis of headache
Source: NAMCS 2006
Totals may not add to 100% because of rounding.
20–3940–6465+
White, non-HispanicBlack, non-HispanicHispanic
MenWomen
Other0% 20% 40% 60% 80% 100%
34 54 11
76 10 12 3
26 74
The burden of pain among adults in the United States
54
Percent of emergency department visits among adults with a diagnosis of headache
Source: NHAMCS 2006
Totals may not add to 100% because of rounding.
20–3940–6465+
White, non-HispanicBlack, non-HispanicHispanic
MenWomen
Other0% 20% 40% 60% 80% 100%
51 41 8
70 19 8 2
25 75
Percent of inpatient hospitalizations among adults with a diagnosis of headache
Source: NHDS 2006
Totals may not add to 100% because of rounding.
20–3940–6465+
MenWomen
0% 20% 40% 60% 80% 100%
36 50 14
22 77

Severe headaches/migraines and analgesic drug use23% of adults with severe headaches/migraines report prescription analgesic druguse in the past month.
15% of adults with severe headaches/migraines report using a non-prescription analgesicor certain non-narcotic prescription analgesics nearly every day for a month or longer.
The burden of pain among adults in the United States
55
Age, years
Total
20–39
40–64
65+
Prevalence of prescription analgesic drug use in the past month among adults withsevere headaches/migraines in the past 3 months, by gender and age
Percent of adults with severe headaches/migrainesSource: NHANES 2003–2004; *Estimate is unreliable due to small sample size.
TotalMenWomen
0 5 10 15 20 25 30 35 40
2321
24
1511*
16
3029
31
3528*
38*
Age, years
Total
20–39
40–64
65+
Prevalence of frequent monthly use of nonprescription and select prescription analgesicsamong adults with severe headaches/migraines in the past 3 months, by gender and age
Percent of adults with severe headaches/migrainesSource: NHANES 2003–2004; *Estimate is unreliable due to small sample size.
Bars with the same values may have different lengths because of rounding.
TotalMenWomen
0 5 10 15 20 25 30 35 40
151515
97*
10*
1820
17
3534*
35


Dental painOne in 8 adults experienced dental pain in the past year. Men and women have asimilar prevalence of dental pain regardless of age.
The burden of pain among adults in the United States
57
Age, years
Total
20–39
40–64
65+
Prevalence of dental pain in the past year among adults, by gender and age
Percent of adultsSource: NHIS 2007
Bars with the same values may have different lengths because of rounding.
TotalMenWomen
0 2 4 6 8 10 12 14 16
1211
13
1312
14
1312
13
88
9
Age, years
Total
20–39
40–64
65+
Prevalence of dental pain in the past year among adults, by race/ethnicity and age
Percent of adultsSource: NHIS 2007
Bars with the same values may have different lengths because of rounding.
White, non-HispanicBlack, non-HispanicHispanic
0 2 4 6 8 10 12 14 16
1212
10
1511
10
1313
11
81010

Face or jaw pain4% of adults report facial ache or pain in the jaw muscles or the joint in frontof the ear. Women are three times as likely as men to report this type of pain(6% vs. 2%, respectively).
The burden of pain among adults in the United States
58
Age, years
Total
20–39
40–64
65+
Prevalence of face or jaw pain in the past 3 months among adults, by gender and age
Percent of adultsSource: NHIS 2007
Bars with the same values may have different lengths because of rounding.
TotalMenWomen
0 1 2 3 4 5 6 7
42
6
42
6
53
6
31
4
Age, years
Total
20–39
40–64
65+
Prevalence of face or jaw pain in the past 3 months among adults, by race/ethnicityand age
Percent of adultsSource: NHIS 2007
*Estimate is unreliable due to small sample size.
Bars with the same values may have different lengths because of rounding.
White, non-HispanicBlack, non-HispanicHispanic
0 1 2 3 4 5 6
43
3
52
3
54
4
33*
4*

The burden of pain among adults in the United States
59
Adults with face or jaw pain are 2.5 times more likely to report fair or poorhealth status than adults with no pain (33% vs. 13%, respectively), nearly 4 timesas likely to be unable to work, more than twice as likely to have reduced sleep(<6 hours per day), and nearly 7 times as likely to report psychological distress.
Fair/poor health
Unable to work
<6 hours of sleep
Psychological distress
Prevalence of selected health status indicators among adults with or without face orjaw pain
Percent of adultsSource: NHIS 2007
No face/jaw painFace/jaw pain
0 10 20 30 40
13
33
6
22
7
17
2
13


Pain and selected diseases orconditions
Arthritis47.3 million adults have diagnosed arthritis (22%). Arthritic conditions such asosteoarthritis and rheumatoid arthritis are characterized by joint pain in theextremities.
The prevalence is higher among women (25%) than men (18%), older age groups(48%, 65 and older; 25%, 40–64 years) than younger age groups (6%, 20–39years), and white, non-Hispanic adults (25%) than black, non-Hispanic (19%)and Hispanic (12%) adults.
Prevalence of arthritis is greater among adults who are obese (30%) or overweight(21%) than adults who are normal weight (16%).
The burden of pain among adults in the United States
61
Age, years
Total
20–39
40–64
65+
Prevalence of arthritis among adults, by gender and age
Percent of adultsSource: NHIS 2007
TotalMenWomen
0 10 20 30 40 50 60
2218
25
65
7
2521
28
4841
52

The burden of pain among adults in the United States
62
Age, years
Total
20–39
40–64
65+
Prevalence of arthritis among adults, by race/ethnicity and age
Percent of adultsSource: NHIS 2007
White, non-HispanicBlack, non-HispanicHispanic
0 10 20 30 40 50 60
2519
12
74
3
2724
19
4952
38

The burden of pain among adults in the United States
63
White,non-Hispanic
Black,non-Hispanic
Hispanic
Prevalence of arthritis among adults, by body weight and race/ethnicity
Percent of adultsSource: NHIS 2007
Bars with the same values may have different lengths because of rounding.
0 10 20 30 40
1824
35
1218
26
912
15
NormalOverweightObese
Total
Men
Women
Prevalence of arthritis among adults, by body weight and gender
Percent of adultsSource: NHIS 2007
0 10 20 30 40
1621
30
1317
24
1826
36
NormalOverweightObese

The burden of pain among adults in the United States
64
Arthritis and health statusArthritis is a leading cause of disability and is associated with substantial activitylimitation, work disability and reduced quality of life. Adults with arthritis aremore than 3 times as likely to report fair or poor health than those withoutarthritis (31% vs. 9%, respectively), 11 times more likely to report arthritis-attributable activity limitations, 5 times more likely to report being unable towork, nearly twice as likely to report reduced hours of sleep (<6 hours per day),and 3 times as likely to report psychological distress.
Fair/poor health
Limitation of activity due toarthritis or joint symptoms
Unable to work
<6 hours of sleep
Psychological distress
Prevalence of selected health status indicators among adults with or without arthritis
Percent of adultsSource: NHIS 2007
Bars with the same values may have different lengths because of rounding.
No arthritisArthritis
0 10 20 30 40 50
9
31
4
44
4
20
6
11
2
6

Self-rated fair or poor health is reported by about 1 in 3 adults with arthritis. Theprevalence generally increases with age regardless of gender or race/ethnicity.
The burden of pain among adults in the United States
65
Age, years
Total
20–39
40–64
65+
Percent of adults with arthritis who report fair/poor health status, by gender and age
Percent of adultsSource: NHIS 2007
0 10 20 30 40 50
MenWomen
3032
1528
2932
3634
Age, years
Total
20–39
40–64
65+
Percent of adults with arthritis who report fair/poor health status, by race/ethnicityand age
Percent of adultsSource: NHIS 2007
Bars with the same values may have different lengths because of rounding.
White, non-HispanicBlack, non-HispanicHispanic
0 10 20 30 40 50 60
2942
45
2028
34
2844
43
3243
55

The burden of pain among adults in the United States
66
42% of men and 46% of women with arthritis report arthritis-related activitylimitations. 52% of black, non-Hispanic adults with arthritis and 48% ofHispanic adults with arthritis report being limited in their usual daily activities.
Age, years
Total
20–39
40–64
65+
Percent of adults with arthritis who report activity limitations because of arthritis orjoint symptoms, by gender and age
Percent of adultsSource: NHIS 2007
Bars with the same values may have different lengths because of rounding.
0 10 20 30 40 50 60
MenWomen
4246
4346
4450
3131
Age, years
Total
20–39
40–64
65+
Percent of adults with arthritis who report activity limitations because of arthritis orjoint symptoms,, by race/ethnicity and age
Percent of adultsSource: NHIS 2007
White, non-HispanicBlack, non-HispanicHispanic
0 10 20 30 40 50 60
4352
48
3136
33
4454
47
4654
58
The burden of pain among adults in the United States
67
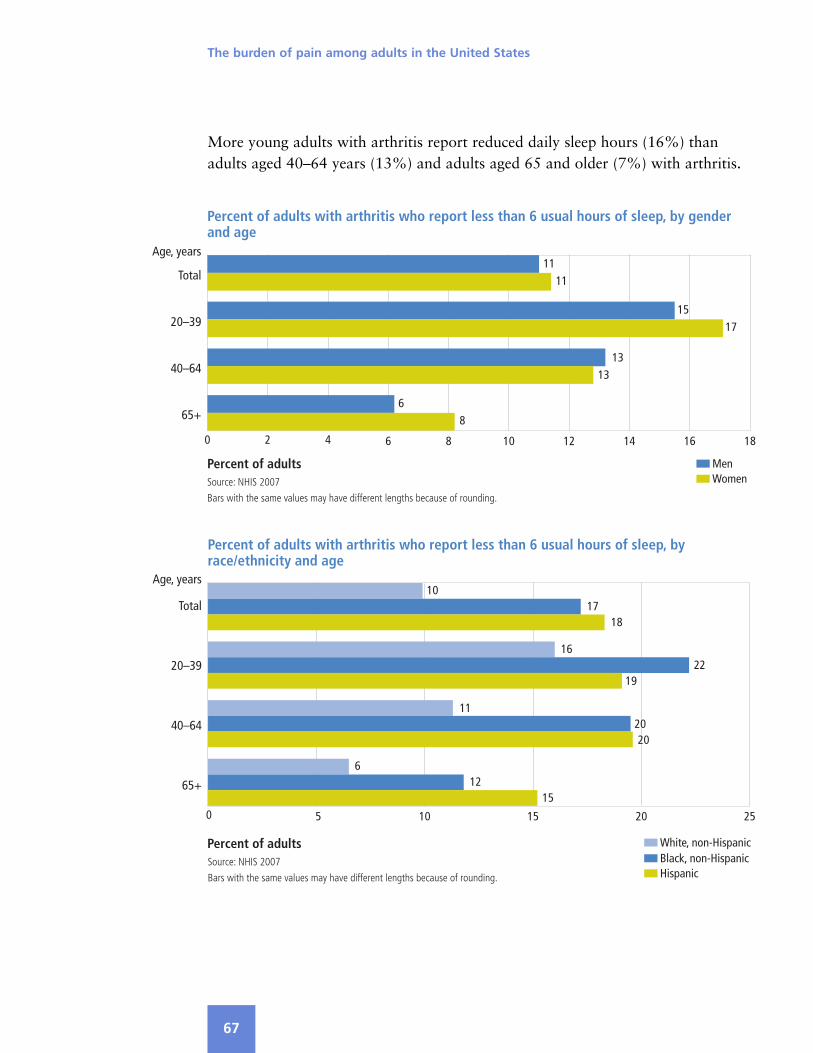
More young adults with arthritis report reduced daily sleep hours (16%) thanadults aged 40–64 years (13%) and adults aged 65 and older (7%) with arthritis.
Age, years
Total
20–39
40–64
65+
Percent of adults with arthritis who report less than 6 usual hours of sleep, by genderand age
Percent of adultsSource: NHIS 2007
Bars with the same values may have different lengths because of rounding.
0 2 4 6 8 10 12 14 16 18
MenWomen
1111
1517
1313
68
Age, years
Total
20–39
40–64
65+
Percent of adults with arthritis who report less than 6 usual hours of sleep, byrace/ethnicity and age
Percent of adultsSource: NHIS 2007
Bars with the same values may have different lengths because of rounding.
White, non-HispanicBlack, non-HispanicHispanic
0 5 10 15 20 25
1017
18
1622
19
112020
612
15

The burden of pain among adults in the United States
68
20% of adults with arthritis report being unable to work. Nearly one-third ofblack, non-Hispanic adults aged 40–64 years with arthritis report being unable towork (32%).
Age, years
Total
20–39
40–64
Percent of adults with arthritis who report being unable to work, by gender and age
Percent of adultsSource: NHIS 2007
MenWomen
0 5 10 15 20 25
1921
1016
20
22
Age, years
Total
20–39
40–64
Percent of adults with arthritis who report being unable to work, by race/ethnicity and age
Percent of adultsSource: NHIS 2007
Bars with the same values may have different lengths because of rounding.
White, non-HispanicBlack, non-HispanicHispanic
1929
20
2032
21
141414
0 5 10 15 20 25 30 35
1929
20
141414
2032
21

6% of adults with arthritis report psychological distress. Generally, the prevalencedeclines with age and is greatest among women (7%) and Hispanic adults (11%).
The burden of pain among adults in the United States
69
Age, years
Total
20–39
40–64
65+
Percent of adults with arthritis who report psychological distress, by gender and age
Percent of adultsSource: NHIS 2007
Bars with the same values may have different lengths because of rounding.
0 2 4 6 8 10 12
MenWomen
47
69
410
23
Age, years
Total
20–39
40–64
65+
Percent of adults with arthritis who report psychological distress, by race/ethnicityand age
Percent of adultsSource: NHIS 2007
Bars with the same values may have different lengths because of rounding.
White, non-HispanicBlack, non-HispanicHispanic
0 2 4 6 8 10 12 14 16
56
11
84
14
78
12
23
10

The burden of pain among adults in the United States
70
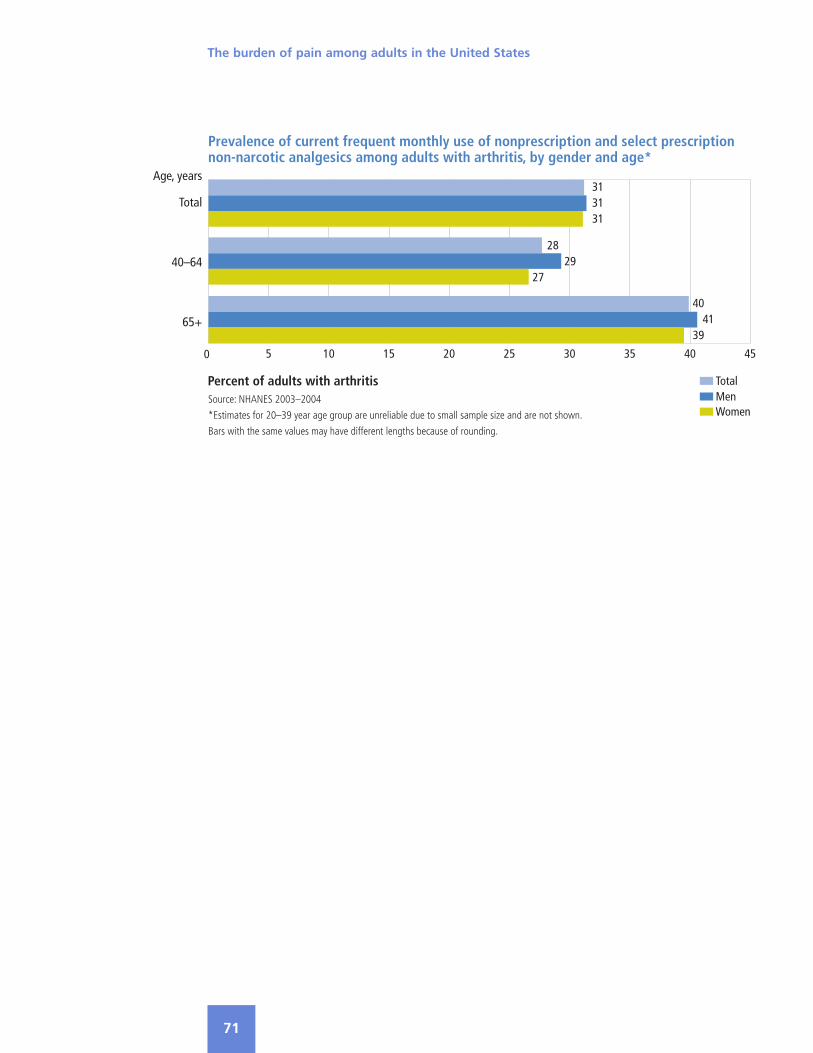
Arthritis and analgesic drug use37% of adults with arthritis report prescription analgesic drug use.
31% of adults with arthritis report using a non-prescription or non-narcoticprescription analgesic nearly every day for a month or longer.
Age, years
Total
40–64
65+
Prevalence of prescription analgesic drug use in the past month among adults witharthritis, by gender and age*
Percent of adults with arthritisSource: NHANES 2003–2004
*Estimates for 20–39 year age group are unreliable due to small sample size and are not shown.
TotalMenWomen
0 5 10 15 20 25 30 35 40 45 50
3735
38
4239
44
3433
35
The burden of pain among adults in the United States
71
Age, years
Total
40–64
65+
Prevalence of current frequent monthly use of nonprescription and select prescriptionnon-narcotic analgesics among adults with arthritis, by gender and age*
Percent of adults with arthritisSource: NHANES 2003–2004
*Estimates for 20–39 year age group are unreliable due to small sample size and are not shown.
Bars with the same values may have different lengths because of rounding.
TotalMenWomen
0 5 10 15 20 25 30 35 40 45
313131
2829
27
4041
39

The burden of pain among adults in the United States
73
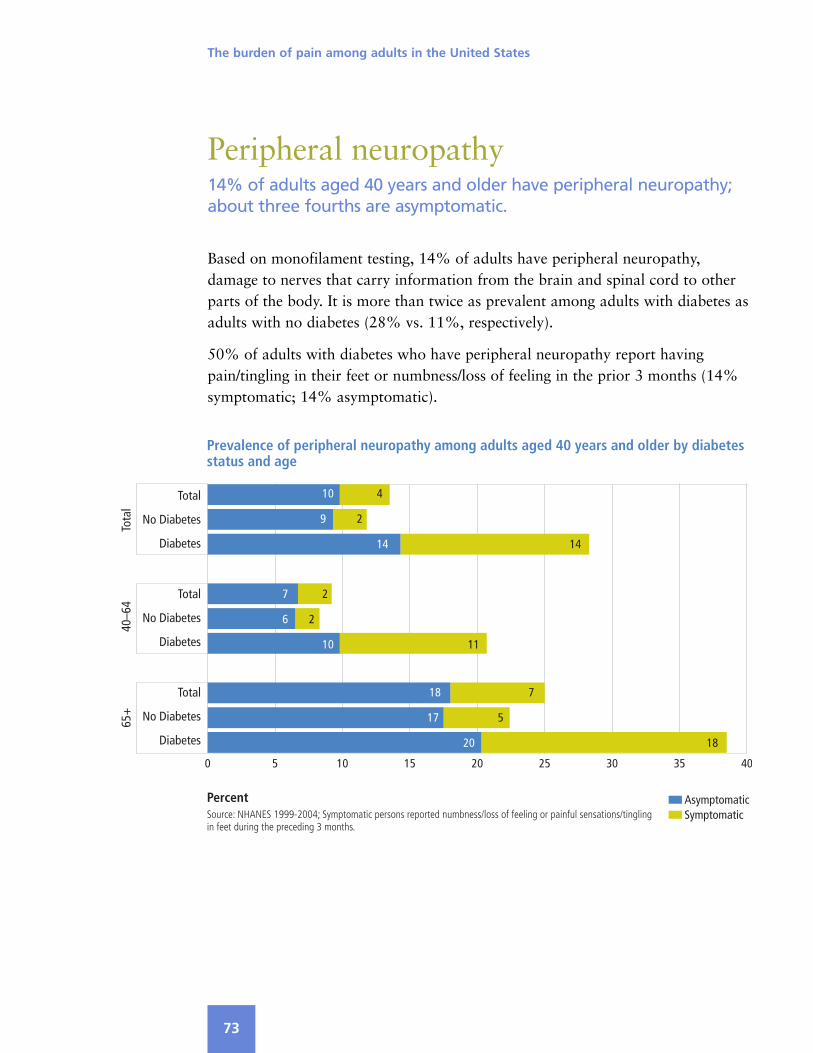
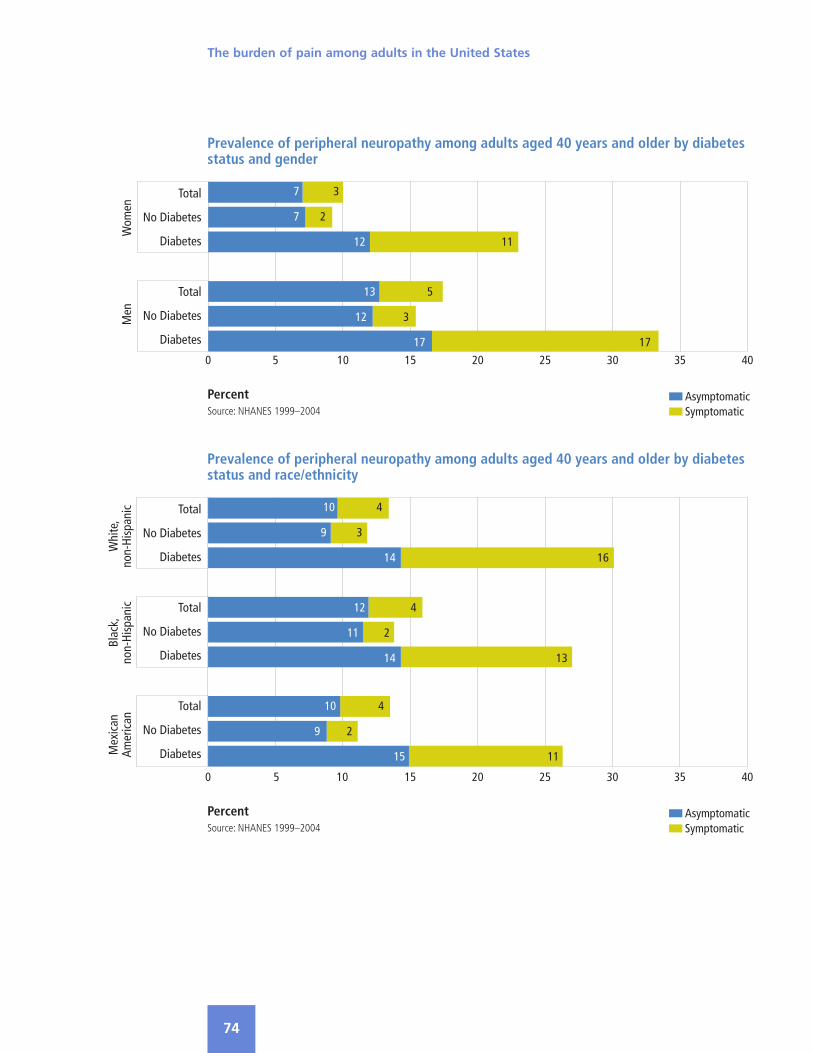
Peripheral neuropathy14% of adults aged 40 years and older have peripheral neuropathy;about three fourths are asymptomatic.
Based on monofilament testing, 14% of adults have peripheral neuropathy,damage to nerves that carry information from the brain and spinal cord to otherparts of the body. It is more than twice as prevalent among adults with diabetes asadults with no diabetes (28% vs. 11%, respectively).
50% of adults with diabetes who have peripheral neuropathy report havingpain/tingling in their feet or numbness/loss of feeling in the prior 3 months (14%symptomatic; 14% asymptomatic).
Total
No Diabetes
Diabetes
Total
No Diabetes
Diabetes
Total
No Diabetes
Diabetes
Prevalence of peripheral neuropathy among adults aged 40 years and older by diabetesstatus and age
PercentSource: NHANES 1999-2004; Symptomatic persons reported numbness/loss of feeling or painful sensations/tinglingin feet during the preceding 3 months.
AsymptomaticSymptomatic
0 5 10 15 20 25 30 35 40
Tota
l40
–64
65+
10 4
9 2
14 14
7 2
6 2
10 11
18 7
17 5
20 18
The burden of pain among adults in the United States
74
Total
No Diabetes
Diabetes
Total
No Diabetes
Diabetes
Prevalence of peripheral neuropathy among adults aged 40 years and older by diabetesstatus and gender
PercentSource: NHANES 1999–2004
AsymptomaticSymptomatic
0 5 10 15 20 25 30 35 40
Wom
enM
en
7 3
7 2
12 11
13 5
12 3
17 17
Total
No Diabetes
Diabetes
Total
No Diabetes
Diabetes
Total
No Diabetes
Diabetes
Prevalence of peripheral neuropathy among adults aged 40 years and older by diabetesstatus and race/ethnicity
PercentSource: NHANES 1999–2004
AsymptomaticSymptomatic
0 5 10 15 20 25 30 35 40
Whi
te,
non-
Hisp
anic
Blac
k,no
n-Hi
span
icM
exic
anAm
eric
an
10 4
9 3
14 16
12 4
11 2
14 13
10 4
9 2
15 11
The burden of pain among adults in the United States
75
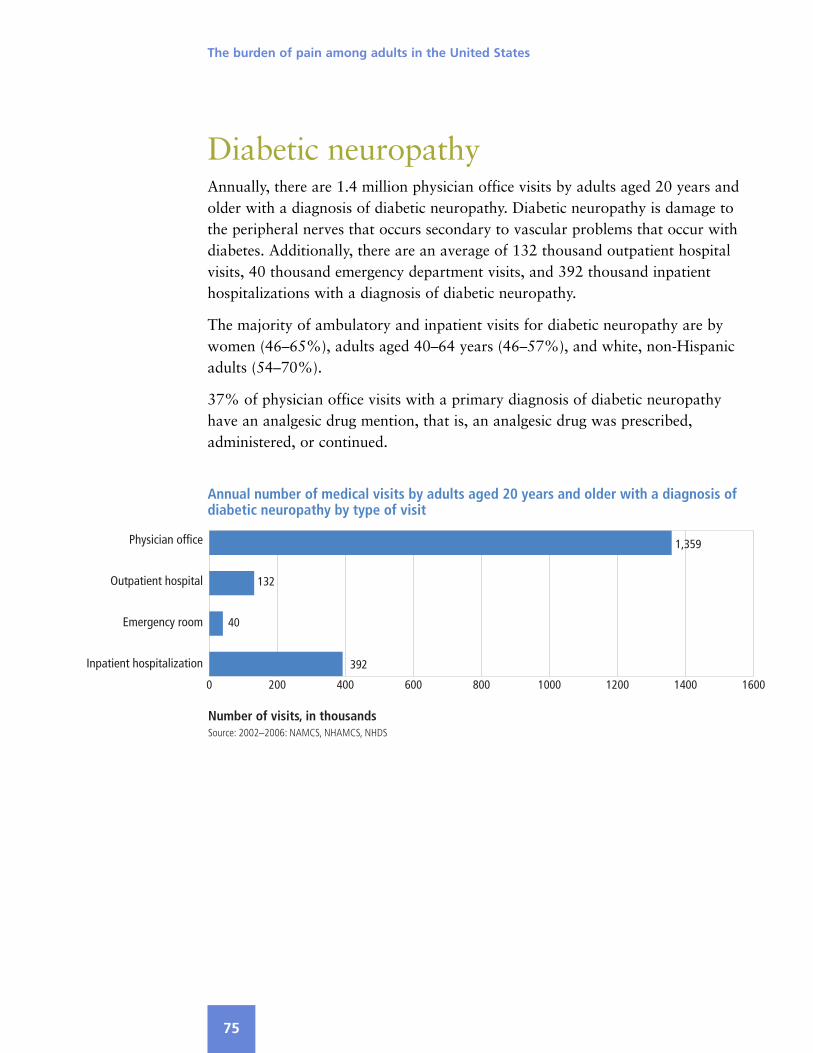
Diabetic neuropathyAnnually, there are 1.4 million physician office visits by adults aged 20 years andolder with a diagnosis of diabetic neuropathy. Diabetic neuropathy is damage tothe peripheral nerves that occurs secondary to vascular problems that occur withdiabetes. Additionally, there are an average of 132 thousand outpatient hospitalvisits, 40 thousand emergency department visits, and 392 thousand inpatienthospitalizations with a diagnosis of diabetic neuropathy.
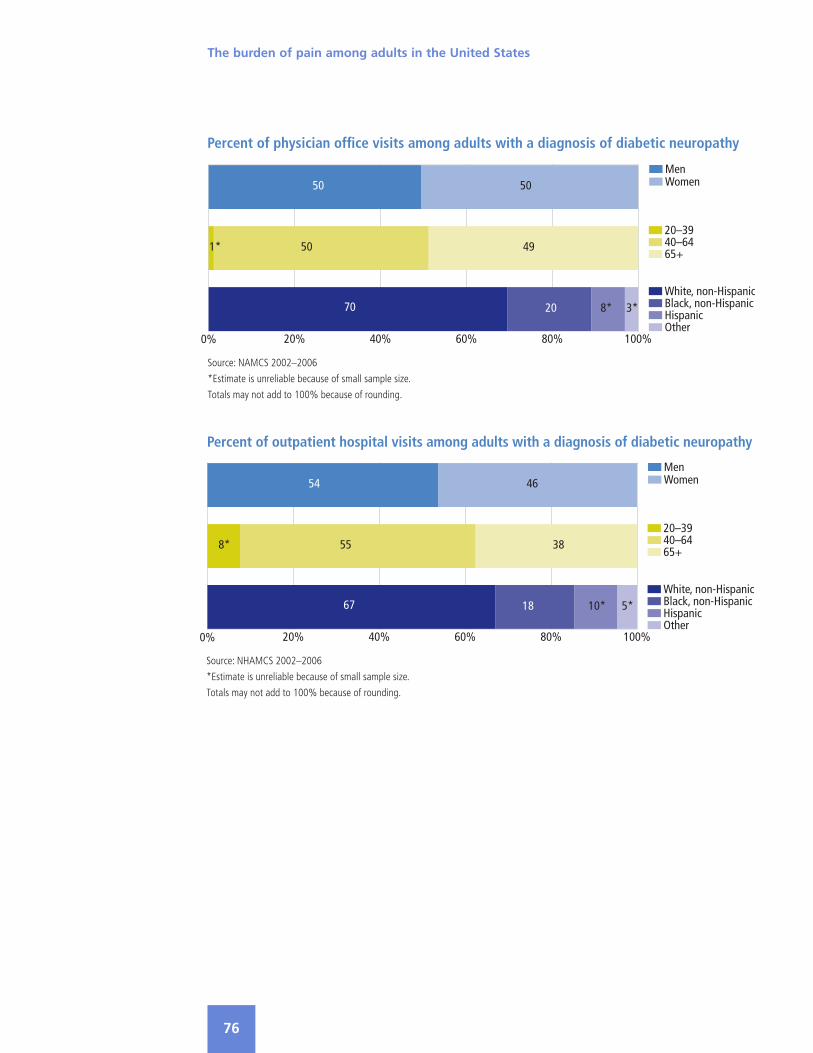
The majority of ambulatory and inpatient visits for diabetic neuropathy are bywomen (46–65%), adults aged 40–64 years (46–57%), and white, non-Hispanicadults (54–70%).
37% of physician office visits with a primary diagnosis of diabetic neuropathyhave an analgesic drug mention, that is, an analgesic drug was prescribed,administered, or continued.
Number of visits, in thousandsSource: 2002–2006: NAMCS, NHAMCS, NHDS
Physician office
Outpatient hospital
Emergency room
Inpatient hospitalization
Annual number of medical visits by adults aged 20 years and older with a diagnosis ofdiabetic neuropathy by type of visit
392
132
40
0 200 400 600 800 1000 1200 1400 1600
1,359
The burden of pain among adults in the United States
76
Percent of physician office visits among adults with a diagnosis of diabetic neuropathy
Source: NAMCS 2002–2006
*Estimate is unreliable because of small sample size.
Totals may not add to 100% because of rounding.
20–3940–6465+
White, non-HispanicBlack, non-HispanicHispanic
MenWomen
Other0% 20% 40% 60% 80% 100%
1* 50 49
70 20 8* 3*
50 50
Percent of outpatient hospital visits among adults with a diagnosis of diabetic neuropathy
Source: NHAMCS 2002–2006
*Estimate is unreliable because of small sample size.
Totals may not add to 100% because of rounding.
20–3940–6465+
White, non-HispanicBlack, non-HispanicHispanic
MenWomen
Other0% 20% 40% 60% 80% 100%
8* 55 38
67 18 10*
54 46
5*

The burden of pain among adults in the United States
77
Percent of emergency department visits among adults with a diagnosis of diabeticneuropathy
Source: NHAMCS 2002–2006
*Estimate is unreliable because of small sample size.
Totals may not add to 100% because of rounding.
20–3940–6465+
White, non-HispanicBlack, non-HispanicHispanic
MenWomen
Other0% 20% 40% 60% 80% 100%
19 57 24
54 30 15* 1
35* 65
Percent of inpatient hospitalizations among adults with a diagnosis of diabetic neuropathy
Source: NHDS 2002–2006
20–3940–6465+
MenWomen
0% 20% 40% 60% 80% 100%
9 46 45
48 52

The burden of pain among adults in the United States
79
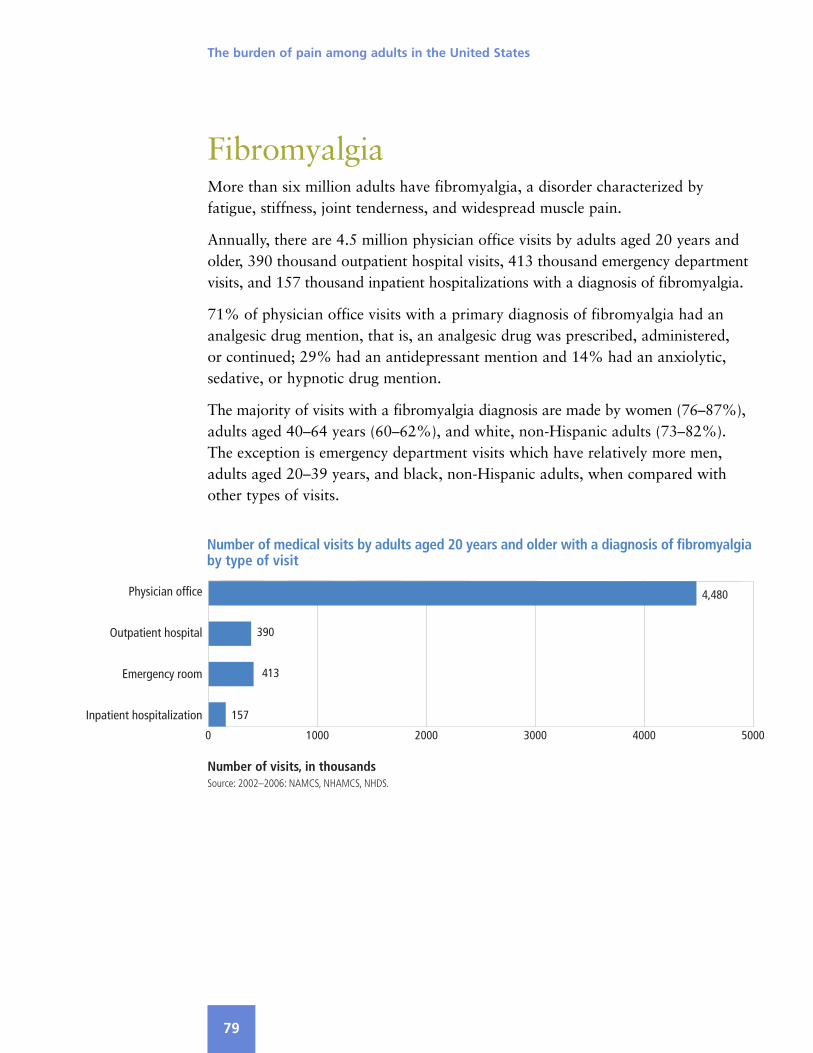
FibromyalgiaMore than six million adults have fibromyalgia, a disorder characterized byfatigue, stiffness, joint tenderness, and widespread muscle pain.
Annually, there are 4.5 million physician office visits by adults aged 20 years andolder, 390 thousand outpatient hospital visits, 413 thousand emergency departmentvisits, and 157 thousand inpatient hospitalizations with a diagnosis of fibromyalgia.
71% of physician office visits with a primary diagnosis of fibromyalgia had ananalgesic drug mention, that is, an analgesic drug was prescribed, administered,or continued; 29% had an antidepressant mention and 14% had an anxiolytic,sedative, or hypnotic drug mention.
The majority of visits with a fibromyalgia diagnosis are made by women (76–87%),adults aged 40–64 years (60–62%), and white, non-Hispanic adults (73–82%).The exception is emergency department visits which have relatively more men,adults aged 20–39 years, and black, non-Hispanic adults, when compared withother types of visits.
Number of visits, in thousandsSource: 2002–2006: NAMCS, NHAMCS, NHDS.
Physician office
Outpatient hospital
Emergency room
Inpatient hospitalization
Number of medical visits by adults aged 20 years and older with a diagnosis of fibromyalgiaby type of visit
157
390
4,480
413
0 1000 2000 3000 4000 5000

The burden of pain among adults in the United States
80
Percent of physician office visits among adults with a diagnosis of fibromyalgia
Source: NAMCS 2002–2006
*Estimate is unreliable because of small sample size.
Totals may not add to 100% because of rounding.
20–3940–6465+
White, non-HispanicBlack, non-HispanicHispanic
MenWomen
Other0% 20% 40% 60% 80% 100%
19 62 20
82 8 7 3*
22 78
Percent of outpatient hospital visits among adults with a diagnosis of fibromyalgia
Source: NHAMCS 2002–2006
*Estimate is unreliable because of small sample size.
20–3940–6465+
White, non-HispanicBlack, non-HispanicHispanic
MenWomen
Other0% 20% 40% 60% 80% 100%
26 61 13
73 14 11
24 76
2*
Percent of inpatient hospitalizations among adults with a diagnosis of fibromyalgia
Source: NHDS 2002–2006
Totals may not add to 100% because of rounding.
20–3940–6465+
MenWomen
0% 20% 40% 60% 80% 100%
16 60 23
13 87

The burden of pain among adults in the United States
81
Percent of emergency department visits among adults with a diagnosis of fibromyalgia
Source: NHAMCS 2002–2006
*Estimate is unreliable because of small sample size.
20–3940–6465+
White, non-HispanicBlack, non-HispanicHispanic
MenWomen
Other0% 20% 40% 60% 80% 100%
42 47 11
55 30 13 2*
39 61
Analgesics
Antidepressants
Anxiolytics, sedatives,hypnotics
Percent of fibromyalgia office visits with a drug mention for analgesics, antidepressants,or anxiolytics/sedatives/hypnotics
Percent of fibromyalgia-related office visitsSource: NAMCS 2006*Estmate is unreliable because of small sample size.
0 20 40 60 80
Primary diagnosisAny diagnosis
7163
29*30
14*20


The burden of pain among adults in the United States
83
ShinglesAnnually, there are 1.2 million physician office visits by adults aged 20 years andolder with a diagnosis of shingles, a viral disease characterized by a painful skinrash. Annually, there are an additional 107 thousand outpatient hospital visits,157 thousand emergency department visits, and 33 thousand inpatienthospitalizations with a diagnosis of shingles.
58% of physician office visits with a primary diagnosis of shingles had ananalgesic drug mention, that is, an analgesic drug was prescribed, administered,or continued.
The majority of visits for shingles are by women (54–65%), adults aged 40–64years (32–44%), and white, non-Hispanic adults (62–85%). The exception is withinpatient hospitalizations, where over two-thirds of the hospitalizations with ashingles diagnosis are by adults aged 65 and older.
Number of visits, in thousandsSource: 2002–2006: NAMCS, NHAMCS, NHDS.
Physician office
Outpatient hospital
Emergency room
Inpatient hospitalization
Annual number of medical visits by adults aged 20 years and older with a diagnosis ofshingles, by type of visit
33
107
0 200 400 600 800 1000 1200 1400
1,154
157

The burden of pain among adults in the United States
84
Percent of physician office visits among adults with a diagnosis of shingles
Source: NAMCS 2002–2006
*Estimate is unreliable because of small sample size.
Totals may not add to 100% because of rounding.
20–3940–6465+
White, non-HispanicBlack, non-HispanicHispanic
MenWomen
Other0% 20% 40% 60% 80% 100%
15* 32 53
84 6* 8* 3*
42 58
Percent of outpatient hospital visits among adults with a diagnosis of shingles
Source: NHAMCS 2002–2006
*Estimate is unreliable because of small sample size.
20–3940–6465+
White, non-HispanicBlack, non-HispanicHispanic
MenWomen
Other0% 20% 40% 60% 80% 100%
22* 34 44
85 3* 9*
37 63
3*

The burden of pain among adults in the United States
85
Percent of emergency department visits among adults with a diagnosis of shingles
Source: NHAMCS 2002–2006
*Estimate is unreliable because of small sample size.
Totals may not add to 100% because of rounding.
20–3940–6465+
White, non-HispanicBlack, non-HispanicHispanic
MenWomen
Other0% 20% 40% 60% 80% 100%
26 44 31
62 20 13 4*
46 54
Percent of inpatient hospitalizations among adults with a diagnosis of shingles
Source: NHDS 2002–2006
20–3940–6465+
MenWomen
0% 20% 40% 60% 80% 100%
5 26 69
35 65


The burden of pain among adults in the United States
87
InjuryIn 2006, there were nearly 34 million physician office visits for a bodily injury,which includes sprains or strains, fractures, contusions, dislocations, crushes, orburns. Sprains and strains are the most common type of injury, with nearly 17million office visits. This was followed by 8 million visits with a fracture diagnosisand 7 million for a contusion.
14 million or 43% of all injury-related office visits had an analgesic drug mention,that is, an analgesic drug was prescribed, administered, or continued during theoffice visit. 53% of sprain/strain visits had an analgesic drug mention.
Any injury*
Sprains and strains
Fractures
Superficial contusion
Dislocation
Number of physician office visits by adults aged 20 years and older with an injury-relateddiagnosis and analgesic drug mention
Physician office visits, in millionsSource: NAMCS 2006
*Includes all injuries shown and bodily crushes and burns.
Total # of office visitsVisits with analgesic drug mention
0 5 10 15 20 25 30 35
34
17
8
7
2
14
9
3
2
1

The burden of pain among adults in the United States
88
PercentSource: NAMCS 2006
Men
Women
20–39
40–64
65+
White,non-Hispanic
Black,non-Hispanic
Hispanic
Percent of analgesic drug mentions among office visits with any primary injury-relateddiagnosis
0 5 10 15 20 25 30 35 40 45 50
47
42
34
42
42
41
31
46
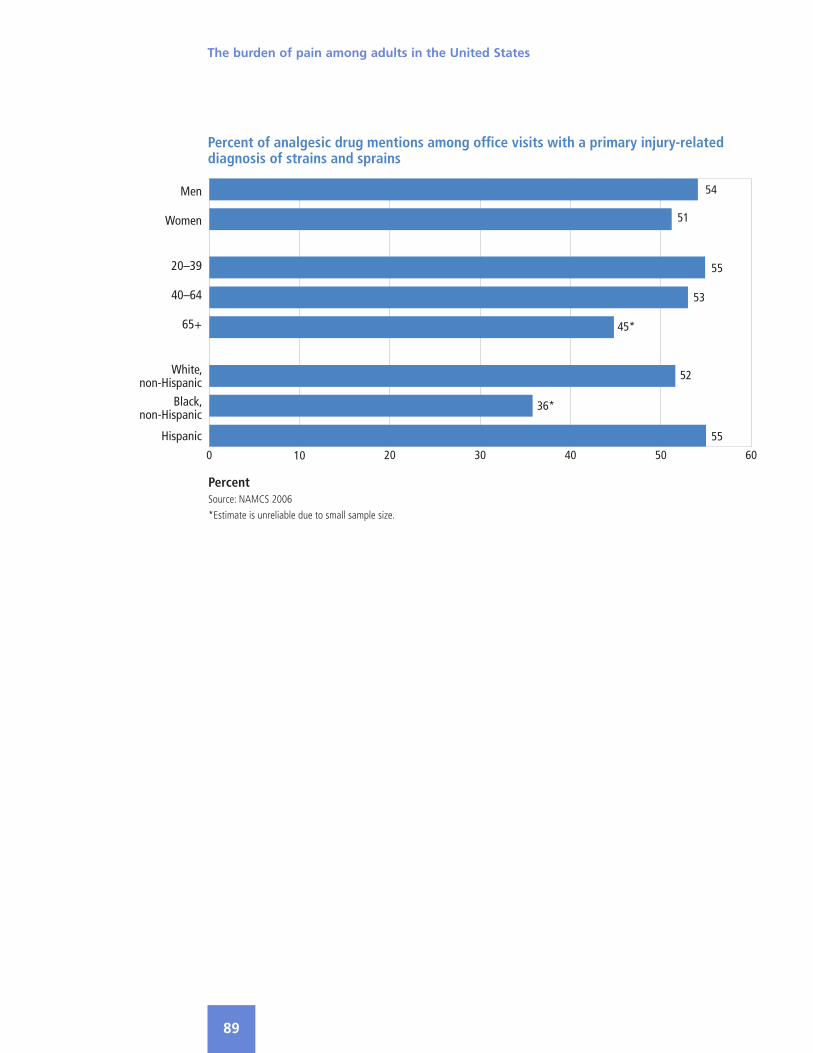
The burden of pain among adults in the United States
89
PercentSource: NAMCS 2006
*Estimate is unreliable due to small sample size.
Men
Women
20–39
40–64
65+
White,non-Hispanic
Black,non-Hispanic
Hispanic
Percent of analgesic drug mentions among office visits with a primary injury-relateddiagnosis of strains and sprains
0 10 20 30 40 50 60
55
53
45*
54
51
52
36*
55


Appendix
Data sourcesNational Health and Nutrition Examination Survey (NHANES), 1999–2004US Department of Health and Human ServicesCenters for Disease Control and PreventionNational Center for Health Statistics
The NHANES is a sample survey designed to obtain nationally representative information onthe health and nutrition of the civilian, non-institutionalized population of the United States.It is conducted by the National Center for Health Statistics (NCHS), a part of the Centers forDisease Control and Prevention (CDC). Survey participants receive a face-to-face interview intheir homes to obtain information on health history, health behaviors, and risk factors.Participants subsequently undergo a physical examination in a mobile examination center.The survey is conducted in 2-year cycles. The 1999–2004 survey is an aggregation of thethree most recent releases of NHANES (1999–2000, 2001–2002, and 2003–2004). The totalpopulation of adults aged 20 years and older sampled during the 2003–2004 cycle is 5041,including 1494 persons aged 65 and older. The total population of adults aged 40 years andolder sampled during the 1999–2004 cycle is 9970.
National Health Care Surveys:US Department of Health and Human ServicesCenters for Disease Control and PreventionNational Center for Health Statistics
National Ambulatory Medical Care Survey (NAMCS), 2002–2006The NAMCS is a national survey of physicians designed to meet the need for objective,reliable information about the provision and use of ambulatory medical care services inthe United States. It is conducted by the National Center for Health Statistics (NCHS), apart of the Centers for Disease Control and Prevention (CDC). Findings are based on asample of visits to non-federally employed office-based physicians who are primarilyengaged in direct patient care. Physicians in the specialties of anesthesiology, pathology,and radiology are excluded from the survey. The survey was conducted annually from1973 to 1981, in 1985, and annually since 1989. The sample size for adults aged 20years and older for 2006 is 23,819 visits and for 2002–2006 is 109,041 visits.
The burden of pain among adults in the United States
91

National Hospital Ambulatory Medical Care Survey (NHAMCS), 2002–2006The NHAMCS, begun in 1992, is the longest continuously running nationally representativesurvey of visits to the emergency and outpatient departments of noninstitutional generaland short-stay hospitals, exclusive of Federal, military, and Veterans Administration hospitalsin the 50 States and the District of Columbia. An outpatient department is a hospitalfacility where nonurgent ambulatory medical care is provided under the supervision ofa physician. The following are examples of the types of clinics included in NHAMCS:general medicine, surgery, pediatrics, obstetrics and gynecology, substance abuse (excludingmethadone maintenance), and others (e.g., psychiatry and neurology). Clinics excludedfrom NHAMCS include ambulatory surgery centers, chemotherapy, employee healthservice, renal dialysis, methadone maintenance, and radiology. Data are released as twoseparate files, the emergency department data file and the outpatient department data file.The sample size for emergency department visits for adults aged 20 years and older for2006 is 25,465 and 2002–2006 is 133,074. The sample size for outpatient departmentvisits for adults aged 20 years and older for 2006 is 24,630 and 2002–2006 is 121,643.
National Hospital Discharge Survey (NHDS), 2002–2006The NHDS, which has been conducted annually since 1965, is a national probabilitysurvey of inpatients discharged from non-Federal short-stay hospitals in the UnitedStates. The NHDS collects data from a sample of more than 300,000 inpatient recordsacquired from a national sample of about 500 hospitals. Data are available on patientcharacteristics including age, race, and sex; administrative information including patientdisposition, expected sources of payment, and source of admission; and medical informationincluding diagnoses and procedures. Sample size for adults aged 20 and older for 2006 is301,075 records and for 2002–2006 is 1,398,311 records.
National Health Interview Survey (NHIS), 2007US Department of Health and Human ServicesCenters for Disease Control and PreventionNational Center for Health Statistics
The NHIS is a nationally representative interview survey based on a sample of the non-institutionalized US population. Surveys in the series have been conducted annually since1957, with the last major restructuring occurring in 1997. The survey consists of personalinterviews in a population-based national sample. The 2007 sample consists of 22,814 adultsaged 20 and older, with 8,285 between the ages of 20 to 39, and 4,583 aged 65 and older.
The burden of pain among adults in the United States
92

DefinitionsPain sitesDental pain: Persons were classified as having dental pain if they responded positively to theNHIS question, “During the past 12 months, have you had dental pain?”
Face or jaw pain: Persons were classified as having face or jaw pain if they responded positivelyto the NHIS question, “During the past 3 months, did you have facial ache or pain in the jawmuscles or the joint in front of the ear?” Respondents were instructed to report pain that hadlasted a whole day or more, and not to report fleeting or minor aches or pains
Joint pain: Persons were classified as having joint pain if they responded positively to theNHIS question, “During the past 30 days, have you had any symptoms of pain, aching,stiffness in or around a joint?’’ Respondents were instructed to report the affected jointsbut not to include the back or neck. On the NHANES, the question asked about joint painduring the past 12 months.
Severe joint pain was defined based on the NHIS 2006 follow-up question, “During the past30 days, how bad was your joint pain on average?’’ Respondents were instructed to answeron a scale of 0–10 where 0 was no pain or aching and 10 was pain or aching as bad as it canbe. Severe pain was defined as a response of 7–10.
Low back pain: Persons were classified as having low back pain if they responded positively tothe NHIS or NHANES question, “During the past 3 months, did you have low back pain?”Respondents were instructed to report pain that had lasted a whole day or more, and not toreport fleeting or minor aches or pains.
Neck pain: Persons were classified as having neck pain if they responded positively to theNHIS or NHANES question, “During the past 3 months, did you have neck pain?”Respondents were instructed to report pain that had lasted a whole day or more, and notto report fleeting or minor aches or pains.
Severe headaches or migraines: Persons were classified as having severe headache or migraineif they responded positively to the NHIS or NHANES question, “During the past 3 months,did you have a severe headache or migraine?” Respondents were instructed to report painthat had lasted a whole day or more, and not to report fleeting or minor aches or pains.
Pain-related diseases and conditionsArthritis: Persons were classified as having arthritis if they responded positively to the NHISquestion, “Have you ever been told by a doctor or other health professional that you hadsome form of arthritis, rheumatoid arthritis, gout, lupus, or fibromyalgia?” On theNHANES, the question asked only about arthritis.
Peripheral neuropathy (PN): For the 1999–2000, 2001–2002, and 2003–2004 NHANES surveys,participants aged 40 years and older received monofilament testing of foot sensation at threesites (plantar, first metatarsal head; plantar, fifth metatarsal head; and plantar, hallux) on thebottom of each foot (total of six sites). PN was defined as 1 or more insensate areas.
Symptomatic PN: Persons with PN were classified as symptomatic if they responded positivelyto either question, “During the past 3 months, have you had a painful sensation or tingling inyour hands or feet? Exclude normal foot aches from standing or walking for long periods” or“During the past 3 months, have you had numbness or loss of feeling in your feet, other thanfrom your feet falling asleep?”
The burden of pain among adults in the United States
93

Diagnostic classification used in health care visit charts
Clinical classification codes from the International Classification of Diseases (ICD),9th Revision, Clinical Modification (ICD-9-CM)
Condition ICD-9-CM CodeDiabetic neuropathy 250.6Fibromyalgia 729.1Injury
Fracture 800-829Dislocation 830-839Sprains and strains 840-848Contusion/superficial 910-924Crush 925-929Burns 940-949
Joint pain 719.4Low back pain 724.2Shingles 53.9Severe headache or migraines 346, 784.0, 307.81
Health status indicatorsGeneral health status: Persons rated their health in response to the NHIS question, “Wouldyou say your health in general was excellent, very good, good, fair, or poor?”
Activity limitations: Persons were classified as having activity limitations if they respondedpositively to the NHIS question, “Are you now limited in any way in any of your usualactivities because of arthritis or joint symptoms?”
Unable to work: Persons were classified as being unable to work if they responded positivelyto the NHIS questions, “Does a physical, mental, or emotional problem NOW keep you fromworking at a job or business?”
Psychological distress: Psychological distress was ascertained on the NHIS with the K6instrument which asked persons to report, “During the past 30 days, how often did youfeel…so sad that nothing could cheer you up? Nervous? Restless or fidgety? Hopeless? Thateverything was an effort? And worthless?” Possible answers are: all of the time (4 points),most of the time (3 points), some of the time (2 points), a little of the time (1 point), andnone of the time (0 points) for a possible total of 0 to 24 points. 13 or more is used to defineserious psychological distress.
Reduced sleep: Persons were classified as having reduced daily sleep if they reported sleepingless than 6 hours in answer to the NHIS question, “On average, how many hours of sleep doyou get in a 24-hour period?”
The burden of pain among adults in the United States
94

Other definitionsDiabetes: Persons were classified as having diabetes if they self-reported in the NHANESinterview having been told by a physician that they have diabetes.
Body mass index (BMI): BMI was calculated as weight in kilograms divided by the square ofheight in meters, based on the NHIS sample adult’s responses to survey questions regardingheight and weight.
• Normal weight: A person was classified as normal weight if his/her BMI was greater thanor equal to 18.5 and less than 25.0.
• Overweight: A person was classified as overweight if his/her BMI was greater than or equalto 25.0 and less than 30.0.
• Obese: A person was classified as obese if his/her BMI was greater than or equal to 30.0.
Drug dataPrescription drug use data: NHANES participants were asked if they had taken a prescriptiondrug in the past month. Those who answered “yes” were asked to show the interviewer themedication containers of all prescription drugs. For each drug reported, the interviewerrecorded the product’s complete name from the container. Prescription drugs were classifiedbased on the therapeutic classification scheme of Cerner Multum’s Lexicon. Analgesic drugswere identified with a code of 58.
Non-prescription and select non-narcotic prescription analgesic use: NHANES participants wereshown a hand card with a list of non-prescription and prescription non-narcotic analgesicsand asked, “Have you ever taken any of these prescription or over-the-counter pain relievermedications nearly every day for as long as a month?” If a participant answered affirmatively,they were asked to identify each product taken and whether they were currently taking theproduct daily or nearly every day. Frequent monthly analgesic users were defined as adultswho currently used a pain reliever from the hand card daily or nearly every day.
Drug mentions at office-based physician visits: For the NAMCS, physicians or their staffs wereinstructed to record all new or continued medications ordered, supplied, or administeredat the visit. This included prescription and nonprescription preparations, immunizations,desensitizing agents, and anesthetics. In this survey, recorded medications are referred to asdrug mentions. Visits with one or more drug mentions are termed “drug visits.” Drugs forthe 2006 survey are classified based on the therapeutic classification scheme of CernerMultum’s Lexicon: analgesic drugs = 58, antidepressants = 249, and anxiolytics, hypnotics,and sedatives = 67.
The burden of pain among adults in the United States
95


P F I Z E R F A C T S
Medical Division
PG283568© 2008 Pfizer Inc. All rights reserved.
Printed in USA/December 2008
The Burden of PainAmong Adultsin the United StatesFindings from the National Health and Nutrition Examination Survey,the National Health Care Surveys, and the National Health Interview Survey