Europe’s growing Muslim population 2017 - Pew Research Center
Upload
lynda-kosterCategory
view
223download
0
8/8/2019 Pew Research Center Recession
http://slidepdf.com/reader/full/pew-research-center-recession 1/120

8/8/2019 Pew Research Center Recession
http://slidepdf.com/reader/full/pew-research-center-recession 2/120
Table of Contents
Executive Summary ........................................................................................ i
1 Overview .............................................................................. ................. 1
2 The Great Recession: 2007 —20?? ................................................................. 13
3 The Slow Road to Recovery ......................................................................... 35
4 Household Finances, Social Class, Future Generations ...................................... 43
5 Work and Unemployment .......................................................................... 57
6 Spending, Saving, Borrowing, Retirement Confidence ........................................ 69
7 The Housing Bust ................................................................................ ..... 79
Appendices
Survey Methodology ................................................................................... 85
Topline Questionnaire ................................................................................ 93
8/8/2019 Pew Research Center Recession
http://slidepdf.com/reader/full/pew-research-center-recession 3/120
i
A Balance Sheet at 30 Months
How the Great Recession Has Changed Life in America
Executive Summary
More than half (55%) of all adults in the labor force say that since the Great Recession began 30 months ago,they have suffered a spell of unemployment, a cut in pay, a reduction in hours or have become involuntary part-time workers, according to a new survey by thePew Research Center‘s Social& Demographic Trends Project.
The survey also finds that the recession has led to a new frugality in Americans‘ spending and borrodiminished set of expectations about their retirements and their children‘s future; and a coseveral years, at a minimum, for their family finances and house values to recover.
Not all survey findings are bleak. More than six-in-ten (62%) Americans believe that their personal finances willimprove in the coming year, and a small but growing minority (15%) now says the national economy is in goodshape.
These green shoots of public optimism are not evenly distributed —nor do they always sprout from the mostlikely sources. Several groups that have been hardest hit by this recession (including blacks, young adults andDemocrats) are significantly more upbeat than their more sheltered counterparts (including whites, older adultsand Republicans) about a recovery both for themselves and for the national economy.
This report analyzes economic outcomes, behavioral changes and attitudinal trends related to the recessionamong the full adult population and among different subgroups. It is based on a Pew Research Center survey of 2,967 adults conducted from May 11 to May 31, 2010, on cellular and landline telephones and also on a PewResearch analysis of government economic and demographic data.
Key findings include:
The Recession at Work: The work-related impact of this recession extends far beyond the 9.7% who areunemployed or the 16.6% who (according to the U.S. Bureau of Labor Statistics) are either out of work orunderemployed. The Pew Research survey finds that about a third (32%) of adults in the labor force have been unemployed for a period of time during the recession. And when asked about a broader range of work-related impacts, 55% of adults in the labor force say that during the recession they have suffered a spell of unemployment, a cut in pay, a reduction in hours or an involuntary spell in a part-time job.(Chapter 5)
Is It Over Yet? Most Americans (54%) say the U.S. economy is still in a recession; 41% say it is beginning
to come out of the recession; and just 3% say the recession is over. Whites (57%) are more inclined than blacks (45%) or Hispanics (43%) to say the recession is ongoing. Republicans (63%) are more inclined thanDemocrats (43%) to say the same.(Chapter 3)
The New Frugality : More than six-in-ten Americans (62%) say they have cut back on their spending sincethe recession began in December 2007; just 6% say they have increased their spending. Asked to predicttheir spending patterns once the economy improves, nearly one-in-three (31%) say they plan to spend less
8/8/2019 Pew Research Center Recession
http://slidepdf.com/reader/full/pew-research-center-recession 4/120
ii
than they did before the recession began, while just 12% say theyplan to spend more. A majority saythey expect to spend about whatthey did before the recession.(Chapter 6)
Family Finances : About half thepublic (48%) say they are in worsefinancial shape now than before therecession began; one-in-five (21%)say they are in better shape.Grouped by income, those withannual household incomes below$50,000 are the most likely to saythey are in worse shape. Grouped by age, those in late middle age (50to 64) are most likely to say this.Also, government data show thataverage household wealth fell byabout 20% from 2007 to 2009,principally because of declininghouse values and retirementaccounts. This is the biggest
meltdown in U.S. householdwealth in the post-World War IIera. (Chapters 2,4)
A Slow Road to Recovery : Of those who say their family financeshave lost ground during therecession, 63% say it will take atleast three years to recover. Blackswho lost ground believe that theirrecovery time will be shorter thando whites who lost ground.(Chapter 4)
Retirement Worries : A third(32%) of adults now say they arenot confident that they will have enough income and assets to finance their retirement, up from 25% whosaid that in February 2009. Among adults ages 62 and older who are still working, a third say they have
About the Data
Findings presented in this report are primarily based on twosources: a new national survey conducted by the Pew ResearchCenter and data gathered by the federal government and analyzedby Pew Research Center staff.
Results for this survey are based on telephone interviewsconducted with a nationally representative sample of 2,967 peopleages 18 and older living in the continental United States. Acombination of landline and cellular random digit dial (RDD)samples was used to represent all adults in the continental UnitedStates who have access to either a landline or cellular telephone.A total of 1,893 interviews were completed with respondentscontacted by landline telephone and 1 ,074 with those contactedon their cellular phone. The data are weighted to produce a finalsample that is representative of the general population of adults inthe continental United States. For more details, see Appendix I.
Interviews conducted May 11-31, 2010
2,967 interviews
Margin of sampling error is plus or minus 2.2 percentage pointsfor results based on the total sample at the 95% confidencelevel.
Survey interviews were conducted under the direction ofPrinceton Survey Research Associates International. Interviewswere conducted in English or Spanish.
The economic analyses presented in Chapter 2 are primarily drawnfrom U.S. Bureau of Labor Statistics and Pew Research Center
tabulations of the Census Bureau‟s Current Population S urvey.Data are also drawn from the U. S. Commerce Department‟sNational Income and Product Accounts (NIPA) reports, which trackhousehold consumption and savings, and the Federal ReserveBank‟s Flow of Funds Accounts, which monitor household debt and
wealth. Additional estimates of household wealth come from the Universityof Michigan‟s Panel Study of Income Dynamics (PSID). Other dataon household finances are drawn from the federal government‟sSurvey of Consumer Finances. Information on debt service ratioscomes from the Federal Reserve Bank. For more details, seeChapter 2.
Note on terminology: Whites include only non-Hispanic whites.Blacks include only non-Hispanic blacks. Hispanics are of any race.The terms “labor force” and “work force” are usedinterchangeably.

8/8/2019 Pew Research Center Recession
http://slidepdf.com/reader/full/pew-research-center-recession 5/120
iii
already delayed retirement because of the recession. And among workers in their 50s, about six-in-ten saythey may have to do the same.(Chapter 4)
The Recession Hits Home : About half of all homeowners (48%) say the value of their home has declinedduring the recession. Of those who say this, nearly half (47%) believe it will take three to five years for the
value to return to pre-recession levels, and nearly four-in-ten (39%) expect it will take six years or longer.Yet the vast majority (80%) of Americans say that owning a house is the best long-term investment a personcan make.(Chapter 7)
Diminished Expectations for Children’s Future : More than a quarter (26%) of Americans say thatwhen their children become the age they are now, their children will have a worse standard of living thanthey now have. A decade ago, just 10% of Americans had this concern. Blacks, Hispanics and young adultsare more upbeat about the idea of intra-family intergenerational progress than are whites and older adults.(Chapter 3)
A Partisan Switch: Throughout most of the decade of the 2000s, Republicans were significantly moreupbeat than Democrats about the state of the economy. That pattern is now reversed. Across six differentmeasures of confidence in both personal finances and the national economy, Democrats are now much moreupbeat than Republicans, even though they have lower incomes and less wealth and have suffered more joblosses during the recession. To be sure, Republicans have had to endure their own distinctive mix of recession-related hardships. They are more likely than Democrats to say their house has lost value, andbecause they are more likely than Democrats to have investments in the stock market, exposed to its volatile swings up and down.(Chapter 1)
About the ReportThis report is the work of Pew Research Center‘s Social &Demographic Trends project, including staff members Paul Taylor, project director; Rich Morin, senior editor; Rakesh Kochhar, senior researcher; KimParker, senior researcher; D‘Vera Cohn, senior writer; Mark Lopez, senior researcher; Richaresearcher; Wendy Wang, research associate; Gabriel Velasco, research analyst; Daniel Dockterman, researchassistant; Rebecca Hinze-Pifer, intern and Soledad Espinoza, intern.
Morin led the team that developed and analyzed the survey questionnaire. Kochhar led the team that conductedthe economic research. Taylor served as overall report editor; he also wrote Chapters 1 and 3. Kochhar wroteChapter 2. Parker wrote Chapter 4. Morin wrote Chapters 5 and 7. Cohn wrote Chapter 6.

8/8/2019 Pew Research Center Recession
http://slidepdf.com/reader/full/pew-research-center-recession 6/120

8/8/2019 Pew Research Center Recession
http://slidepdf.com/reader/full/pew-research-center-recession 7/120
1
Chapter 1: Overview
Of the 13 recessions that the American public hasendured since the Great Depression of 1929-33,none has presented a more punishing combination
of length, breadth and depth than this one.
A new Pew Research survey finds that 30 monthsafter it began, the Great Recession has led to adownsizing of Americans‘expectations about theirretirements and their children‘s future;a newfrugality in their spending and borrowing habits;and a concern that it could take several years, at aminimum, for their house values and familyfinances to recover.
The survey also finds that more than half of the adults in U.S. labor force (55%)have experienced some work-relatedhardship — be it a spell of unemployment,a cut in pay, a reduction in hours or aninvoluntary move to part-time work. Inaddition, the bursting of the pre-recession housing and stock market bubbles has shrunk the wealth of the
average American household by anestimated 20%, the deepest such declinein the post-World War II era, accordingto government data.
While nearly all Americans have beenhurt in one way or another, some groupshave suffered more than others. Blacks,Hispanics and young adults have borne adisproportionate share of the job losses.Middle-aged adults have gotten the worstof the downturn in house values,household finances and retirementaccounts. Men have lost many more jobsthan women. And across most indicators,those with a high school diploma or lesseducation have been hit harder than those with a college degree or more.
Are You Spending More, Less or the Same?% saying that since the recession began, theyhave …
Note: “Don‟t know/Refused” responses not shown, N=2,967.
62
30
6
Cut back
Spent about thesame
Increased
The Recession at Work% of each group who experienced each of the followingsince the recession began
*The under-employed are part-time workers who say they want a full-time job but do not have one because they cannot find full-timeemployment or because of other economic reasons.
28
23
12
11
6
55
Work hours reduced
Pay cut
Had to take unpaid leave
Forced to switch to part-time
Unemployed now or sometimeduring recession
Underemployed*
Among total labor force (n=2,256)
Among currently employed (n=1,604)
Total experiencing anywork-related problem
32

8/8/2019 Pew Research Center Recession
http://slidepdf.com/reader/full/pew-research-center-recession 8/120

8/8/2019 Pew Research Center Recession
http://slidepdf.com/reader/full/pew-research-center-recession 9/120
3
for a range of demographic variablesand recession-related experiences.1 The analysis finds that blacks,Democrats and, on most questions,younger adults are more likely thanwhites, Republicans and older adultsto hold positive views about thenational economy and their personalfinances, regardless of their income,education, gender or whether theyhave had difficulty paying their bills,making mortgage or rent payments;getting or paying for medical care; orhave had to cut spending during the
recession.One likely explanation for theseseemingly counterintuitive patternsis that in an age of highly polarizedpolitics, Democrats and Republicans differ not only in their values, attitudes and policy positions, but,increasingly, in their basic perceptions of reality.
This is not the first Pew Research survey taken in the past year that shows that the election of Barack Obama(which came at the height of the recession in November 2008) appears to have put his most enthusiasticsupporters —especially blacks, Democrats and young adults —in a more positive frame of mindthan Obama‘sdetractors about many aspects of national life.2
For example, since Obama was elected Democrats have become more optimistic than Republicans about thestate of the national economy. For most of the time that George W. Bush was in office, the reverse was true:Republicans were more upbeat —often, much more upbeat —than Democrats.
1 In addition to race, party identification and age, the logistic regression models include gender, education, income and whether the respondenthad experienced recession-related problems to predict the respondents‘ views on the current state of the economy, their personal financialsituation and how they think their family will fare financially in the coming year.2 For similar findings of this nature from another Pew Research Center survey, see―Blacks Upbeat about Black Progress, Prospects, ‖ January12, 2010(http://pewsocialtrends.org/pubs/749/blacks-upbeat-about-black-progress-obama-election ).
A Partisan Switch in Perceptions of U.S. Economy% rating the economy as excellent or good
Source: 1992-2003 Gallup, 2004-2010 Pew Research Center for the People &the Press.
0
25
50
75
100
1992 1994 1996 1998 2000 2002 2004 2006 2008 2010
Republican Democrat
8/8/2019 Pew Research Center Recession
http://slidepdf.com/reader/full/pew-research-center-recession 10/120
4
An Historical Perspective
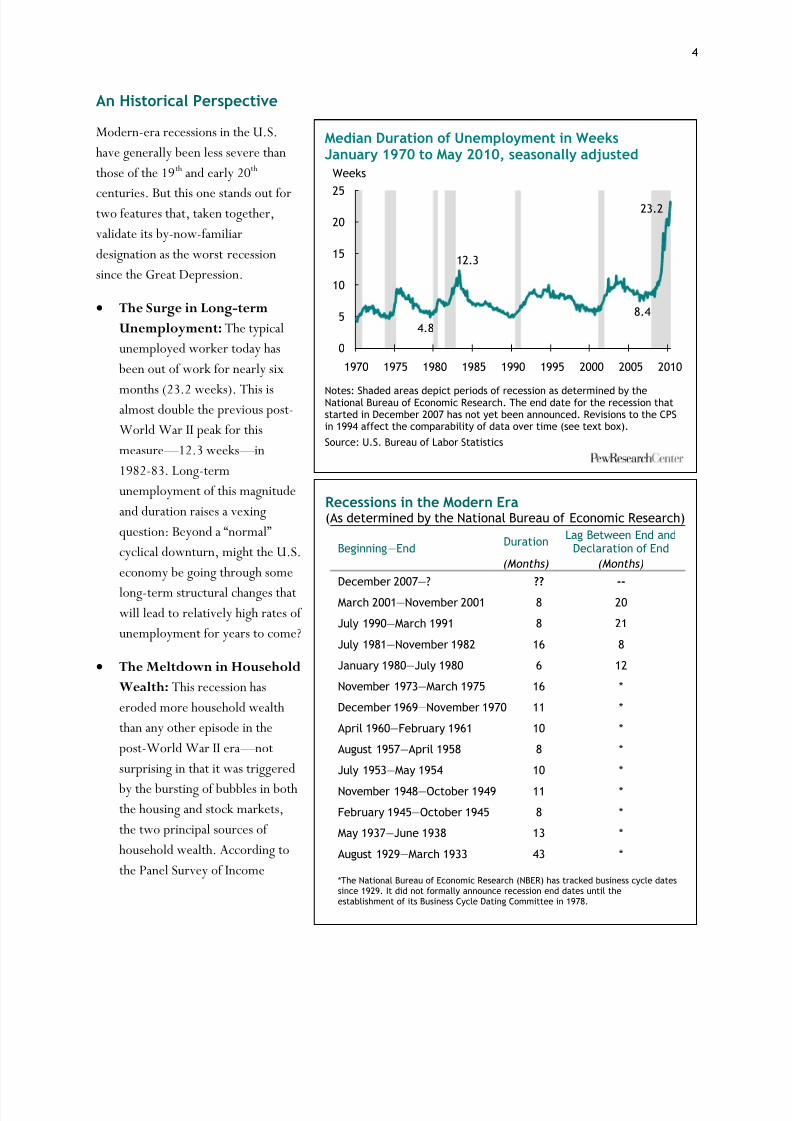
Modern-era recessions in the U.S.have generally been less severe thanthose of the 19th and early 20th
centuries. But this one stands out fortwo features that, taken together,validate its by-now-familiardesignation as the worst recessionsince the Great Depression.
The Surge in Long-termUnemployment: The typicalunemployed worker today has been out of work for nearly six
months (23.2 weeks). This isalmost double the previous post-World War II peak for thismeasure —12.3 weeks —in1982-83. Long-termunemployment of this magnitudeand duration raises a vexingquestion: Beyond a ―normal‖ cyclical downturn, might the U.S.economy be going through somelong-term structural changes thatwill lead to relatively high rates of unemployment for years to come?
The Meltdown in HouseholdWealth: This recession haseroded more household wealththan any other episode in thepost-World War II era —notsurprising in that it was triggered
by the bursting of bubbles in boththe housing and stock markets,the two principal sources of household wealth. According tothe Panel Survey of Income
Median Duration of Unemployment in WeeksJanuary 1970 to May 2010, seasonally adjusted
Weeks
Notes: Shaded areas depict periods of recession as determined by theNational Bureau of Economic Research. The end date for the recession thatstarted in December 2007 has not yet been announced. Revisions to the CPSin 1994 affect the comparability of data over time (see text box).Source: U.S. Bureau of Labor Statistics
4.8
12.3
8.4
23.2
0
5
10
15
20
25
1970 1975 1980 1985 1990 1995 2000 2005 2010
Recessions in the Modern Era(As determined by the National Bureau of Economic Research)
Beginning —End Duration Lag Between End andDeclaration of End
(Months) (Months) December 2007 —? ?? --
March 2001—November 2001 8 20
July 1990 —March 1991 8 21
July 1981 —November 1982 16 8
January 1980 —July 1980 6 12
November 1973 —March 1975 16 *
December 1969 —November 1970 11 *
April 1960—February 1961 10 *
August 1957 —April 1958 8 *
July 1953 —May 1954 10 *
November 1948 —October 1949 11 *
February 1945 —October 1945 8 *
May 1937—June 1938 13 *
August 1929 —March 1933 43 *
*The National Bureau of Economic Research (NBER) has tracked business cycle datessince 1929. It did not formally announce recession end dates until theestablishment of its Business Cycle Dating Committee in 1978.
8/8/2019 Pew Research Center Recession
http://slidepdf.com/reader/full/pew-research-center-recession 11/120
5
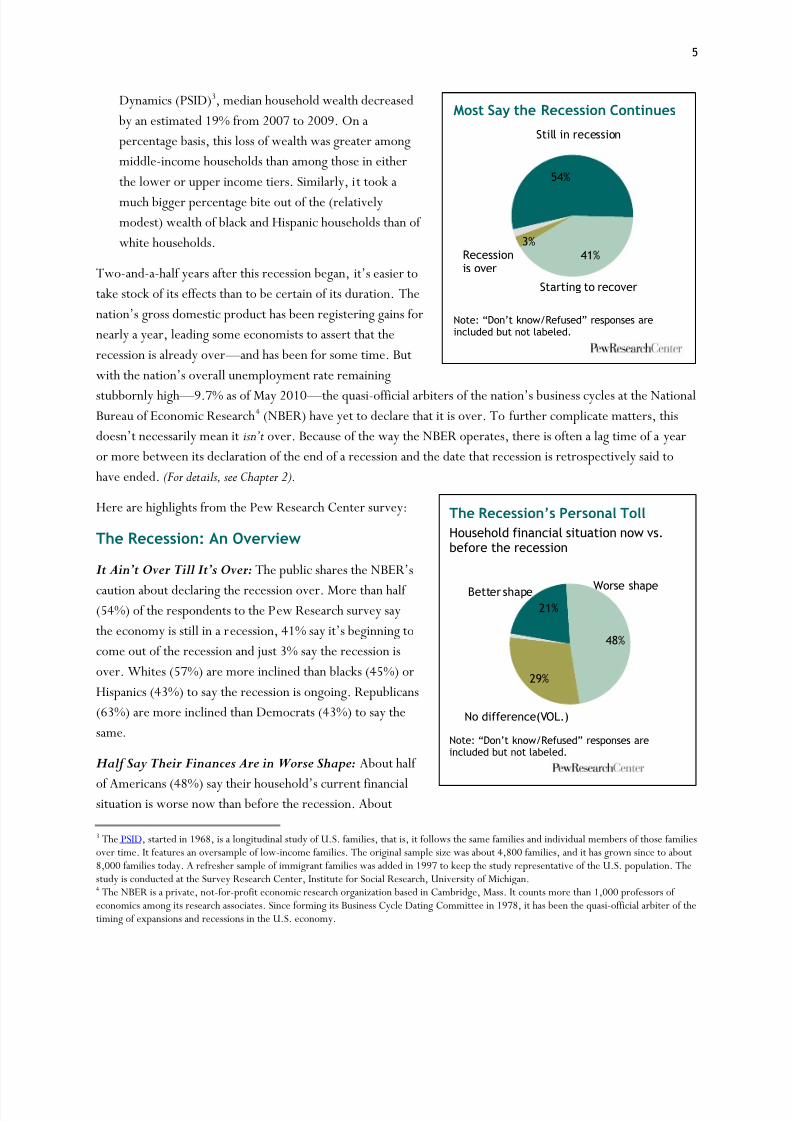
Dynamics (PSID)3, median household wealth decreased by an estimated 19% from 2007 to 2009. On apercentage basis, this loss of wealth was greater amongmiddle-income households than among those in eitherthe lower or upper income tiers. Similarly, it took amuch bigger percentage bite out of the (relativelymodest) wealth of black and Hispanic households than of white households.
Two-and-a-half years after this recession began,it‘s easier totake stock of its effects than to be certain of its duration. Thenation‘sgross domestic product has been registering gains fornearly a year, leading some economists to assert that therecession is already over —and has been for some time. Butwith the nation‘s overall unemployment rate remainingstubbornly high —9.7% as of May 2010 —the quasi-official arbiters of the nation‘s business cycles at the NationalBureau of Economic Research4 (NBER) have yet to declare that it is over. To further complicate matters, thisdoesn‘t necessarily mean itisn’t over. Because of the way the NBER operates, there is often a lag time of a yearor more between its declaration of the end of a recession and the date that recession is retrospectively said tohave ended.(For details, see Chapter 2).
Here are highlights from the Pew Research Center survey:
The Recession: An Overview
It Ain’t Over Till It’s Over : The public shares the NBER‘scaution about declaring the recession over. More than half (54%) of the respondents to the Pew Research survey saythe economy is still in a recession,41% say it‘s beginning tocome out of the recession and just 3% say the recession isover. Whites (57%) are more inclined than blacks (45%) orHispanics (43%) to say the recession is ongoing. Republicans(63%) are more inclined than Democrats (43%) to say thesame.
Half Say Their Finances Are in Worse Shape: About half
of Americans (48%) say their household‘s current financialsituation is worse now than before the recession. About
3 The PSID, started in 1968, is a longitudinal study of U.S. families, that is, it follows the same families and individual members of those familiesover time. It features an oversample of low-income families. The original sample size was about 4,800 families, and it has grown since to about8,000 families today. A refresher sample of immigrant families was added in 1997 to keep the study representative of the U.S. population. Thestudy is conducted at the Survey Research Center, Institute for Social Research, University of Michigan. 4 The NBER is a private, not-for-profit economic research organization based in Cambridge, Mass. It counts more than 1,000 professors of economics among its research associates. Since forming its Business Cycle Dating Committee in 1978, it has been the quasi-official arbiter of thtiming of expansions and recessions in the U.S. economy.
Most Say the Recession Continues
Note: “Don‟t know/Refused” responses areincluded but not labeled.
54%
41%3%
Still in recession
Starting to recover
Recessionis over
The Recession’s Personal TollHousehold financial situation now vs.before the recession
Note: “Don‟t know/Refused” responses areincluded but not labeled.
21%
48%
29%
Better shape Worse shape
No difference(VOL.)

8/8/2019 Pew Research Center Recession
http://slidepdf.com/reader/full/pew-research-center-recession 12/120

8/8/2019 Pew Research Center Recession
http://slidepdf.com/reader/full/pew-research-center-recession 13/120
7
The New Frugality
Making Ends Meet: Americans have changedtheir lifestyles in many
different ways to make endsmeet during this recession.More than seven-in-ten(71%) say they have boughtless expensive brands. Nearlysix-in-ten (57%) say theyhave cut back or canceledvacation plans. About half (49%) say they have loanedmoney to someone, and 24%report having borrowedmoney from someone.Three-in-ten say they havecut back on alcohol orcigarettes. Nearly one-in-ten(9%) say they have moved back in with theirparents (among adults ages 18 to 29, this figurerises to 24%). Overall, higher-income adults reportmaking fewer of all these lifestyle adjustments thando lower-income adults. Likewise, adults ages 65and older report making fewer of them than doyounger and middle-aged adults.
Neither a Spender Nor a Borrower Be: Morethan six-in-ten (62%) Americans say that since therecession began, they‘ve cut back on householdspending. Half say they have reduced the amountthey owe on mortgages, credit cards, car loans andother borrowing. Of those who have savings orretirement accounts, more than four-in-ten (42%)say they‘ve adopted a more conservative approachto saving and investing, compared with just 8%who say they‘ve taken a more aggressive approach. These new habits of thrift and caution could welloutlive this recession. Asked to predict theirfinancial behaviors once the economy recovers,
How the Public Has Experienced the Recession% saying this happened to them during the recession …
*Among ages 18-29, this share is 24%.
71
57
49
30
27
24
20
15
11
92
Bought less expensive brands
Cut back/canceled vacation
Loaned money to someone
Spent less on alcohol/cigarettes
Had trouble paying medical bills
Borrowed money from friends/family
Had problems paying rent/mortgage
Increased credit card debt to pay bills
Postponed marrying/having baby
*Moved back in with parents
Lost home to foreclosure
Are You Borrowing More Money or CuttingBack on What You Owe?% saying during the recession, they …
Note: “Don‟t know/Refused” responses not shown.
Question wording: I‟d like you to think about the money youowe on your credit cards, mortgage, car loans and otherkinds of loans. During the recession, did you have to borrowmore money to pay your monthly bills, or did you take stepsto cut back what you owe?
13
50
19
2
15
Borrowed more
Cut back
Neither borrowed morenor cut back (VOL.)
Did both (VOL.)
No debts or loans (VOL.)
8/8/2019 Pew Research Center Recession
http://slidepdf.com/reader/full/pew-research-center-recession 14/120
8
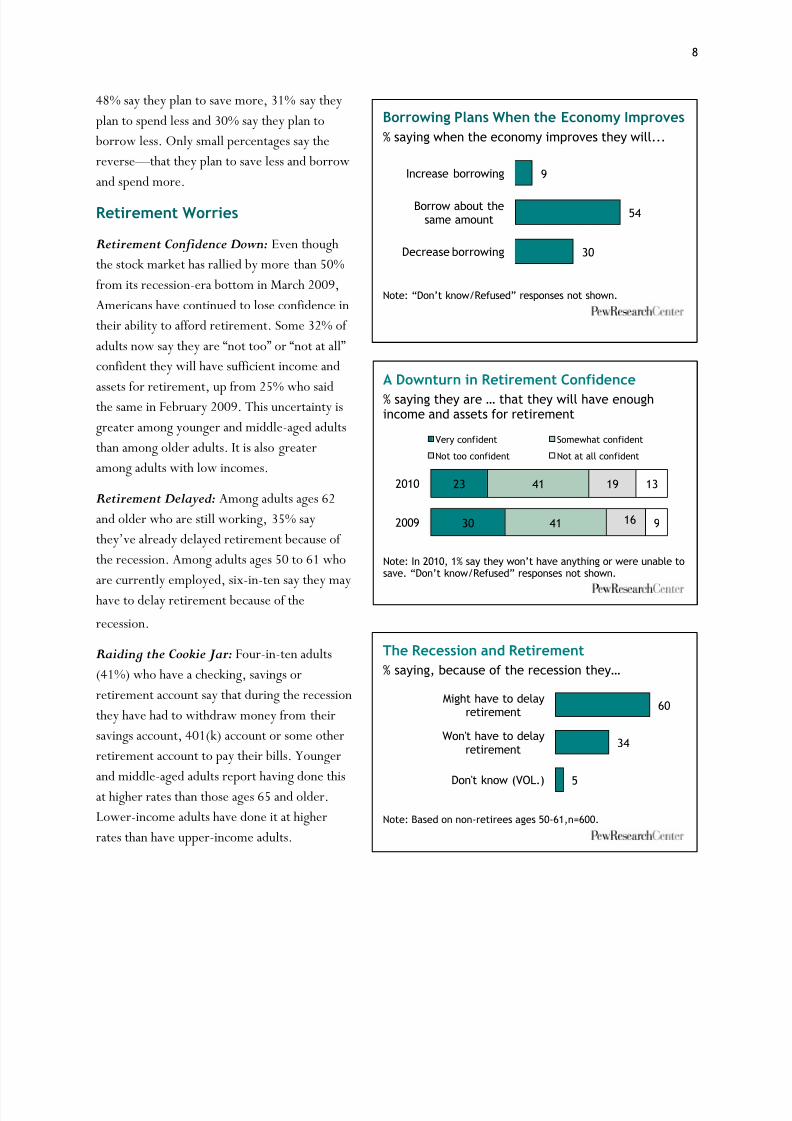
48% say they plan to save more, 31% say theyplan to spend less and 30% say they plan to borrow less. Only small percentages say thereverse —that they plan to save less and borrowand spend more.
Retirement Worries
Retirement Confidence Down: Even thoughthe stock market has rallied by more than 50%from its recession-era bottom in March 2009,Americans have continued to lose confidence intheir ability to afford retirement. Some 32% of adults now say they are ―not too‖ or ―not at all‖confident they will have sufficient income and
assets for retirement, up from 25% who saidthe same in February 2009. This uncertainty isgreater among younger and middle-aged adultsthan among older adults. It is also greateramong adults with low incomes.
Retirement Delayed: Among adults ages 62and older who are still working, 35% saythey‘ve already delayed retirement because of the recession. Among adults ages 50 to 61 whoare currently employed, six-in-ten say they mayhave to delay retirement because of the
recession.
Raiding the Cookie Jar: Four-in-ten adults(41%) who have a checking, savings orretirement account say that during the recessionthey have had to withdraw money from theirsavings account, 401(k) account or some otherretirement account to pay their bills. Youngerand middle-aged adults report having done thisat higher rates than those ages 65 and older.Lower-income adults have done it at higherrates than have upper-income adults.
Borrowing Plans When the Economy Improves% saying when the economy improves they will...
Note: “Don‟t know/Refused” responses not shown.
9
54
30
Increase borrowing
Borrow about thesame amount
Decrease borrowing
A Downturn in Retirement Confidence% saying they are … that they will have enoughincome and assets for retirement
Note: In 2010, 1% say they won‟t have anything or were unable tosave. “Don‟t know/Refused” responses not shown.
30
23
41
41
16
19
9
13
2009
2010
Very confident Somewhat confident
Not too confident Not at all confident
The Recession and Retirement% saying, because of the recession they…
Note: Based on non-retirees ages 50-61,n=600.
60
34
5
Might have to delayretirement
Won't have to delayretirement
Don't know (VOL.)
8/8/2019 Pew Research Center Recession
http://slidepdf.com/reader/full/pew-research-center-recession 15/120
9
Short-term Optimism; Long-term Uncertainty
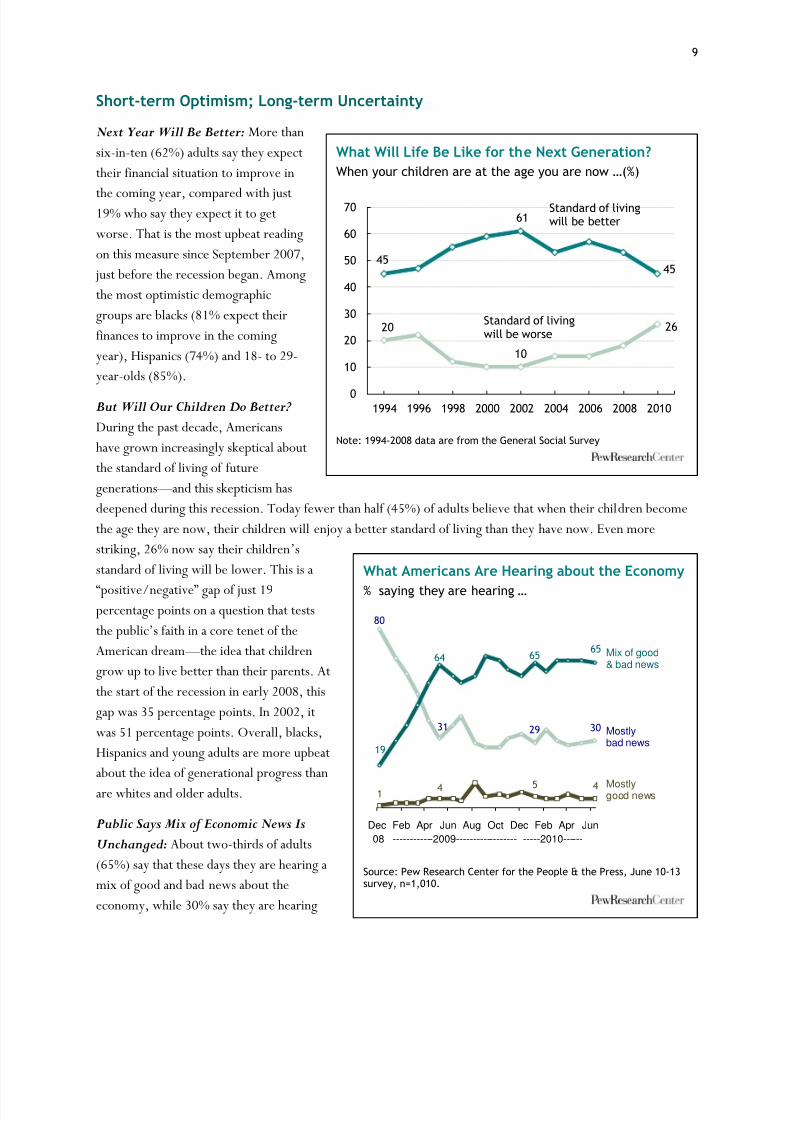
Next Year Will Be Better: More thansix-in-ten (62%) adults say they expecttheir financial situation to improve in
the coming year, compared with just19% who say they expect it to getworse. That is the most upbeat readingon this measure since September 2007, just before the recession began. Amongthe most optimistic demographicgroups are blacks (81% expect theirfinances to improve in the comingyear), Hispanics (74%) and 18- to 29-year-olds (85%).
But Will Our Children Do Better? During the past decade, Americanshave grown increasingly skeptical aboutthe standard of living of futuregenerations —and this skepticism hasdeepened during this recession. Today fewer than half (45%) of adults believe that when their children becomethe age they are now, their children will enjoy a better standard of living than they have now. Even morestriking, 26% now say their children‘s standard of living will be lower. This is a
―positive/negative‖gap of just 19percentage points on a question that teststhe public‘s faith in a core tenet of theAmerican dream —the idea that childrengrow up to live better than their parents. Atthe start of the recession in early 2008, thisgap was 35 percentage points. In 2002, itwas 51 percentage points. Overall, blacks,Hispanics and young adults are more upbeatabout the idea of generational progress thanare whites and older adults.
Public Says Mix of Economic News IsUnchanged: About two-thirds of adults(65%) say that these days they are hearing amix of good and bad news about theeconomy, while 30% say they are hearing
What Will Life Be Like for the Next Generation?When your children are at the age you are now …(%)
Note: 1994-2008 data are from the General Social Survey
0
10
20
30
40
50
60
70
1994 1996 1998 2000 2002 2004 2006 2008 2010
Standard of livingwill be better
Standard of livingwill be worse
45
20
45
26
10
61
What Americans Are Hearing about the Economy
% saying they are hearing …
Source: Pew Research Center for the People & the Press, June 10-13survey, n=1,010.
1 4 5 4
80
31 29 30
19
64 65 65
Dec Feb Apr Jun Aug Oct Dec Feb Apr Jun
Mix of good& bad news
Mostlybad news
Mostlygood news
08 ------------2009------------------ -----2010------
8/8/2019 Pew Research Center Recession
http://slidepdf.com/reader/full/pew-research-center-recession 16/120
10
mostly bad news and just 4% say they are hearingmostly good news. These shares have barely budged in the past year. However, back inDecember 2008, when the recession was about ayear old, fully 80% of adults said they werehearing mostly bad news about the economy.
Recession Impact: Permanent or Temporary? Most Americans (70%) believe that the recessionhas inflicted major changes on the U.S. economy, but most (61%) say that these changes will proveto be temporary. Older adults are moredownbeat than younger adults (21% of those ages50 and older see major, permanent changes,compared with just 13% of those ages 18-24);
college graduates are more pessimistic thanwhose with a high school diploma or lesseducation (22% of the former see major,permanent change, compared with 14% of thelatter); and Republicans are more pessimisticthan Democrats (22% vs. 12%). When asked asimilar battery of questions about the impact of the recession on the way they live their lives, asmaller share of respondents — just 8% —say they believe the changes will prove to be both majorand permanent. An additional 12% say thechanges will be minor and permanent.
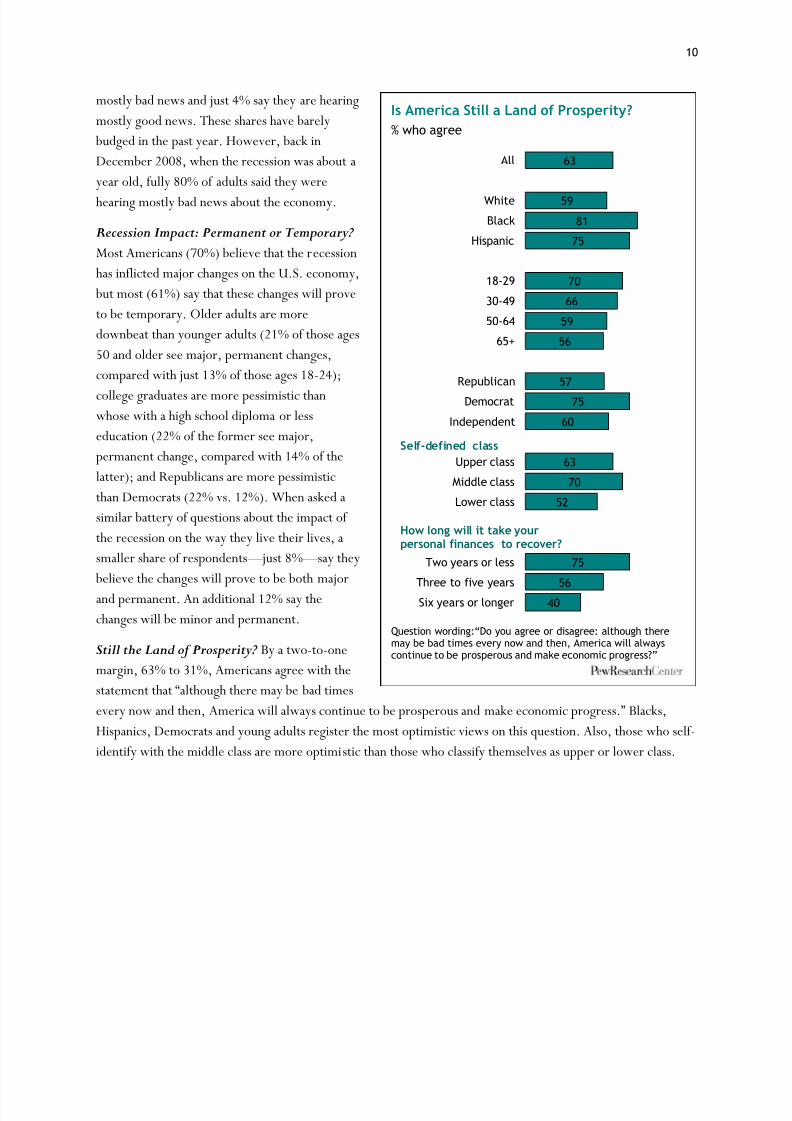
Still the Land of Prosperity? By a two-to-onemargin, 63% to 31%, Americans agree with thestatement that ―although there may be bad timesevery now and then,America will always continue to be prosperous and make economic progrBlacks,Hispanics, Democrats and young adults register the most optimistic views on this question. Also, those who self-identify with the middle class are more optimistic than those who classify themselves as upper or lower class.
Is America Still a Land of Prosperity?% who agree
Question wording:“Do you agree or disagree: although theremay be bad times every now and then, America will alwayscontinue to be prosperous and make economic progress?”
63
59
81
75
70
66
59
56
57
75
60
63
70
52
75
5640
All
WhiteBlack
Hispanic
18-29
30-49
50-64
65+
Republican
Democrat
Independent
Upper class
Middle class
Lower class
Two years or less
Three to five years
Six years or longer
How long will it take yourpersonal finances to recover?
Self-defined class

8/8/2019 Pew Research Center Recession
http://slidepdf.com/reader/full/pew-research-center-recession 17/120
11
The Labor Force
The Unemployment Blues: High as they are, measures suchas the unemployment rate (9.7% in May 2010) and themedian length of unemployment (23.2 weeks)still don‘t fully
convey the scope of the employment crisis that has unfoldedduring this recession. A broader measure from the U.S.Bureau of Labor Statistics that also includes involuntary part-timers and other marginal workers puts the combinedunemployment andunderemploymentrate at 16.6%. And thePew Research survey finds that among all adults in the laborforce, fully 32% say that they are either now unemployed orthat they had been unemployed for some period of time sincethe recession began.
The Long-term Blues: Of all currently-unemployed adults,46% have been out of work for six months or more, by farthe highest share measured by the U.S. Bureau of LaborStatistics in the post-World War II era. Short-term spells of unemployment typically do not lead to significant breaks incareer paths or major financial losses — but long-term spellsoften do.
The Payday Blues: The unemployed are not the only oneshit by this recession. More than four-in-ten (42%) currentlyemployed workers say that during the recession they haveexperienced at least one of the following: had their hoursreduced (28%); had their pay cut (23%); had to take unpaid leave (12%) or saw their full-time jobs shrink topart time (11%). Workers across all demographic groups were affected, but these blows landed most heavily onminorities and workers with only a high school diploma or less education.
Career Impact: About a quarter (24%) of all adults —and 43% of all currently unemployed adults —say therecession will have a big impact on their ability to achieve their long-term career goals. Also, workers who lost a job during this recession but have since found a new one (26% of currently employed adults) are less likely thanother workers to say they are satisfied with their job and more likely to say they are overqualified.
The Recession and the Workforce% of workers in each group who said theywere forced to …
Work Take Switch fromfewer unpaid full-time tohours leave to part-time
% % %Total 28 12 11
GenderMen 30 12 12Women 25 12 9
Age18-29 32 11 1530-49 26 13 1050+ 27 12 9
Race/EthnicityWhite 22 10 9Black 42 19 17Hispanic 40 16 14
EducationCollege grad 14 9 5Some college 29 14 11HS grad
or less 39 13 15
Note: Asked of adults currently employed full timeor part time, n=1,604. Hispanics are of any race.White and blacks include only non-Hispanics.
8/8/2019 Pew Research Center Recession
http://slidepdf.com/reader/full/pew-research-center-recession 18/120
12
The Recession Hits the Home
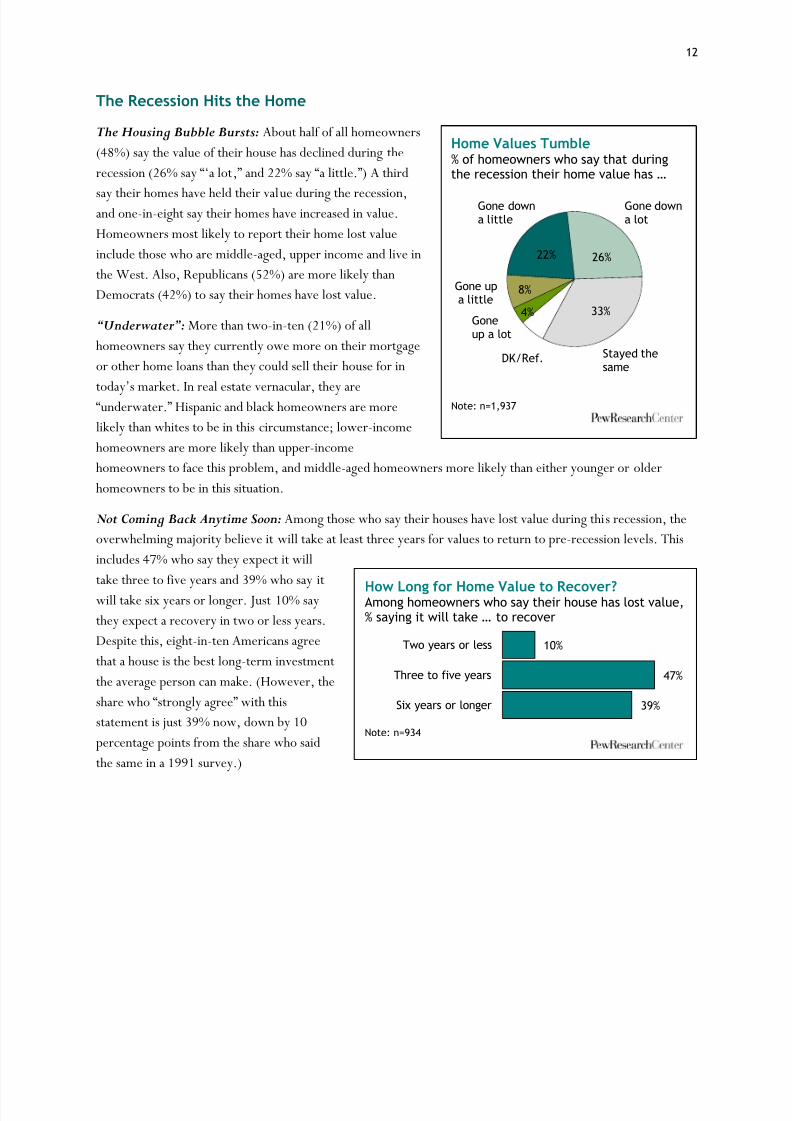
The Housing Bubble Bursts: About half of all homeowners(48%) say the value of their house has declined during therecession (26% say ―‗a lot,‖ and 22% say ―a little.‖)A third
say their homes have held their value during the recession,and one-in-eight say their homes have increased in value.Homeowners most likely to report their home lost valueinclude those who are middle-aged, upper income and live inthe West. Also, Republicans (52%) are more likely thanDemocrats (42%) to say their homes have lost value.
“ Underwater ” : More than two-in-ten (21%) of allhomeowners say they currently owe more on their mortgageor other home loans than they could sell their house for in
today‘s market. In real estate vernacular, they are―underwater.‖ Hispanic and black homeowners are morelikely than whites to be in this circumstance; lower-incomehomeowners are more likely than upper-incomehomeowners to face this problem, and middle-aged homeowners more likely than either younger or olderhomeowners to be in this situation.
Not Coming Back Anytime Soon: Among those who say their houses have lost value during this recession, theoverwhelming majority believe it will take at least three years for values to return to pre-recession levels. Thisincludes 47% who say they expect it willtake three to five years and 39% who say itwill take six years or longer. Just 10% saythey expect a recovery in two or less years.Despite this, eight-in-ten Americans agreethat a house is the best long-term investmentthe average person can make. (However, theshare who ―strongly agree‖ with thisstatement is just 39% now, down by 10percentage points from the share who saidthe same in a 1991 survey.)
How Long for Home Value to Recover?Among homeowners who say their house has lost value,% saying it will take … to recover
Note: n=934
10%
47%
39%
Two years or less
Three to five years
Six years or longer
Home Values Tumble% of homeowners who say that duringthe recession their home value has …
Note: n=1,937
DK/Ref.
33%
Gone downa lot
Gone downa little
Goneup a lot
22%
Stayed thesame
26%
8%
4%
Gone upa little

8/8/2019 Pew Research Center Recession
http://slidepdf.com/reader/full/pew-research-center-recession 19/120

8/8/2019 Pew Research Center Recession
http://slidepdf.com/reader/full/pew-research-center-recession 20/120
14
This chapter of the reportfocuses on the impact of theGreat Recession on workersand households. Labormarket indicators, such asemployment andunemployment, areconsidered alongsideindicators of the financialwell-being of households,such as consumption,savings, debt and wealth. Foranalytical purposes, it isassumed that the recession is
still ongoing 30 months afterit started. If it is eventuallydetermined that therecession is already over,some aspects of the analysispresented in this chapterwould have to be revisited.
Recessions in the Modern Era (As determined by the National Bureau of Economic Research)
Beginning —End Duration Lag Between End andDeclaration of End
(Months) (Months)
December 2007 —? ?? --
March 2001 —November 2001 8 20
July 1990 —March 1991 8 21
July 1981 —November 1982 16 8
January 1980 —July 1980 6 12
November 1973 —March 1975 16 *
December 1969 —November 1970 11 *
April 1960—February 1961 10 *
August 1957 —April 1958 8 *
July 1953 —May 1954 10 *
November 1948 —October 1949 11 *
February 1945 —October 1945 8 *
May 1937—June 1938 13 *
August 1929 —March 1933 43 *
*The National Bureau of Economic Research (NBER) has tracked business cycledates since 1929. It did not formally announce recession end dates until theestablishment of its Business Cycle Dating Committee in 1978.

8/8/2019 Pew Research Center Recession
http://slidepdf.com/reader/full/pew-research-center-recession 21/120

8/8/2019 Pew Research Center Recession
http://slidepdf.com/reader/full/pew-research-center-recession 22/120
16
Likewise, the unemployment rateincreased more in a shorter lengthof time in this recession than in the1980s. The low point for theunemployment rate prior to theGreat Recession was 4.5% in thesecond quarter of 2007. Theunemployment rate in the firstquarter of 2010 was 9.7%, anincrease of 5.2 percentage pointsin just less than three years. In theearly 1980s, the unemploymentrate rose by 5.0 percentage pointsin 3½ years, from 5.7% in the
second quarter of 1979 to 10.7%in the fourth quarter of 1982.6
Duration of Unemployment
The most striking feature of theGreat Recession is that thosewithout jobs are enduring thelongest spells of unemploymentrecorded in modern economichistory. Short-lived spells of
unemployment, say one month,typically do not lead to significantfinancial losses or breaks in careerpaths. However, ―long-term‖unemployment, meaning being outof work for at least six months, isassociated with severeconsequences for career, income,health and other aspects of well- being. Thus, the current spike in
6 Some analysts have argued that comparisons between the unemployment rate today and the rate in the early 1980s should allow for thechanging demography of the labor force. In particular, the labor force in the early 1980s was much younger and would be expected to have ahigher unemployment rate even under identical economic conditions. Correcting for differences in the age structure suggests that the currentunemployment rate is at least as high, and possibly higher, than the rate in the early 1980s. See JohnSchmitt and Dean Baker, ―Is the U.S.Unemployment Rate Today Already as High as It Was in 1982?‖ Center for Economic and Policy Research, March 2009 (http://www.cepr.net/documents/publications/ur-2009-03.pdf ).
The Unemployment RateFirst Quarter 1970 to First Quarter 2010Seasonally adjusted
%
Notes: Shaded areas depict periods of recession as determined by the National
Bureau of Economic Research. The end date for the recession that started inDecember 2007 has not yet been announced.Source: U.S. Bureau of Labor Statistics
5.7
10.7
4.5
9.7
0
2
4
6
8
10
12
1970 1975 1980 1985 1990 1995 2000 2005 2010
Median Duration of Unemployment in WeeksJanuary 1970 to May 2010, seasonally adjusted
Weeks
Notes: Shaded areas depict periods of recession as determined by the NationalBureau of Economic Research. The end date for the recession that started inDecember 2007 has not yet been announced. Revisions to the CPS in 1994 affectthe comparability of data over time (see text box).Source: U.S. Bureau of Labor Statistics
4.8
12.3
8.4
23.2
0
5
10
15
20
25
1970 1975 1980 1985 1990 1995 2000 2005 2010
8/8/2019 Pew Research Center Recession
http://slidepdf.com/reader/full/pew-research-center-recession 23/120
17
long-term unemployment is a significant development.
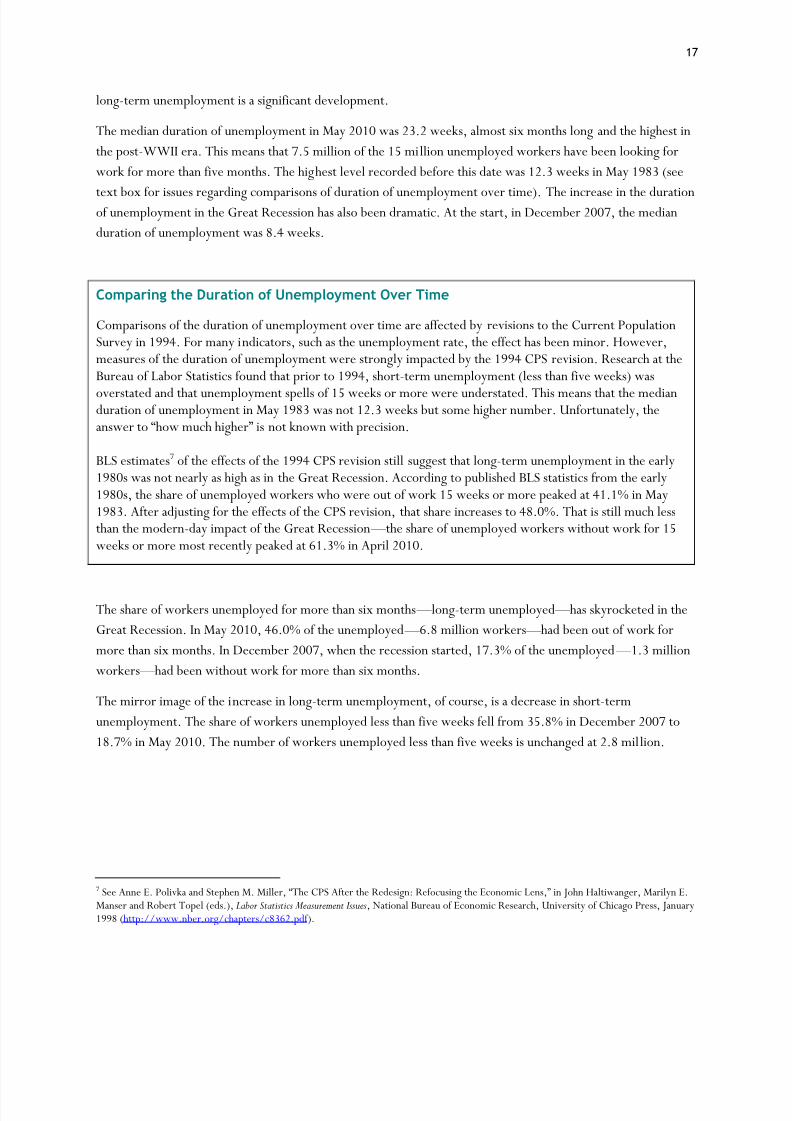
The median duration of unemployment in May 2010 was 23.2 weeks, almost six months long and the highest inthe post-WWII era. This means that 7.5 million of the 15 million unemployed workers have been looking forwork for more than five months. The highest level recorded before this date was 12.3 weeks in May 1983 (see
text box for issues regarding comparisons of duration of unemployment over time). The increase in the durationof unemployment in the Great Recession has also been dramatic. At the start, in December 2007, the medianduration of unemployment was 8.4 weeks.
The share of workers unemployed for more than six months —long-term unemployed —has skyrocketed in theGreat Recession. In May 2010, 46.0% of the unemployed —6.8 million workers —had been out of work formore than six months. In December 2007, when the recession started, 17.3% of the unemployed —1.3 millionworkers —had been without work for more than six months.
The mirror image of the increase in long-term unemployment, of course, is a decrease in short-termunemployment. The share of workers unemployed less than five weeks fell from 35.8% in December 2007 to18.7% in May 2010. The number of workers unemployed less than five weeks is unchanged at 2.8 million.
7 See Anne E. Polivka and Stephen M. Miller, ―The CPS After the Redesign: Refocusing the Economic Lens,‖ in John Haltiwanger, Marilyn E.Manser and Robert Topel (eds.),Labor Statistics Measurement Issues, National Bureau of Economic Research, University of Chicago Press, January1998 (http://www.nber.org/chapters/c8362.pdf ).
Comparing the Duration of Unemployment Over Time
Comparisons of the duration of unemployment over time are affected byrevisionsto the Current PopulationSurvey in 1994. For many indicators, such as the unemployment rate, the effect has been minor. However,measures of the duration of unemployment were strongly impacted by the 1994 CPS revision. Research at theBureau of Labor Statisticsfoundthat prior to 1994, short-term unemployment (less than five weeks) wasoverstated and that unemployment spells of 15 weeks or more were understated. This means that the medianduration of unemployment in May 1983 was not 12.3 weeks but some higher number. Unfortunately, theanswer to ―how much higher‖ is not known with precision.
BLS estimates7 of the effects of the 1994 CPS revision still suggest that long-term unemployment in the early1980s was not nearly as high as in the Great Recession. According to published BLS statistics from the early1980s, the share of unemployed workers who were out of work 15 weeks or more peaked at 41.1% in May1983. After adjusting for the effects of the CPS revision, that share increases to 48.0%. That is still much lessthan the modern-day impact of the Great Recession —the share of unemployed workers without work for 15weeks or more most recently peaked at 61.3% in April 2010.
8/8/2019 Pew Research Center Recession
http://slidepdf.com/reader/full/pew-research-center-recession 24/120
18
Percent of Unemployed Workers with Long-termDuration of UnemploymentJanuary 1970 to May 2010, seasonally adjusted
%
Percent of Unemployed Workers with Short-termDuration of UnemploymentJanuary 1970 to May 2010, seasonally adjusted %
Notes: Shaded areas depict periods of recession as determined by the NationalBureau of Economic Research. The end date for the recession that started inDecember 2007 has not yet been announced. Revisions to the CPS in 1994 affectthe comparability of data over time (see text box).Source: U.S. Bureau of Labor Statistics
7.6
26.0
16.2
46.0
0
10
20
30
40
50
60
1970 1975 1980 1985 1990 1995 2000 2005 2010
Unemployedmore than 26 weeks
52.2
31.1
38.6
18.7
0
10
20
30
40
50
60
1970 1975 1980 1985 1990 1995 2000 2005 2010
Unemployedless than 5 weeks
8/8/2019 Pew Research Center Recession
http://slidepdf.com/reader/full/pew-research-center-recession 25/120
19
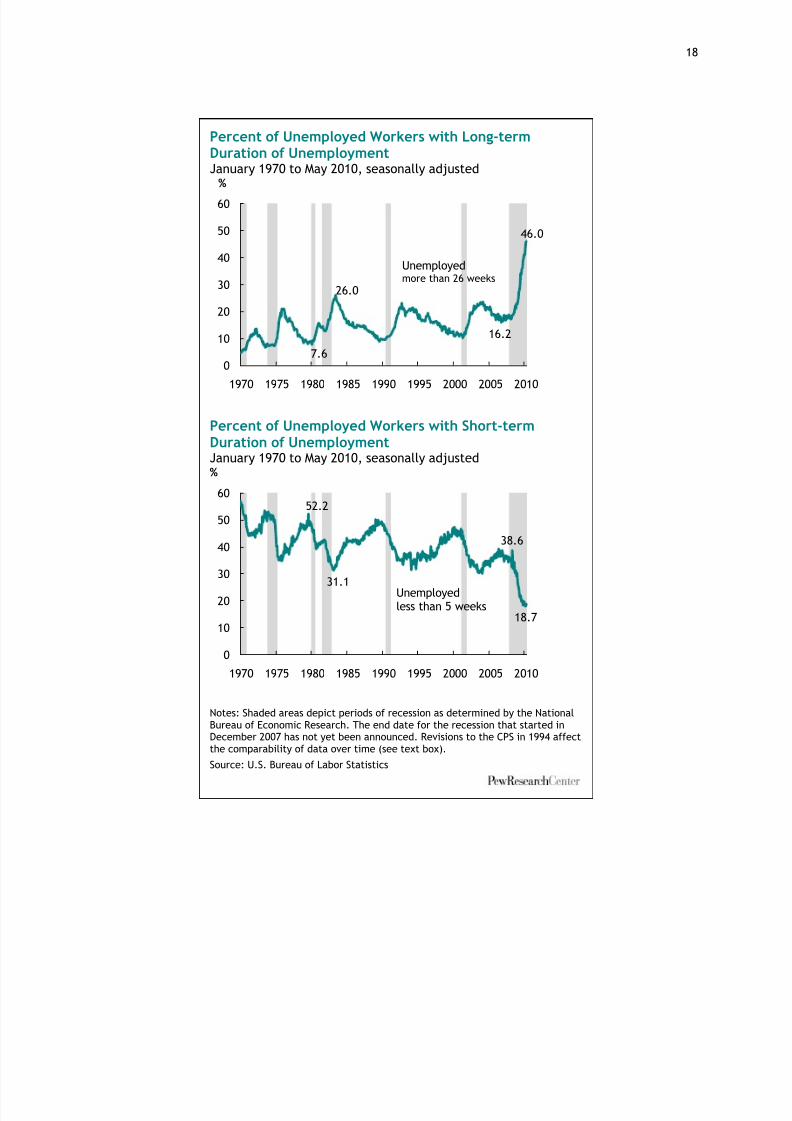
An unfortunate consequence of long-termunemployment is that it feeds upon itself —the likelihood of finding a job diminisheswith the length of time spent out of work.That is evident from the labor marketexperience of workers in March 2009depending on whether or not theyexperienced unemployment in 2008 andthe duration of that unemployment.8
Consider first the effect thatany experiencewith unemployment in 2008 has on laborforce status in 2009. Among workers whoexperienced at least one week of unemployment in 2008, one-third (33.9%)
were still unemployed in March 2009.9 That contrasts sharply with the experienceof full-year workers —those who worked atleast 48 weeks in 2008. Only 3.2% of full-year workers from 2008 were unemployedin March 2009.10
Unemployed workers who went throughlong periods without work in 2008 werethe least likely to be employed in March
2009. If a worker was unemployed for less than 12 weeks in 2008, there was a 24.8% chance that the workerwas also unemployed in March 2009. Being without a job for 12 to 24 weeks boosted the odds of unemploymentin March 2009 to 34.8%. Among workers who had been unemployed for more than 24 weeks in 2008, 41.6%were also unemployed in March 2009.11 Given the negative consequences associated with unemployment —lossin income, career interruptions, ill effects on families and health —the sharp rise in the duration of unemployment in the Great Recession is worrisome from more than one perspective.12
8 This particular analysis uses the March 2009 Annual Social and Economic Supplement (ASEC) file. In the ASEC, workers are directly askedabout their labor market experiences in the preceding calendar year. The slight disadvantage of using this file is that workers self-report theiremployment status in 2008. That could differ from the employment status ascribed to workers by the Bureau of Labor Statistics based on adifferent series of questions. 9 Some 54.5% of workers experiencing some unemployment in 2008 were employed in 2009 and an additional 11.6% had chosen to leave thelabor force, either permanently or because they were temporarily discouraged from looking for work. 10 Some 94.9% of full-year workers in 2008 were employed in 2009, and only 1.9% had left the labor force. 11 Similar evidence was presented by Jesse Rothstein, chief economist, U.S. Department of Labor, at the Economic Policy Institute (EPI) onMay 26, 2010(http://www.epi.org/publications/entry/labor_departments_jesse_rothstein_on_long-term_unemployment/). Rothsteinlooked at the change in the labor force status of workers from one month to the next in 2009. The longer a worker had been unemployed, theless likely it was that the worker was employed the nextmonth. See also Michael W. Elsby, Bart Hobijn and Aysegul Sahin, ―The Labor Marketin the Great Recession,‖ National Bureau of Economic Research, Working Paper 15979, May 2010 (http://www.nber.org/papers/w15979 ). 12 For example, see Till von Wachter and Daniel Sullivan,― Job Displacement and Mortality: An Analysis Using Administrative Data,‖ TheQuarterly Journal of Economics, Vol. 124, No. 3, August 2009: 1265-1306
Likelihood of Unemployment in March 2009,by Duration of Unemployment in 2008
Employment ShareStatus in Unemployed in
2008 March 2009 (%)
Unemployment ShareDuration Unemployed inin 2008 March 2009 (%)
Notes: Full-year workers are people who reported working at least 48weeks. Duration of unemployment in 2008 is self-reported byrespondents.Source: Pew Research Center tabulations of the Current PopulationSurvey, Annual Social and Economic Supplement, March 2009
3.2
33.9
Full-year worker, nounemployment
Unemployed one week ormore
24.8
34.8
41.6
Less than 12 weeks
12 to 24 weeks
More than 24 weeks
8/8/2019 Pew Research Center Recession
http://slidepdf.com/reader/full/pew-research-center-recession 26/120
20
Reasons for Unemployment
The duration of unemployment is also related to the reason someone is out of work. Temporary layoffs, whereworkers have an expectation of returning to their old jobs, are less likely to result in long spells of unemployment. But if unemployment is driven by permanent job cuts, meaning employers do not foresee
returning to old staffing levels, or if there is an influx of new workers in a tough economy, it is more likely thatunemployment spells will last longer.
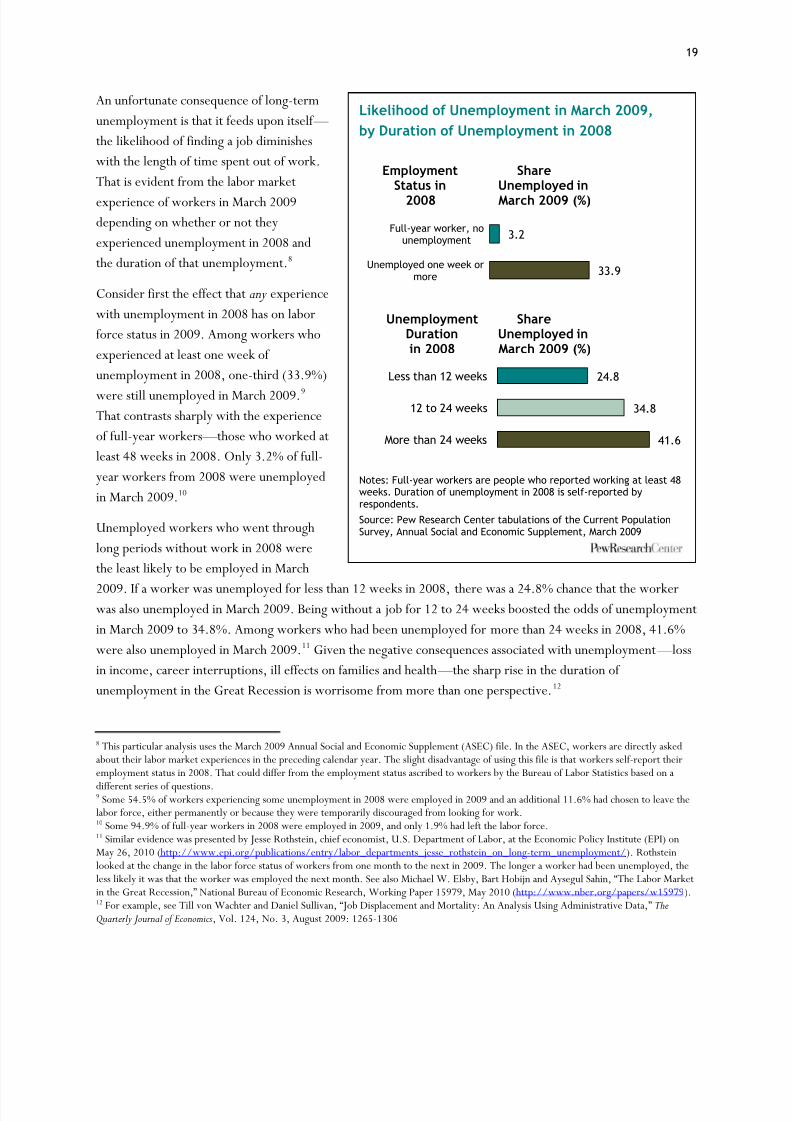
A unique feature of the Great Recession is that, for the first time, the majority of the unemployed workers hadlost their jobs for good.13 In May2010, 52.2% of unemployedworkers had lost a job for a reasonother than a temporary layoff, anincrease from 37.8% in December2007. These workers had noexpectation of recall to their old job.
The use of temporary layoffs by businesses has actually diminishedin relative importance since2007 —9.9% of unemployedworkers were on temporary layoffsin May 2010, compared with12.7% in December 2007. That isin contrast to the recessions in theearly 1980s when both temporarylayoffs and permanent job losseshad spiked.
The reason for unemployment and the duration of unemployment are closely related. Workers on temporarylayoffs are likely to have shorter spells of unemployment, and workers who have lost jobs for other reasons arelikely to face long-term unemployment.
According to the Bureau of Labor Statistics (BLS), in 2009, 7.3% of the unemployed on temporary layoff had been out of work for more than six months and 47.5% had been without work one month or less.14 At the same
time, in 2009 among other workers who lost their job involuntarily, 36.4% had been out of work for more thansix months and 16.8% had gone without work for one month or less. Thus, the fact that the majority of
(http://www.mitpressjournals.org/doi/abs/10.1162/qjec.2009.124.3.1265?journalCode=qjec), and Till von Wachter, Jae Song and JoyceManchester, ―Long-Term Earnings Losses due to Mass Layoffs During the 1982 Recession: An Analysis Using U.S. Administrative Data from1974 to 2004,‖working paper, April 2009(http://www.columbia.edu/~vw2112/papers/mass_layoffs_1982.pdf ). 13 Data on reason for unemployment are available starting in 1967. 14 These data from the BLS are available at http://www.bls.gov/cps/cpsaat29.pdf .
Temporary Layoffs and Other Involuntary Job Losses(Percent of Unemployed)January 1970 to May 2010, seasonally adjusted
%
Notes: Shaded areas depict periods of recession as determined by the NationalBureau of Economic Research. The end date for the recession that started in
December 2007 has not yet been announced. Revisions to the CPS in 1994 affectthe comparability of data over time.Source: U.S. Bureau of Labor Statistics
0
10
20
30
40
50
60
1970 1975 1980 1985 1990 1995 2000 2005 2010
Other involunt ary
job losses
Temporary layoffs
8/8/2019 Pew Research Center Recession
http://slidepdf.com/reader/full/pew-research-center-recession 27/120
21
unemployed workers have lost their jobs without possibility of recall does not bode well for the duration of unemployment in the near future.
The Discouraged and Other Underemployed
The unemployment rate, which encompasses only workers actively looking for work, can understate the extentof ―slack‖in the labor market. There are at least two other groups of workers whose ranks swell in tougheconomic times. One group, known as ―marginally attached workers,‖ includes those nolooking for work but who are available to work, are interested in work and have looked for work sometime inthe past 12 months. Discouragement in weak labor markets causes more workers to become marginallyattached.
Another group of workers captures some of the underemployed. Those are workers who would like to work fulltime but because of economic conditions are pushed into part-time work.15 The share of those ―involuntary -time workers‖ typically increases during recessions.16
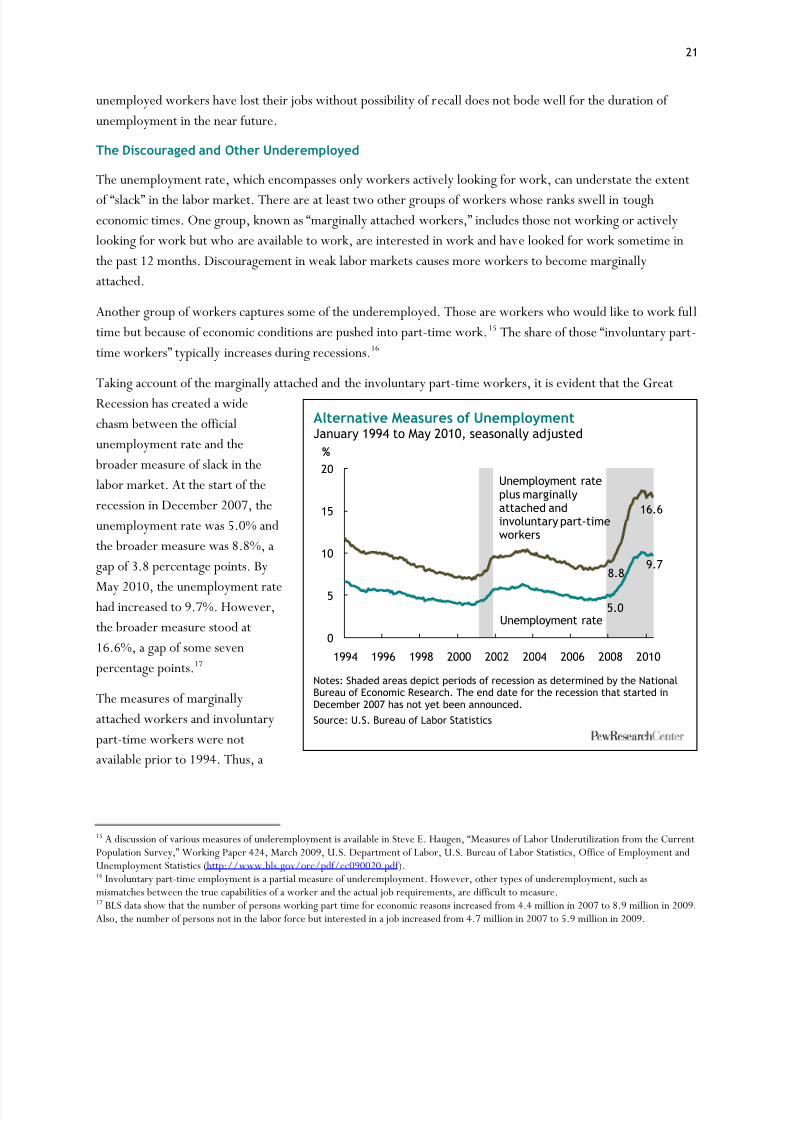
Taking account of the marginally attached and the involuntary part-time workers, it is evident that the GreatRecession has created a widechasm between the officialunemployment rate and the broader measure of slack in thelabor market. At the start of therecession in December 2007, theunemployment rate was 5.0% andthe broader measure was 8.8%, agap of 3.8 percentage points. By
May 2010, the unemployment ratehad increased to 9.7%. However,the broader measure stood at16.6%, a gap of some sevenpercentage points.17
The measures of marginallyattached workers and involuntarypart-time workers were notavailable prior to 1994. Thus, a
15 A discussion of various measures of underemployment is available in Steve E. Haugen, ―Measures of Labor Underutilization from the CurrentPopulation Survey,‖ Working Paper 424, March 2009, U.S. Department of Labor, U.S. Bureau of Labor Statistics, OffiUnemployment Statistics(http://www.bls.gov/ore/pdf/ec090020.pdf ). 16 Involuntary part-time employment is a partial measure of underemployment. However, other types of underemployment, such asmismatches between the true capabilities of a worker and the actual job requirements, are difficult to measure. 17 BLS data show that the number of persons working part time for economic reasons increased from 4.4 million in 2007 to 8.9 million in 2009.Also, the number of persons not in the labor force but interested in a job increased from 4.7 million in 2007 to 5.9 million in 2009.
Alternative Measures of UnemploymentJanuary 1994 to May 2010, seasonally adjusted
%
Notes: Shaded areas depict periods of recession as determined by the NationalBureau of Economic Research. The end date for the recession that started inDecember 2007 has not yet been announced.Source: U.S. Bureau of Labor Statistics
5.0
9.78.8
16.6
0
5
10
15
20
1994 1996 1998 2000 2002 2004 2006 2008 2010
Unemployment rate
Unemployment rateplus marginallyattached andinvoluntary part-timeworkers

8/8/2019 Pew Research Center Recession
http://slidepdf.com/reader/full/pew-research-center-recession 28/120
22
comparable measure of slack in the labor market does not exist for the recessions in the early 1980s. However,the Great Recession drove this measure as high as 17.4% in October 2009. The previous high was 11.8% in January 1994, the first date for which data on this measure are available.
Job Losses for Different Groups of Workers
The impact of a recession usually differs across groups of workers. Workers with lower levels of education or in blue-collar occupations tend to lose jobs in greater numbers. And because men are relatively more concentratedin production work, they often are on the front line of jobs lost. The same is true of minorities and youngerworkers. In these respects, the Great Recession resembles its siblings.18
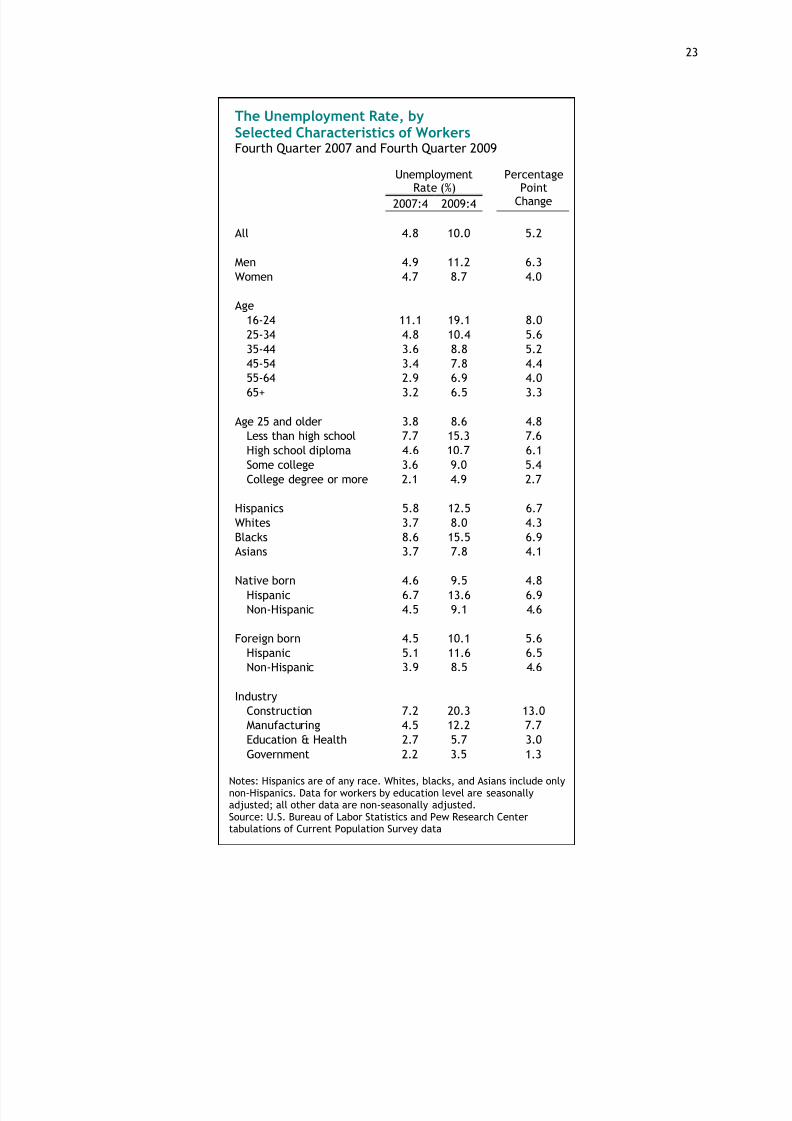
Unemployment rates at the start of the recession and two years into the recession for selected groups of workersare shown in the accompanying table. Because seasonally adjusted data are not available for all groups of workers, the data shown are for the fourth quarters in 2007 and 2009. In that two-year period, the overallunemployment rate, not seasonally adjusted, increased from 4.8% to 10.0%, a change of 5.2 percentage points.
Men have fared relatively worse than women during the recession. The unemployment rate for men in thefourth quarter of 2007 (4.9%) was similar to the rate for women (4.7%). However, at the end of 2009 theunemployment rate for men was much higher —11.2% compared with 8.7% for women.
Changes in the unemployment rate by age group show clearly that being young in the Great Recession is a severedisadvantage. About one-in-five (19.1%) workers ages 16 to 24 were unemployed in the fourth quarter of 2009.19 That was eight percentage points higher than the unemployment rate for this age group in the fourthquarter of 2007. Both the levels and changes in the unemployment rate are less sizable among older age groups.
Education is also an important factor in surviving tough economic conditions. Workers who did not complete ahigh school level of education have fared the worst. Their unemployment rate increased from 7.7% in the fourth
quarter of 2007 to 15.3% in the fourth quarter of 2009. Meanwhile, the unemployment rate of workers whohave completed college was still less than five percent in the fourth quarter of 2009.
Hispanics and blacks generally have higher than average rates of unemployment through good times and bad.The Great Recession is no exception. Job losses for Latino and black workers have been greater and theirunemployment rates have been driven much higher —12.5% for Hispanics in the fourth quarter of 2009 and15.5% for blacks.
A look at unemployment among native-born and foreign-born workers suggests, on the surface, that immigrantworkers have fared worse in the recession. In the fourth quarter of 2007, the unemployment rate for foreign- born workers (4.5%) was a smidgen less than the rate for native-born workers (4.6%). By the fourth quarter of 2009, the situation had changed —the rate for foreign-born workers was 10.1%, and the rate for native-bornworkers was 9.5%.
18 See, for example, Michael W. Elsby, Bart Hobijn and Aysegul Sahin, ―The Labor Market in the Great Recession,‖ National Bureau of Economic Research, Working Paper 15979, May 2010(http://www.nber.org/papers/w15979 ). 19 A detailed analysis of unemployment among youth is available in Kathryn Anne Edwards and Alexander Hertel-Fernandez, ―The Kids Aren‘tAlright: A Labor Market Analysis of Young Workers,‖ Economic Policy Institute, Briefing Paper 258, April 7, 2010 (http://www.epi.org/publications/entry/bp258 ).
8/8/2019 Pew Research Center Recession
http://slidepdf.com/reader/full/pew-research-center-recession 29/120
23
The Unemployment Rate, bySelected Characteristics of WorkersFourth Quarter 2007 and Fourth Quarter 2009
UnemploymentRate (%)
PercentagePoint
Change2007:4 2009:4
All 4.8 10.0 5.2
Men 4.9 11.2 6.3Women 4.7 8.7 4.0
Age16-24 11.1 19.1 8.025-34 4.8 10.4 5.635-44 3.6 8.8 5.245-54 3.4 7.8 4.455-64 2.9 6.9 4.0
65+ 3.2 6.5 3.3
Age 25 and older 3.8 8.6 4.8Less than high school 7.7 15.3 7.6High school diploma 4.6 10.7 6.1Some college 3.6 9.0 5.4College degree or more 2.1 4.9 2.7
Hispanics 5.8 12.5 6.7Whites 3.7 8.0 4.3Blacks 8.6 15.5 6.9Asians 3.7 7.8 4.1
Native born 4.6 9.5 4.8Hispanic 6.7 13.6 6.9Non-Hispanic 4.5 9.1 4.6
Foreign born 4.5 10.1 5.6Hispanic 5.1 11.6 6.5Non-Hispanic 3.9 8.5 4.6
IndustryConstruction 7.2 20.3 13.0Manufacturing 4.5 12.2 7.7Education & Health 2.7 5.7 3.0Government 2.2 3.5 1.3
Notes: Hispanics are of any race. Whites, blacks, and Asians include onlynon-Hispanics. Data for workers by education level are seasonallyadjusted; all other data are non-seasonally adjusted.Source: U.S. Bureau of Labor Statistics and Pew Research Centertabulations of Current Population Survey data

8/8/2019 Pew Research Center Recession
http://slidepdf.com/reader/full/pew-research-center-recession 30/120
24
However, closer inspection reveals that being an immigrant is not necessarilyharmful in and of itself during the GreatRecession. Latino immigrants had alower rate of unemployment thannative-born Latinos both before therecession and at the end of 2009. Thesame is true for non-Hispanicimmigrants. In other words, both withinthe Latino workforce and the non-Latino workforce, immigrants did better in the recession than native-bornworkers.
However, a very high share of the
immigrant workforce is Hispanic (50%in the fourth quarter of 2009), and arelatively small share of the native-bornworkforce is Hispanic (8% in the fourthquarter of 2009). Thus, the generalmisfortune of Latino workers, not justthe misfortune of immigrant Latinos,had a much bigger impact on theunemployment rate of foreign-bornworkers as a whole. That drove theoverall impression of a more negativeimpact on immigrants.
Changes in unemployment rates forworkers in selected industries clearlyreveal the roots of the recession. The bursting of the housing bubble morethan doubled the unemployment rateamong workers in the constructionindustry —from 7.2% in the fourthquarter of 2007 to 20.3% in the fourthquarter of 2009. But job losses in the education and health sector and the government sector were very limitedin contrast.
Which group of workers has experienced the biggest losses in the labor market from the Great Recession? Aranking of groups of workers based on the percentage point change in their unemployment rate from the fourth
The Percentage Point Change in the UnemploymentRate, by Selected Characteristics of WorkersFourth Quarter 2007 to Fourth Quarter 2009
Notes: Hispanics are of any race. Whites, blacks, and Asians include onlynon-Hispanics. Data for workers by education level are for ages 25 andolder and seasonally adjusted; all other data are non-seasonally adjusted. Source: U.S. Bureau of Labor Statistics and Pew Research Centertabulations of Current Population Survey data
2.7
3.3
4.0
4.0
4.1
4.3
4.4
4.8
5.2
5.2
5.4
5.6
5.6
6.1
6.3
6.7
6.9
7.6
8.0
College
65+
Women
55-64
Asians
White
45-54
Native born
All
35-44
Some college
Foreign born
25-34
High school
Men
Hispanics
Blacks
Less than high school
16-24
8/8/2019 Pew Research Center Recession
http://slidepdf.com/reader/full/pew-research-center-recession 31/120
25
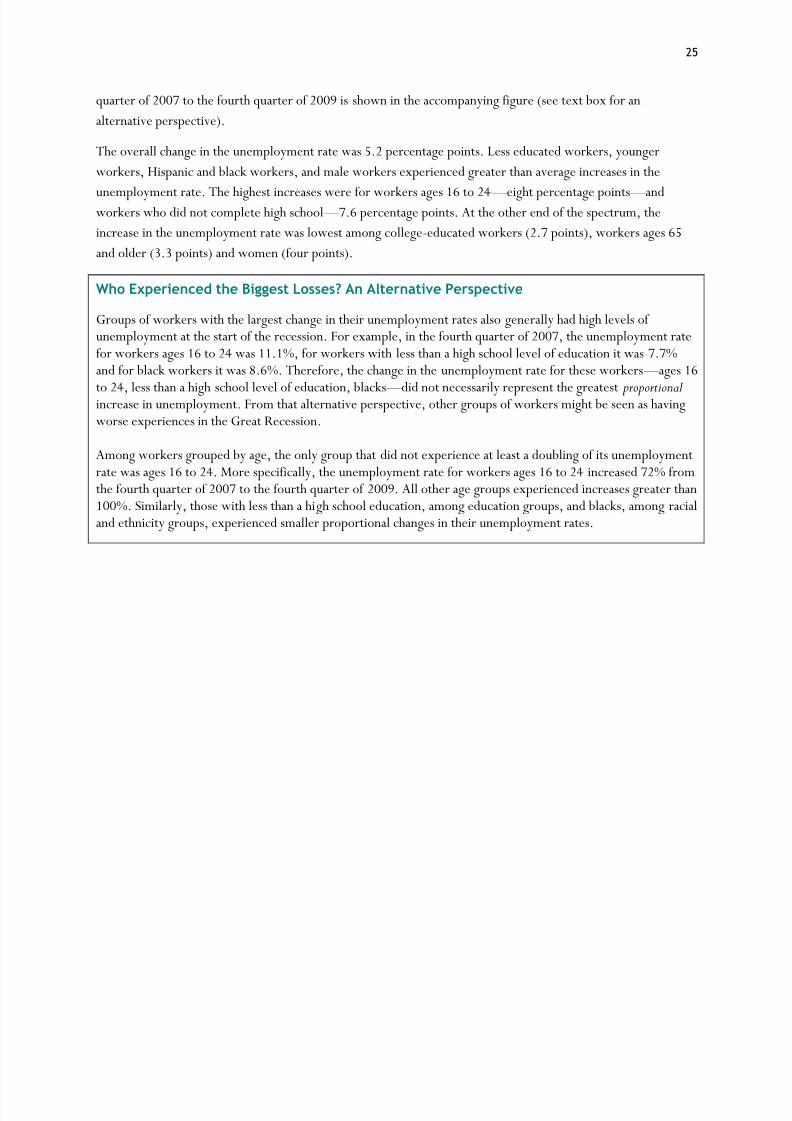
quarter of 2007 to the fourth quarter of 2009 is shown in the accompanying figure (see text box for analternative perspective).
The overall change in the unemployment rate was 5.2 percentage points. Less educated workers, youngerworkers, Hispanic and black workers, and male workers experienced greater than average increases in the
unemployment rate. The highest increases were for workers ages 16 to 24 —eight percentage points —andworkers who did not complete high school —7.6 percentage points. At the other end of the spectrum, theincrease in the unemployment rate was lowest among college-educated workers (2.7 points), workers ages 65and older (3.3 points) and women (four points).
Who Experienced the Biggest Losses? An Alternative Perspective
Groups of workers with the largest change in their unemployment rates also generally had high levels of unemployment at the start of the recession. For example, in the fourth quarter of 2007, the unemployment ratefor workers ages 16 to 24 was 11.1%, for workers with less than a high school level of education it was 7.7%and for black workers it was 8.6%. Therefore, the change in the unemployment rate for these workers —ages 16
to 24, less than a high school level of education, blacks —did not necessarily represent the greatest proportional increase in unemployment. From that alternative perspective, other groups of workers might be seen as havingworse experiences in the Great Recession.
Among workers grouped by age, the only group that did not experience at least a doubling of its unemploymentrate was ages 16 to 24. More specifically, the unemployment rate for workers ages 16 to 24 increased 72% fromthe fourth quarter of 2007 to the fourth quarter of 2009. All other age groups experienced increases greater than100%. Similarly, those with less than a high school education, among education groups, and blacks, among raciaand ethnicity groups, experienced smaller proportional changes in their unemployment rates.
8/8/2019 Pew Research Center Recession
http://slidepdf.com/reader/full/pew-research-center-recession 32/120
26
Household Finances in the Recession: Consumption, Savings, Debt and Wealth
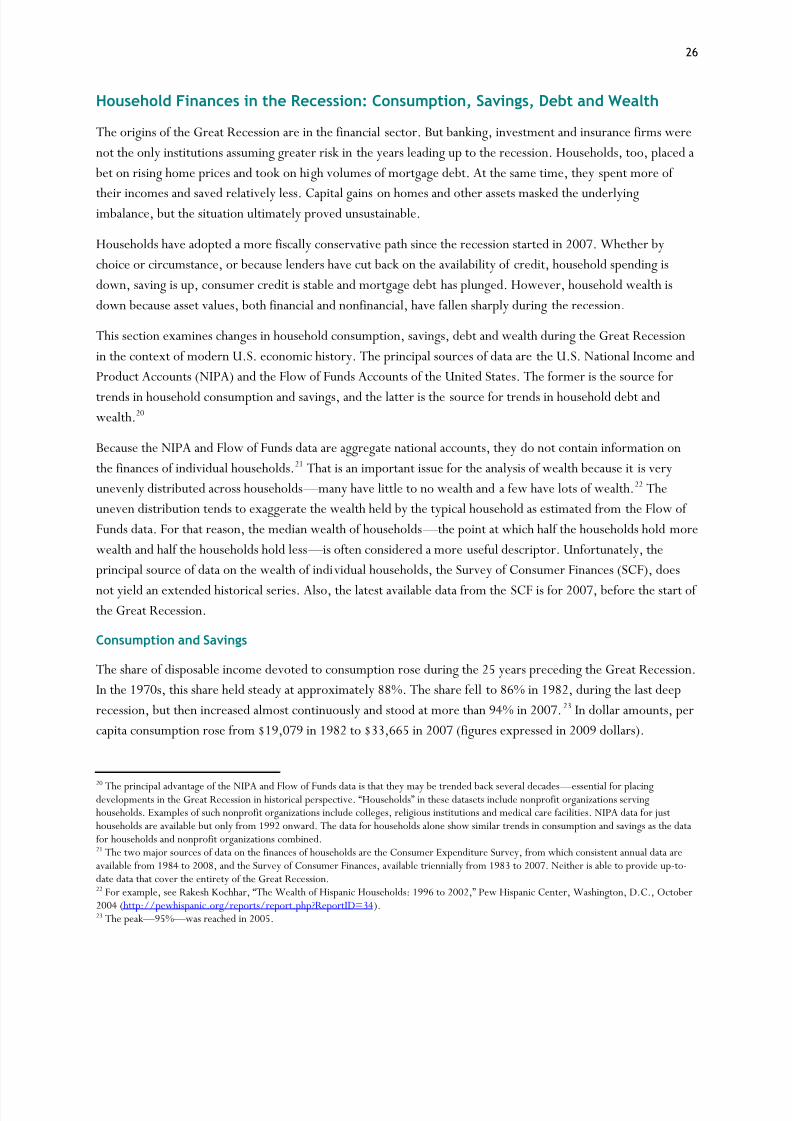
The origins of the Great Recession are in the financial sector. But banking, investment and insurance firms werenot the only institutions assuming greater risk in the years leading up to the recession. Households, too, placed a bet on rising home prices and took on high volumes of mortgage debt. At the same time, they spent more of
their incomes and saved relatively less. Capital gains on homes and other assets masked the underlyingimbalance, but the situation ultimately proved unsustainable.
Households have adopted a more fiscally conservative path since the recession started in 2007. Whether bychoice or circumstance, or because lenders have cut back on the availability of credit, household spending isdown, saving is up, consumer credit is stable and mortgage debt has plunged. However, household wealth isdown because asset values, both financial and nonfinancial, have fallen sharply during the recession.
This section examines changes in household consumption, savings, debt and wealth during the Great Recessionin the context of modern U.S. economic history. The principal sources of data are the U.S. National Income andProduct Accounts (NIPA) and the Flow of Funds Accounts of the United States. The former is the source fortrends in household consumption and savings, and the latter is the source for trends in household debt andwealth.20
Because the NIPA and Flow of Funds data are aggregate national accounts, they do not contain information onthe finances of individual households.21 That is an important issue for the analysis of wealth because it is veryunevenly distributed across households —many have little to no wealth and a few have lots of wealth.22 Theuneven distribution tends to exaggerate the wealth held by the typical household as estimated from the Flow of Funds data. For that reason, the median wealth of households —the point at which half the households hold morewealth and half the households hold less —is often considered a more useful descriptor. Unfortunately, theprincipal source of data on the wealth of individual households, the Survey of Consumer Finances (SCF), does
not yield an extended historical series. Also, the latest available data from the SCF is for 2007, before the start of the Great Recession.
Consumption and Savings
The share of disposable income devoted to consumption rose during the 25 years preceding the Great Recession.In the 1970s, this share held steady at approximately 88%. The share fell to 86% in 1982, during the last deeprecession, but then increased almost continuously and stood at more than 94% in 2007.23 In dollar amounts, percapita consumption rose from $19,079 in 1982 to $33,665 in 2007 (figures expressed in 2009 dollars).
20 The principal advantage of the NIPA and Flow of Funds data is that they may be trended back several decades —essential for placingdevelopments in the Great Recession in historical perspective. ―Households‖ in these datasets include nonprofit oservinghouseholds. Examples of such nonprofit organizations include colleges, religious institutions and medical care facilities. NIPA data for justhouseholds are available but only from 1992 onward. The data for households alone show similar trends in consumption and savings as the datafor households and nonprofit organizations combined. 21 The two major sources of data on the finances of households are the Consumer Expenditure Survey, from which consistent annual data areavailable from 1984 to 2008, and the Survey of Consumer Finances, available triennially from 1983 to 2007. Neither is able to provide up-to-date data that cover the entirety of the Great Recession. 22 For example, see Rakesh Kochhar, ―The Wealth of Hispanic Households: 1996 to 2002,‖ Pew Hispanic Center, Washington, D.C., Octo2004 (http://pewhispanic.org/reports/report.php?ReportID=34 ). 23 The peak —95% —was reached in 2005.

8/8/2019 Pew Research Center Recession
http://slidepdf.com/reader/full/pew-research-center-recession 33/120
27
As spending increased, savings tumbled.The savings rate —or the share of incomethat is saved —decreased from 10.9% in1982 to 1.7% in 2007.24 In dollaramounts, per capita saving fell from$2,426 in 1982 to $613 in 2007 (figuresexpressed in 2009 dollars).
Since the start of the recession in 2007,consumption has fallen and savings haverecovered. The share of income that isspent dropped from 94% in 2007 to 92%in 2009. Expenditures per capita, in 2009dollars, fell from $33,665 in 2007 to$32,812 in 2009, or $853 less per
person.
The savings rate has more than doubledsince the recession began. It stood at4.3% in 2009, compared with 1.7% in2007. Per capita savings, in 2009 dollars,increased from $613 in 2007 to $1,512 in2009.
The latest turnabout in consumption andsavings is not unusual for a recessionaryperiod. The share of consumption indisposable income also fell by about twopercentage points in the early 1980s.While the savings rate did not increase atthat time, it held steady at about 10percent, much higher than the currentsavings rate. After the recession in 1981-82, consumption increased and savingsfell. Whether the current ―correction‖ in household finances will last into the long term
24 The savings rate was lowest in 2005 at 1.4%.
Household Consumption and Saving as a Share of Disposable Personal Income, Annual, 1970 to 2009
Note: Shares of income devoted to consumption and savings do not total100 because of other expenses, including non-mortgage interestpayments and transfer payments.Source: Bureau of Economic Analysis, National Income and ProductAcounts, Table 2.1
70
80
90
100
1970 1980 1990 2000
88%
86%
%
Consumption96%
94%
2009
0
10
20
30
1970 1980 1990 2000
%
Savings
11%
2%
4%10%
2009
8/8/2019 Pew Research Center Recession
http://slidepdf.com/reader/full/pew-research-center-recession 34/120

8/8/2019 Pew Research Center Recession
http://slidepdf.com/reader/full/pew-research-center-recession 35/120
29
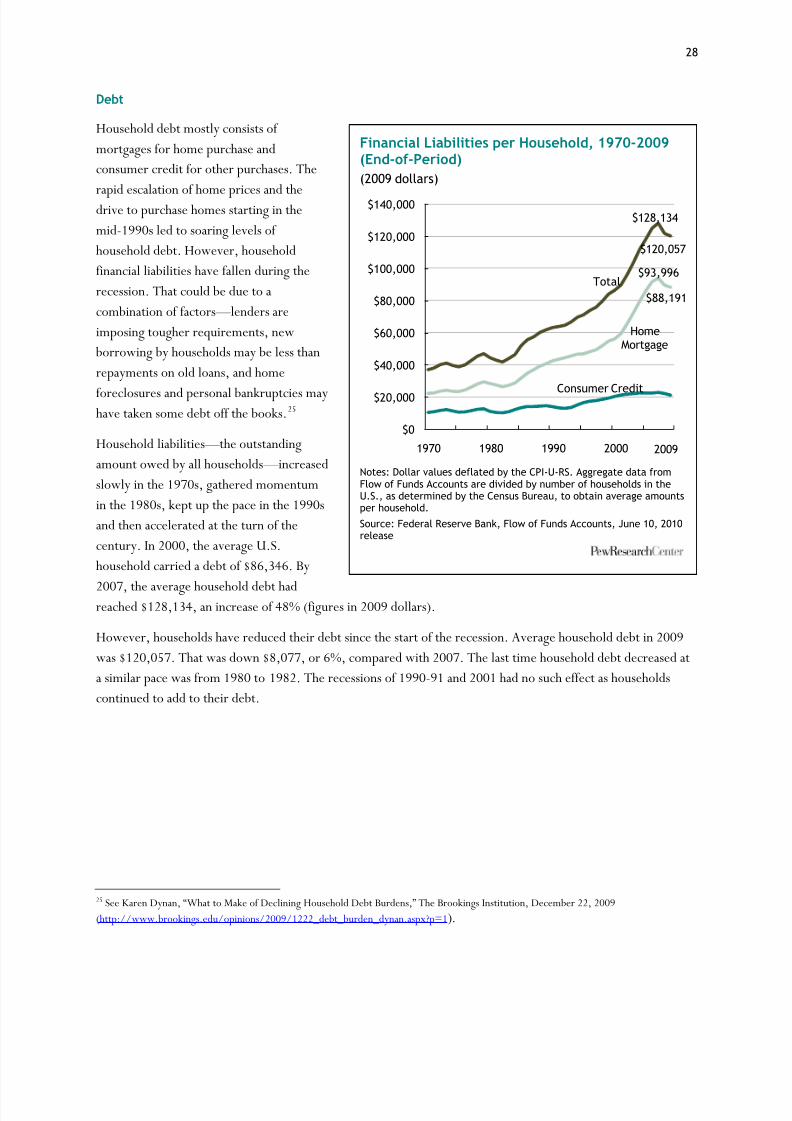
Changes to average household debt on anannual basis are closely correlated withchanges to home mortgage debt. Annualchanges to consumer credit —credit cardpurchases and the like —are generally smalland sometimes negative, meaning paymentsexceed new borrowing. Overall, consumercredit has played a minimal role in elevatingor reducing household debt.
In contrast, mortgage debt has often addeda significant amount of new debt tohousehold portfolios. It is also the reasonwhy household debt increased so acutelyfrom 2002 to 2006. However, mortgage
borrowing and, along with it, total borrowing, has fallen sharply with the onsetof the recession. In 2008, the averagehousehold reduced its level of outstandingdebt by $6,418. Of that amount, $4,431was due to a reduction in mortgage debt.
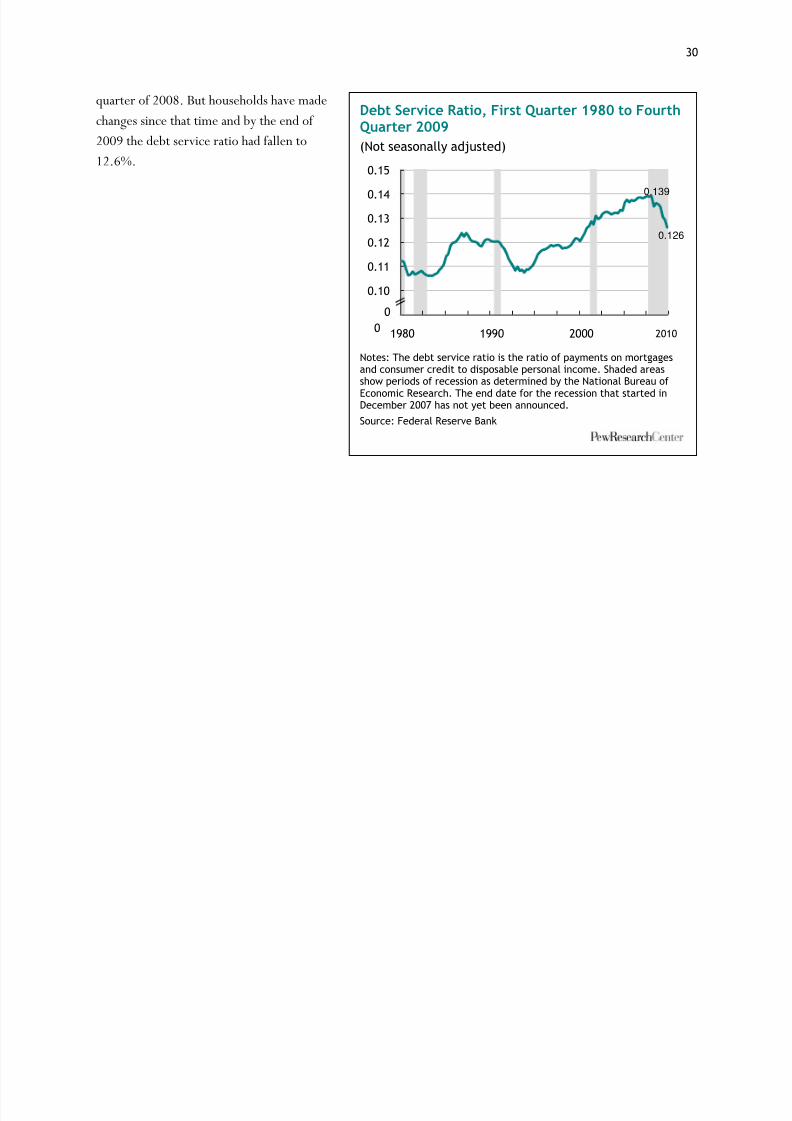
Financial stress on households can also begauged by the share of income they mustdevote to servicing their debt. That share,
known as the debt service ratio, is the ratioof payments on mortgage and consumerdebt to disposable personal income. Itreflects the debt obligations a householdmust meet each month.
The debt service ratio was relatively low inthe early 1980s —most likely a reflection of the two recessions during that period.Starting from a low point of 10.6% in the
first quarter of 1983, the ratio trended upto about 12% by 1990. The 1990-91recession caused a brief decline, but thedebt service ratio rose steadily thereafter.The recession in 2001 had no apparenteffect on debt service obligations. The highpoint for the ratio was 13.9% in the first
Change Over the Previous Year in FinancialLiabilities per Household, 1970-2009(2009 dollars)
Notes: Dollar values deflated by the CPI-U-RS. Aggregate data fromFlow of Funds Accounts are divided by number of households in theU.S., as determined by the Census Bureau, to obtain average amountsper household.Source: Federal Reserve Bank, Flow of Funds Accounts, June 10, 2010release
-$6,000
-$3,000
$0
$3,000
$6,000
$9,000
1970 1980 1990 2000
Total Liabilities
2009
-$6,000
-$3,000
$0
$3,000
$6,000
$9,000
1970 1980 1990 2000
Home Mortgage
2009
-$3,000
$0
$3,000
1970 1980 1990 2000
Consumer Credit
2009
8/8/2019 Pew Research Center Recession
http://slidepdf.com/reader/full/pew-research-center-recession 36/120
30
quarter of 2008. But households have madechanges since that time and by the end of 2009 the debt service ratio had fallen to12.6%.
Debt Service Ratio, First Quarter 1980 to FourthQuarter 2009(Not seasonally adjusted)
Notes: The debt service ratio is the ratio of payments on mortgagesand consumer credit to disposable personal income. Shaded areasshow periods of recession as determined by the National Bureau ofEconomic Research. The end date for the recession that started inDecember 2007 has not yet been announced.Source: Federal Reserve Bank
0.139
0.126
0.09
0.10
0.11
0.12
0.130.14
0.15
1980 1990 2000 2010
00

8/8/2019 Pew Research Center Recession
http://slidepdf.com/reader/full/pew-research-center-recession 37/120
31
Wealth
Wealth can be a useful buffer against thefinancial losses inflicted by unemployment.But this buffer itself has come under direct
assault during the Great Recession. In2008, the first year of the recession, meanhousehold wealth fell by more than in anyyear since WWII.26 The reason is theconfluence of a stock market crash andfalling home prices that left few householdsunscathed.
Household wealth, or net worth, is thedifference between the value of the assets ahousehold owns and the amount of its debt.This section explores historical trendsthrough the prism of mean wealth, orwealth per household. Average wealth istypically much higher than median wealth because of the concentration of high levelsof wealth in the hands of relatively fewhouseholds. A text box below explores theissue in more detail.
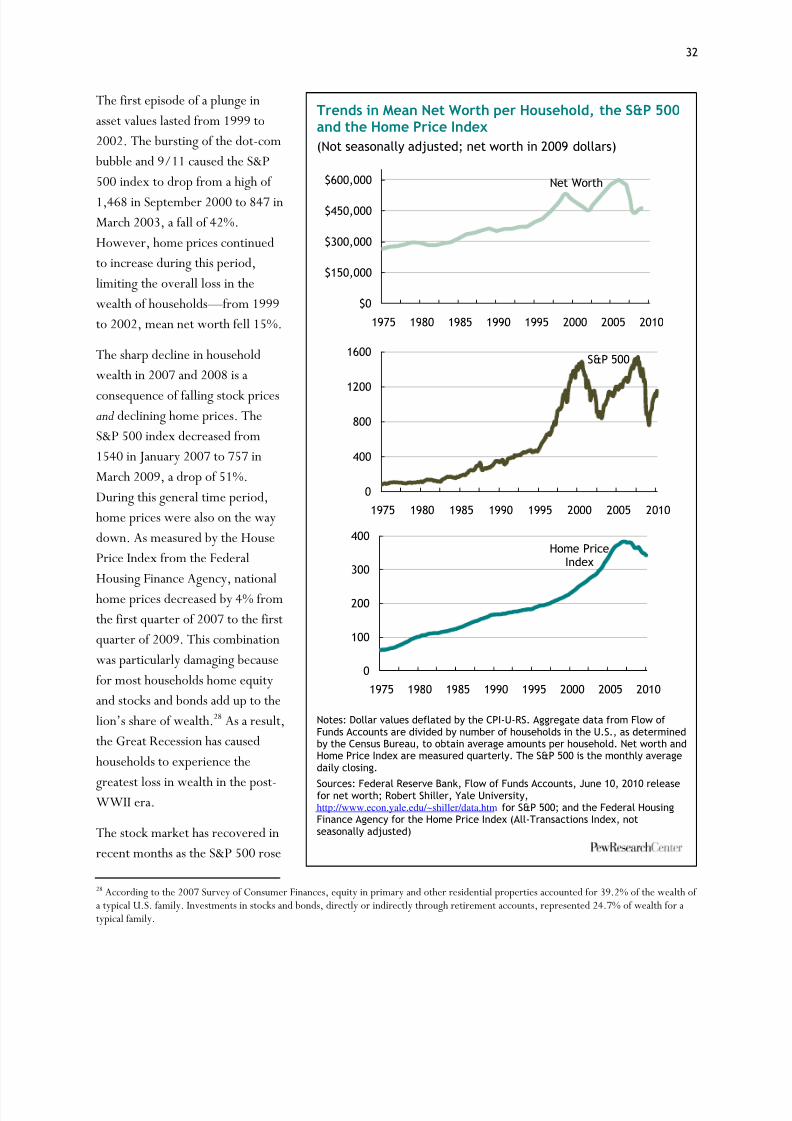
Mean wealth —net worth per household —peaked at about $600,000 in 2006 (figuresin 2009 dollars). In 2007, as home prices began to inch downward, net worth fell to$574,000, a loss of 4%. However, in 2008, average household net worth tumbled to $438,000. Thatrepresented a drop of 24%, by far the largest one-year drop since WWII.27
As shown in the accompanying figure, fluctuations in net worth are mainly a consequence of fluctuations in assetvalues. Liabilities have risen slowly and steadily over time. However, there have been two episodes of sharpdeclines in asset values since 1970, and both have led to sharp declines in net worth.
26 The severe impact of this recession on householdwealth is also analyzed by Kevin B. Moore and Michael G. Palumbo, ―TheAmerican Households in the Past Three Recessions: Evidence from the Survey of Consumer Finances,‖ Finance aussionSeries, Division of Research and Statistics and Monetary Affairs, Federal Reserve Board, Washington, D.C., December 10, 2009(http://www.federalreserve.gov/pubs/feds/2010/201006/201006pap.pdf ). 27 The previous high for a one-year drop in average household wealth was 11.2% in 1974 in the midst of a 16-month recession.
Mean Assets, Liabilities and Net Worth perHousehold, 1970-2009(2009 dollars)
Notes: Dollar values deflated by the CPI-U-RS. Aggregate data fromFlow of Funds Accounts are divided by number of households in theU.S., as determined by the Census Bureau, to obtain average amountsper household.Source: Federal Reserve Bank, Flow of Funds Accounts, June 10, 2010release
$599,234
$437,656
$0
$100,000
$200,000
$300,000
$400,000
$500,000
$600,000
$700,000
$800,000
1970 1980 1990 2000
AssetsNet Worth
Liabilities
2009
8/8/2019 Pew Research Center Recession
http://slidepdf.com/reader/full/pew-research-center-recession 38/120
32
The first episode of a plunge inasset values lasted from 1999 to2002. The bursting of the dot-com bubble and 9/11 caused the S&P500 index to drop from a high of 1,468 in September 2000 to 847 inMarch 2003, a fall of 42%.However, home prices continuedto increase during this period,limiting the overall loss in thewealth of households —from 1999to 2002, mean net worth fell 15%.
The sharp decline in householdwealth in 2007 and 2008 is a
consequence of falling stock pricesand declining home prices. TheS&P 500 index decreased from1540 in January 2007 to 757 inMarch 2009, a drop of 51%.During this general time period,home prices were also on the waydown. As measured by the HousePrice Index from the FederalHousing Finance Agency, nationalhome prices decreased by 4% fromthe first quarter of 2007 to the firstquarter of 2009. This combinationwas particularly damaging becausefor most households home equityand stocks and bonds add up to thelion‘s share of wealth.28 As a result,the Great Recession has causedhouseholds to experience the
greatest loss in wealth in the post-WWII era.
The stock market has recovered inrecent months as the S&P 500 rose
28 According to the 2007 Survey of Consumer Finances, equity in primary and other residential properties accounted for 39.2% of the wealth of a typical U.S. family. Investments in stocks and bonds, directly or indirectly through retirement accounts, represented 24.7% of wealth for atypical family.
Trends in Mean Net Worth per Household, the S&P 500and the Home Price Index(Not seasonally adjusted; net worth in 2009 dollars)
Notes: Dollar values deflated by the CPI-U-RS. Aggregate data from Flow ofFunds Accounts are divided by number of households in the U.S., as determinedby the Census Bureau, to obtain average amounts per household. Net worth andHome Price Index are measured quarterly. The S&P 500 is the monthly averagedaily closing.
Sources: Federal Reserve Bank, Flow of Funds Accounts, June 10, 2010 releasefor net worth; Robert Shiller, Yale University,http://www.econ.yale.edu/~shiller/data.htm for S&P 500; and the Federal HousingFinance Agency for the Home Price Index (All-Transactions Index, notseasonally adjusted)
$0
$150,000
$300,000
$450,000
$600,000
1975 1980 1985 1990 1995 2000 2005 2010
Net Worth
0
400
800
1200
1600
1975 1980 1985 1990 1995 2000 2005 2010
S&P 500
0
100
200
300
400
1975 1980 1985 1990 1995 2000 2005 2010
Home PriceIndex
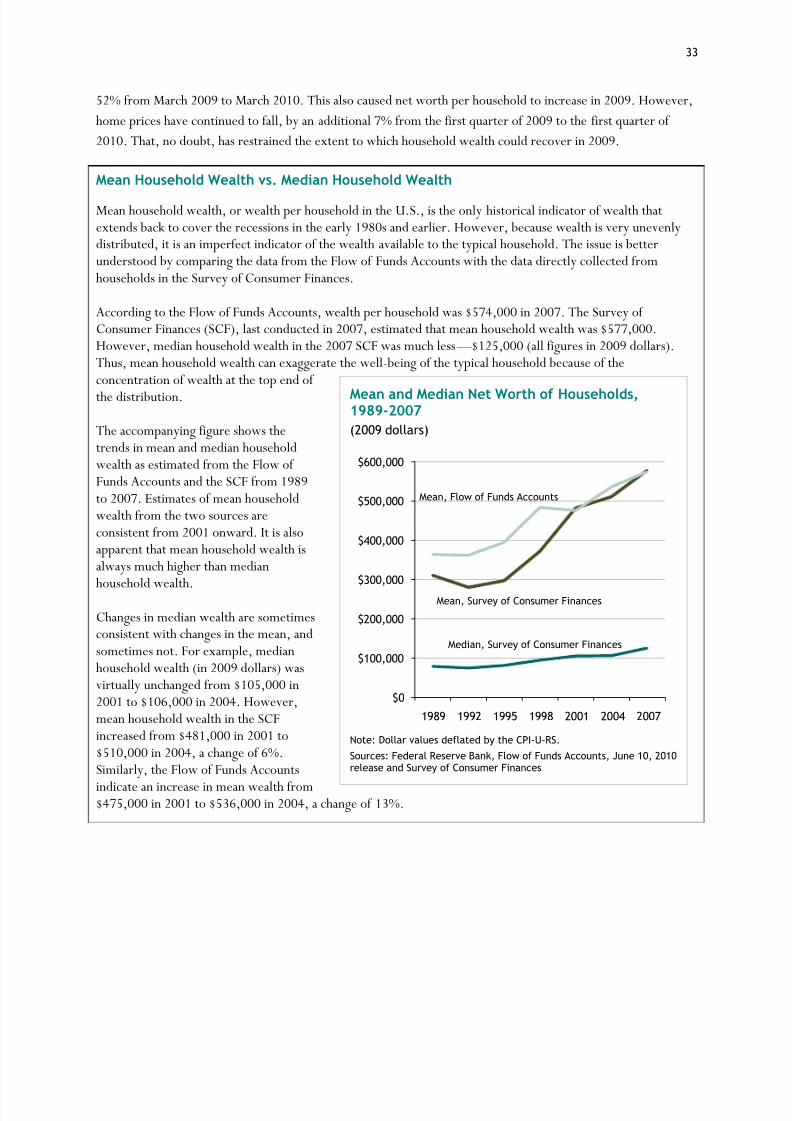
8/8/2019 Pew Research Center Recession
http://slidepdf.com/reader/full/pew-research-center-recession 39/120
33
52% from March 2009 to March 2010. This also caused net worth per household to increase in 2009. However,home prices have continued to fall, by an additional 7% from the first quarter of 2009 to the first quarter of 2010. That, no doubt, has restrained the extent to which household wealth could recover in 2009.
Mean Household Wealth vs. Median Household Wealth
Mean household wealth, or wealth per household in the U.S., is the only historical indicator of wealth thatextends back to cover the recessions in the early 1980s and earlier. However, because wealth is very unevenlydistributed, it is an imperfect indicator of the wealth available to the typical household. The issue is betterunderstood by comparing the data from the Flow of Funds Accounts with the data directly collected fromhouseholds in the Survey of Consumer Finances.
According to the Flow of Funds Accounts, wealth per household was $574,000 in 2007. The Survey of Consumer Finances (SCF), last conducted in 2007, estimated that mean household wealth was $577,000.However, median household wealth in the 2007 SCF was much less —$125,000 (all figures in 2009 dollars).Thus, mean household wealth can exaggerate the well-being of the typical household because of theconcentration of wealth at the top end of the distribution.
The accompanying figure shows thetrends in mean and median householdwealth as estimated from the Flow of Funds Accounts and the SCF from 1989to 2007. Estimates of mean householdwealth from the two sources areconsistent from 2001 onward. It is alsoapparent that mean household wealth isalways much higher than median
household wealth.Changes in median wealth are sometimesconsistent with changes in the mean, andsometimes not. For example, medianhousehold wealth (in 2009 dollars) wasvirtually unchanged from $105,000 in2001 to $106,000 in 2004. However,mean household wealth in the SCFincreased from $481,000 in 2001 to$510,000 in 2004, a change of 6%.Similarly, the Flow of Funds Accountsindicate an increase in mean wealth from$475,000 in 2001 to $536,000 in 2004, a change of 13%.
Mean and Median Net Worth of Households,1989-2007(2009 dollars)
Note: Dollar values deflated by the CPI-U-RS.Sources: Federal Reserve Bank, Flow of Funds Accounts, June 10, 2010release and Survey of Consumer Finances
$0
$100,000
$200,000
$300,000
$400,000
$500,000
$600,000
1989 1992 1995 1998 2001 2004 2007
Mean, Flow of Funds Accounts
Mean, Survey of Consumer Finances
Median, Survey of Consumer Finances

8/8/2019 Pew Research Center Recession
http://slidepdf.com/reader/full/pew-research-center-recession 40/120
34
Wealth of Households by Income, Race and Ethnicity
As noted above, one aspect of wealth is that it is very unevenly distributed. Upper-income households have lotsof it, and lower income households have virtually none. Similarly, the net worth of white households is far inexcess of the wealth of black and Hispanic households.29 Thus, whether or not the Great Recession has
sharpened these inequities is an important question.This question can be addressed tentatively with data from the PSID.30 The PSID is conducted every two years,and it collected data on family wealth in 2007 and 2009. A preliminary file for 2009 was released ahead of schedule so that researchers could examine the impact of the Great Recession on household wealth. It isimportant to note that the early version of the 2009 PSID lacks updated weights, current income andimputations for missing values. The file is also subject to further editing before its final release. Because theestimates that may be derived from the PSID are tentative, this section discusses only the suggested changes inhousehold wealth, not the levels.
Subject to the caveats noted, PSID data indicate that median household wealth decreased by 19% from 2007 to
2009. That is consistent with the drop in mean household wealth. As estimated from the Flow of FundsAccounts, mean household wealth decreased by 20% from 2007 to 2009. The change in median wealth did vary by the income strata of the household. Lower-income households, which hold few assets in general, experienceda loss of 7%. The median wealth of upper-income households, which possess more diverse portfolios, decreased by 12%. The median wealth of middle-income households, which are more dependent on home equity, dropped by 23%.31
Preliminary evidence from the PSID also suggests that the Great Recession caused a greater proportionaldecrease in the median wealth of Hispanic and black households —down by 52% and 30%, respectively —than inthe wealth of white households, which was down by 9%. One reason for this might be that minority households
have been subject to greater exposure to subprime home loans and property foreclosures in recent years.32
Another reason might be that minorities have experienced a greater extent of job losses. Research finds thathouseholds experiencing unemployment also experience sharp drops in wealth.33 The combined force of the twoeffects —loss in wealth and greater job losses in the recession —means that the road to recovery for minoritiesmay be more arduous.
29 Rakesh Kochhar, ―The Wealth of Hispanic Households: 1996 to 2002,‖ Pew Hispanic Center, Washington, D.C ber 2004
(http://pewhispanic.org/reports/report.php?ReportID=34 ). 30 The PSID, started in 1968, is a longitudinal study of U.S. families, that is, it follows the same families and individual members of thosefamilies over time. It features an oversample of low-income families. The original sample size was about 4,800 families, and it has grown sinceto about 8,000 families today. A refresher sample of immigrant families was added in 1997 to keep the study representative of the U.S.population. The study is conducted at the Survey Research Center, Institute for Social Research, University of Michigan. 31 The classification of households into upper-, middle- and lower-income strata uses the methodology described in ―Inside the MiBad Time Hit the Good Life,‖ Pew Research Center, Social and Demographic Trends, April 2008 (http://pewsocialtrends.org/pubs/706/middle-class-poll). 32 Rakesh Kochhar, Ana Gonzalez-Barrera and Daniel Dockterman, ―Through Boom and Bust: Minorities, Immigrants andPew Hispanic Center, Washington, D.C., May 12, 2009(http://pewhispanic.org/reports/report.php?ReportID=109 ). 33 Jonathan Gruber, ―The Wealth of the Unemployed,‖Industrial and Labor Relations Review , Vol. 55, No. 1, October 2001, 79-94.

8/8/2019 Pew Research Center Recession
http://slidepdf.com/reader/full/pew-research-center-recession 41/120
35
Chapter 3: The Slow Road to Recovery
In March of 2009, Federal Reserve Board Chairman BenBernanke said he saw the first ―green shoots‖ of an economicrecovery —one that he predicted would―pick up steam‖ over
time. But more than a year later, almost no one in America believes the recession is over. Most stillcan‘t even spotthegreen shoots.
The latest Pew Research survey finds that a majority of Americans (54%) believe the economy is still in a recession.About four-in-ten (41%) say they think the economy isstarting to come out of the recession. Just 3% say therecession is over.
The public is also downbeat when asked to rate overalleconomic conditions in the country today. Just 1% say theeconomy is in excellent shape, and 14% say it is in goodshape. Nearly half (46%) say it is ―only fair,‖ and 38% say it is―poor.‖
However, even though thoseassessments tilt negative, they arethe least negative readings since January 2008, just as the recessionwas beginning. The 38% whocurrently rate the U.S. economy as―poor‖ represents a significant dropfrom the 53% who said that asrecently as March 2010 and the71% who said it in February2009 —the low point in moderntimes for the public‘s assessment of the nation‘s economic conditions.
Likewise, the 15% who now say the
economy is excellent or good arenearly quadruple the share (4%)who said that in February of 2009.
So at least by these trend measures, some green shoots in the public‘s confidence in the economy afinallystarting to sprout —albeit more than a year after that initial sighting by Bernanke.
Ratings of the Economy Turn Less Negative% saying the U.S. economy is …
Note: “Only fair” and “Don‟t know/Refused” responses are not shown.
0
20
40
60
80
Dec-06 Dec-07 Dec-08 Dec-09
Excellent/Good Poor
May-10
Recession began, Dec '07
Most Say the Recession Continues% saying the U.S. economy is …
Note: “Don‟t know/Refused” responses areincluded but not labeled.
54%
41%3%
Still in recession
Starting to recover
Recessionis over

8/8/2019 Pew Research Center Recession
http://slidepdf.com/reader/full/pew-research-center-recession 42/120
36
This hedged and still somewhatambiguous verdict from the court of public opinion is also evident in responseto another survey question that askspeople about the long-term impact of the recession on the U.S. economy.
Fully seven-in-ten respondents say therecession has caused major changes inthe economy, while just 21% say it hascaused minor changes. The rest say ithasn‘t caused any changes (6%) orhaveno opinion (3%). However, mostAmericans (61%) say these changes willprove to be temporary. This is true both
for the respondents who see majorchanges (by a ratio of more than two-to-one, they see temporary rather thanpermanent change) and those who seeminor changes (by a ratio of about four-to-one, they see temporary rather than permanent change).
The majorityview that the recession‘s impact on the economy won‘t be permanent is in syncnotable finding from this survey. Respondents were asked if they agreed or disagreed with the followingstatement: ―Although there may be bad times every now and then, America will always
prosperous and make economic progress.‖
Even in today‘s bad economy, those who agree with the statement (63%) outnumber thosisagree (31%) by a ratio of about two-to-one.
This question was asked four different times in the early and mid-1990s,34 at a time of steady economic growthand relatively low unemployment. Today‘s responses are not much different from those re back then —suggesting thatthe public‘s basic faith in the long-term prosperity of America is resilient enough to withstand along bout of hard times. (At the same time, there was a much more positive reading on this question in 1987,when the economy had been in a robust expansion for several years. In that survey, 71% of respondents agreedwith the statement, while just 11% disagreed.)
Different Groups, Different Perspectives
Different groups of Americans have markedly different views about the impact of this recession. Some of thesedifferences are predictable. For example, those who have been personally hard-hit by the recession (as a result of
34 The earlier surveys that included this question were conducted by Cambridge Reports/Research International.
Is America Still a Land of Prosperity?% who say they …
Note: The 1987,1992, 1993,1994,1995 numbers are from CambridgeReports/Research International.Question wording: “Do you agree or disagree: „Although there may be badtimes every now and then, America will always continue to be prosperousand make economic progress‟?”
6371
31
110
20
40
60
80
1985 1990 1995 2000 2005 2010
Agree Disagree

8/8/2019 Pew Research Center Recession
http://slidepdf.com/reader/full/pew-research-center-recession 43/120
37
the loss of income, wealth or employment) tendto have a more downbeat view of the nationaleconomythan do those who‘ve escapedrelatively unscathed.
But some group differences play against type andcircumstance. For example, blacks andHispanics have a much more upbeat view of thenational economy than do whites —despite thefact that most economic evidence shows thatthese minority groups have felt the sting of therecession more sharply than have whites.
Similarly, young adults are more upbeat thanmiddle-aged and older adults about the
economy, even though they have suffered more job losses than any other age group. And onsome measures, those with only a high schooldiploma are more optimistic about the economythan those who have a college degree —though,here again, the former group is the one that has been hit harder by the downturn.
The survey also finds a significant variance bypartisanship in the public‘s views about theeconomy. Democrats are more upbeat thanRepublicans, even though they tend to have lessincome and wealth.
The remainder of this section explores ingreater detail the group differences on all these questions.
That Recession: Is It Over Yet?
While just over half (54%) of the full population of adults say that the economy is still in a recession, notabledifferences exist by race, age and, especially, partisanship.
Some 57% of whites say the economy is still in a recession, compared with just 45% of blacks and 43% of Hispanics. In fact, among those latter two groups, about the same share say the economy is beginning to recoverfrom the recession (47% of blacks; 46% of Hispanics) as say the recession continues. Whites, by contrast, say bya ratio of about three-to-two that the economy is still in a recession.
Young adults are the least likely age group to say the economy is still in a recession. Some 47% of 18- to 29-year-olds say so, compared with 57% of those ages 30-64 and 51% of those 65 and older.
Most Americans Say the Recession Continues% saying the U.S. economy is …
Note: “Don‟t know/Refused” responses are not shown.
54
57
45
43
47
57
57
51
63
43
55
73
54
42
41
38
47
46
46
38
39
40
33
51
40
24
43
51
3
2
5
5
5
2
2
4
3
3
2
2
2
4
All
White
Black
Hispanic
18-29
30-49
50-64
65+
Republican
Democrat
Independent
Big impact
Small impact
No impact
Still in recession Starting to recover Recession is over
Inpact of recession on career
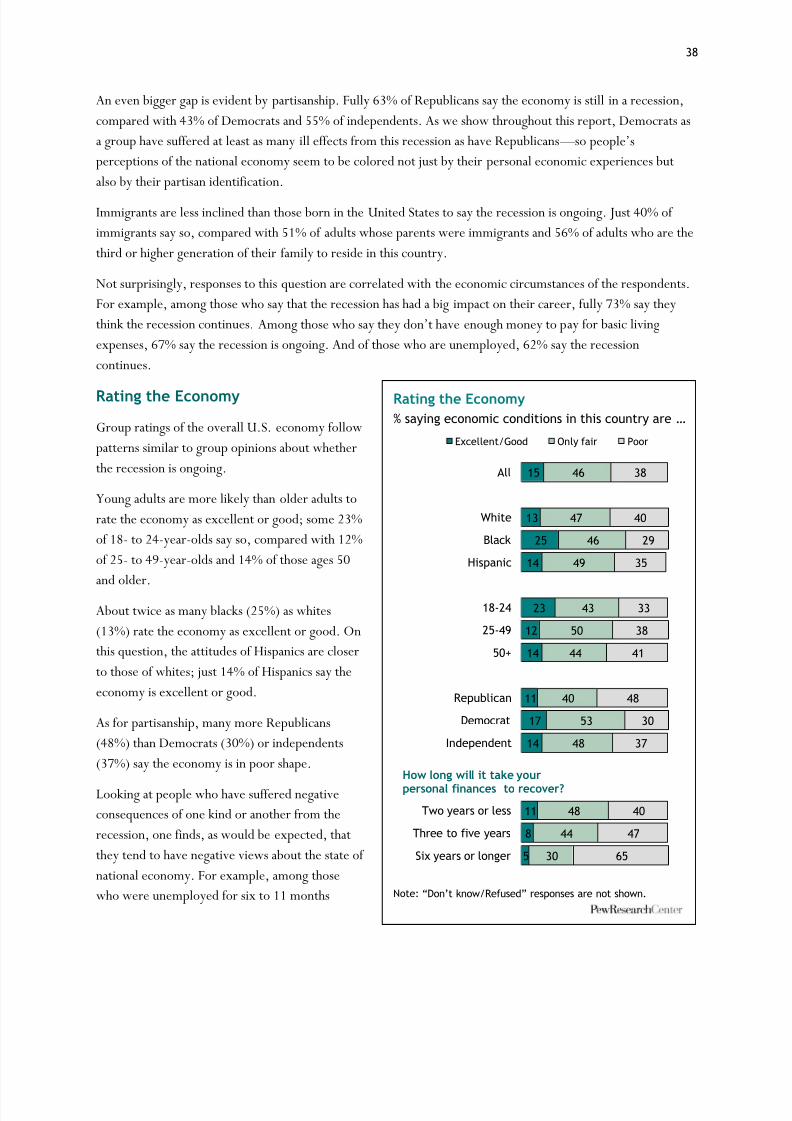
8/8/2019 Pew Research Center Recession
http://slidepdf.com/reader/full/pew-research-center-recession 44/120
38
An even bigger gap is evident by partisanship. Fully 63% of Republicans say the economy is still in a recession,compared with 43% of Democrats and 55% of independents. As we show throughout this report, Democrats asa group have suffered at least as many ill effects from this recession as have Republicans —so people‘sperceptions of the national economy seem to be colored not just by their personal economic experiences butalso by their partisan identification.
Immigrants are less inclined than those born in the United States to say the recession is ongoing. Just 40% of immigrants say so, compared with 51% of adults whose parents were immigrants and 56% of adults who are thethird or higher generation of their family to reside in this country.
Not surprisingly, responses to this question are correlated with the economic circumstances of the respondents.For example, among those who say that the recession has had a big impact on their career, fully 73% say theythink the recession continues.Among those who say they don‘t have enough money to pay for basic livingexpenses, 67% say the recession is ongoing. And of those who are unemployed, 62% say the recessioncontinues.
Rating the Economy
Group ratings of the overall U.S. economy followpatterns similar to group opinions about whetherthe recession is ongoing.
Young adults are more likely than older adults torate the economy as excellent or good; some 23%of 18- to 24-year-olds say so, compared with 12%of 25- to 49-year-olds and 14% of those ages 50and older.
About twice as many blacks (25%) as whites(13%) rate the economy as excellent or good. Onthis question, the attitudes of Hispanics are closerto those of whites; just 14% of Hispanics say theeconomy is excellent or good.
As for partisanship, many more Republicans(48%) than Democrats (30%) or independents(37%) say the economy is in poor shape.
Looking at people who have suffered negativeconsequences of one kind or another from therecession, one finds, as would be expected, thatthey tend to have negative views about the state of national economy. For example, among thosewho were unemployed for six to 11 months
Rating the Economy% saying economic conditions in this country are …
Note: “Don‟t know/Refused” responses are not shown.
15
13
25
14
23
12
14
11
17
14
11
8
5
46
47
46
49
43
50
44
40
53
48
48
44
30
38
40
29
35
33
38
41
48
30
37
40
47
65
All
White
Black
Hispanic
18-24
25-49
50+
Republican
Democrat
Independent
Two years or less
Three to five years
Six years or longer
Excellent/Good Only fair Poor
How long will it take yourpersonal finances to recover?

8/8/2019 Pew Research Center Recession
http://slidepdf.com/reader/full/pew-research-center-recession 45/120
39
during the recession but are currentlyemployed, 53% say the economy is in poorshape. Of those who say the recession has had a big impact on their career, 56% rate theeconomy as poor. And of those who say it willtake their finances six years or more to recoverfrom the effects of the recession, 65% rate theeconomy as poor.
The Recession: How Big an Impact?How Lasting?
The plurality view of the public is that therecession has caused major changes in the U.S.economy but that these changes will prove to
be temporary. Some 45% of all adults hold thisview. An additional 18% say they believe thechanges will be both major and permanent.Meantime, 16% believe they will be minor andtemporary, 6% say there have been no changesand 4% say the changes will be minor butpermanent.
Group differences on the question are mostreadily seen by looking at the characteristics of
those who take the most negative view —thatis, the 18% who believe that the changes to theU.S. economy wrought by the recession havealready been major and will prove to bepermanent.
Here again, whites have a more pessimisticview than do minorities. Some 19% of whites believe the changes will prove to be bothmajor and permanent, compared with just 12%of both blacks and Hispanics. The familiarpartisan pattern also plays out, withRepublicans (22%) more pessimistic thanDemocrats (12%) or independents (18%).Given that minorities tend to self-identify muchmore as Democrats than as Republicans, theseracial and partisan group differences appear to
Which Groups See Major, Permanent Changesin the U.S. Economy?%
18
19
12
12
13
16
21
22
20
14
22
12
18
All
White
Black
Hispanic
18-24
25-49
50+
College grad or more
Some college
High school or less
Republican
Democrat
Independent
How Has the Recession Changed the U.S.Economy —and for How Long?% saying
Major change 70 Permanent 18Temporary 45Some permanent, others temporary(VOL.) 4
Minor change 21 Permanent 4Temporary 16Some permanent, others temporary(VOL.) *
Hasn‟t changed the ecnomy 6
Note: “Don‟t know/Refused” responses are not shown. * indicting percentage less than 0.5.
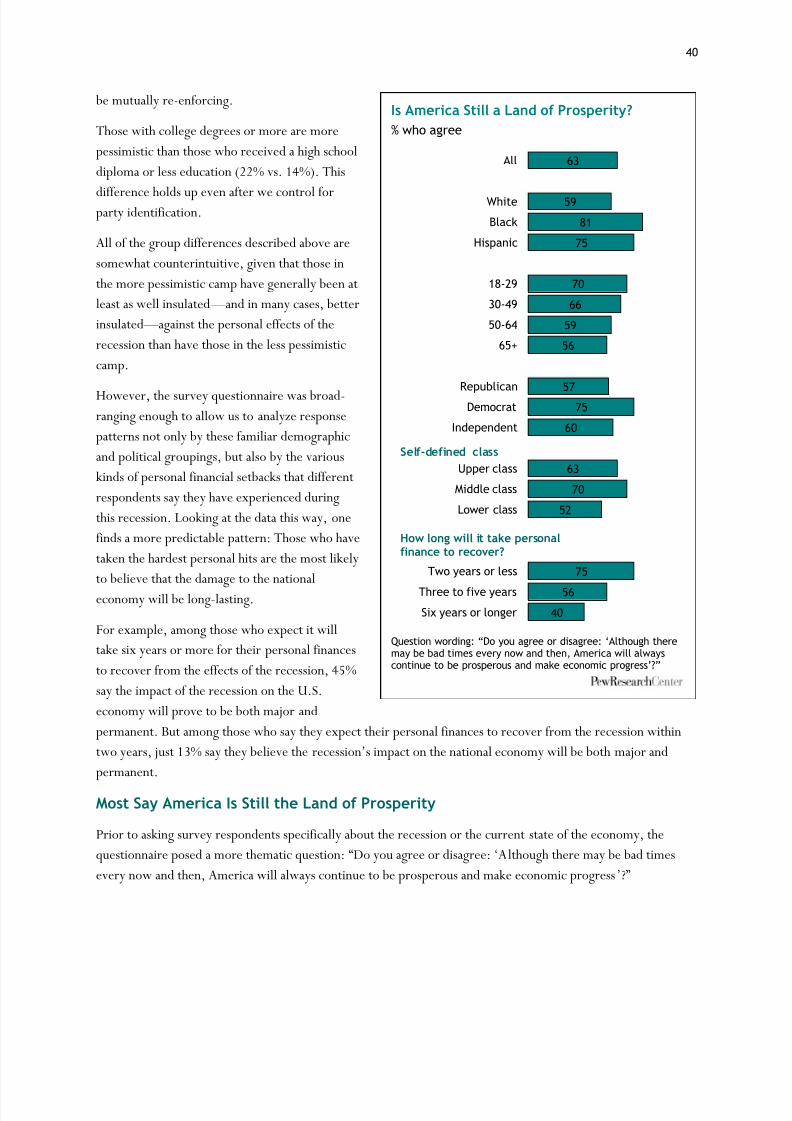
8/8/2019 Pew Research Center Recession
http://slidepdf.com/reader/full/pew-research-center-recession 46/120
40
be mutually re-enforcing.
Those with college degrees or more are morepessimistic than those who received a high schooldiploma or less education (22% vs. 14%). This
difference holds up even after we control forparty identification.
All of the group differences described above aresomewhat counterintuitive, given that those inthe more pessimistic camp have generally been atleast as well insulated —and in many cases, betterinsulated —against the personal effects of therecession than have those in the less pessimisticcamp.
However, the survey questionnaire was broad-ranging enough to allow us to analyze responsepatterns not only by these familiar demographicand political groupings, but also by the variouskinds of personal financial setbacks that differentrespondents say they have experienced duringthis recession. Looking at the data this way, onefinds a more predictable pattern: Those who havetaken the hardest personal hits are the most likelyto believe that the damage to the nationaleconomy will be long-lasting.
For example, among those who expect it willtake six years or more for their personal financesto recover from the effects of the recession, 45%say the impact of the recession on the U.S.economy will prove to be both major andpermanent. But among those who say they expect their personal finances to recover from the recession withintwo years, just 13% say they believe the recession‘s impact on the national economy will permanent.
Most Say America Is Still the Land of Prosperity
Prior to asking survey respondents specifically about the recession or the current state of the economy, thequestionnaire posed a more thematic question:―Do you agree or disagree: ‗Although there may be bad timesevery now and then, America will always continue to be prosperous and make economic progress‘?‖
Is America Still a Land of Prosperity?% who agree
Question wording: “Do you agree or disagree: „Although theremay be bad times every now and then, America will alwayscontinue to be prosperous and make economic progress‟?”
63
59
81
75
70
66
59
56
5775
60
63
70
52
75
5640
All
White
Black
Hispanic
18-29
30-49
50-64
65+
RepublicanDemocrat
Independent
Upper class
Middle class
Lower class
Two years or less
Three to five yearsSix years or longer
How long will it take personalfinance to recover?
Self-defined class

8/8/2019 Pew Research Center Recession
http://slidepdf.com/reader/full/pew-research-center-recession 47/120
41
The overall response —63% agree with the statement while just 31% disagree —is notable in that it reflects alevel of optimism roughly on par with the way respondents answered this same question when it was last askedin much better economic times in the early and mid-1990s.
It seems likely that the wording of this particular question taps into deeply felt views about the promise of
America in a way that more straightforward questions about the current state of the economy do not.In any event, the same group differences evident on other questions examined in this section occur here as well.A higher share of blacks (81%) and Hispanics (75%) agree with the statement than do whites (59%). Moreadults ages 18-29 agree with the statement than do adults ages 65 and over (70% vs. 56%). More Democrats(75%) agree with the statement than do Republicans (57%) or independents (60%). More of those with a highschool diploma or less education agree with the statement than do those with a college degree or more (66% vs.59%).
There is also an unusual class-based pattern in the responses to this question. Among those who identifythemselves as middle class (nearly half of all respondents), fully 70% agree with the statement that America is
still the land of prosperity and economic progress. Among the one-in-five respondents who describe themselvesas upper class or upper-middle class, just 63% agree with the statement. And among nearly three-in-tenrespondents who self-identify as lower class or lower-middle class, just 52% say they agree with the statement.
In short, belief in the long-term prosperity of the United States is greatest among those who consider themselvesto be in the middle class, then declines in both the upper and lower tiers of self-described socioeconomic class.
This is a counterintuitive finding, but not the only of its kind to emerge from this Pew Research survey. As theensuing chapters will show in more detail, attitudes about personal setbacks suffered during the recession as wellas about the overall state of the economy —now and in the future —do not always correlate with someone‘income level or self-defined social class.

8/8/2019 Pew Research Center Recession
http://slidepdf.com/reader/full/pew-research-center-recession 48/120
42

8/8/2019 Pew Research Center Recession
http://slidepdf.com/reader/full/pew-research-center-recession 49/120
43
Chapter 4: Household Finances, Social Class, Future GenerationsUnderlying the overall impact the recession has had on thenation‘s economy is the profound effect it has had on householdsacross the country. Nearly half of all Americans (48%) say their
household‘s current financial situation is worse now than it was before the recession started. Three-in-ten (29%) volunteer thattheir household financial situation hasn‘t changed, and 21% saytheir financial situation is actually better now than before therecession.
Pluralities of nearly all major demographic groups say theirhousehold finances have taken a hit over the past 30 months.Among men and women; blacks, whites and Hispanics; young andold; and college-educated and those who never attended college,
solid pluralities say their household finances are in worse shapenow than they were before the recession started.
That said, some segments of the populationhave been hit much harder than others. Theage group that seems to have suffered the mostin this regard is those ages 50-64 —many of whom are still working but nearing retirementage. A majority (57%) in this age group saythey are in worse shape financially than they
were before the recession. As many as one-in-five (21%) say they are inmuchworse shape.Among those ages 65 and older, only abouthalf as many (12%) say they are much worseoff. These older Americans are among themost likely to say their financial situation hasnot changed during the recession (45% amongthose ages 65 and older). Roughly the sameproportion of those under age 50 (46%) saythings have gotten worse for them.
Lower-income Americans have also beenparticularly hard-hit by the recession. Amongthose with annual family incomes of less than$30,000, more than half (55%) say they are inworse shape financially now than they were before the recession began, including nearly a
The Recession’s Personal Toll Household financial situation nowvs. before the recession
Note: “Don‟t know/Refused” responses areincluded but not labeled.
21%
48%
29%
Better shape Worse shape
No difference(VOL.)
The Differential Impact of the RecessionHousehold financial situation now compared withbefore the recession (%)
Note: Income levels represent annual family income.“Unemployed” includes those who are not employed, would like tohave a job, are available to work and are looking for work. “Nodifference” and “Don‟t know/Refused” responses not shown.
21
33
23
15
11
27
20
20
25
9
48
43
49
57
42
42
50
55
46
76
All
18-29
30-49
50-64
65+
$75,000+
$30,000-$74,999
<$30,000
Employed
Unemployed
Better shape Worse shape

8/8/2019 Pew Research Center Recession
http://slidepdf.com/reader/full/pew-research-center-recession 50/120
44
quarter (23%) who say they are in much worse shape. By contrast, 42% of those with annual family incomes of $75,000 or higher say they are in worse shape now.
Not surprisingly, those who are currently unemployed are more likely than those who are working to say theirhousehold finances have deteriorated over the course of the recession.35 Among the unemployed, three-quarters
(76%) say they are in worse financial shape now than they were before the recession began, with 40% sayingthey are in much worse shape. Only 9% say they are in better shape. Among those who have a job, 46% say theyare worse shape now, while 25% say their financial situation is better than it was before the recession started.
Very few households have seen an increase in their overall income in recent years. Only 14% say their familyincome has increased from what it was before the recession. A third (34%) say their household income has gonedown, and 49% say it has stayed about the same.
In spite of the widespread pain wrought by the recession, one-in-five Americans (21%) report that their financialsituation has actually improved during the recession. Among certain groups, an even higher proportion say theirhousehold finances are better now than before the recession started. Nearly a third of African Americans (32%)
say they are now in better shape. This is significantly higher than the percentage of whites (18%) or Hispanics(23%) who say the same.This more positive outlook extends to blacks‘ views about the state of economy as well as their outlook for their own financial future.36
As a group, young adults (ages 18-29) have experienced high levels of unemployment during this recession.However, in terms of their personal finances, they are more likely than other age groups to say they are betteroff now than they were before the recession. A third say they are better off, compared with 23% of those ages30-49 and only 13% of those ages 50 and older.
In addition, those with family incomes of $75,000 or higher are more likely than those with lower incomes toreport that they are in better financial shape now than they were before the recession started (27% vs. 20%among those whose family incomes are less than $75,000).
35 Throughout this section, ―unemployed‖ refers to those respondents who arenot employed, would like to have a job, are available to work andare looking for work.36 Earlier research suggested that the election of Barack Obama as the nation‘s first black president may have contrcreased optimismamong blacks on a whole host of issues. See Pew Research Center,―Blacks Upbeat about Black Progress, Prospects –A Year AfterObama‘sElection.‖ Jan. 12, 2010. http://pewsocialtrends.org/pubs/749/blacks-upbeat-about-black-progress-obama-election

8/8/2019 Pew Research Center Recession
http://slidepdf.com/reader/full/pew-research-center-recession 51/120
45
A Downward Tick in Social Class
One way to evaluate the impact of the recession on thepublic is to look at it through the prism of social class.There are no clear guidelines defining the social classes,
but Americans have very little trouble placingthemselves in a distinct category. Half of the public saythey are middle class. One-in-five consider themselvesupper class (either upper or upper-middle). And 29%say they are in the lower class (lower-middle or lower).
The percentage of Americans who place themselves inthe lower class has increased by four points since therecession began. In January 2008, 25% of the publicconsidered themselves lower class. The share placing
themselves in the middle class has fallen slightly from53% in early 2008, while the share saying they are upperclass is largely unchanged.
The demographic profile of the three social classes has remained relatively stable over the past two years.College graduates and those with annual family incomes of $100,000 or more are among the most likely toconsider themselves upper class. Roughly three-in-ten college graduates (32%) say they are in the upper class.Among those with annual incomes in excess of $100,000, nearly six-in-ten (58%) considerthemselves upper class. New immigrants areless likely than second- or third-generationAmericans to place themselves in the upperclass. And married people are more likely thanthose who are unmarried to identify with theupper class.
There have, however, been some notablechanges in the demographic makeup of thesocial classes over the past two years. Thepercentage of blacks who identify themselves asmembers of the upper class has increasedmarginally since 2008, from 15% to 20%, whilethe percentage of Hispanics who identifythemselves as lower class has moved up slightly,from 30% to 35%. There are now no significantgaps between black and white Americans interms of how they identify their social class.
Race, Ethnicity and Social Class% saying they belong in each class
Note: Hispanics are of any race. Whites and blacks include onlynon-Hispanics.
21
51
27
20
46
33
12
52
35
Upper class
Middle class
Lower class
White Black Hispanic
The Growing Lower Class?% of Americans identifying themselves as …
2008 2010
Upper class (NET) 21 20 Upper 2 2Upper-middle 19 18
Middle class 53 50 Lower class (NET) 25 29
Lower-middle 19 21Lower 6 8
Don‟t know/Refused 1 1
Number of respondents 2,413 2,967
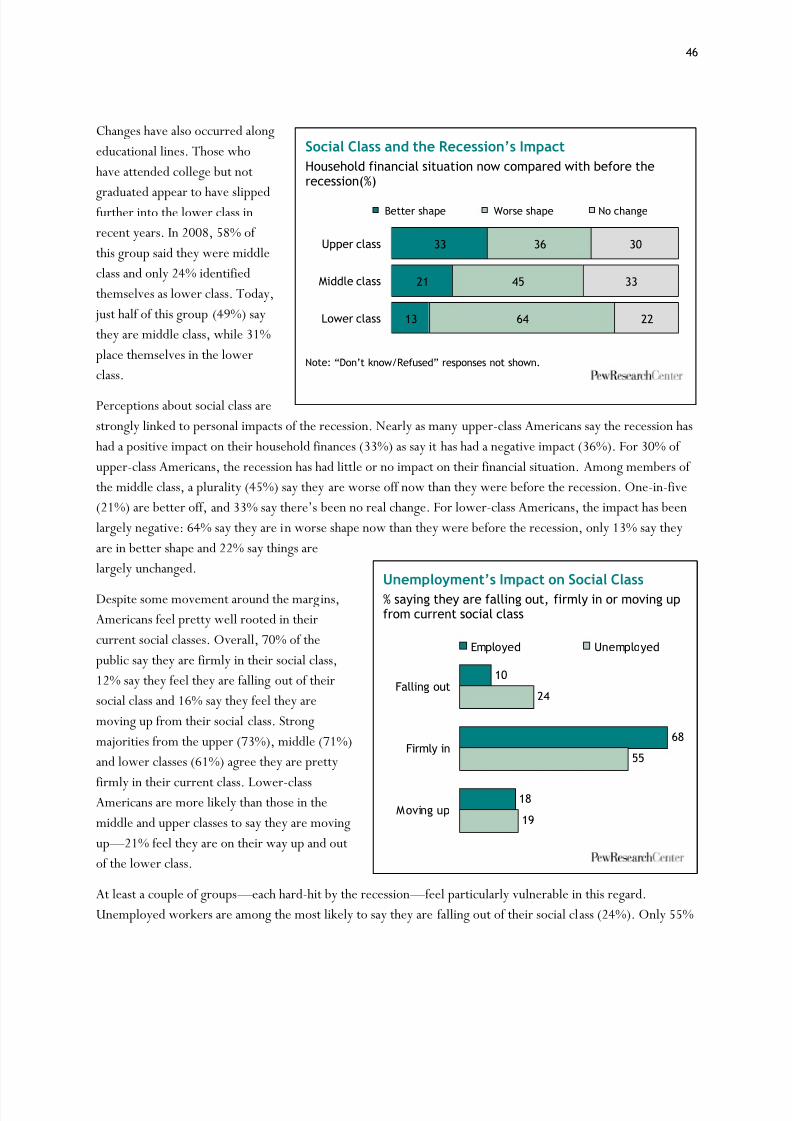
8/8/2019 Pew Research Center Recession
http://slidepdf.com/reader/full/pew-research-center-recession 52/120
46
Changes have also occurred alongeducational lines. Those whohave attended college but not
graduated appear to have slippedfurther into the lower class inrecent years. In 2008, 58% of this group said they were middleclass and only 24% identifiedthemselves as lower class. Today, just half of this group (49%) saythey are middle class, while 31%place themselves in the lowerclass.
Perceptions about social class arestrongly linked to personal impacts of the recession. Nearly as many upper-class Americans say the recession hashad a positive impact on their household finances (33%) as say it has had a negative impact (36%). For 30% of upper-class Americans, the recession has had little or no impact on their financial situation. Among members of the middle class, a plurality (45%) say they are worse off now than they were before the recession. One-in-five(21%) are better off,and 33% say there‘s been no real change. For lower-class Americans, the impact has beenlargely negative: 64% say they are in worse shape now than they were before the recession, only 13% say theyare in better shape and 22% say things arelargely unchanged.
Despite some movement around the margins,Americans feel pretty well rooted in theircurrent social classes. Overall, 70% of thepublic say they are firmly in their social class,12% say they feel they are falling out of theirsocial class and 16% say they feel they aremoving up from their social class. Strongmajorities from the upper (73%), middle (71%)and lower classes (61%) agree they are pretty
firmly in their current class. Lower-classAmericans are more likely than those in themiddle and upper classes to say they are movingup —21% feel they are on their way up and outof the lower class.
At least a couple of groups —each hard-hit by the recession —feel particularly vulnerable in this regard.Unemployed workers are among the most likely to say they are falling out of their social class (24%). Only 55%
Social Class and the Recession’s Impact Household financial situation now compared with before therecession(%)
Note: “Don‟t know/Refused” responses not shown.
33
21
13
36
45
64
30
33
22
Upper class
Middle class
Lower class
Better shape Worse shape No change
Unemployment’s Impact on Social Class % saying they are falling out, firmly in or moving upfrom current social class
10
68
18
24
55
19
Falling out
Firmly in
Moving up
Employed Unemployed
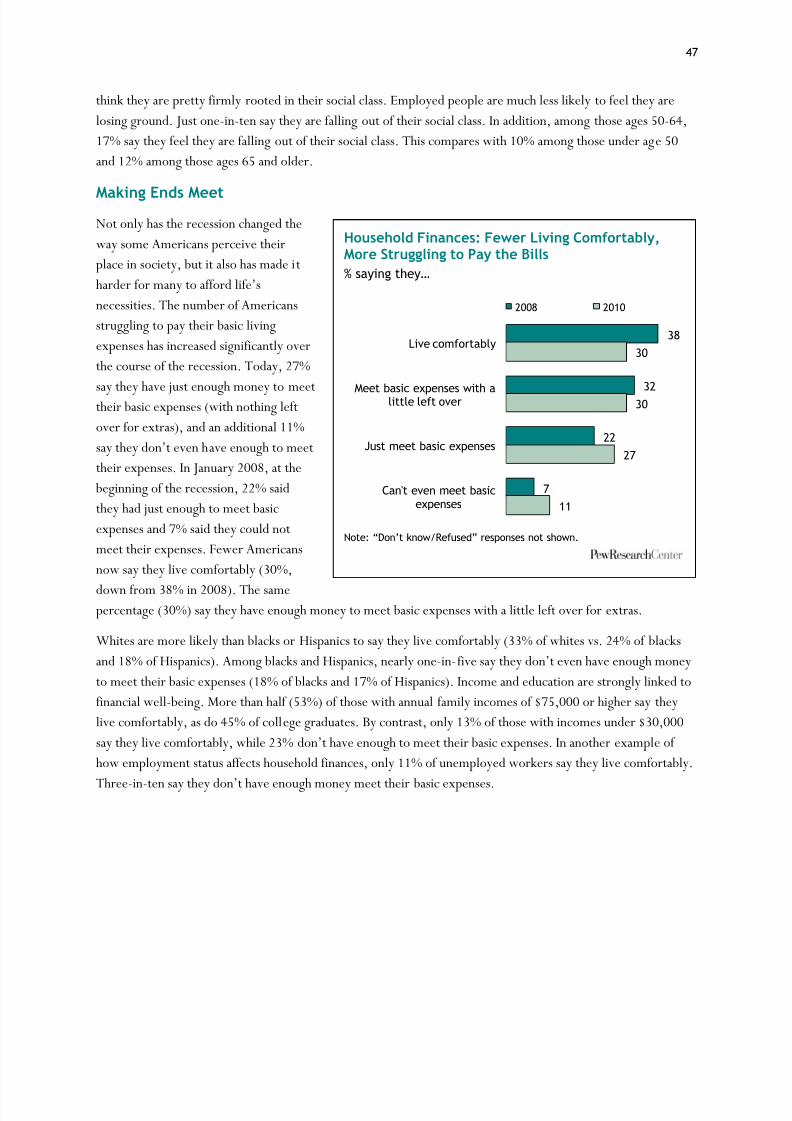
8/8/2019 Pew Research Center Recession
http://slidepdf.com/reader/full/pew-research-center-recession 53/120
47
think they are pretty firmly rooted in their social class. Employed people are much less likely to feel they arelosing ground. Just one-in-ten say they are falling out of their social class. In addition, among those ages 50-64,17% say they feel they are falling out of their social class. This compares with 10% among those under age 50and 12% among those ages 65 and older.
Making Ends MeetNot only has the recession changed theway some Americans perceive theirplace in society, but it also has made itharder for many to afford life‘snecessities. The number of Americansstruggling to pay their basic livingexpenses has increased significantly overthe course of the recession. Today, 27%
say they have just enough money to meettheir basic expenses (with nothing leftover for extras), and an additional 11%say they don‘t even have enough to meettheir expenses. In January 2008, at the beginning of the recession, 22% saidthey had just enough to meet basicexpenses and 7% said they could notmeet their expenses. Fewer Americansnow say they live comfortably (30%,
down from 38% in 2008). The samepercentage (30%) say they have enough money to meet basic expenses with a little left over for extras.
Whites are more likely than blacks or Hispanics to say they live comfortably (33% of whites vs. 24% of blacksand 18% of Hispanics). Among blacks and Hispanics, nearly one-in-five say they don‘t even have enough mto meet their basic expenses (18% of blacks and 17% of Hispanics). Income and education are strongly linked tofinancial well-being. More than half (53%) of those with annual family incomes of $75,000 or higher say theylive comfortably, as do 45% of college graduates. By contrast, only 13% of those with incomes under $30,000say they live comfortably, while 23% don‘t have enough to meet their basic expenses. In ae of how employment status affects household finances, only 11% of unemployed workers say they live comfortably.
Three-in-ten say they don‘t have enough money meet their basic expenses.
Household Finances: Fewer Living Comfortably,More Struggling to Pay the Bills% saying they…
Note: “Don‟t know/Refused” responses not shown.
38
32
22
7
30
30
27
11
Live comfortably
Meet basic expenses with alittle left over
Just meet basic expenses
Can't even meet basicexpenses
2008 2010

8/8/2019 Pew Research Center Recession
http://slidepdf.com/reader/full/pew-research-center-recession 54/120

8/8/2019 Pew Research Center Recession
http://slidepdf.com/reader/full/pew-research-center-recession 55/120
49
expect things to get better.
There are some important differences, however. Blacks andHispanics are more likely than whites to say their financialsituation will improve over the next year (81% of blacks and
74% of Hispanics vs. 57% of whites). Young adults are moreoptimistic than their older counterparts: 85% of adults underage 30 say their financial situation will improve over the nextyear. This compares with 69% of those ages 30-49 and 45% of those ages 50 and older.
Democrats are more optimistic than Republicans orindependents about their financial prospects for the next year.Seven-in-ten Democrats expect their financial situation toimprove, compared with 55% of Republicans and 62% of
independents.While unemployed workers have been among the hardest hit bythe recession, they are relatively positive about their financialfuture. More than seven-in-ten (72%) say their financial situation will improve over the next year. Thiscompares with 68% of those who are employed. It may be the case that many unemployed workers, given theircurrent circumstances, believe things can only get better. One-in-five unemployed workers (19%) say theirsituation will get worse. This is on par with the general public.
In spite of this overall optimism, for many of those who lost out during the recession it may be a long climb back. Survey respondents who said they were in worse shape now than they had been before the recession
started (48% of the public) were asked how long they thought it would take them to recover financially. Veryfew (5%) thought they would recover their losses in less than a year. Roughly a quarter (27%) said it would takethem one to two years to recover. Four-in-ten said it would take three to five years, and 23% said it would takethem six years or longer.
Compared with blacks, whites who have been hurt by the recession see a longer time horizon in terms of recovering what they‘ve lost. A majority of blacks (55%) who say they are in worse shape before the recession think they will be able to recover financially in less than two years. This compares with 29%of whites. A plurality of whites (43%) say it will take three to five years for them to recover, while 21% say itwill take longer.
Young people who have been hurt by the recession anticipate a fairly speedy recovery. Nearly half (47%) saythey will have regained what they lost in less than two years. By contrast, only 24% of those ages 50 and olderwho were hurt by the recession say they will recover in the next two years. In addition, college graduates whowere hurt by the recession are much more likely than those who never attended college to say it will take themmany years to recover from the effects of the recession. Three-in-ten college graduates say it will take six yearsor longer to recover, compared with 18% of those who never attended college.
A Long Recovery PeriodHow long will it take you/your familyto recover from the recession?
Hurt by Recession*
%Less than a year 5One to two years 27Three to five years 40Six to 10 years 13Longer than 10 years/never 10Don‟t know/Refused /Depends 6
* Based on those who say their householdfinancial situation is worse now than it wasbefore the recession.Note: Numbers do not total 100% due torounding.

8/8/2019 Pew Research Center Recession
http://slidepdf.com/reader/full/pew-research-center-recession 56/120
50
The Long-Term Impact of the Recession
Looking further into the future,Americans have become more skepticalabout the quality of life for the next
generation. Respondents were askedwhether they thought their children‘sstandard of living would be better,about the same or worse than theirown. On balance, more say theyexpect their children will enjoy a better standard of living. However, thepercentage saying this has fallen overthe past 10 years. In 2000, 59% of thepublic said their children would have a better standard of living than theythemselves had. By 2002, 61% heldthis view. Today, 45% say theirchildren will have a better standard of living than they do, while 26% thinktheir children‘s standard of living willbe worse than theirs. An additional 19% say their children‘s standard of living will be about the same as theirs.The percentage saying their children‘s standard of living will be worse than theirs is the hthe General Social Survey first asked this question in 1994.
Views about what sort of economy the next generation will inherit differ significantly by key demographicvariables. Young adults are much more optimistic about their children‘s future. Among thsay when their children are their age, they will enjoy a better standard of living. This compares with 47% of those ages 30-49 and only 35% of those ages 50 and older.
There is a wide racial gap on this question, and again, blacks are much more upbeat than whites. Roughly seven-in-ten blacks (69%) say their children will have a better standard of living than they themselves do. Thiscompares with 38% of whites. Hispanics are just as positive as blacks in this regard: 64% of Hispanics say theirchildren will enjoy a better standard of living than they themselves do.
What Will Life Be Like for the Next Generation?When your children are at the age you are now …(%)
Note: 1994-2008 data are from the General Social Survey.
0
10
20
30
40
50
60
70
1994 1996 1998 2000 2002 2004 2006 2008 2010
Standard of livingwill be better
Standard of livingwill be worse
45
20
45
26
10
61

8/8/2019 Pew Research Center Recession
http://slidepdf.com/reader/full/pew-research-center-recession 57/120
51
Income is also linked to views about the nextgeneration. Those with lower annual familyincomes are more optimistic about theirchildren‘s future prospects. Among thosemaking less than $30,000 a year, 53% saytheir children will enjoy a better standard of living than they do. This compares with 46%of those making between $30,000 and$75,000, and 40% of those making more than$75,000 a year. Similarly, the least well-educated are among the most optimistic.Among those who never finished high school,55% say their children will have a betterstandard of living than they do. Among college
graduates, only 39% agree.In keeping with their negative assessmentsabout their own financial situation,Republicans are more pessimistic thanDemocrats about their children‘s futureprospects. More than half of Democrats (55%)say their children will have a better standard of living than they do. Only 37% of Republicansagree. More than a third of Republicans (35%)say their children‘s standard of living will beworse.
In spite of increasing doubts about theirchildren‘s futures, most Americans say that their own standard of living is better than that of their parents.When asked to compare their current standard of living to their parents‘ at a comparable astandard of living is better (31% say it‘s much better, 26% say it‘s somewhat better). Onlystandard of living is worse than their parents‘. And 23% say it‘s about the same.
Blacks and Hispanics are more likely than whites to see progress in this regard. Nearly two-thirds of blacks(64%) and 71% of Hispanics say they enjoy a better standard of living than their parents did. This compares with
54% of whites. Higher-income Americans, who are more doubtful about their children‘s prospethe most likely to say their standard of living exceeds that of their parents. About two-thirds (68%) of those withannual family incomes of $75,000 or higher say their standard of living is better than theimiddle-income Americans (those making between $30,000 and $75,000), 58% say they have a higher standardof living than their parents had. And among those making less than $30,000 a year, only 50% agree.
Differing Views on the FutureChildren‟s future standard of living compared withyours (%)
Note: Income levels represent annual family income.
26
29
17
15
16
22
33
33
29
25
22
35
17
26
46
38
69
64
47
36
34
40
46
53
37
55
44
All
White
Black
Hispanic
18-29
30-49
50-64
65+
$75,000+
$30,000-74,999
<$30,000
Republican
Democrat
Independent
Worse Better
64
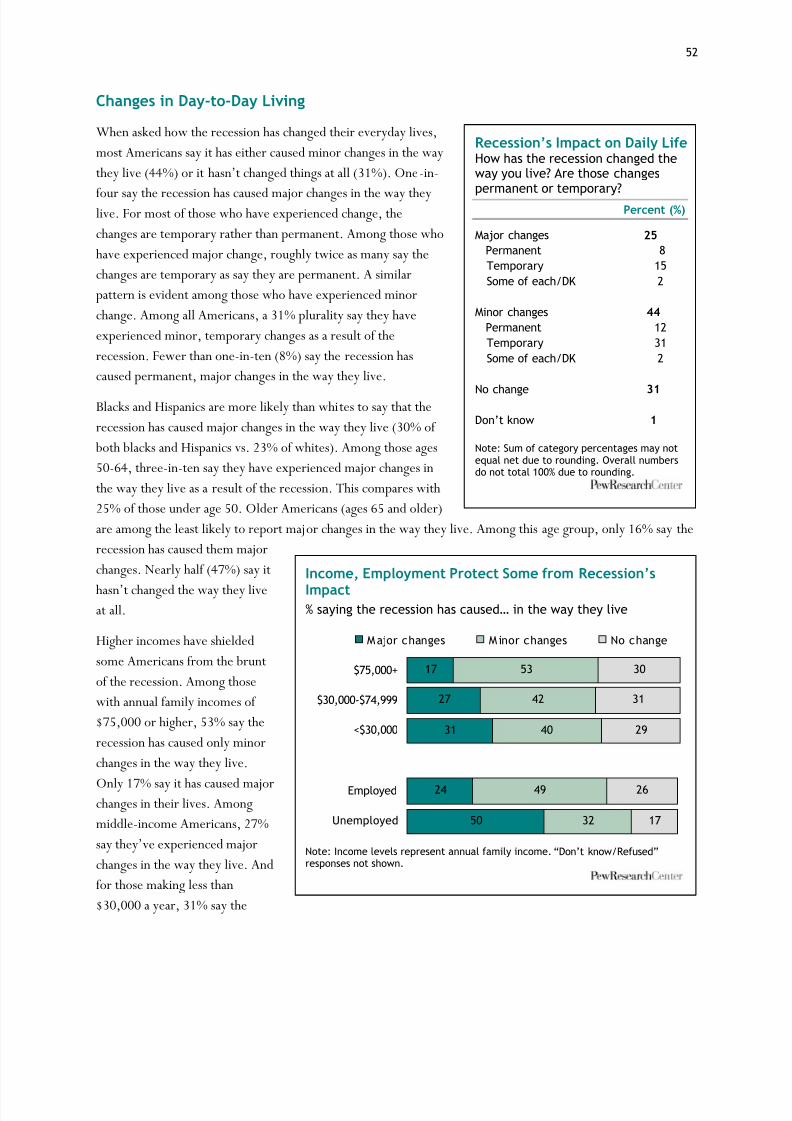
8/8/2019 Pew Research Center Recession
http://slidepdf.com/reader/full/pew-research-center-recession 58/120
52
Changes in Day-to-Day Living
When asked how the recession has changed their everyday lives,most Americans say it has either caused minor changes in the waythey live (44%) or it hasn‘t changed things at all (31%). One-in-
four say the recession has caused major changes in the way theylive. For most of those who have experienced change, thechanges are temporary rather than permanent. Among those whohave experienced major change, roughly twice as many say thechanges are temporary as say they are permanent. A similarpattern is evident among those who have experienced minorchange. Among all Americans, a 31% plurality say they haveexperienced minor, temporary changes as a result of therecession. Fewer than one-in-ten (8%) say the recession hascaused permanent, major changes in the way they live.
Blacks and Hispanics are more likely than whites to say that therecession has caused major changes in the way they live (30% of both blacks and Hispanics vs. 23% of whites). Among those ages50-64, three-in-ten say they have experienced major changes inthe way they live as a result of the recession. This compares with25% of those under age 50. Older Americans (ages 65 and older)are among the least likely to report major changes in the way they live. Among this age group, only 16% say therecession has caused them majorchanges. Nearly half (47%) say it
hasn‘t changed the way they liveat all.
Higher incomes have shieldedsome Americans from the bruntof the recession. Among thosewith annual family incomes of $75,000 or higher, 53% say therecession has caused only minorchanges in the way they live.
Only 17% say it has caused majorchanges in their lives. Amongmiddle-income Americans, 27%say they‘ve experienced majorchanges in the way they live. Andfor those making less than$30,000 a year, 31% say the
Income, Employment Protect Some from Recession’sImpact% saying the recession has caused… in the way they live
Note: Income levels represent annual family income. “Don‟t know/Refused”responses not shown.
17
27
31
24
50
53
42
40
49
32
30
31
29
26
17
$75,000+
$30,000-$74,999
<$30,000
Employed
Unemployed
M ajor changes M inor changes No change
Recession’s Impact on Daily Life How has the recession changed theway you live? Are those changespermanent or temporary?
Percent (%)
Major changes 25 Permanent 8 Temporary 15 Some of each/DK 2
Minor changes 44 Permanent 12 Temporary 31 Some of each/DK 2
No change 31
Don‟t know 1
Note: Sum of category percentages may notequal net due to rounding. Overall numbersdo not total 100% due to rounding.
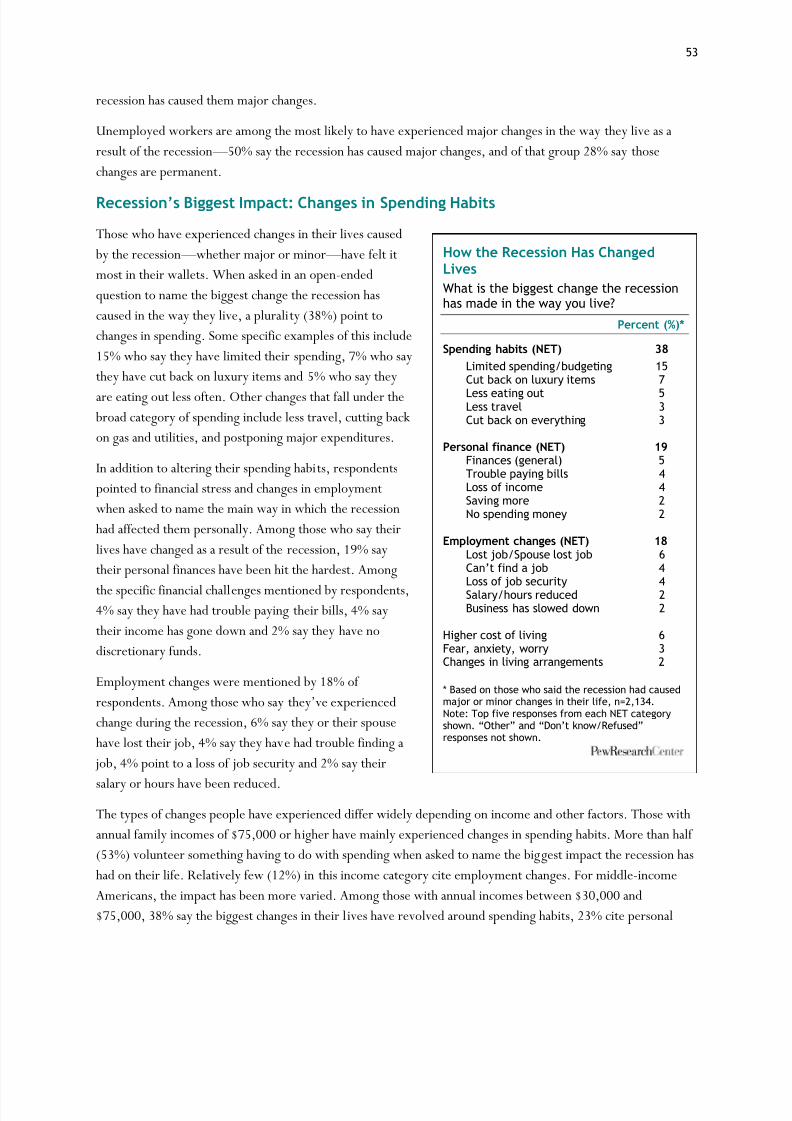
8/8/2019 Pew Research Center Recession
http://slidepdf.com/reader/full/pew-research-center-recession 59/120
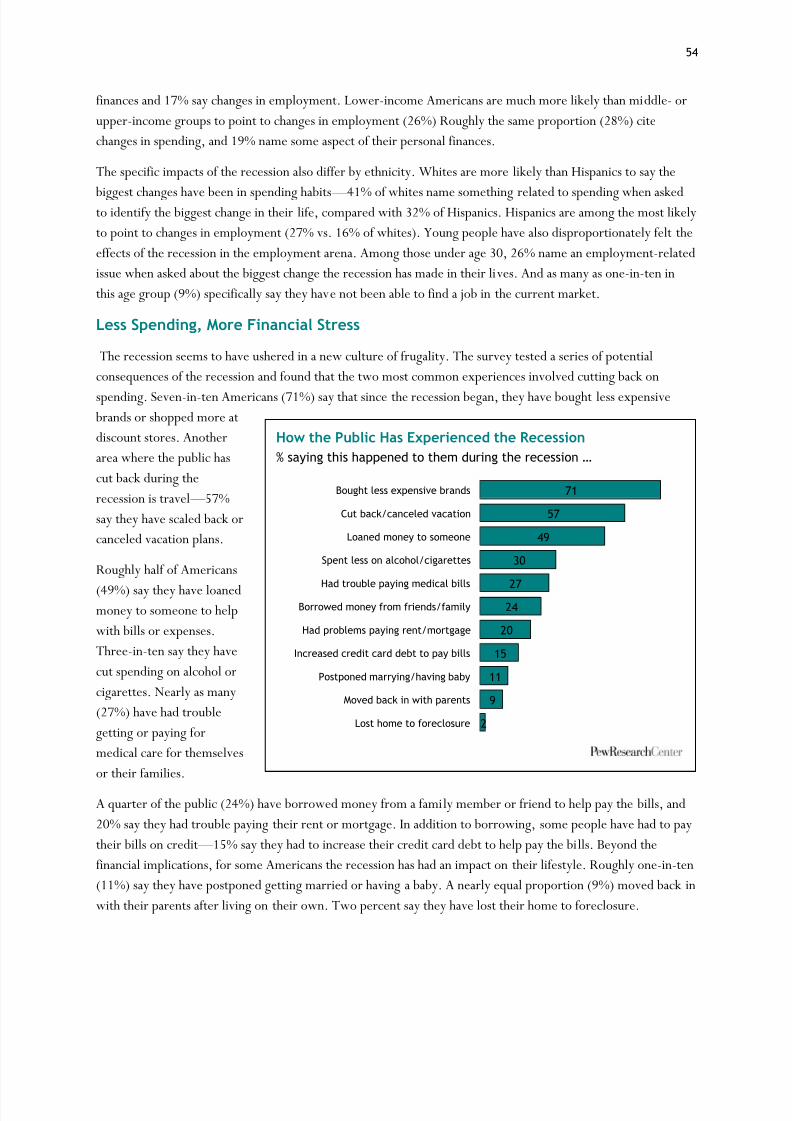
8/8/2019 Pew Research Center Recession
http://slidepdf.com/reader/full/pew-research-center-recession 60/120
54
finances and 17% say changes in employment. Lower-income Americans are much more likely than middle- orupper-income groups to point to changes in employment (26%) Roughly the same proportion (28%) citechanges in spending, and 19% name some aspect of their personal finances.
The specific impacts of the recession also differ by ethnicity. Whites are more likely than Hispanics to say the
biggest changes have been in spending habits —41% of whites name something related to spending when askedto identify the biggest change in their life, compared with 32% of Hispanics. Hispanics are among the most likelyto point to changes in employment (27% vs. 16% of whites). Young people have also disproportionately felt theeffects of the recession in the employment arena. Among those under age 30, 26% name an employment-relatedissue when asked about the biggest change the recession has made in their lives. And as many as one-in-ten inthis age group (9%) specifically say they have not been able to find a job in the current market.
Less Spending, More Financial Stress
The recession seems to have ushered in a new culture of frugality. The survey tested a series of potentialconsequences of the recession and found that the two most common experiences involved cutting back onspending. Seven-in-ten Americans (71%) say that since the recession began, they have bought less expensive brands or shopped more atdiscount stores. Anotherarea where the public hascut back during therecession is travel —57%say they have scaled back orcanceled vacation plans.
Roughly half of Americans
(49%) say they have loanedmoney to someone to helpwith bills or expenses.Three-in-ten say they havecut spending on alcohol orcigarettes. Nearly as many(27%) have had troublegetting or paying formedical care for themselvesor their families.
A quarter of the public (24%) have borrowed money from a family member or friend to help pay the bills, and20% say they had trouble paying their rent or mortgage. In addition to borrowing, some people have had to paytheir bills on credit —15% say they had to increase their credit card debt to help pay the bills. Beyond thefinancial implications, for some Americans the recession has had an impact on their lifestyle. Roughly one-in-ten(11%) say they have postponed getting married or having a baby. A nearly equal proportion (9%) moved back inwith their parents after living on their own. Two percent say they have lost their home to foreclosure.
How the Public Has Experienced the Recession% saying this happened to them du ring the recession …
71
57
49
30
2724
20
15
11
9
2
Bought less expensive brands
Cut back/canceled vacation
Loaned money to someone
Spent less on alcohol/cigarettes
Had trouble paying medical bills
Borrowed money from friends/family
Had problems paying rent/mortgage
Increased credit card debt to pay bills
Postponed marrying/having baby
Moved back in with parents
Lost home to foreclosure

8/8/2019 Pew Research Center Recession
http://slidepdf.com/reader/full/pew-research-center-recession 61/120
55
These experiences differ widely by race,ethnicity, age and income. Blacks are morelikely than whites or Hispanics to reportloaning money to help someone with theirexpenses during the recession (59% of blacks vs. 48% of whites and 40% of Hispanics). Blacks and Hispanics are morelikely than whites to have had troublegetting or paying for medical care, borrowed money from a family member orfriend, or had problems paying their rentor mortgage. Hispanics are much morelikely than whites or blacks to say theyincreased their credit card debt to pay their
bills (31% of Hispanics vs. 12% of whitesand 19% of blacks).
Looking across age groups, older adults(ages 65 and older) have been largelysheltered from many of these experiences. They are much less likely than younger age groups to have cut backon spending, loaned or borrowed money, had trouble paying for medical bills or housing, or had to increasetheir credit card debt. Young adults stand out in a couple of specific areas. Among those under age 30, 42% saythey borrowed money from a family member or friend to help pay the bills. This compares with 28% of thoseages 30-49 and only 12% of those ages 50 and older. In addition, 24% of those under age 30 moved back in withtheir parents after living on their own.
In much the same way that older adults were shielded from the effects of the recession, upper-incomeAmericans have been protected from many of the effects felt by those in the middle- and lower-incomecategories. Those with annual family incomes of $75,000 or higher experienced every potential problem at amuch lower rate than those with less income. The largest gaps are on paying for medical care and borrowingmoney to help pay the bills. Only 10% of those making $75,000 or more a year say they have had troublegetting or paying for medical care during the recession. This compares with 28% of those making between$30,000 and $75,000 a year and 44% of those making less than $30,000. Similarly, while 8% of upper-incomeAmericans say they had to borrow money from a friend or family member to make ends meet, nearly a quarter(23%) of those making $30,000 to $75,000 and 42% of lower-income Americans were forced to do that.
Unemployed workers have felt the sting of the recession more profoundly than others. In comparing theirexperiences with those of employed workers, it is obvious that unemployment affects many areas of their lives.An overwhelming majority (83%) say they have bought less expensive brands and shopped more at discountstores during the recession. Three-quarters of unemployed workers say they have cut back on or canceledvacation travel.
Older Americans Avoid Some Effects of Recession% saying this happened to them during the recession
73
61
30
28
23
63
42
15
5
7
Bought less expensivebrands
Cut back/ canceledvacation
Had trouble payingmedical bills
Borrowed money fromfriends/ family
Had problems payingrent/ mortgage
Under age 65 Age 65+

8/8/2019 Pew Research Center Recession
http://slidepdf.com/reader/full/pew-research-center-recession 62/120
56
The unemployed are twice as likely as thosewith jobs to say they‘ve had trouble paying formedical care for themselves or their families.And they are twice as likely to have borrowedmoney from a family member or friend to paytheir bills. Nearly half (44%) have hadproblems paying their rent or mortgage,compared with 19% of those who areworking. And 26% have had to increase theircredit card debt to help pay bills, comparedwith 15% of employed workers.
Postponing Retirement
For many workers in their 50s and early 60s,
retirement may not come as soon as they hadplanned. Among those ages 50-61 who arecurrently employed, 60% say they may haveto delay retirement because of the recession.Roughly a third (34%) say they will nothave to delay retirement, and 5% aren‘t sure. A similar quesin July 2009 yielded comparable results —63% of workers in this age group said they had delayed retirement because of economic conditions, and 31% said they had not.
College graduates are less likely than thosewithout a college degree to say they may haveto delay retirement because of the recession.Among those ages 50-61 who are employed,50% of college graduates say their retirementmay be delayed. This compares with 60% of those who attended some college and 69% of those who never attended college.
Middle-income workers in this age group aresomewhat more likely than upper-incomeworkers to say they may have to wait to retire.Among those with annual incomes between$30,000 and $75,000, 69% say they might have to delay their retirement. Among those with incomes of $75,000 or higher, 56% say the same.
Of those ages 62 and older, 13% are not retired. About a third of this group (35%) say they have delayedretirement because of the recession; 61% say they have not. The percentage saying they had delayed retirementhas changed relatively little over the past year. In July 2009, 38% of workers in this age group said they haddelayed retirement because of the economic conditions.
The Recession and Retirement
% saying, because of the recession they…
Note: Based on non-retirees ages 50-61.
60
34
5
Might have to delayretirement
Won't have to delayretirement
Don't know (VOL.)
Unemployed Struggle to Pay Bills% saying this happened to them during the recession
53
50
44
26
26
24
19
15
Had trouble payingmedical bills
Borrowed money fromfriends/ family
Had problems payingrent/ mortgage
Increased credit carddebt to pay bills
Unemployed Employed

8/8/2019 Pew Research Center Recession
http://slidepdf.com/reader/full/pew-research-center-recession 63/120
57
Chapter 5: Work and Unemployment
From shop floor to office cubicle toexecutive suite, American workers have been hard-hit by the Great Recession.About a third of all adults in the laborforce are currently unemployed or have been out of work sometime since theofficial start of the economic downturn inDecember 2007, according to a new PewResearch Center survey and governmentemployment data.
At the same time, more than four-in-tencurrently employed adults say theiremployer cut their pay, reduced theirwork hours, forced them to take unpaidleave or downsized their job during therecession. Add to the total those part-time workers who have tried but failed tofind full-time employment in an anemic job market, and the results suggest thatmore than half of all adults in the laborforce (55%) have faced hardship on the
job during the nation‘s longest anddeepest economic downturn since the1930s.
The government‘s official unemployment rate, which stood at9.7 percent in May, tells only part of the story.When asked in the survey, one-in-four currently employed adults (26%) say they were out of work sometimesince the recession began. Taken together, these unemployment figures suggest that as much as 32% of the laborforce is currently jobless or has been unemployed sometime during the recession.
While news about layoffs and lost jobs has dominated the economic headlines, employed Americans also have been battered by hard times. More than four-in-ten (42%) of all currently employed workers have been forced
to take unpaid leave, saw their full-time jobs shrink to part time or had their pay cut or hours reduced. Whileworking Americans across the demographic spectrum have been affected, minorities and adults with only a highschool diploma or less education have been particularly exposed.
In a job market that is only now beginning to show faint signs of recovery, about half of all part-time workerswant a full-time job. For a majority of these workers, the bad economy has stood between them and a full-timeemployment, the survey found. Nearly four-in-ten part-time workers (37%) say they have looked but cannotfind full-time employment. An additional 23% say that they had a full-time job but that it was downsized. The
The Recession at Work% of each group who experienced each of the followingsince the recession began
*The underemployed are part-time workers who say they want a full-time job but do not have one because they cannot find full-timeemployment or because of other economic reasons.
28
23
12
11
6
55
Work hours reduced
Pay cut
Had to take unpaid leave
Forced to switch to part-time
Unemployed now or sometimeduring recession
Underemployed*
Among total labor force (n=2,256)
Among currently employed (n=1,604)
Total experiencing anywork-related problem
32
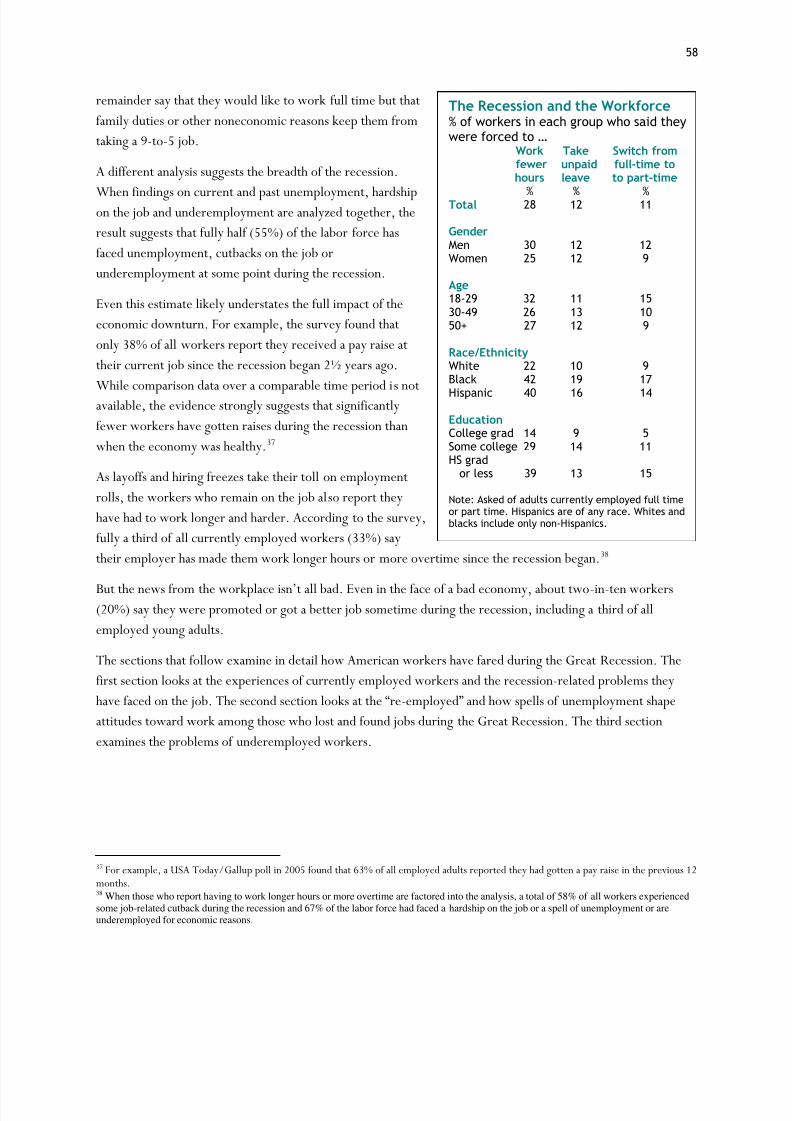
8/8/2019 Pew Research Center Recession
http://slidepdf.com/reader/full/pew-research-center-recession 64/120
58
remainder say that they would like to work full time but thatfamily duties or other noneconomic reasons keep them fromtaking a 9-to-5 job.
A different analysis suggests the breadth of the recession.
When findings on current and past unemployment, hardshipon the job and underemployment are analyzed together, theresult suggests that fully half (55%) of the labor force hasfaced unemployment, cutbacks on the job orunderemployment at some point during the recession.
Even this estimate likely understates the full impact of theeconomic downturn. For example, the survey found thatonly 38% of all workers report they received a pay raise attheir current job since the recession began 2½ years ago.
While comparison data over a comparable time period is notavailable, the evidence strongly suggests that significantlyfewer workers have gotten raises during the recession thanwhen the economy was healthy.37
As layoffs and hiring freezes take their toll on employmentrolls, the workers who remain on the job also report theyhave had to work longer and harder. According to the survey,fully a third of all currently employed workers (33%) saytheir employer has made them work longer hours or more overtime since the recession began.38
But the news fromthe workplace isn‘t all bad. Even in the face of a bad economy, about two-in-ten workers(20%) say they were promoted or got a better job sometime during the recession, including a third of allemployed young adults.
The sections that follow examine in detail how American workers have fared during the Great Recession. Thefirst section looks at the experiences of currently employed workers and the recession-related problems theyhave faced on the job. The second section looks at the ―re-employed‖ and how spells of unemployment sattitudes toward work among those who lost and found jobs during the Great Recession. The third sectionexamines the problems of underemployed workers.
37 For example, a USA Today/Gallup poll in 2005 found that 63% of all employed adults reported they had gotten a pay raise in the previous 12months.38 When those who report having to work longer hours or more overtime are factored into the analysis, a total of 58% of all workers experiencedsome job-related cutback during the recession and 67% of the labor force had faced a hardship on the job or a spell of unemployment or areunderemployed for economic reasons.
The Recession and the Workforce% of workers in each group who said theywere forced to …
Work Take Switch fromfewer unpaid full-time tohours leave to part-time
% % %Total 28 12 11
GenderMen 30 12 12Women 25 12 9
Age18-29 32 11 1530-49 26 13 1050+ 27 12 9
Race/EthnicityWhite 22 10 9Black 42 19 17Hispanic 40 16 14
EducationCollege grad 14 9 5Some college 29 14 11HS grad
or less 39 13 15
Note: Asked of adults currently employed full timeor part time. Hispanics are of any race. Whites andblacks include only non-Hispanics.
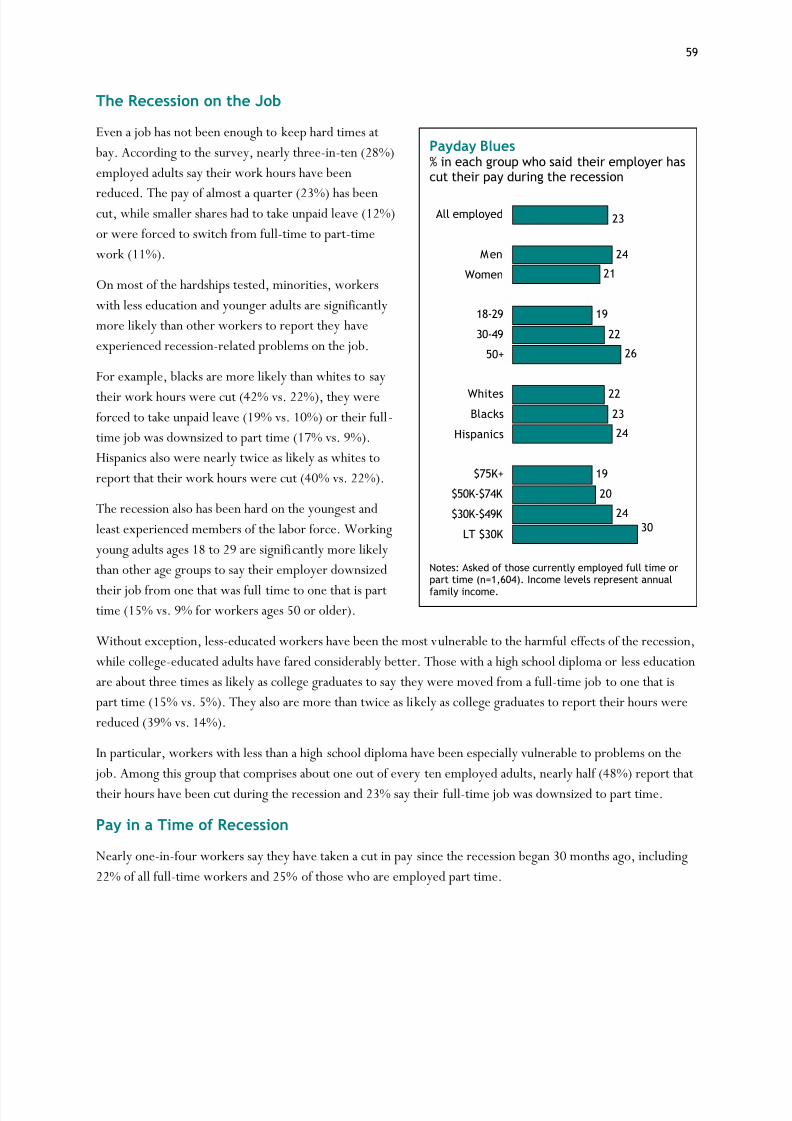
8/8/2019 Pew Research Center Recession
http://slidepdf.com/reader/full/pew-research-center-recession 65/120
59
The Recession on the Job
Even a job has not been enough to keep hard times at bay. According to the survey, nearly three-in-ten (28%)employed adults say their work hours have been
reduced. The pay of almost a quarter (23%) has beencut, while smaller shares had to take unpaid leave (12%)or were forced to switch from full-time to part-timework (11%).
On most of the hardships tested, minorities, workerswith less education and younger adults are significantlymore likely than other workers to report they haveexperienced recession-related problems on the job.
For example, blacks are more likely than whites to saytheir work hours were cut (42% vs. 22%), they wereforced to take unpaid leave (19% vs. 10%) or their full-time job was downsized to part time (17% vs. 9%).Hispanics also were nearly twice as likely as whites toreport that their work hours were cut (40% vs. 22%).
The recession also has been hard on the youngest andleast experienced members of the labor force. Workingyoung adults ages 18 to 29 are significantly more likelythan other age groups to say their employer downsized
their job from one that was full time to one that is parttime (15% vs. 9% for workers ages 50 or older).
Without exception, less-educated workers have been the most vulnerable to the harmful effects of the recession,while college-educated adults have fared considerably better. Those with a high school diploma or less educationare about three times as likely as college graduates to say they were moved from a full-time job to one that ispart time (15% vs. 5%). They also are more than twice as likely as college graduates to report their hours werereduced (39% vs. 14%).
In particular, workers with less than a high school diploma have been especially vulnerable to problems on the job. Among this group that comprises about one out of every ten employed adults, nearly half (48%) report thattheir hours have been cut during the recession and 23% say their full-time job was downsized to part time.
Pay in a Time of Recession
Nearly one-in-four workers say they have taken a cut in pay since the recession began 30 months ago, including22% of all full-time workers and 25% of those who are employed part time.
Payday Blues% in each group who said their employer hascut their pay during the recession
Notes: Asked of those currently employed full time orpart time (n=1,604). Income levels represent annualfamily income.
23
24
21
19
22
26
2223
24
19
20
2430
All employed
Men
Women
18-29
30-49
50+
WhitesBlacks
Hispanics
$75K+
$50K-$74K
$30K-$49K
LT $30K

8/8/2019 Pew Research Center Recession
http://slidepdf.com/reader/full/pew-research-center-recession 66/120
60
The demographic profile of workers whose pay was cut during the recession differs in striking ways from thecharacteristics of those who experienced the four other job-related cutbacks tested in the survey.
For example, minorities are no more likely than whites to have their pay cut. According to the survey, aboutequal shares of employed whites (22%), blacks (23%) and Hispanics (24%) report that their salary has been
reduced sometime during the recession, as do 24% of men and 21% of women.Similarly, the general finding that younger workers suffered more harm than their older colleagues is reversed.When it comes to pay cuts, the workers most likely to have taken a hit during the recession are middle-agedadults ages 50 to 64. Overall, 27% of these workers —who should be at the peak of their careers and earningspotential —saw their salaries reduced, compared with 19% of younger workers, 22% of workers ages 30 to 49and 20% of those 65 or older.
At the same time, wage cuts fell heaviest on those who are the least likely to afford them: adults with familyincomes of $30,000 or less. The pay of three-in-ten among this group was cut sometime during the recession,compared with 19% of workers with family incomes of $75,000 or more.
Taken together, the previous two findings show that among the groups most likely to experience pay cuts areworkers ages 50 to 64 with family incomes less than $30,000 a year. Among this group, nearly four-in-ten(38%) have had their salary reduced by their employer during the recession, compared with 28% of workersyounger than 50.
But the economic news from America‘s workplaces isn‘t all bad. Despite hard times, 20%getting a promotion or finding a better job during the recession. In addition, 38% of workers say they got a raisefrom their current employer, though 61% say they did not.
Younger workers are significantly more likely than older employees
to say they have received a raise (43% of 18- to 29-year-olds gotraises vs. 32% of those ages 50 and older) or to have gotten a better job or promotion (33% vs. 8%).
Multiple Hardships on the Job
Some employed adults have faced more than one recession-relatedproblem on the job. According to the survey, about two-in-tenworkers encountered at least two of the four hardships tested (20%).An additional 22% reported they experienced one, while 58%experienced none.
When analyzed together, patterns seen in the individual questionsnap into sharper focus. Blacks are significantly more likely thanwhites to have experienced two or more problems (28% vs. 17%).At the same time, a large majority of working whites (63%) say thatthey did not face any of the four hardships, compared with 46% of
Multiple Job Impacts% of working adults who haveexperienced this number ofjob-related hardships duringthe recession
Problems tested: Work hours reduced;pay cu t; forced to take unpaid leave;and forced to switch from full-time topart-time work.
Twoor
moreNone
20%58%
22%
One
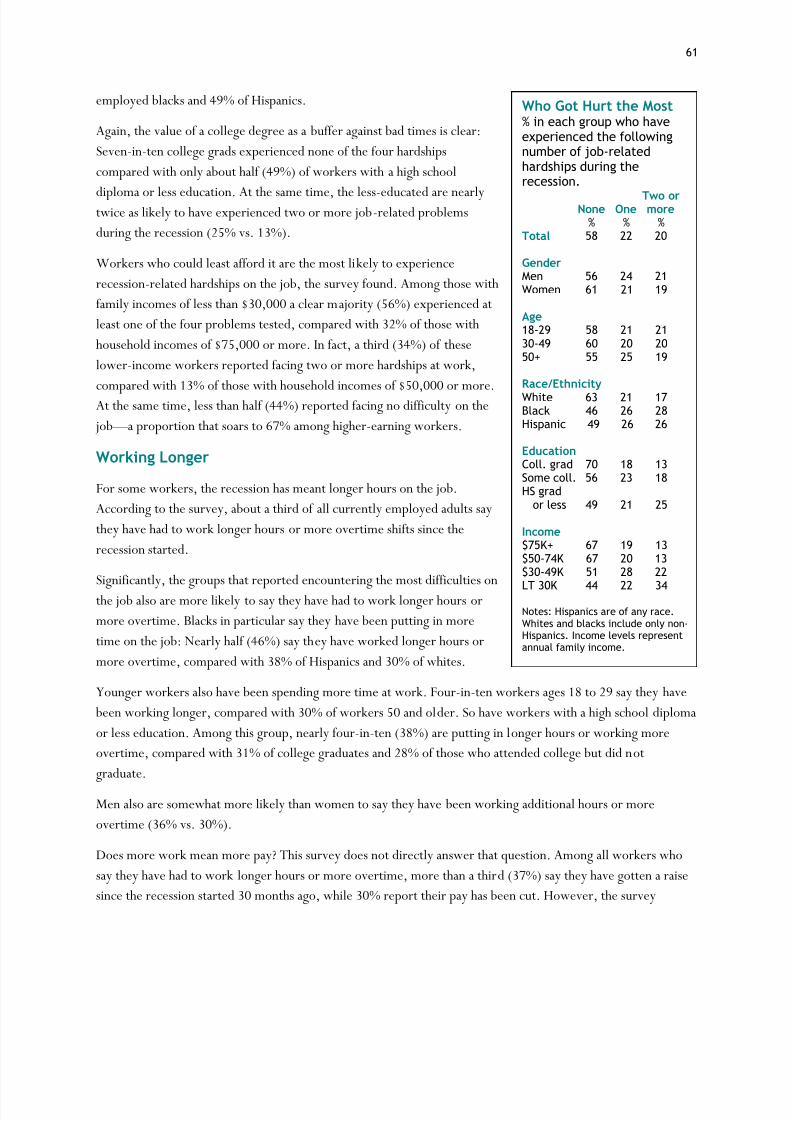
8/8/2019 Pew Research Center Recession
http://slidepdf.com/reader/full/pew-research-center-recession 67/120
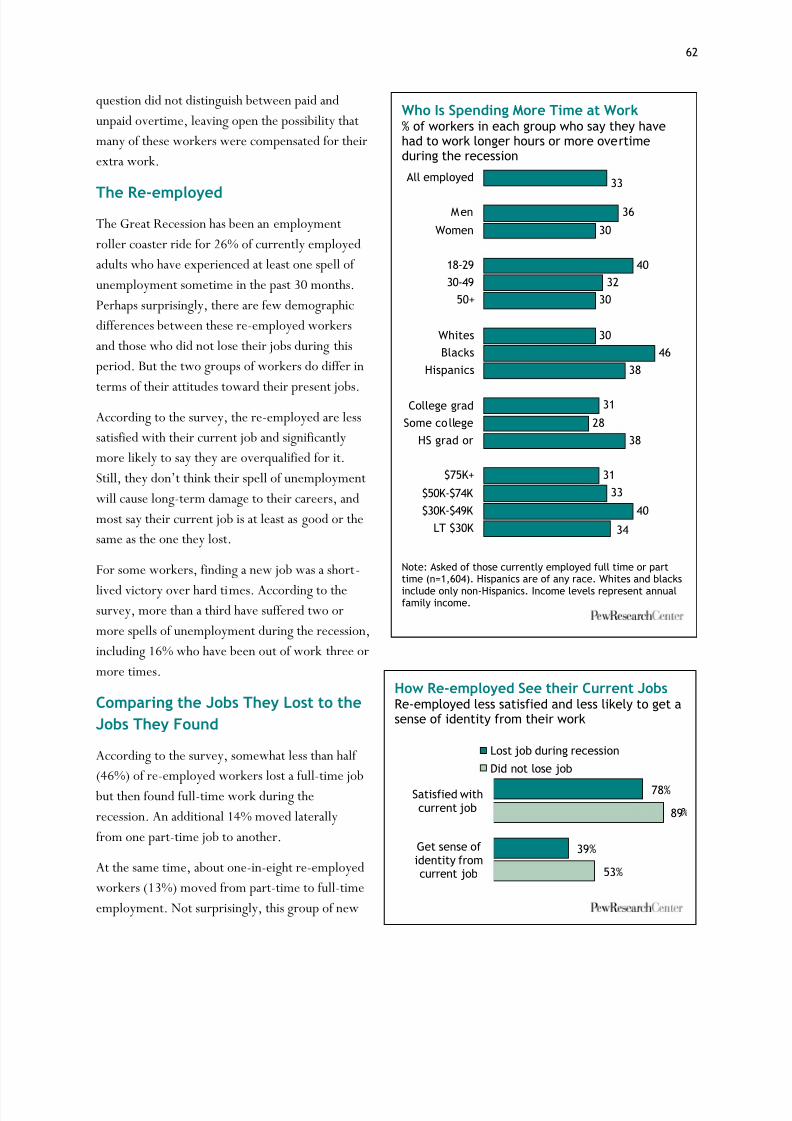
8/8/2019 Pew Research Center Recession
http://slidepdf.com/reader/full/pew-research-center-recession 68/120
62
question did not distinguish between paid andunpaid overtime, leaving open the possibility thatmany of these workers were compensated for theirextra work.
The Re-employedThe Great Recession has been an employmentroller coaster ride for 26% of currently employedadults who have experienced at least one spell of unemployment sometime in the past 30 months.Perhaps surprisingly, there are few demographicdifferences between these re-employed workersand those who did not lose their jobs during thisperiod. But the two groups of workers do differ in
terms of their attitudes toward their present jobs.According to the survey, the re-employed are lesssatisfied with their current job and significantlymore likely to say they are overqualified for it.Still, they don‘t think their spell of unemploymentwill cause long-term damage to their careers, andmost say their current job is at least as good or thesame as the one they lost.
For some workers, finding a new job was a short-
lived victory over hard times. According to thesurvey, more than a third have suffered two ormore spells of unemployment during the recession,including 16% who have been out of work three ormore times.
Comparing the Jobs They Lost to theJobs They Found
According to the survey, somewhat less than half (46%) of re-employed workers lost a full-time job but then found full-time work during therecession. An additional 14% moved laterallyfrom one part-time job to another.
At the same time, about one-in-eight re-employedworkers (13%) moved from part-time to full-timeemployment. Not surprisingly, this group of new
How Re-employed See their Current JobsRe-employed less satisfied and less likely to get asense of identity from their work
78%
39%
89
53%
Satisfied withcurrent job
Get sense ofidentity fromcurrent job
Lost job during recessionDid not lose job
Who Is Spending More Time at Work% of workers in each group who say they havehad to work longer hours or more overtimeduring the recession
Note: Asked of those currently employed full time or parttime (n=1,604). Hispanics are of any race. Whites and blacksinclude only non-Hispanics. Income levels represent annualfamily income.
33
3630
4032
30
3046
38
3128
38
3133
40
34
All employed
MenWomen
18-2930-49
50+
WhitesBlacks
Hispanics
College gradSome college
HS grad or
$75K+$50K-$74K$30K-$49K
LT $30K

8/8/2019 Pew Research Center Recession
http://slidepdf.com/reader/full/pew-research-center-recession 69/120
63
full-time workers is dominated by young people,many of whom may have gotten their first ―real‖ job. But for one-in-four re-employed workers, therecession likely marks a backward step in theircareers. Fully 26% of re-employed workers lost afull-time job and now work part time.
Employed workers who had been out of workduring the recession are somewhat less satisfiedwith their present jobs than their colleagues whowere not unemployed during the recession.Nearly 78% of all workers who lost a job duringthe downturn say they are satisfied with theircurrent job. That is 11 percentage points lowerthan the satisfaction levels of workers who did not
experience a spell of unemployment.
Nor do the re-employed get the same sense of fulfillment from their current jobs as theircolleagues who did not lose a job. About four-in-ten workers (39%) who experienced job lossduring the recession say they get a sense of identityfrom their current position. For the remainder,their job is just what they do to put bread on thetable. In sharp contrast, more than half (52%) of
all workers who did not lose their jobs during therecession get a sense of identity from their jobs.
Other survey findings suggest re-employedworkers may have settled for the best-available jobin an anemic job market.
A majority of re-employed adults (54%) say theyare overqualified for their current job, comparedwith 36% of other workers. Only a third reportthey have the right qualifications for their new job,more than 20 percentage points lower than theproportion of workers who did not lose their job.
No More Money, Benefits Aren’t better— butIt’s a Better JobHow workers compare their current job to theone they lost during the recession
Note: “Don‟t Know/Refused” responses not shown
38
39
22
26
28
39
43
24
30
More
Less
Same
Better
Worse
Same
Better
Worse
Same
Does your new job pay more, less or about thesame as your old job?
Does your new job have better, worse or aboutthe same benefits?
Considering everything, is your new job better,worse or about the same?
How Re-employed Workers Fared% of workers in each category who lost a jobsometime during the recession but are nowemployed
Note: “Don‟t know/Refused” responses are included but not
labeled.
45%
Had a full-timejob, now workpart-time
Had a full-time job,now workfull-time
13%
Had a part-time job,now workpart-time
26%
14%
Had a part-timejob, now workfull-time

8/8/2019 Pew Research Center Recession
http://slidepdf.com/reader/full/pew-research-center-recession 70/120
64
At the same time, a different set of questions produces somewhat puzzlingresults.
Overall, four-in-ten re-employed
workers say their current job pays less(39%) than the one they lost, while22% say the pay is about the same.About four-in-ten (38%) got a better-paying job despite hard times.
An even larger majority say their new job has about the same fringe benefits(39%) or worse (28%) benefits thantheir old one. Only a quarter (26%) say their current benefits are better.
Despite these lukewarm assessments, a substantial plurality (43%) says their new job is better than their old one.While the sample is too small to say with confidence, nearly a third of all workers who say they make less moneyand have worse benefits say their new job is better than (12%) or about the same (20%) as their old one.
Some of these rosy assessments may simply mean that in this bad economy, many workers are happy to have any job —even one that pays less or whose benefits aren‘t as good as in their old job.
Not surprisingly, among adults who lost a full-time job, those who found another full-time position aresignificantly more positive about their new job than those who accepted part-time employment (46% vs. 24%).
More than eight-in-ten
full-time to full-timeworkers also say theyare satisfied with their job (82%), nearly ashigh a job satisfactionlevel as among allworkers. In contrast,about seven-in-ten(72%) workers who lostfull-time jobs and nowwork part time aresatisfied with their job.
Full-time to full-timeworkers also are morelikely than part-timersto say they get a sense of identity from their current job (48% vs. 34%).
Comparing the Job They Lost to the One They HaveWorkers who lost full-time jobs but found another full-time position aremore positive about their jobs than those who accepted part-time work
46%
82%
48%
24%
72%
35%
New job better than previous job
Completely/mostly satisfied withcurrent job
Get sense of identity from job
Prevous job full-time, current job full-time
Previous job full-time, current job part-time
Most Re-employed More Likely to Say They AreOverqualified for Current Job
54%
34%
36%
57%
Lost job duringrecession
Did not losejob
Overqualified for current job Right qualifications

8/8/2019 Pew Research Center Recession
http://slidepdf.com/reader/full/pew-research-center-recession 71/120
65
Career Changes
Many re-employed workers spent thetime they were out of work reconsideringtheir job and career options. According
to the survey, about four-in-ten re-employed workers (39%) say that whenthey were unemployed they moved orseriously considered moving to an areawhere jobs were more plentiful. Aboutsix-in-ten changed careers orcontemplated doing so, while 36%sought job retraining programs or went back to school.
Taken together, the survey finds that three-quarters of all re-employed workers took one of the three steps or thought seriouslyabout doing so —and nearly half (45%) at least considered two ormore options.
Men and younger workers are significantly more likely than otherworkers to have contemplated making major changes in theirworking lives to get a job when they were out of work.
According to the survey, re-employed men are significantly morelikely than women to say they seriously thought about moving or
actually moved to a new area where jobs were more plentiful (45%vs. 31%). A somewhat larger share of these working men alsoreports they had pursued a job retraining program or more formaleducation (39% vs. 33%) while unemployed. But the same share of men and women (60%) report that while they were unemployed,they changed careers or seriously thought about going into a newfield.
While unemployed, younger workers were significantly morelikely to consider relocating and getting additional job training or
education. Among re-employed workers ages 18 to 29, nearly half (47%) say they considered picking up stakes and moving to wherethe jobs were, compared with 22% of those 50 or older. Those agedifferences are not surprising in that young adults are the leastlikely to be married, have a family, own a house or have othercharacteristics that tend to keep people anchored in their currentcommunities.
The Demographics of CareerChange% of re-employed workers in eachgroup who said they had done orseriously considered doing eachwhile unemployed
Moved Changed Enrolled into area careers, retraining,
with jobs field education% % %
Total 39 60 36
Gender
Men 45 60 39Women 31 60 33
Age18-29 47 55 4430-49 38 65 3350+ 22 62 26
Race/EthnicityWhite* 39 66 36Nonwhite 40 51 37
EducationColl. grad 43 64 38Some coll. 43 62 41
HS grador less 34 57 33
Notes: Whites include only non-Hispanicwhites. Hispanics are included in thenonwhite category and may be of any race.Income levels represent annual familyincome.
Retooling, Relocating% of re-employed who did or seriously considered doingeach while they were out of work
39
60
36
Moved or considered moving
to another part of
Changed or seriously
considered changing career
Pursued job re-retraining or
got more education
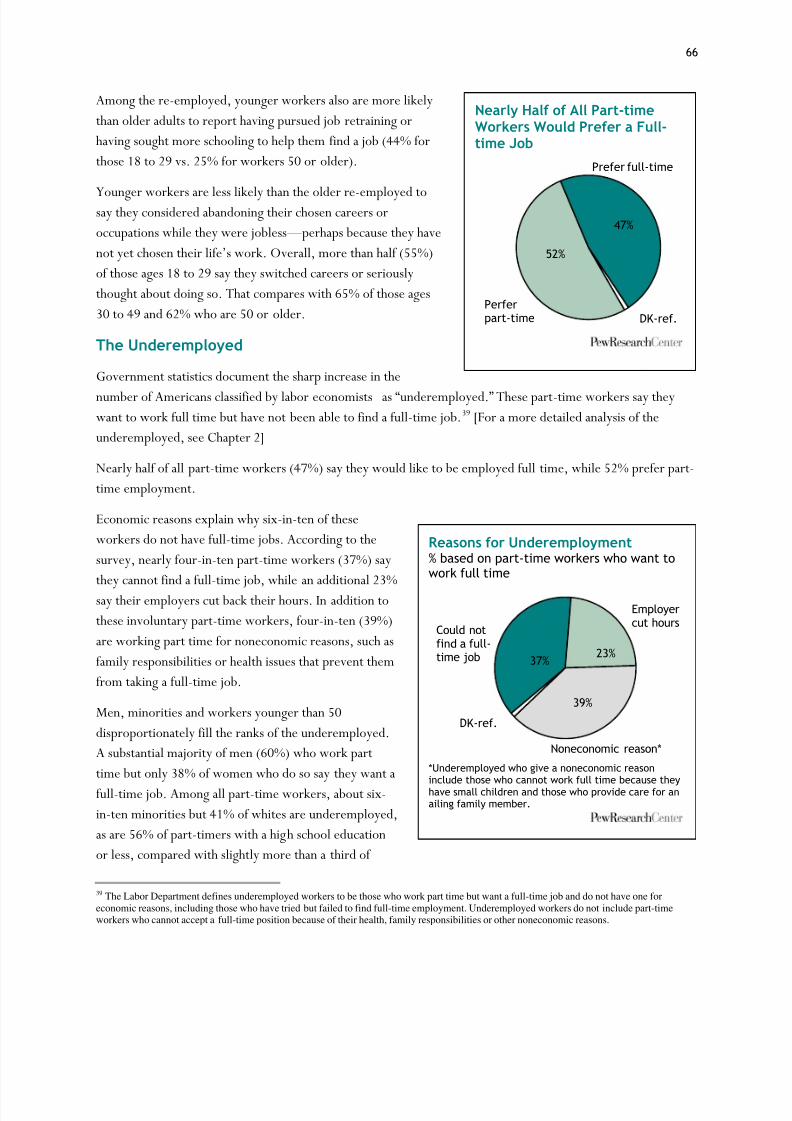
8/8/2019 Pew Research Center Recession
http://slidepdf.com/reader/full/pew-research-center-recession 72/120
66
Among the re-employed, younger workers also are more likelythan older adults to report having pursued job retraining orhaving sought more schooling to help them find a job (44% forthose 18 to 29 vs. 25% for workers 50 or older).
Younger workers are less likely than the older re-employed tosay they considered abandoning their chosen careers oroccupations while they were jobless —perhaps because they havenot yet chosen their life‘s work. Overall, more than half (55%)of those ages 18 to 29 say they switched careers or seriouslythought about doing so. That compares with 65% of those ages30 to 49 and 62% who are 50 or older.
The Underemployed
Government statistics document the sharp increase in thenumber of Americans classified by laboreconomists as ―underemployed.‖ These part-time workers say theywant to work full time but have not been able to find a full-time job.39 [For a more detailed analysis of theunderemployed, see Chapter 2]
Nearly half of all part-time workers (47%) say they would like to be employed full time, while 52% prefer part-time employment.
Economic reasons explain why six-in-ten of theseworkers do not have full-time jobs. According to thesurvey, nearly four-in-ten part-time workers (37%) saythey cannot find a full-time job, while an additional 23%say their employers cut back their hours. In addition tothese involuntary part-time workers, four-in-ten (39%)are working part time for noneconomic reasons, such asfamily responsibilities or health issues that prevent themfrom taking a full-time job.
Men, minorities and workers younger than 50disproportionately fill the ranks of the underemployed.A substantial majority of men (60%) who work parttime but only 38% of women who do so say they want afull-time job. Among all part-time workers, about six-in-ten minorities but 41% of whites are underemployed,as are 56% of part-timers with a high school educationor less, compared with slightly more than a third of
39 The Labor Department defines underemployed workers to be those who work part time but want a full-time job and do not have one foreconomic reasons, including those who have tried but failed to find full-time employment. Underemployed workers do not include part-timeworkers who cannot accept a full-time position because of their health, family responsibilities or other noneconomic reasons.
Reasons for Underemployment% based on part-time workers who want towork full time
*Underemployed who give a noneconomic reasoninclude those who cannot work full time because theyhave small children and those who provide care for anailing family member.
DK-ref.
39%
37%
Noneconomic reason*
Employercut hoursCould not
find a full-time job 23%
Nearly Half of All Part-timeWorkers Would Prefer a Full-time Job
DK-ref.
52%
Prefer full-time
Perferpart-time
47%
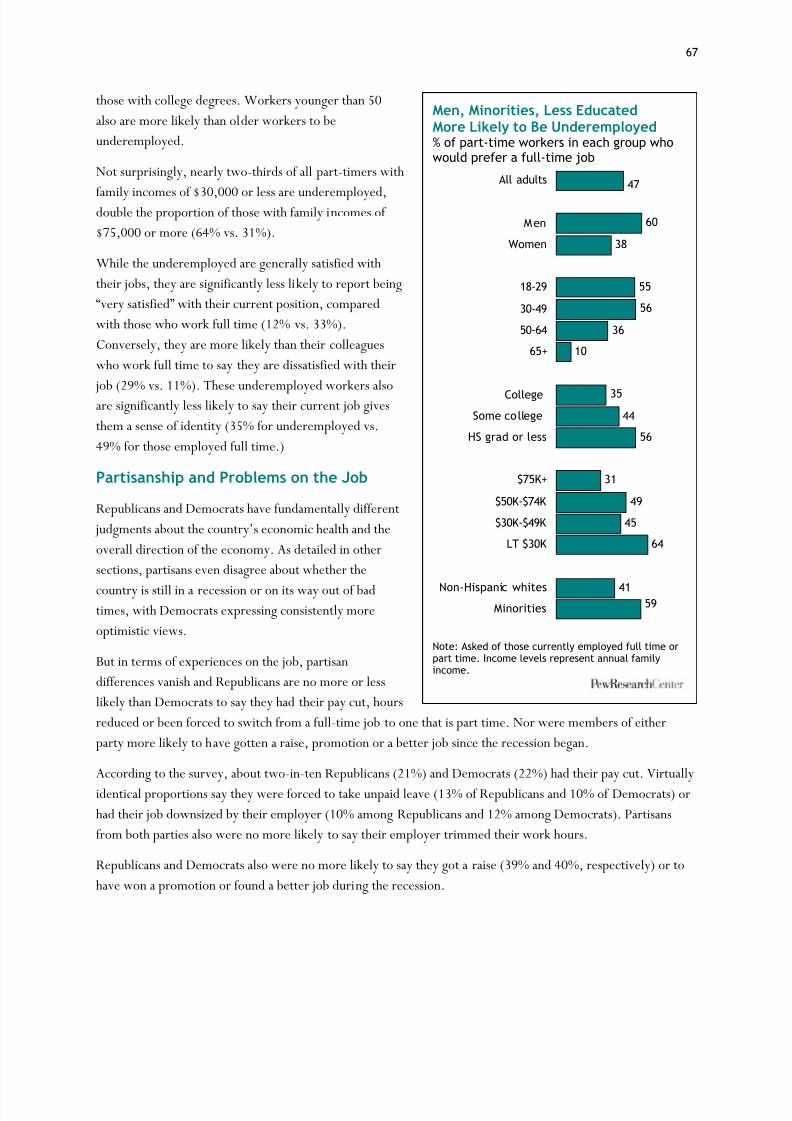
8/8/2019 Pew Research Center Recession
http://slidepdf.com/reader/full/pew-research-center-recession 73/120
67
those with college degrees. Workers younger than 50also are more likely than older workers to beunderemployed.
Not surprisingly, nearly two-thirds of all part-timers with
family incomes of $30,000 or less are underemployed,double the proportion of those with family incomes of $75,000 or more (64% vs. 31%).
While the underemployed are generally satisfied withtheir jobs, they are significantly less likely to report being―very satisfied‖ with their current position, comparedwith those who work full time (12% vs. 33%).Conversely, they are more likely than their colleagueswho work full time to say they are dissatisfied with their
job (29% vs. 11%). These underemployed workers alsoare significantly less likely to say their current job givesthem a sense of identity (35% for underemployed vs.49% for those employed full time.)
Partisanship and Problems on the Job
Republicans and Democrats have fundamentally different judgments about the country‘s economic health and theoverall direction of the economy. As detailed in othersections, partisans even disagree about whether the
country is still in a recession or on its way out of badtimes, with Democrats expressing consistently moreoptimistic views.
But in terms of experiences on the job, partisandifferences vanish and Republicans are no more or lesslikely than Democrats to say they had their pay cut, hoursreduced or been forced to switch from a full-time job to one that is part time. Nor were members of eitherparty more likely to have gotten a raise, promotion or a better job since the recession began.
According to the survey, about two-in-ten Republicans (21%) and Democrats (22%) had their pay cut. Virtuallyidentical proportions say they were forced to take unpaid leave (13% of Republicans and 10% of Democrats) orhad their job downsized by their employer (10% among Republicans and 12% among Democrats). Partisansfrom both parties also were no more likely to say their employer trimmed their work hours.
Republicans and Democrats also were no more likely to say they got a raise (39% and 40%, respectively) or tohave won a promotion or found a better job during the recession.
Men, Minorities, Less EducatedMore Likely to Be Underemployed% of part-time workers in each group whowould prefer a full-time job
Note: Asked of those currently employed full time orpart time. Income levels represent annual familyincome.
47
60
38
55
56
36
10
3544
56
31
49
45
64
4159
All adults
Men
Women
18-29
30-49
50-64
65+
CollegeSome college
HS grad or less
$75K+
$50K-$74K
$30K-$49K
LT $30K
Non-Hispanic whitesMinorities

8/8/2019 Pew Research Center Recession
http://slidepdf.com/reader/full/pew-research-center-recession 74/120
68
However, working Democrats were more likely than Republicans to have lost a job during the recession (29%vs. 20%) or to be currently unemployed —differences that seem hard to reconcile with Democrats‘ opositive assessments of the economy.

8/8/2019 Pew Research Center Recession
http://slidepdf.com/reader/full/pew-research-center-recession 75/120
69
Chapter 6: Spending, Saving, Borrowing, Retirement Confidence
The Great Recession has fundamentally changed the spending, borrowing, saving and investing habits of theAmerican public —now and quite possibly for a long time.
According to the Pew Research survey, more than six-in-ten (62%) Americans say that since the recession began, they have cut back on household spending. Half say they have reduced the amount they owe onmortgages, credit cards, car loans and other borrowing. And of those who have savings or retirement accounts,more than four-in-ten (42%) say they‘ve adopted a more conservative approach to saving and compared with just 8% who say they have taken amore aggressive approach.
Looking ahead to when the economy recovers,many say they plan to keep up this new emphasis onthrift and caution as they manage their personalfinances.
Nearly a third of Americans (31%) say they willhold down their spending, and only 12% say theywill increase their outlays once the economyimproves. About half (48%) say they plan toincrease the amount of money they save, and nearlya third (30%) plan to reduce debt levels.
The recession also has forced many Americans to dip into their investments, savings or retirement accounts topay their bills. Four-in-ten have taken money from savings or retirement accounts; nearly two-in-ten have sold
stocks, bonds or mutual funds to meet their expenses. Among the vast majority of Americans with savings orinvestments, most say they have changed the way they save or invest, generally in a more cautious direction.
The financial turmoil has shaken Americans‘ confidence that they will have enough incomthrough their retirement. Nearly a third (32%) are not confident that their nest egg will carry them throughretirement, an increase from 25% who said so in a Pew Research Center survey last year. Among those ages 62and older, 35% say they delayed retirement because of the recession; among those in the pre-retirement years(ages 50-61), fully six-in-ten (60%) say they might have to delay retirement because of the recession.
This chapter examines differences among age, race and other subgroups in responses to questions on spending,saving, borrowing and retirement confidence in the Pew Research survey. As will be demonstrated, there are
significant differences —especially by age, educational attainment and employment status —in how people haveresponded to the recession‘s impact.
Are You Spending More, Less or the Same?% saying since the recession began, they have…
Note: “Don‟t know/Refused” responses not shown.
62
30
6
Cut back
Spent about the same
Increased spending
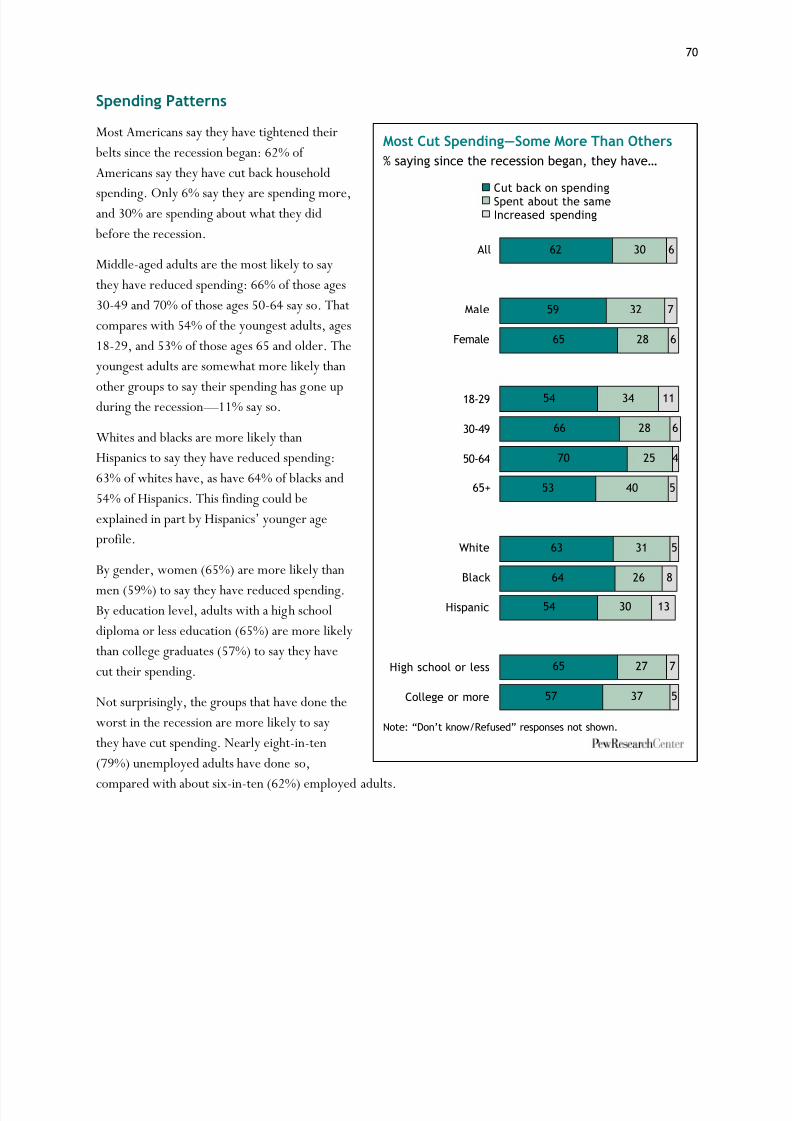
8/8/2019 Pew Research Center Recession
http://slidepdf.com/reader/full/pew-research-center-recession 76/120
70
Spending Patterns
Most Americans say they have tightened their belts since the recession began: 62% of Americans say they have cut back household
spending. Only 6% say they are spending more,and 30% are spending about what they did before the recession.
Middle-aged adults are the most likely to saythey have reduced spending: 66% of those ages30-49 and 70% of those ages 50-64 say so. Thatcompares with 54% of the youngest adults, ages18-29, and 53% of those ages 65 and older. Theyoungest adults are somewhat more likely than
other groups to say their spending has gone upduring the recession —11% say so.
Whites and blacks are more likely thanHispanics to say they have reduced spending:63% of whites have, as have 64% of blacks and54% of Hispanics. This finding could beexplained in part by Hispanics‘ younger ageprofile.
By gender, women (65%) are more likely than
men (59%) to say they have reduced spending.By education level, adults with a high schooldiploma or less education (65%) are more likelythan college graduates (57%) to say they havecut their spending.
Not surprisingly, the groups that have done theworst in the recession are more likely to saythey have cut spending. Nearly eight-in-ten(79%) unemployed adults have done so,
compared with about six-in-ten (62%) employed adults.
Most Cut Spending —Some More Than Others% saying since the recession began, they have…
Note: “Don‟t know/Refused” responses not shown.
62
59
65
54
66
70
53
63
64
54
65
57
30
32
28
34
28
25
40
31
26
30
27
37
6
7
6
11
6
4
5
5
8
13
7
5
All
Male
Female
18-29
30-49
50-64
65+
White
Black
Hispanic
High school or less
College or more
Cut back on spendingSpent about the sameIncreased spending
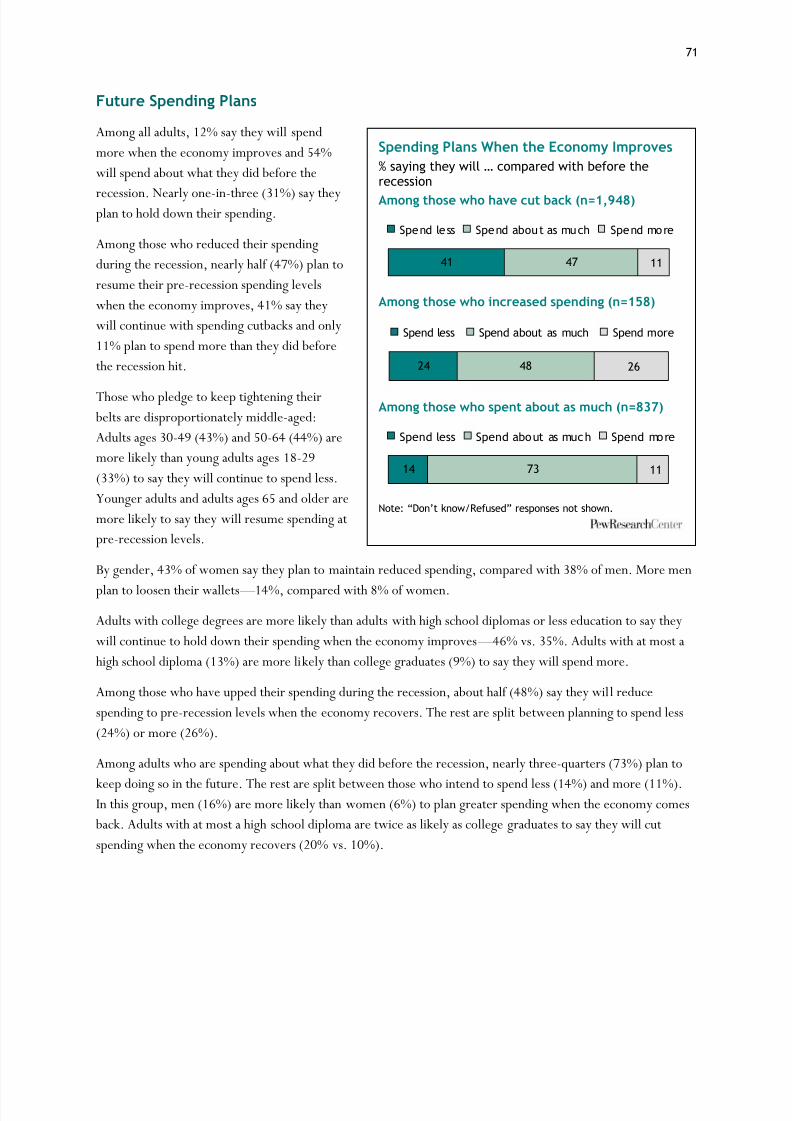
8/8/2019 Pew Research Center Recession
http://slidepdf.com/reader/full/pew-research-center-recession 77/120
71
Future Spending Plans
Among all adults, 12% say they will spendmore when the economy improves and 54%will spend about what they did before the
recession. Nearly one-in-three (31%) say theyplan to hold down their spending.
Among those who reduced their spendingduring the recession, nearly half (47%) plan toresume their pre-recession spending levelswhen the economy improves, 41% say theywill continue with spending cutbacks and only11% plan to spend more than they did beforethe recession hit.
Those who pledge to keep tightening their belts are disproportionately middle-aged:Adults ages 30-49 (43%) and 50-64 (44%) aremore likely than young adults ages 18-29(33%) to say they will continue to spend less.Younger adults and adults ages 65 and older aremore likely to say they will resume spending atpre-recession levels.
By gender, 43% of women say they plan to maintain reduced spending, compared with 38% of men. More men
plan to loosen their wallets —14%, compared with 8% of women.
Adults with college degrees are more likely than adults with high school diplomas or less education to say theywill continue to hold down their spending when the economy improves —46% vs. 35%. Adults with at most ahigh school diploma (13%) are more likely than college graduates (9%) to say they will spend more.
Among those who have upped their spending during the recession, about half (48%) say they will reducespending to pre-recession levels when the economy recovers. The rest are split between planning to spend less(24%) or more (26%).
Among adults who are spending about what they did before the recession, nearly three-quarters (73%) plan to
keep doing so in the future. The rest are split between those who intend to spend less (14%) and more (11%).In this group, men (16%) are more likely than women (6%) to plan greater spending when the economy comes back. Adults with at most a high school diploma are twice as likely as college graduates to say they will cutspending when the economy recovers (20% vs. 10%).
Spending Plans When the Economy Improves% saying they will … compared with before therecessionAmong those who have cut back (n=1,948)
Among those who increased spending (n=158)
Among those who spent about as much (n=837)
Note: “Don‟t know/Refused” responses not shown.
41 47 11
Spend le ss Spend abou t as much Spend more
24 48 26
Spend less Spend about as much Spend more
14 73 11
Spend less Spend about as much Spend more
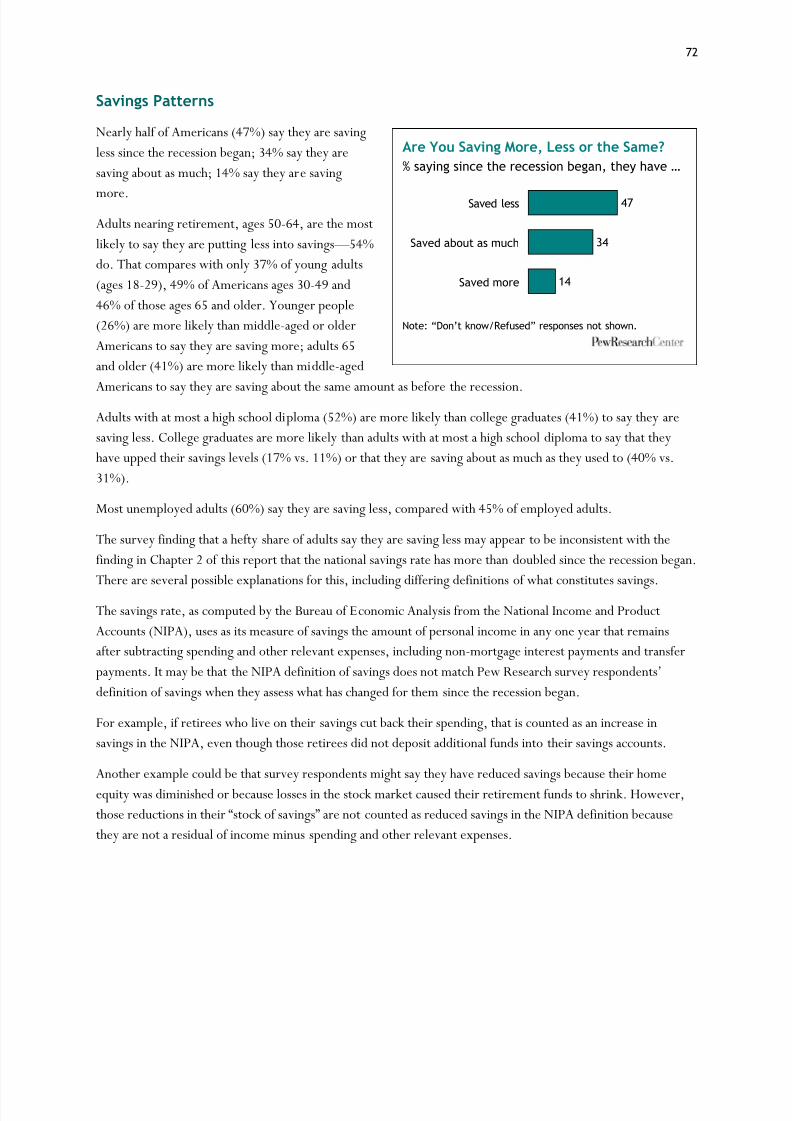
8/8/2019 Pew Research Center Recession
http://slidepdf.com/reader/full/pew-research-center-recession 78/120
72
Savings Patterns
Nearly half of Americans (47%) say they are savingless since the recession began; 34% say they aresaving about as much; 14% say they are saving
more.Adults nearing retirement, ages 50-64, are the mostlikely to say they are putting less into savings —54%do. That compares with only 37% of young adults(ages 18-29), 49% of Americans ages 30-49 and46% of those ages 65 and older. Younger people(26%) are more likely than middle-aged or olderAmericans to say they are saving more; adults 65and older (41%) are more likely than middle-aged
Americans to say they are saving about the same amount as before the recession.Adults with at most a high school diploma (52%) are more likely than college graduates (41%) to say they aresaving less. College graduates are more likely than adults with at most a high school diploma to say that theyhave upped their savings levels (17% vs. 11%) or that they are saving about as much as they used to (40% vs.31%).
Most unemployed adults (60%) say they are saving less, compared with 45% of employed adults.
The survey finding that a hefty share of adults say they are saving less may appear to be inconsistent with thefinding in Chapter 2 of this report that the national savings rate has more than doubled since the recession began.There are several possible explanations for this, including differing definitions of what constitutes savings.
The savings rate, as computed by the Bureau of Economic Analysis from the National Income and ProductAccounts (NIPA), uses as its measure of savings the amount of personal income in any one year that remainsafter subtracting spending and other relevant expenses, including non-mortgage interest payments and transferpayments. It may be that the NIPA definition of savings does not match Pew Research surdefinition of savings when they assess what has changed for them since the recession began.
For example, if retirees who live on their savings cut back their spending, that is counted as an increase insavings in the NIPA, even though those retirees did not deposit additional funds into their savings accounts.
Another example could be that survey respondents might say they have reduced savings because their homeequity was diminished or because losses in the stock market caused their retirement funds to shrink. However,those reductions in their ―stock of savings‖ are not counted as reduced savings in the NIthey are not a residual of income minus spending and other relevant expenses.
Are You Saving More, Less or the Same?% saying since the recession began, they have …
Note: “Don‟t know/Refused” responses not shown.
47
34
14
Saved less
Saved about as much
Saved more
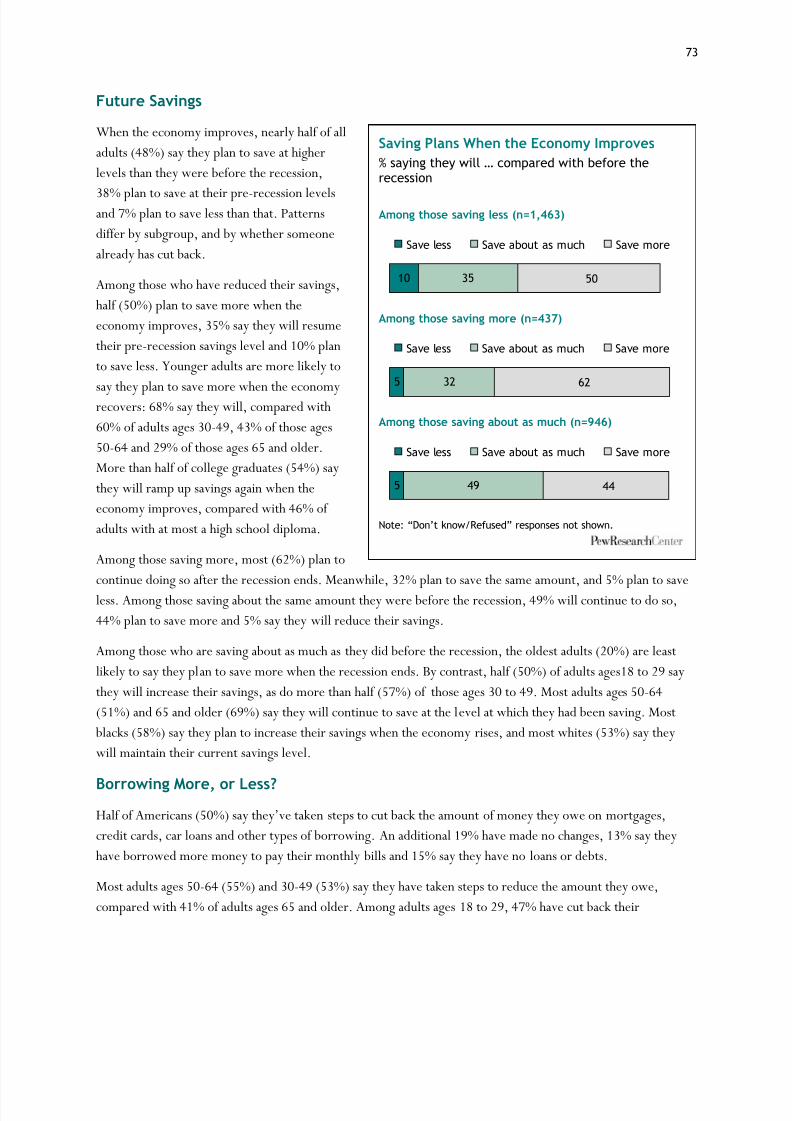
8/8/2019 Pew Research Center Recession
http://slidepdf.com/reader/full/pew-research-center-recession 79/120
73
Future Savings
When the economy improves, nearly half of alladults (48%) say they plan to save at higherlevels than they were before the recession,
38% plan to save at their pre-recession levelsand 7% plan to save less than that. Patternsdiffer by subgroup, and by whether someonealready has cut back.
Among those who have reduced their savings,half (50%) plan to save more when theeconomy improves, 35% say they will resumetheir pre-recession savings level and 10% planto save less. Younger adults are more likely to
say they plan to save more when the economyrecovers: 68% say they will, compared with60% of adults ages 30-49, 43% of those ages50-64 and 29% of those ages 65 and older.More than half of college graduates (54%) saythey will ramp up savings again when theeconomy improves, compared with 46% of adults with at most a high school diploma.
Among those saving more, most (62%) plan tocontinue doing so after the recession ends. Meanwhile, 32% plan to save the same amount, and 5% plan to saveless. Among those saving about the same amount they were before the recession, 49% will continue to do so,44% plan to save more and 5% say they will reduce their savings.
Among those who are saving about as much as they did before the recession, the oldest adults (20%) are leastlikely to say they plan to save more when the recession ends. By contrast, half (50%) of adults ages18 to 29 saythey will increase their savings, as do more than half (57%) of those ages 30 to 49. Most adults ages 50-64(51%) and 65 and older (69%) say they will continue to save at the level at which they had been saving. Most blacks (58%) say they plan to increase their savings when the economy rises, and most whites (53%) say theywill maintain their current savings level.
Borrowing More, or Less?Half of Americans (50%) say they‘ve taken steps to cut back the amount of money they ocredit cards, car loans and other types of borrowing. An additional 19% have made no changes, 13% say theyhave borrowed more money to pay their monthly bills and 15% say they have no loans or debts.
Most adults ages 50-64 (55%) and 30-49 (53%) say they have taken steps to reduce the amount they owe,compared with 41% of adults ages 65 and older. Among adults ages 18 to 29, 47% have cut back their
Saving Plans When the Economy Improves% saying they will … compared with before therecession
Among those saving less (n=1,463)
Among those saving more (n=437)
Among those saving about as much (n=946)
Note: “Don‟t know/Refused” responses not shown.
10 35 50
Save less Save about as much Save more
5 32 62
Save less Save about as much Save more
5 49 44
Save less Save about as much Save more

8/8/2019 Pew Research Center Recession
http://slidepdf.com/reader/full/pew-research-center-recession 80/120
74
borrowing. These young adults (17%) and thoseages 30-49 (15%) are somewhat more likely thanthose ages 50-64 (11%) or 65 and older (8%) to saythey increased their borrowing.
When it comes to cutting back, whites (51%) and blacks (54%) are more likely than Hispanics (43%)to say they have done so. When it comes toincreasing borrowing, blacks (17%) and Hispanics(24%) are more likely than whites (10%) to saythey have done that. Adults ages 65 and older(26%) are more likely than younger adults to saythey have no debts.
Adults with at most a high school diploma are more
likely than college graduates to have upped theirloan balances during the recession (15% vs. 9%).They also are more likely than college graduates tohave no debts or loans (18% vs. 13%).
Unemployed adults are more likely than employedadults to say they have increased their borrowingduring the recession (22% vs. 13%).
Future Borrowing
Most adults (54%) say they do not expect to changetheir current level of borrowing when the economyimproves. About one-in-three (30%) say they willdecrease borrowing, and 9% plan to increase borrowing.
The most notable finding by age on this question isa split between the oldest age group and other agegroups. Nearly two-thirds (65%) of adults ages 65and older plan no change in their level of borrowing, compared with half or slightly morethan half of middle-aged or younger adults.
Unemployed people are more likely than theemployed to say their borrowing will increase(14% vs. 9%). Employed people are more likely to say their borrowing will remain the same (52% vs. 46%).
Borrowing Plans When the EconomyImproves% saying that when the economy improves, theywill …
Note: “Don‟t know/Refused” responses not shown.
9
54
30
Increase borrowing
Borrow about the sameamount
Decrease borrowing
Are You Borrowing More Money or CuttingBack on What You Owe?% saying during the recession, they …
Note: “Don‟t know/Refused” re sponses not shown.Question wording: I‟d like you to think about the money youowe on your credit cards, mortgage, car loans and otherkinds of loans. During the recession, did you have to borrowmore money to pay your monthly bills, or did you take stepsto cut back what you owe?
13
50
19
2
15
Borrowed more
Cut back
Neither borrowed morenor cut back (VOL.)
Did both (VOL.)
No debts or loans (VOL.)
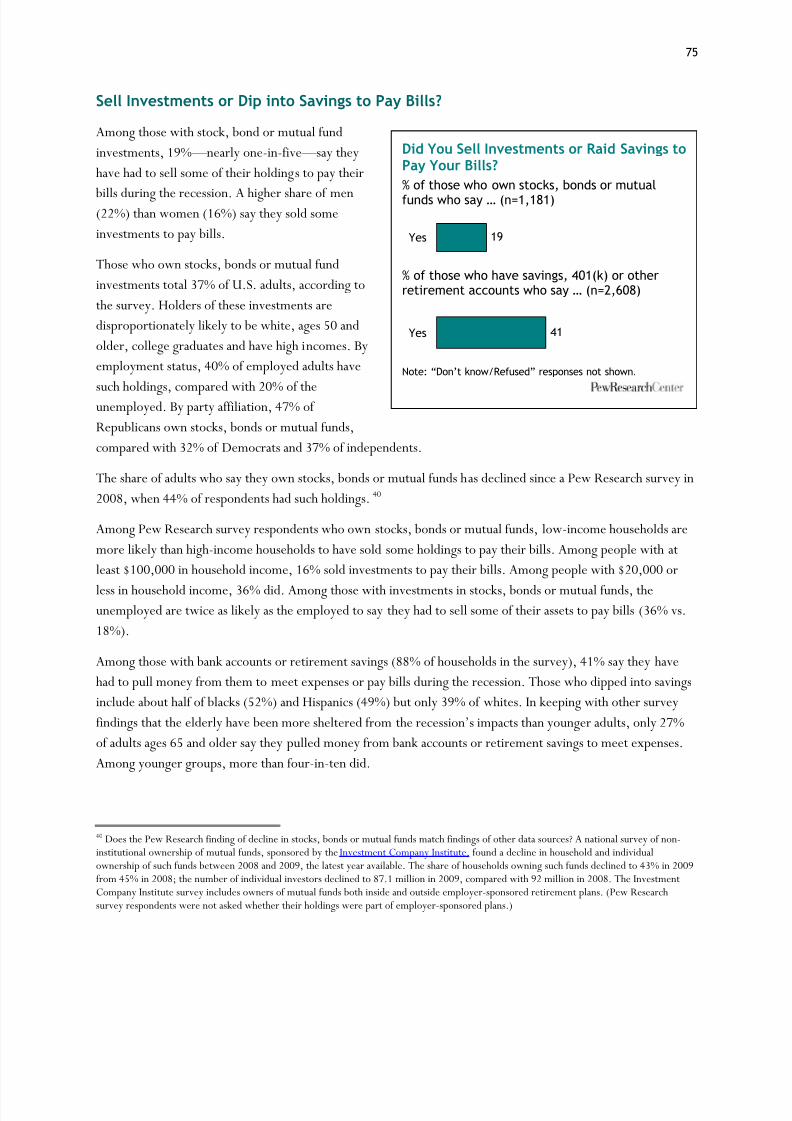
8/8/2019 Pew Research Center Recession
http://slidepdf.com/reader/full/pew-research-center-recession 81/120
75
Sell Investments or Dip into Savings to Pay Bills?
Among those with stock, bond or mutual fundinvestments, 19% —nearly one-in-five —say theyhave had to sell some of their holdings to pay their
bills during the recession. A higher share of men(22%) than women (16%) say they sold someinvestments to pay bills.
Those who own stocks, bonds or mutual fundinvestments total 37% of U.S. adults, according tothe survey. Holders of these investments aredisproportionately likely to be white, ages 50 andolder, college graduates and have high incomes. Byemployment status, 40% of employed adults have
such holdings, compared with 20% of theunemployed. By party affiliation, 47% of Republicans own stocks, bonds or mutual funds,compared with 32% of Democrats and 37% of independents.
The share of adults who say they own stocks, bonds or mutual funds has declined since a Pew Research survey in2008, when 44% of respondents had such holdings.40
Among Pew Research survey respondents who own stocks, bonds or mutual funds, low-income households aremore likely than high-income households to have sold some holdings to pay their bills. Among people with atleast $100,000 in household income, 16% sold investments to pay their bills. Among people with $20,000 or
less in household income, 36% did. Among those with investments in stocks, bonds or mutual funds, theunemployed are twice as likely as the employed to say they had to sell some of their assets to pay bills (36% vs.18%).
Among those with bank accounts or retirement savings (88% of households in the survey), 41% say they havehad to pull money from them to meet expenses or pay bills during the recession. Those who dipped into savingsinclude about half of blacks (52%) and Hispanics (49%) but only 39% of whites. In keeping with other surveyfindings that the elderly have been more sheltered from the recession‘s impacts than younger adul of adults ages 65 and older say they pulled money from bank accounts or retirement savings to meet expenses.Among younger groups, more than four-in-ten did.
40 Does the Pew Research finding of decline in stocks, bonds or mutual funds match findings of other data sources? A national survey of non-institutional ownership of mutual funds, sponsored by the Investment Company Institute, found a decline in household and individualownership of such funds between 2008 and 2009, the latest year available. The share of households owning such funds declined to 43% in 2009from 45% in 2008; the number of individual investors declined to 87.1 million in 2009, compared with 92 million in 2008. The InvestmentCompany Institute survey includes owners of mutual funds both inside and outside employer-sponsored retirement plans. (Pew Researchsurvey respondents were not asked whether their holdings were part of employer-sponsored plans.)
Did You Sell Investments or Raid Savings toPay Your Bills?% of those who own stocks, bonds or mutualfunds who say … (n=1,181)
% of those who have savings, 401(k) or otherretirement accounts who say … (n=2,608)
Note: “Don‟t know/Refused” responses not shown.
19Yes
41Yes
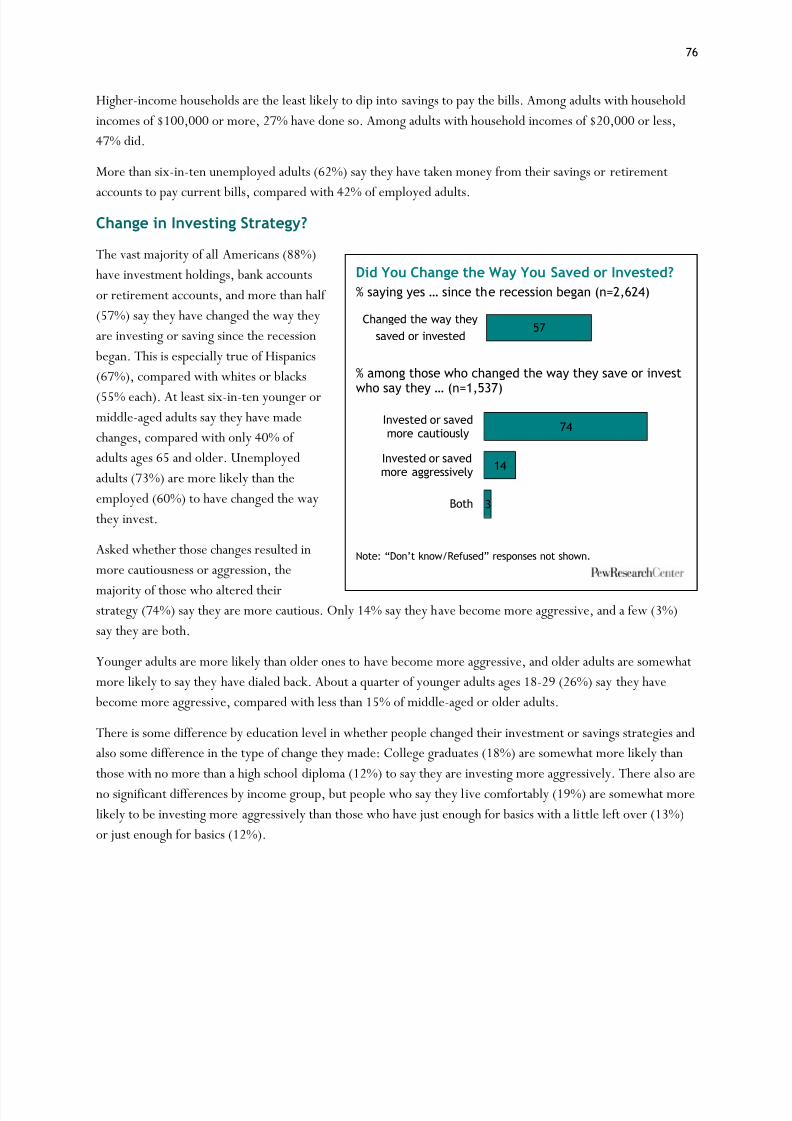
8/8/2019 Pew Research Center Recession
http://slidepdf.com/reader/full/pew-research-center-recession 82/120
76
Higher-income households are the least likely to dip into savings to pay the bills. Among adults with householdincomes of $100,000 or more, 27% have done so. Among adults with household incomes of $20,000 or less,47% did.
More than six-in-ten unemployed adults (62%) say they have taken money from their savings or retirement
accounts to pay current bills, compared with 42% of employed adults.Change in Investing Strategy?
The vast majority of all Americans (88%)have investment holdings, bank accountsor retirement accounts, and more than half (57%) say they have changed the way theyare investing or saving since the recession began. This is especially true of Hispanics(67%), compared with whites or blacks(55% each). At least six-in-ten younger ormiddle-aged adults say they have madechanges, compared with only 40% of adults ages 65 and older. Unemployedadults (73%) are more likely than theemployed (60%) to have changed the waythey invest.
Asked whether those changes resulted inmore cautiousness or aggression, the
majority of those who altered theirstrategy (74%) say they are more cautious. Only 14% say they have become more aggressive, and a few (3%)say they are both.
Younger adults are more likely than older ones to have become more aggressive, and older adults are somewhatmore likely to say they have dialed back. About a quarter of younger adults ages 18-29 (26%) say they have become more aggressive, compared with less than 15% of middle-aged or older adults.
There is some difference by education level in whether people changed their investment or savings strategies andalso some difference in the type of change they made: College graduates (18%) are somewhat more likely thanthose with no more than a high school diploma (12%) to say they are investing more aggressively. There also areno significant differences by income group, but people who say they live comfortably (19%) are somewhat morelikely to be investing more aggressively than those who have just enough for basics with a little left over (13%)or just enough for basics (12%).
Did You Change the Way You Saved or Invested?% saying yes … since the recession began (n=2,624)
% among those who changed the way they save or invest
who say they … (n=1,537)
Note: “Don‟t know/Refused” responses not shown.
57Changed the way they
saved or invested
74
14
3
Invested or savedmore cautiously
Invested or savedmore aggressively
Both
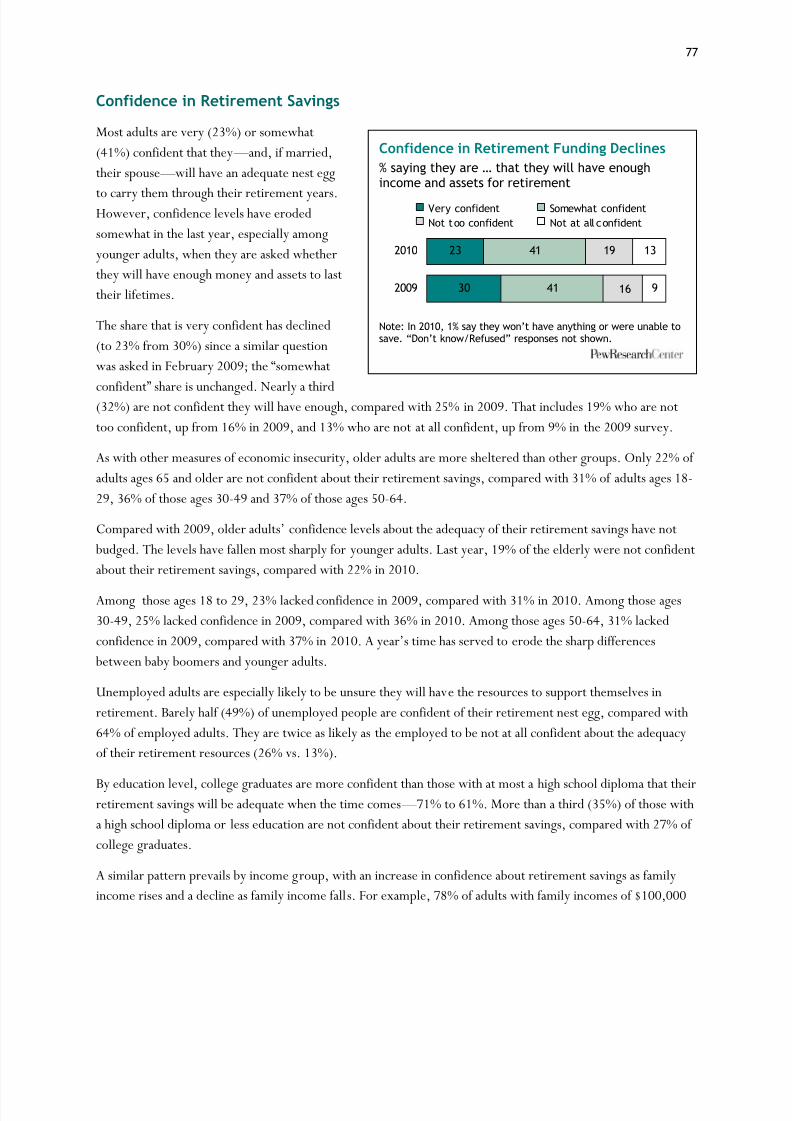
8/8/2019 Pew Research Center Recession
http://slidepdf.com/reader/full/pew-research-center-recession 83/120
77
Confidence in Retirement Savings
Most adults are very (23%) or somewhat(41%) confident that they —and, if married,their spouse —will have an adequate nest egg
to carry them through their retirement years.However, confidence levels have erodedsomewhat in the last year, especially amongyounger adults, when they are asked whetherthey will have enough money and assets to lasttheir lifetimes.
The share that is very confident has declined(to 23% from 30%) since a similar questionwas asked in February 2009; the ―somewhat
confident‖ share is unchanged. Nearly a third(32%) are not confident they will have enough, compared with 25% in 2009. That includes 19% who are nottoo confident, up from 16% in 2009, and 13% who are not at all confident, up from 9% in the 2009 survey.
As with other measures of economic insecurity, older adults are more sheltered than other groups. Only 22% of adults ages 65 and older are not confident about their retirement savings, compared with 31% of adults ages 18-29, 36% of those ages 30-49 and 37% of those ages 50-64.
Compared with 2009, older adults‘ confidence levels about the adequacy of their retireme budged. The levels have fallen most sharply for younger adults. Last year, 19% of the elderly were not confidentabout their retirement savings, compared with 22% in 2010.
Among those ages 18 to 29, 23% lacked confidence in 2009, compared with 31% in 2010. Among those ages30-49, 25% lacked confidence in 2009, compared with 36% in 2010. Among those ages 50-64, 31% lackedconfidence in 2009, compared with 37% in 2010. A year‘s time has served to erode the sh between baby boomers and younger adults.
Unemployed adults are especially likely to be unsure they will have the resources to support themselves inretirement. Barely half (49%) of unemployed people are confident of their retirement nest egg, compared with64% of employed adults. They are twice as likely as the employed to be not at all confident about the adequacyof their retirement resources (26% vs. 13%).
By education level, college graduates are more confident than those with at most a high school diploma that theirretirement savings will be adequate when the time comes —71% to 61%. More than a third (35%) of those witha high school diploma or less education are not confident about their retirement savings, compared with 27% of college graduates.
A similar pattern prevails by income group, with an increase in confidence about retirement savings as familyincome rises and a decline as family income falls. For example, 78% of adults with family incomes of $100,000
Confidence in Retirement Funding Declines% saying they are … that they will have enoughincome and assets for retirement
Note: In 2010, 1% say they won‟t have anything or were unable tosave. “Don‟t know/Refused” responses not shown.
30
23
41
41 19
9
13
162009
2010
Very confident Somewhat confidentNot too confident Not at all confident
8/8/2019 Pew Research Center Recession
http://slidepdf.com/reader/full/pew-research-center-recession 84/120
78
or more are confident about their retirement savings, compared with 55% among adults with family incomes of $30,000 or less.
Adults who are unsure about their retirement income and assets are more likely than those who are confident tohave cut back spending or be planning to do so. Among the unsure, 77% have cut spending, compared with 55%
of those who are confident. The unsure also are more likely than those who are confident to have cut savings(65% to 38%) and borrowing (57% vs. 47%).
In terms of income and assets, people who are unsure about their retirement are less likely to have high familyincomes and to own stocks, bonds or mutual funds than people who are confident about their nest eggs.
The Pew Research survey also asked respondents whether they might have to delay their retirement. Amongthose ages 50-61 who are currently employed, 60% say they may have to delay their retirement because of therecession. Roughly a third (34%) say they will not have to delay retirement, and 5% arentreatment of this question can be found in Chapter 4.]
The share saying they may have to delay retirement is even higher among those who are unsure they will haveenough of a nest egg to carry them through their retirement years. Among those ages 50-61 and not retired,82% of those who are unsure say they may have to delay retirement, compared with 47% of those who areconfident about their income and assets.

8/8/2019 Pew Research Center Recession
http://slidepdf.com/reader/full/pew-research-center-recession 85/120
79
Chapter 7: The Housing Bust
About half of all homeowners say their home is worth lessnow than it was before the recession began, and of these,nearly nine-in-ten predict it will be at least three years for
their home to return to its pre-recession value. Yet thesereversals have not substantially diminished the belief of mostAmericans that a home is the best way to protect and growtheir money. Despite the battering home prices have taken,eight-in-ten respondents agree that a home is ―the best long-term investment‖ they can make.
According to the Pew Research Center survey, fully 48% of all homeowners say their home has decreased in value duringthe recession. For a quarter of all American homeowners,
the decline has been particularly severe: 26% report thevalue of their home hasdeclined ―a lot,‖ while somewhatfewer (22%) report a smaller drop.
A lucky few —only 12% of all homeowners —report theirhome increased in value despite hard times. One-third say the value of their home has not changed.
Home Values Plummet in West
While the slumping economy has affected nearly all Americans, some homeowners have been hit harder thanothers. The recession has been particularly difficult for homeowners in the West and Midwest. Those ages 30 to
64 are more likely than younger or older respondents to see their housing prices tumble, the survey found.More affluent homeowners also are more likely than the least affluent to report that their house was worth less.
Nearly two-thirds of all homeowners in the West (65%) report the value of their home declined since therecession began in December 2007. The drop in housing prices was not as broadly felt in the East or in theSouth, where 41% of all homeowners in each region say their home is now worth less than it was before therecession started. In the Midwest, about half (51%) say the value of their home fell.
This paper loss was particularly large for Westerners —not surprising, given the headlines over the past 2½years about the dismal housing markets instates such as California, Arizona and
Nevada. Four-in-ten (40%) say theirhome is worth ―a lot less‖ now than it wasat the start of the recession, comparedwith 24% of homeowners in the Southand Midwest and 18% of those living inthe East.
Home Values Tumble% of homeowners who say that duringthe recession their home value has …
Note: Based on 1,937 homeowners.
DK/Ref
33%
Gonedown a
Gone downa little
Goneup a lot
22%
Stayed thesame
26%
8%
4%
Gone upa little
How Long for Home Value to Recover?
10%
47%
39%
Two years or less
Three to five years
Six years or longer
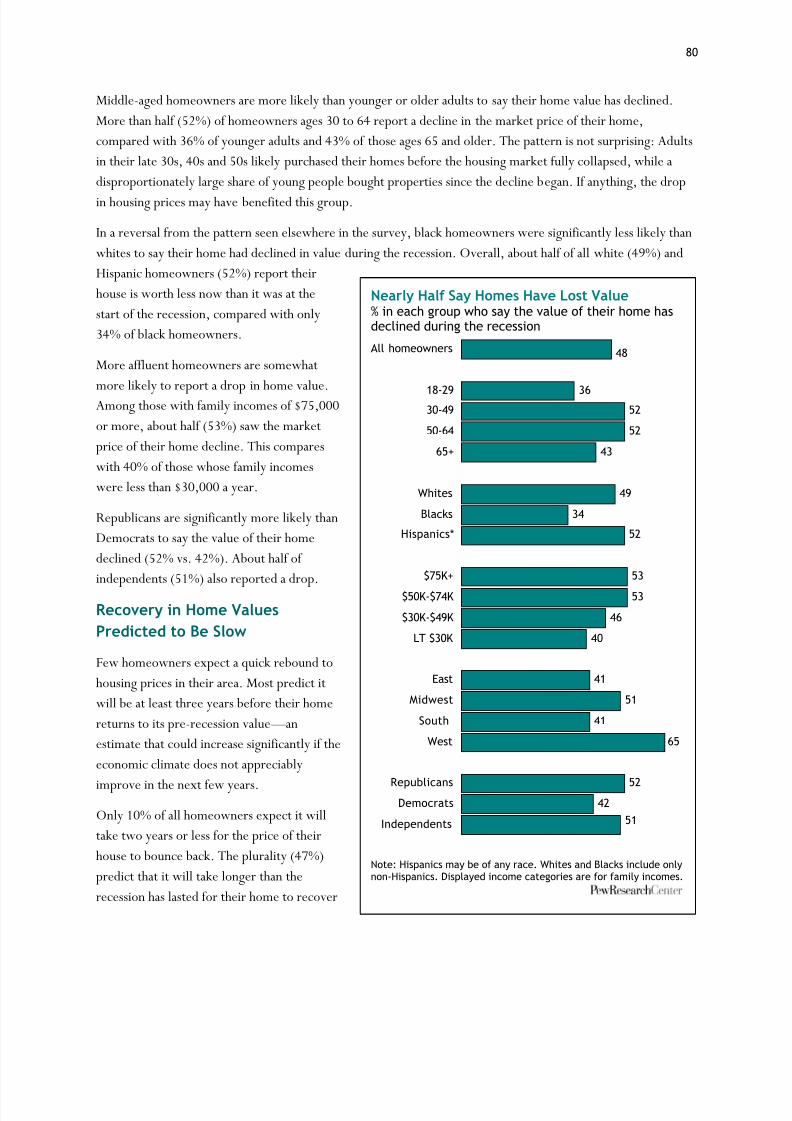
8/8/2019 Pew Research Center Recession
http://slidepdf.com/reader/full/pew-research-center-recession 86/120
80
Middle-aged homeowners are more likely than younger or older adults to say their home value has declined.More than half (52%) of homeowners ages 30 to 64 report a decline in the market price of their home,compared with 36% of younger adults and 43% of those ages 65 and older. The pattern is not surprising: Adultsin their late 30s, 40s and 50s likely purchased their homes before the housing market fully collapsed, while adisproportionately large share of young people bought properties since the decline began. If anything, the dropin housing prices may have benefited this group.
In a reversal from the pattern seen elsewhere in the survey, black homeowners were significantly less likely thanwhites to say their home had declined in value during the recession. Overall, about half of all white (49%) andHispanic homeowners (52%) report theirhouse is worth less now than it was at thestart of the recession, compared with only34% of black homeowners.
More affluent homeowners are somewhat
more likely to report a drop in home value.Among those with family incomes of $75,000or more, about half (53%) saw the marketprice of their home decline. This compareswith 40% of those whose family incomeswere less than $30,000 a year.
Republicans are significantly more likely thanDemocrats to say the value of their homedeclined (52% vs. 42%). About half of independents (51%) also reported a drop.
Recovery in Home ValuesPredicted to Be Slow
Few homeowners expect a quick rebound tohousing prices in their area. Most predict itwill be at least three years before their homereturns to its pre-recession value —anestimate that could increase significantly if theeconomic climate does not appreciably
improve in the next few years.
Only 10% of all homeowners expect it willtake two years or less for the price of theirhouse to bounce back. The plurality (47%)predict that it will take longer than therecession has lasted for their home to recover
Nearly Half Say Homes Have Lost Value% in each group who say the value of their home hasdeclined during the recession
Note: Hispanics may be of any race. Whites and Blacks include onlynon-Hispanics. Displayed income categories are for family incomes.
48
3652
52
43
49
34
52
53
53
46
40
41
51
41
65
5242
51
All homeowners
18-2930-49
50-64
65+
Whites
Blacks
Hispanics*
$75K+
$50K-$74K
$30K-$49K
LT $30K
East
Midwest
South
West
RepublicansDemocrats
Independents
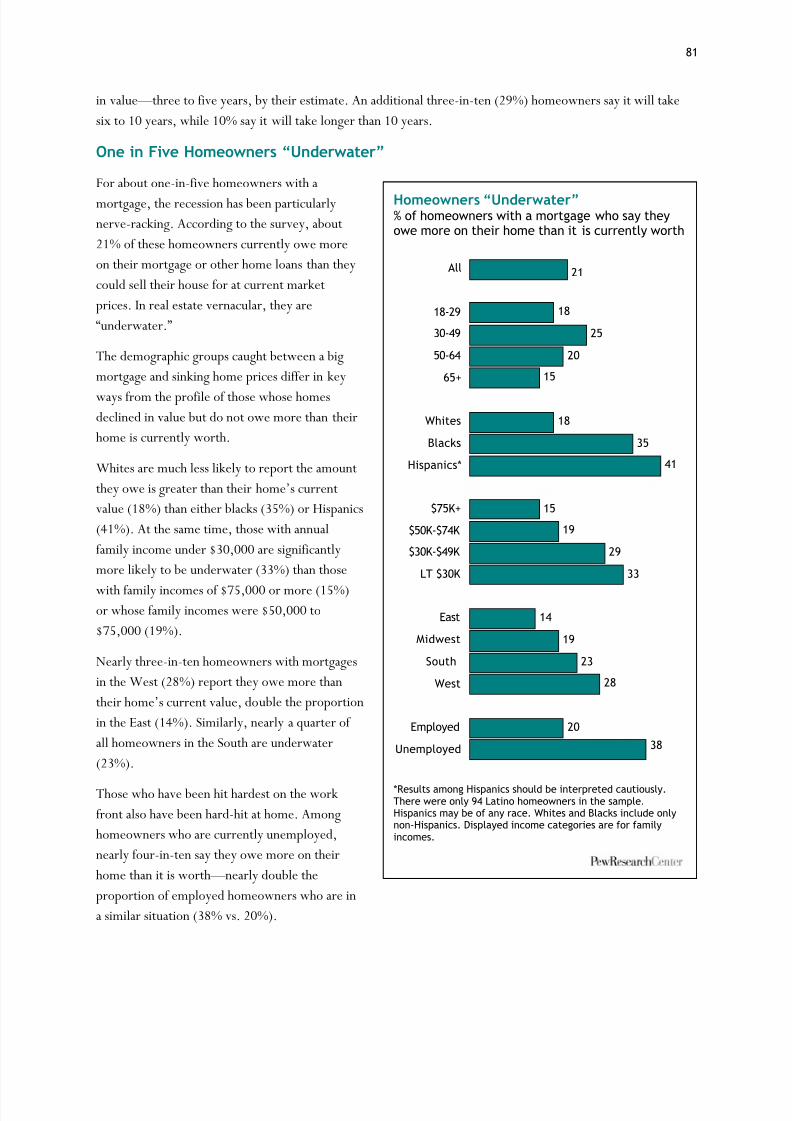
8/8/2019 Pew Research Center Recession
http://slidepdf.com/reader/full/pew-research-center-recession 87/120
81
in value —three to five years, by their estimate. An additional three-in-ten (29%) homeowners say it will takesix to 10 years, while 10% say it will take longer than 10 years.
One in Five Homeowners “Underwater”
For about one-in-five homeowners with amortgage, the recession has been particularlynerve-racking. According to the survey, about21% of these homeowners currently owe moreon their mortgage or other home loans than theycould sell their house for at current marketprices. In real estate vernacular, they are―underwater.‖
The demographic groups caught between a bigmortgage and sinking home prices differ in keyways from the profile of those whose homesdeclined in value but do not owe more than theirhome is currently worth.
Whites are much less likely to report the amountthey owe is greater than their home‘s currentvalue (18%) than either blacks (35%) or Hispanics(41%). At the same time, those with annualfamily income under $30,000 are significantlymore likely to be underwater (33%) than those
with family incomes of $75,000 or more (15%)or whose family incomes were $50,000 to$75,000 (19%).
Nearly three-in-ten homeowners with mortgagesin the West (28%) report they owe more thantheir home‘s current value, double the proportionin the East (14%). Similarly, nearly a quarter of all homeowners in the South are underwater(23%).
Those who have been hit hardest on the workfront also have been hard-hit at home. Amonghomeowners who are currently unemployed,nearly four-in-ten say they owe more on theirhome than it is worth —nearly double theproportion of employed homeowners who are ina similar situation (38% vs. 20%).
Homeowners “Underwater” % of homeowners with a mortgage who say theyowe more on their home than it is currently worth
*Results among Hispanics should be interpreted cautiously.There were only 94 Latino homeowners in the sample.Hispanics may be of any race. Whites and Blacks include onlynon-Hispanics. Displayed income categories are for familyincomes.
21
18
25
20
15
18
35
41
15
19
29
33
14
19
23
28
2038
All
18-29
30-49
50-64
65+
Whites
Blacks
Hispanics*
$75K+
$50K-$74K
$30K-$49K
LT $30K
East
Midwest
South
West
Employed
Unemployed

8/8/2019 Pew Research Center Recession
http://slidepdf.com/reader/full/pew-research-center-recession 88/120
82
In contrast, there is no difference in the proportion of Republicans (23%) and Democrats (23%) who say they areunderwater. Slightly fewer self-described politicalindependents (18%) say they owe more than their house wouldsell for in today‘s housing market.
In Debt and Underwater
Those homeowners who have the most to pay off on their homeloans are also the most likely to be underwater.
Overall, about a third of all homeowners own their homes freeand clear, while about one-in-six (17%) say they have paid off more than half of their home loans. Slightly more than a third(35%) say they have paid off less than half of their housing debt,while the remainder (13%) still owe about half.
Among those who still owemore than half, about one-in-four (27%) say they areunderwater. That is more thandouble the proportion of thosewho say they have paid off morethan half of their home debt(11%) and substantially morethan those who still owe about
half (19%).
The recent ups and downs of thehousing market likely explainmost of this correlation. Those with thelargest unpaid home debt likely are thosewho purchased homes relatively recentlyand have just started paying them off. Incontrast, most of those who purchasedhomes a decade or more ago have already
paid off a portion of their mortgages and benefited from sharply rising home prices before the bottom fell out of the housingmarket in the mid-2000s.
A Home as an Investment
Despite declining housing values, eight-
Most Think a Home Is a Good InvestmentSome people say that buying a home is the best long-term investment in the United States. Do you …
*New York Times/CBSNote: “Don‟t know/Refused” re sponses not shown
39
49
41
35
10
9
7
4
2010
1991*
Strongly agree Somewhat agreeSomewhat disagree Strongly disagree
The More Homeowners Owe, the More Likely They Are ToBe Underwater
11%
19%
27%
More than half
About half
Less than half
Portion of home loan
paid off...
% of each group whoare "underwater"...
Few Homeowners Have BurnedTheir Mortgages% of homeowners who say they havepaid off each share of their homeloans
DK-ref.
33%
Lessthanhalf
Morethanhalf
All
13%
About half
35%
17%
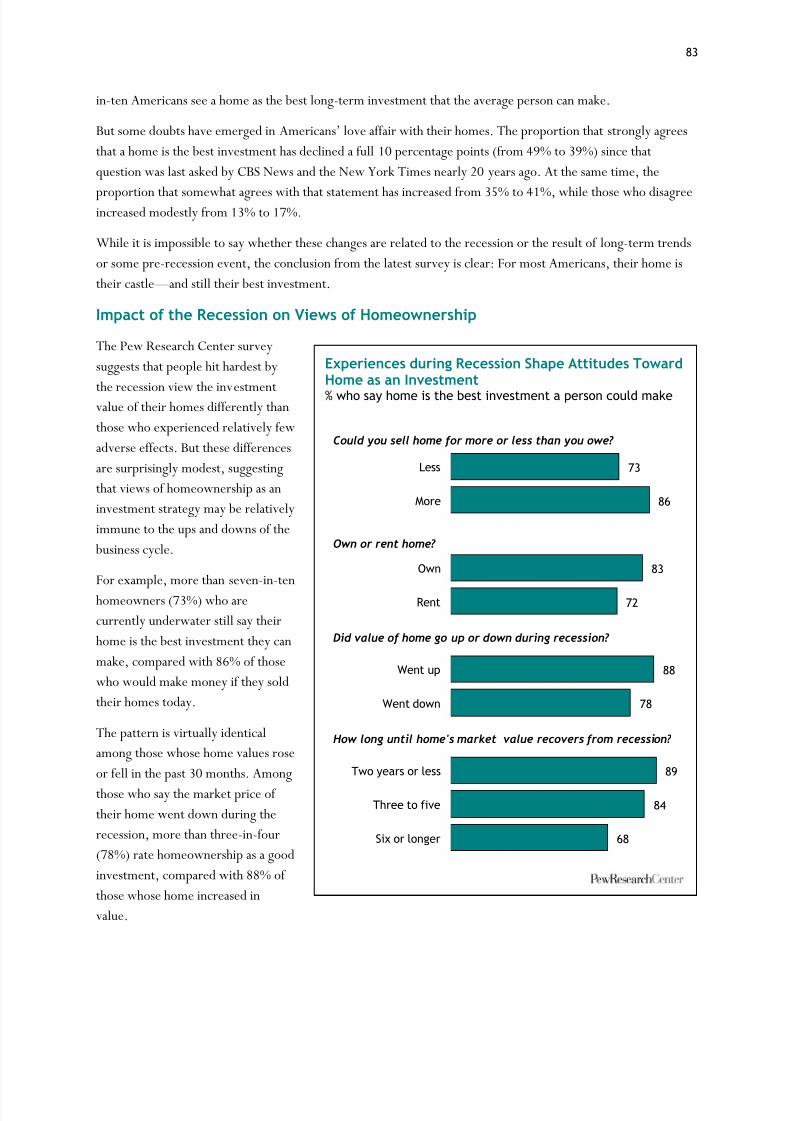
8/8/2019 Pew Research Center Recession
http://slidepdf.com/reader/full/pew-research-center-recession 89/120
83
in-ten Americans see a home as the best long-term investment that the average person can make.
But some doubts have emerged in Americans‘ love affair with their homes. The proportiothat a home is the best investment has declined a full 10 percentage points (from 49% to 39%) since thatquestion was last asked by CBS News and the New York Times nearly 20 years ago. At the same time, the
proportion that somewhat agrees with that statement has increased from 35% to 41%, while those who disagreeincreased modestly from 13% to 17%.
While it is impossible to say whether these changes are related to the recession or the result of long-term trendsor some pre-recession event, the conclusion from the latest survey is clear: For most Americans, their home istheir castle —and still their best investment.
Impact of the Recession on Views of Homeownership
The Pew Research Center surveysuggests that people hit hardest by
the recession view the investmentvalue of their homes differently thanthose who experienced relatively fewadverse effects. But these differencesare surprisingly modest, suggestingthat views of homeownership as aninvestment strategy may be relativelyimmune to the ups and downs of the business cycle.
For example, more than seven-in-tenhomeowners (73%) who arecurrently underwater still say theirhome is the best investment they canmake, compared with 86% of thosewho would make money if they soldtheir homes today.
The pattern is virtually identicalamong those whose home values roseor fell in the past 30 months. Amongthose who say the market price of their home went down during therecession, more than three-in-four(78%) rate homeownership as a goodinvestment, compared with 88% of those whose home increased invalue.
Experiences during Recession Shape Attitudes TowardHome as an Investment% who say home is the best investment a person could make
73
86
83
72
88
78
89
84
68
Less
More
Own
Rent
Went up
Went down
Two years or less
Three to five
Six or longer
Could you sell home for more or less than you owe?
Own or rent home?
Did value of home go up or down during recession?
How long until home's market value recovers from recession?

8/8/2019 Pew Research Center Recession
http://slidepdf.com/reader/full/pew-research-center-recession 90/120
84
Not surprisingly, those who have been hit hardest by the bad real estate market are less likely to viewhomeownership as a good investment. According to the survey, about two-thirds (68%) of those who predict itwill take six years or longer for the value of their home to get back to where it was before the recession also sayhomeownership is the best long-term investment an American can make. In contrast, about nine-in-tenhomeowners (89%) who say it will take two years or less to recover value homeownership as an investmentconsider homeownership the best-long term investment.
Similarly, those who say their home lost ―a lot‖ of market value during the recession are lwho said it lost only a little to rate homeownership as the best investment for the typical American (71% vs.85%).

8/8/2019 Pew Research Center Recession
http://slidepdf.com/reader/full/pew-research-center-recession 91/120
8/8/2019 Pew Research Center Recession
http://slidepdf.com/reader/full/pew-research-center-recession 92/120
86
Sample segments 1-3 were all landline random-digit dialing (RDD) samples drawn using standard list-assistedmethods, where telephone numbers were drawn with equal probabilities from all active blocks in thecontinental U.S. Cell sample segments 5 and 6 were not list-assisted but were drawn through a systematicsampling from dedicated wireless 100-blocks and shared service 100-blocks with no directory-listed landlinenumbers. The landline and cell callback samples (segments 4 and 7) were drawn from recent PSRAI surveys.Callback sample was identified as those who were under age 65 and had completed less than four years of college.
Questionnaire Development and Testing
The questionnaire was developed by the Pew Social Trends & Demographics Project. To improve the quality of the data, the questionnaire was pretested twice with a small number of respondents using RDD telephonenumbers. The monitored pretest interviews were conducted using experienced interviewers who could best judge the quality of the answers given and the degree to which respondents understood the questions. Some finalchanges were made to the questionnaire based on the monitored pretest interviews.
Contact Procedures
Interviews were conducted from May 11 to 31, 2010. As many as seven attempts were made to contact everysampled telephone number. Sample was released for interviewing in replicates, which are representativesubsamples of the larger sample. Using replicates to control the release of sample ensures that complete callprocedures are followed for the entire sample. Calls were staggered over times of day and days of the week tomaximize the chance of making contact with potential respondents. Each phone number received at least onedaytime call.
The introduction and screening procedures differed depending on the sample. For each contacted household in
sample segments 1-3, interviewers asked to speak with either the youngest male or youngest female currently athome based on a random rotation. If no male/female was available at the time of the call, interviewers asked tospeak with the youngest adult of the opposite sex. This systematic respondent selection technique has beenshown to produce samples that closely mirror the population in terms of age and gender when combined withcell sample.
In sample segment 2, interviewers then asked if the person was age 18 to 64. If so, they proceeded with themain interview. If not, the interviewers asked if any other household members were age 18 to 64 and, if therewas, an interview was conducted with that person. If the household had no age-eligible people, that piece of sample was screened out as ineligible.
Sample assigned to segment 3 was administered the employment status screener, which determined whether theperson who answered the phone qualified as either unemployed and able to work (UEA) or employed part timefor economic reasons (PTE). Respondents who qualified for either of these groups completed the interviews.Those who did not qualify were screened out as ineligible.
8/8/2019 Pew Research Center Recession
http://slidepdf.com/reader/full/pew-research-center-recession 93/120
87
For sample segment 4, interviewers started by asking to talk with the person in the household who hadpreviously completed a telephone interview. The person was identified by age and gender. After the targetrespondent was on the phone, they were administered the employment status screener.
Sample segment 5 included interviews with all adults on cell phones. This sample was administered a standard
cell phone screener that simply confirmed that the person was an adult and in a safe place to talk beforecontinuing with the main interview. Sample segment 6 was administered the employment statusscreener afterthe standard cell phone screener. Sample segment 7 included callback interviews with cell respondents. Allqualified cell phone respondents were offered $5 to complete an interview.
Weighting and analysis
Weighting is generally used in survey analysis to adjust for effects of the sample design and to compensate forpatterns of non-response that might bias results. The weighting was accomplished in multiple stages to accountfor the different sample segments as well as the oversampling of certain groups. Weighting also balanced sampledemographic distributions to match known population parameters.
The first stage of weighting corrected for the oversampling in segments 2, 3, 4, 6 and 7. This adjustment wascomputed separately for landline sample segments (2, 3 and 4) and cell sample segments (6 and 7). Thisadjustment is called SAMPWT in the dataset.
We also made two more adjustments before raking the data to population parameters. The Probability of Selection Adjustment (PSA) corrects for the fact that respondents in the landline sample have differentprobabilities of being sampled depending on how many adults live in the household. Since we sample only oneperson per household, adults who live with no other adults have a greater chance of being sampled than adultswho live in multiple-adult households.
The PSA was applied to all respondents in sample segments 1-3 where we were calling a household by landlineand selecting one adult from within the household to complete the interview. To compute the PSA, first definen1 as the number of respondents in the landline sample who live in single-adult households and n2 as the numberof respondents in the landline sample that live in multi-adult households. The PSA equals:
The final adjustment we made prior to raking the data is the Phone Use Adjustment (PUA), which corrects forthe overlapping landline and cellular sample frames. The PUA was applied to all cases in the dataset. Tocompute the PUA, first define p1 as the number of respondents with only one type of phone —landline or cell —and define p2 as the number of respondents with both types of phones. The PUA equals:

8/8/2019 Pew Research Center Recession
http://slidepdf.com/reader/full/pew-research-center-recession 94/120
88
At this point, an interim weight was computed that was the product of the three sample adjustments :SAMPWT, PUA and PSA. This interim weight was used as an input weight for the final stage of weighting —thedemographic raking. The data was raked, by form, to current population parameters for: sex by age; sex byeducation; age by education; race/ethnicity; number of adults in the household; employment status; censusregion; population density; and household telephone usage.
The telephone usage parameter was derived from an analysis of recently available National Health InterviewSurvey data.41 The population density parameter is county-based and was derived from Census 2000 data. Allother weighting parameters were derived from the Census Bureau‘s 2009 Annual Social aSupplement (ASEC).
This stage of weighting, which incorporated each respondent‘sinitial weighting adjustments, was accomplishedusing Sample Balancing, a special iterative sample weighting program that simultaneously balances thedistributions of all variables using a statistical technique called the Deming Algorithm. The raking corrects fordifferential non-response that is related to particular demographic characteristics of the sample. This weightensures that the demographic characteristics of the sample closely approximate the demographic characteristicsof the population. Table 2 compares weighted and unweighted sample demographics to population parameters.
41 Blumberg SJ, Luke JV. Wireless substitution: Early release of estimates from the National Health Interview Survey, July-December, 2008.National Center for Health Statistics. May 2009.

8/8/2019 Pew Research Center Recession
http://slidepdf.com/reader/full/pew-research-center-recession 95/120
89
Table 2: Sample DemographicsParameter Unweighted Weighted
GenderMale 48.5% 44.7% 48.3%
Female 51.5% 55.3% 51.7%
Age18-24 12.6% 12.3% 12.2%25-34 17.8% 13.5% 16.9%35-44 18.2% 14.4% 17.0%45-54 19.6% 21.6% 19.5%55-64 15.1% 21.8% 15.5%
65+ 16.6% 14.0% 16.9%
EducationLess than HS graduate 14.1% 9.7% 12.4%
HS graduate 34.7% 32.0% 33.9%Some college 24.1% 25.5% 24.6%
College graduate 27.1% 31.9% 28.3%
Race/EthnicityWhite/not Hispanic 68.8% 70.7% 68.8%Black/not Hispanic 11.5% 11.0% 11.3%
Hispanic 13.7% 10.2% 12.5%Other/not Hispanic 6.0% 6.7% 6.1%
RegionNortheast 18.5% 17.7% 18.2%
Midwest 22.0% 24.0% 22.6%South 36.8% 38.7% 37.5%West 22.7% 19.7% 21.7%
County Pop. Density1 - Lowest 20.1% 23.3% 20.9%
2 20.0% 21.5% 20.2%3 20.1% 21.3% 20.5%4 20.2% 18.9% 20.0%
5 - Highest 19.6% 15.0% 18.3%
Phone Use
LLO 11.7% 10.3% 11.6%Dual - few, some cell 47.3% 54.4% 47.2%
Dual - most cell 17.4% 18.3% 17.3%CPO 23.6% 15.9% 22.9%
Continued…
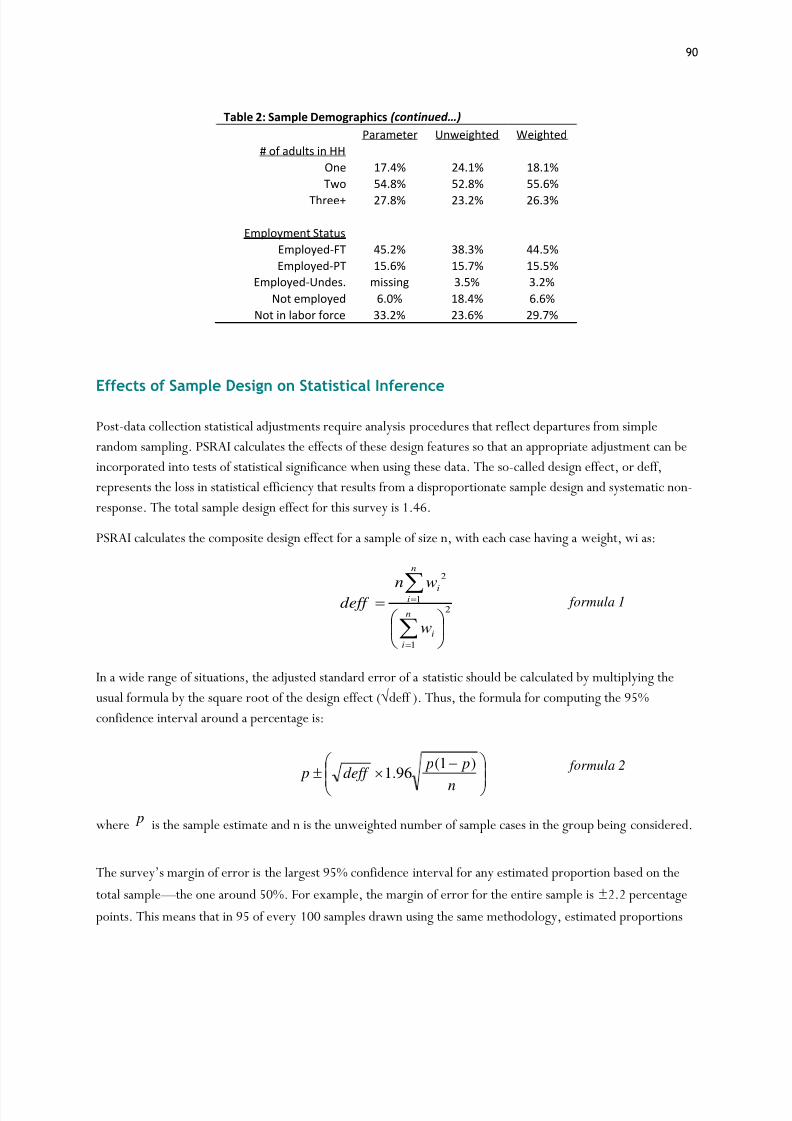
8/8/2019 Pew Research Center Recession
http://slidepdf.com/reader/full/pew-research-center-recession 96/120
90
Table 2: Sample Demographics (continued…) Parameter Unweighted Weighted
# of adults in HHOne 17.4% 24.1% 18.1%Two 54.8% 52.8% 55.6%
Three+ 27.8% 23.2% 26.3%
Employment StatusEmployed-FT 45.2% 38.3% 44.5%Employed-PT 15.6% 15.7% 15.5%
Employed-Undes. missing 3.5% 3.2%Not employed 6.0% 18.4% 6.6%
Not in labor force 33.2% 23.6% 29.7%
Effects of Sample Design on Statistical Inference
Post-data collection statistical adjustments require analysis procedures that reflect departures from simplerandom sampling. PSRAI calculates the effects of these design features so that an appropriate adjustment can beincorporated into tests of statistical significance when using these data. The so-called design effect, or deff,represents the loss in statistical efficiency that results from a disproportionate sample design and systematic non-response. The total sample design effect for this survey is 1.46.
PSRAI calculates the composite design effect for a sample of size n, with each case having a weight, wi as:
In a wide range of situations, the adjusted standard error of a statistic should be calculated by multiplying theusual formula by the square root of the design effect (√deff ). Thus, the formula for compconfidence interval around a percentage is:
where pˆ
is the sample estimate and n is the unweighted number of sample cases in the group being considered.
The survey‘s margin of error is the largest 95% confidenceinterval for any estimated proportion based on thetotal sample —the one around 50%. For example, the margin of error for the entire sample is ±2.2 percentagepoints. This means that in 95 of every 100 samples drawn using the same methodology, estimated proportions
2
1
1
2
n
ii
n
ii
w
wndeff formula 1
n
p pdeff p
)ˆ
1(ˆ
96.1ˆ formula 2

8/8/2019 Pew Research Center Recession
http://slidepdf.com/reader/full/pew-research-center-recession 97/120
91
based on the entire sample will be no more than 2.2 percentage points away from their true values in thepopulation. It is important to remember that sampling fluctuations are only one possible source of error in asurvey estimate. Other sources, such as respondent selection bias, question wording and reporting inaccuracymay contribute additional error of greater or lesser magnitude. Table 3 shows design effects and margins of
error for key subgroups.
Table 3: Design Effects and Margins of Sampling ErrorSample
SizeDesignEffect Margin of Error
Total Sample 2,967 1.46 2.2 percentage points
Form 1 1,484 1.43 3.0 percentage pointsForm 2 1,483 1.49 3.1 percentage points
UEA 753 1.51 4.4 percentage pointsPTE 180 1.25 8.2 percentage pointsCWU1 264 1.24 6.7 percentage points1 Currently Working but Unemployed at some point since the recession started.
Response Rate
Table 4 reports the disposition of all sampled telephone numbers ever dialed from the original telephonenumber samples. The response rate estimates the fraction of all eligible sample that was ultimately interviewed.At PSRAI, it is calculated by taking the product of three component rates:42
o Contact rate —the proportion of working numbers where a request for interview was made43 o Cooperation rate —the proportion of contacted numbers where a consent for interview was at least
initially obtained, versus those refusedo Completion rate —the proportion of initially cooperating and eligible interviews that were completed
The final response rate for all sample segments combined was 16.5 percent.
42 PSRAI‘s disposition codes and reporting are consistent with the American Association for Public Opinion Research standards.43 PSRAI assumes that 75 percent of cases that result in a constant disposition of ―No answer‖ or ―Busy‖ are actg numbers.
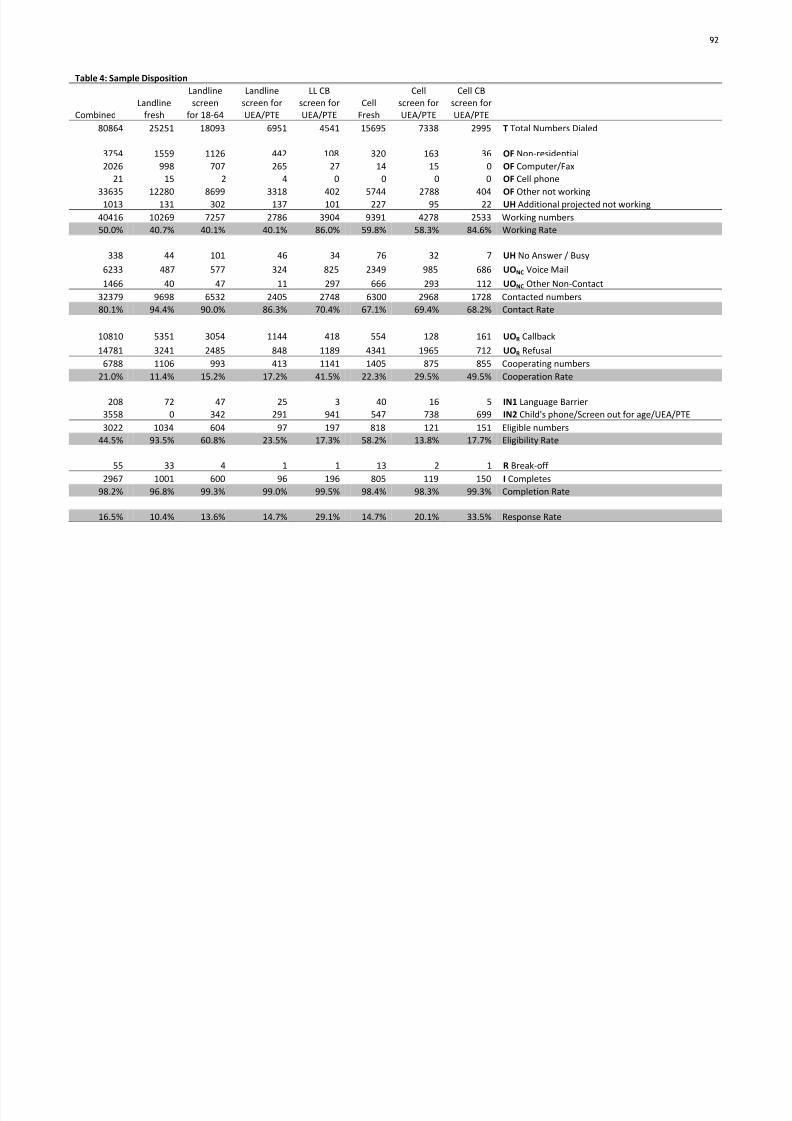
8/8/2019 Pew Research Center Recession
http://slidepdf.com/reader/full/pew-research-center-recession 98/120
92
Table 4: Sample Disposition
CombinedLandline
fresh
Landlinescreen
for 18-64
Landlinescreen forUEA/PTE
LL CBscreen forUEA/PTE
CellFresh
Cellscreen forUEA/PTE
Cell CBscreen forUEA/PTE
80864 25251 18093 6951 4541 15695 7338 2995 T Total Numbers Dialed
3754 1559 1126 442 108 320 163 36 OF Non-residential 2026 998 707 265 27 14 15 0 OF Computer/Fax
21 15 2 4 0 0 0 0 OF Cell phone
33635 12280 8699 3318 402 5744 2788 404 OF Other not working 1013 131 302 137 101 227 95 22 UH Additional projected not working 40416 10269 7257 2786 3904 9391 4278 2533 Working numbers50.0% 40.7% 40.1% 40.1% 86.0% 59.8% 58.3% 84.6% Working Rate
338 44 101 46 34 76 32 7 UH No Answer / Busy
6233 487 577 324 825 2349 985 686 UONC Voice Mail
1466 40 47 11 297 666 293 112 UONC Other Non-Contact 32379 9698 6532 2405 2748 6300 2968 1728 Contacted numbers80.1% 94.4% 90.0% 86.3% 70.4% 67.1% 69.4% 68.2% Contact Rate
10810 5351 3054 1144 418 554 128 161 UOR Callback
14781 3241 2485 848 1189 4341 1965 712 UOR Refusal 6788 1106 993 413 1141 1405 875 855 Cooperating numbers
21.0% 11.4% 15.2% 17.2% 41.5% 22.3% 29.5% 49.5% Cooperation Rate
208 72 47 25 3 40 16 5 IN1 Language Barrier 3558 0 342 291 941 547 738 699 IN2 Child's phone/Screen out for age/UEA/PTE 3022 1034 604 97 197 818 121 151 Eligible numbers
44.5% 93.5% 60.8% 23.5% 17.3% 58.2% 13.8% 17.7% Eligibility Rate
55 33 4 1 1 13 2 1 R Break-off 2967 1001 600 96 196 805 119 150 I Completes
98.2% 96.8% 99.3% 99.0% 99.5% 98.4% 98.3% 99.3% Completion Rate
16.5% 10.4% 13.6% 14.7% 29.1% 14.7% 20.1% 33.5% Response Rate
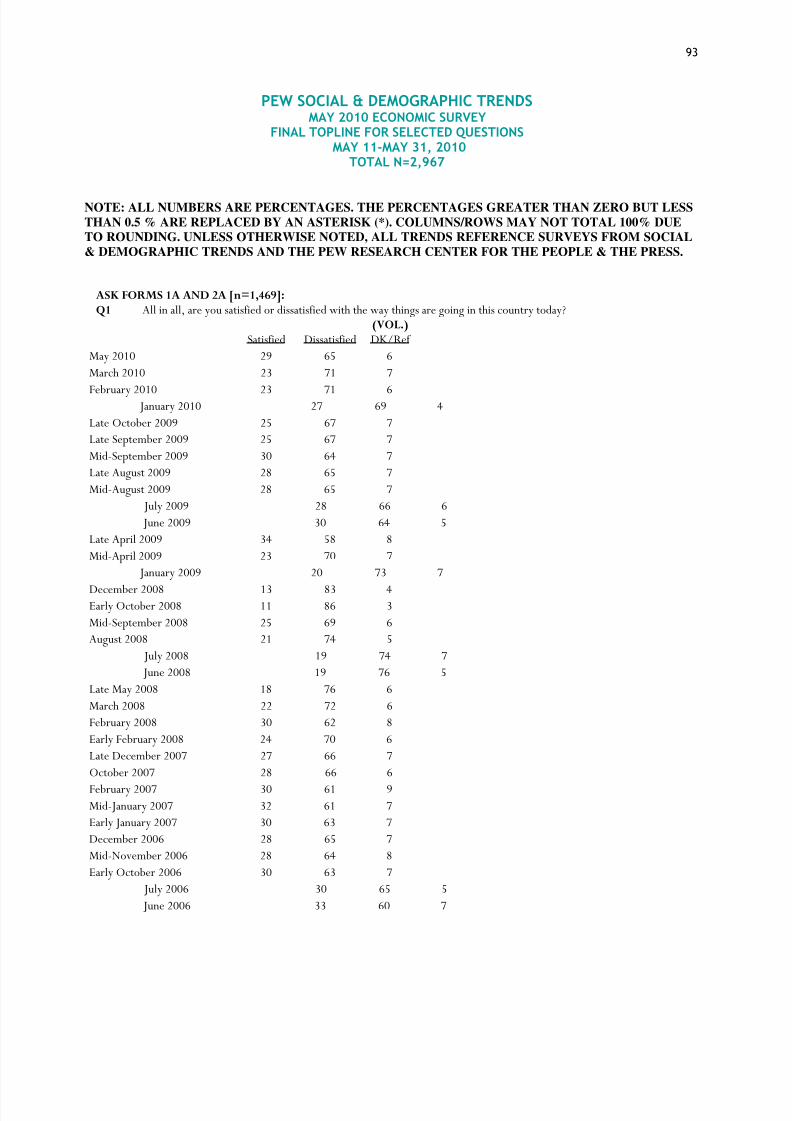
8/8/2019 Pew Research Center Recession
http://slidepdf.com/reader/full/pew-research-center-recession 99/120
93
NOTE: ALL NUMBERS ARE PERCENTAGES. THE PERCENTAGES GREATER THAN ZERO BUT LESSTHAN 0.5 % ARE REPLACED BY AN ASTERISK (*). COLUMNS/ROWS MAY NOT TOTAL 100% DUETO ROUNDING. UNLESS OTHERWISE NOTED, ALL TRENDS REFERENCE SURVEYS FROM SOCIAL& DEMOGRAPHIC TRENDS AND THE PEW RESEARCH CENTER FOR THE PEOPLE & THE PRESS.
ASK FORMS 1A AND 2A [n=1,469]:Q1 All in all, are you satisfied or dissatisfied with the way things are going in this country today?
Satisfied Dissatisfied(VOL.)DK/Ref
May 2010 29 65 6March 2010 23 71 7
February 2010 23 71 6 January 2010 27 69 4Late October 2009 25 67 7Late September 2009 25 67 7Mid-September 2009 30 64 7Late August 2009 28 65 7Mid-August 2009 28 65 7 July 2009 28 66 6 June 2009 30 64 5Late April 2009 34 58 8Mid-April 2009 23 70 7 January 2009 20 73 7
December 2008 13 83 4Early October 2008 11 86 3Mid-September 2008 25 69 6August 2008 21 74 5 July 2008 19 74 7 June 2008 19 76 5Late May 2008 18 76 6March 2008 22 72 6February 2008 30 62 8Early February 2008 24 70 6Late December 2007 27 66 7October 2007 28 66 6February 2007 30 61 9Mid-January 2007 32 61 7Early January 2007 30 63 7December 2006 28 65 7Mid-November 2006 28 64 8Early October 2006 30 63 7 July 2006 30 65 5 June 2006 33 60 7
PEW SOCIAL & DEMOGRAPHIC TRENDSMAY 2010 ECONOMIC SURVEY
FINAL TOPLINE FOR SELECTED QUESTIONSMAY 11-MAY 31, 2010
TOTAL N=2,967
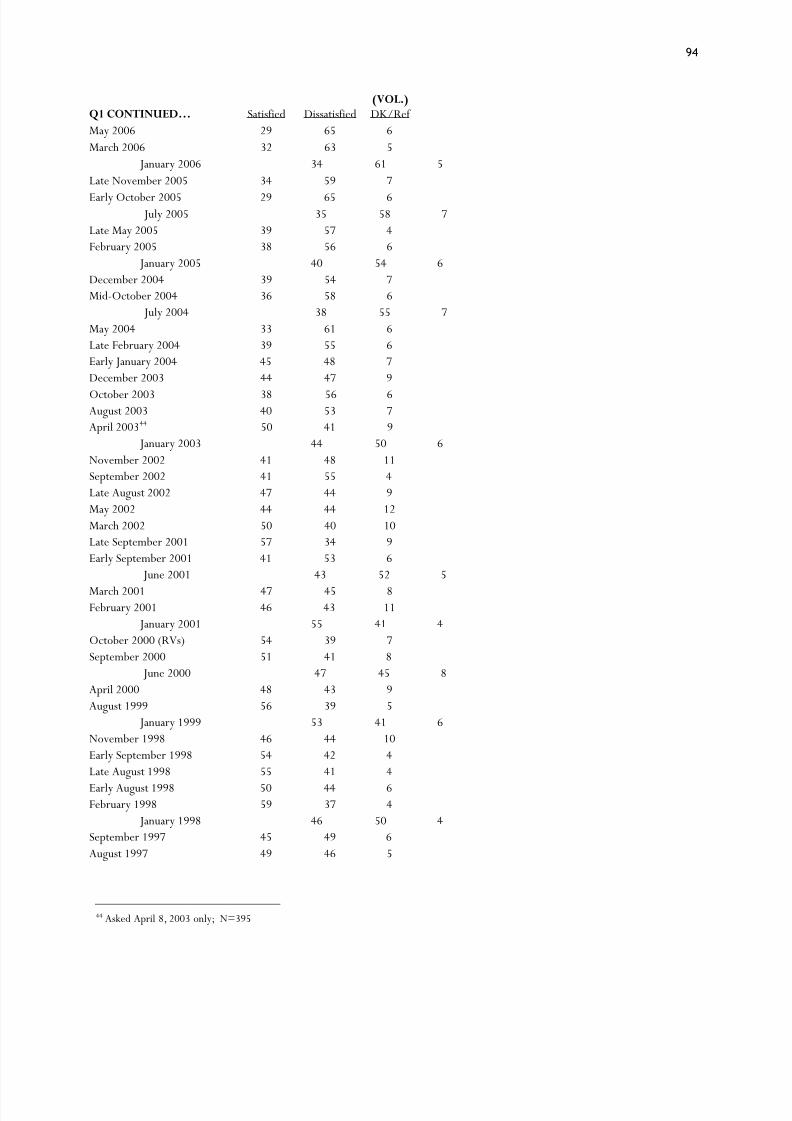
8/8/2019 Pew Research Center Recession
http://slidepdf.com/reader/full/pew-research-center-recession 100/120
94
Q1 CONTINUED… Satisfied Dissatisfied(VOL.)DK/Ref
May 2006 29 65 6March 2006 32 63 5 January 2006 34 61 5Late November 2005 34 59 7
Early October 2005 29 65 6 July 2005 35 58 7Late May 2005 39 57 4February 2005 38 56 6 January 2005 40 54 6December 2004 39 54 7Mid-October 2004 36 58 6 July 2004 38 55 7May 2004 33 61 6Late February 2004 39 55 6Early January 2004 45 48 7December 2003 44 47 9October 2003 38 56 6August 2003 40 53 7April 200344 50 41 9 January 2003 44 50 6November 2002 41 48 11September 2002 41 55 4Late August 2002 47 44 9May 2002 44 44 12March 2002 50 40 10Late September 2001 57 34 9Early September 2001 41 53 6 June 2001 43 52 5March 2001 47 45 8February 2001 46 43 11 January 2001 55 41 4October 2000 (RVs) 54 39 7September 2000 51 41 8 June 2000 47 45 8April 2000 48 43 9August 1999 56 39 5 January 1999 53 41 6November 1998 46 44 10Early September 1998 54 42 4Late August 1998 55 41 4Early August 1998 50 44 6February 1998 59 37 4 January 1998 46 50 4September 1997 45 49 6August 1997 49 46 5
44 Asked April 8, 2003 only; N=395
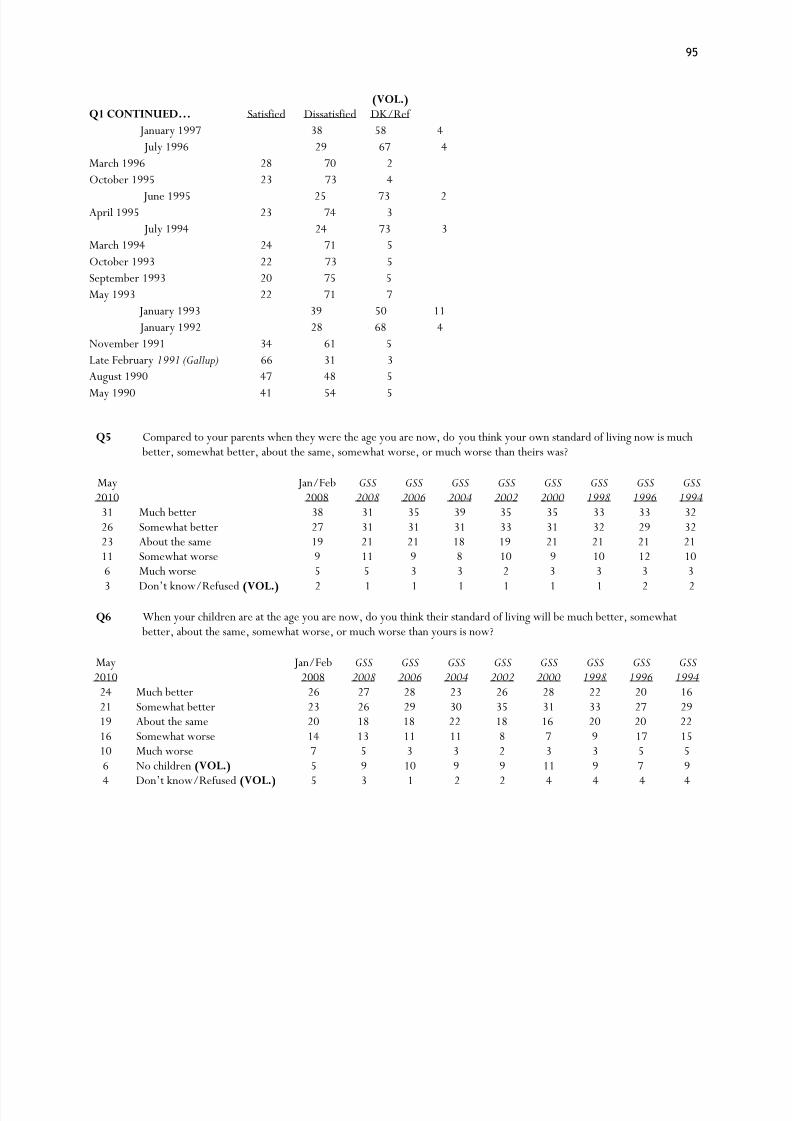
8/8/2019 Pew Research Center Recession
http://slidepdf.com/reader/full/pew-research-center-recession 101/120
95
Q1 CONTINUED… Satisfied Dissatisfied(VOL.)DK/Ref
January 1997 38 58 4 July 1996 29 67 4March 1996 28 70 2October 1995 23 73 4
June 1995 25 73 2April 1995 23 74 3 July 1994 24 73 3March 1994 24 71 5October 1993 22 73 5September 1993 20 75 5May 1993 22 71 7 January 1993 39 50 11 January 1992 28 68 4November 1991 34 61 5Late February1991 (Gallup) 66 31 3August 1990 47 48 5
May 1990 41 54 5
Q5 Compared to your parents when they were the age you are now, do you think your own standard of living now is much better, somewhat better, about the same, somewhat worse, or much worse than theirs was?
May Jan/Feb GSS GSS GSS GSS GSS GSS GSS GSS2010 2008 2008 2006 2004 2002 2000 1998 1996 199431 Much better 38 31 35 39 35 35 33 33 3226 Somewhat better 27 31 31 31 33 31 32 29 3223 About the same 19 21 21 18 19 21 21 21 2111 Somewhat worse 9 11 9 8 10 9 10 12 106 Much worse 5 5 3 3 2 3 3 3 3
3 Don‘t know/Refused (VOL.) 2 1 1 1 1 1 1 2 2
Q6 When your children are at the age you are now, do you think their standard of living will be much better, somewhat better, about the same, somewhat worse, or much worse than yours is now?
May Jan/Feb GSS GSS GSS GSS GSS GSS GSS GSS2010 2008 2008 2006 2004 2002 2000 1998 1996 199424 Much better 26 27 28 23 26 28 22 20 1621 Somewhat better 23 26 29 30 35 31 33 27 2919 About the same 20 18 18 22 18 16 20 20 2216 Somewhat worse 14 13 11 11 8 7 9 17 1510 Much worse 7 5 3 3 2 3 3 5 56 No children(VOL.) 5 9 10 9 9 11 9 7 9
4 Don‘t know/Refused (VOL.) 5 3 1 2 2 4 4 4 4

8/8/2019 Pew Research Center Recession
http://slidepdf.com/reader/full/pew-research-center-recession 102/120
96
Q7 If you were asked to use one of these commonly used names for the social classes, which would you say you belong in?The upper class, upper-middle class, middle class, lower-middle class, or lower class?
May2010
Jan/Feb2008
2 Upper class 218 Upper-middle class 1950 Middle class 5321 Lower-middle class 198 Lower class 61 Don‘t know/Refused (VOL.)
1
ASK IF GAVE ANSWER IN Q7 (Q7= 1-5) [n=2,929]:Q8 Do you feel you're falling out of the[INSERT Q7 RESPONSE], moving up from the[INSERT Q7 RESPONSE] or
are you pretty firmly in the[INSERT Q7 RESPONSE]?
12 Falling out of current class16 Moving up from current class70 Pretty firmly in current
class/Not moving(VOL.) 2 Don‘t know/Refused (VOL.)
ASK ALL:Q9 Do you agree or disagree: Although there may be bad times every now and then, America will always continue to be
prosperous and make economic progress? -----------Cambridge Reports/Research International-----------
May2010
Jan1995
Jan1994
Jan1993
April1992
Jan1992
Oct1987
63 Agree 67 65 65 58 62 7131 Disagree 27 29 30 36 32 116 Don‘t know/Refused (VOL.)
6 6 5 6 7 18
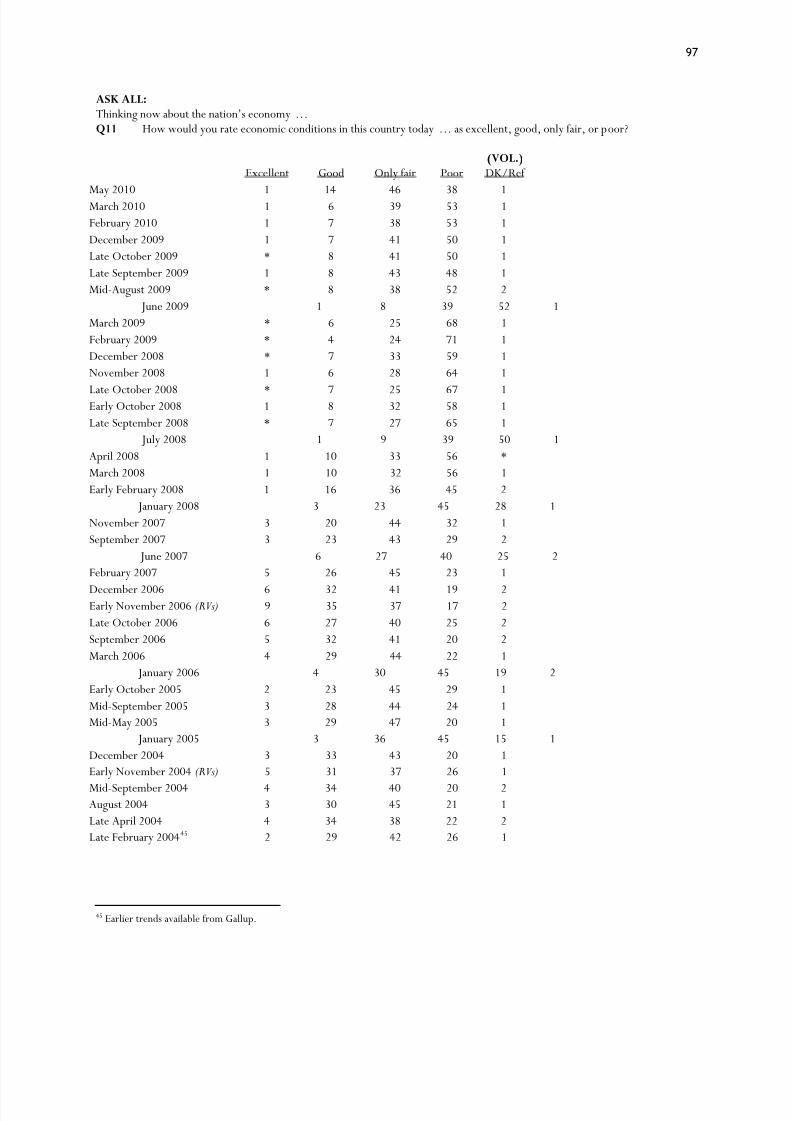
8/8/2019 Pew Research Center Recession
http://slidepdf.com/reader/full/pew-research-center-recession 103/120
97
ASK ALL:Thinking now about the nation‘s economy … Q11 How would you rate economic conditions in this country today… as excellent, good, only fair, or poor?
Excellent Good Only fair Poor(VOL.)DK/Ref
May 2010 1 14 46 38 1March 2010 1 6 39 53 1February 2010 1 7 38 53 1December 2009 1 7 41 50 1Late October 2009 * 8 41 50 1Late September 2009 1 8 43 48 1Mid-August 2009 * 8 38 52 2 June 2009 1 8 39 52 1March 2009 * 6 25 68 1February 2009 * 4 24 71 1December 2008 * 7 33 59 1November 2008 1 6 28 64 1
Late October 2008 * 7 25 67 1Early October 2008 1 8 32 58 1Late September 2008 * 7 27 65 1 July 2008 1 9 39 50 1April 2008 1 10 33 56 *March 2008 1 10 32 56 1Early February 2008 1 16 36 45 2 January 2008 3 23 45 28 1November 2007 3 20 44 32 1September 2007 3 23 43 29 2 June 2007 6 27 40 25 2February 2007 5 26 45 23 1
December 2006 6 32 41 19 2Early November 2006(RVs) 9 35 37 17 2Late October 2006 6 27 40 25 2September 2006 5 32 41 20 2March 2006 4 29 44 22 1 January 2006 4 30 45 19 2Early October 2005 2 23 45 29 1Mid-September 2005 3 28 44 24 1Mid-May 2005 3 29 47 20 1 January 2005 3 36 45 15 1December 2004 3 33 43 20 1Early November 2004(RVs) 5 31 37 26 1Mid-September 2004 4 34 40 20 2August 2004 3 30 45 21 1Late April 2004 4 34 38 22 2Late February 200445 2 29 42 26 1
45 Earlier trends available from Gallup.
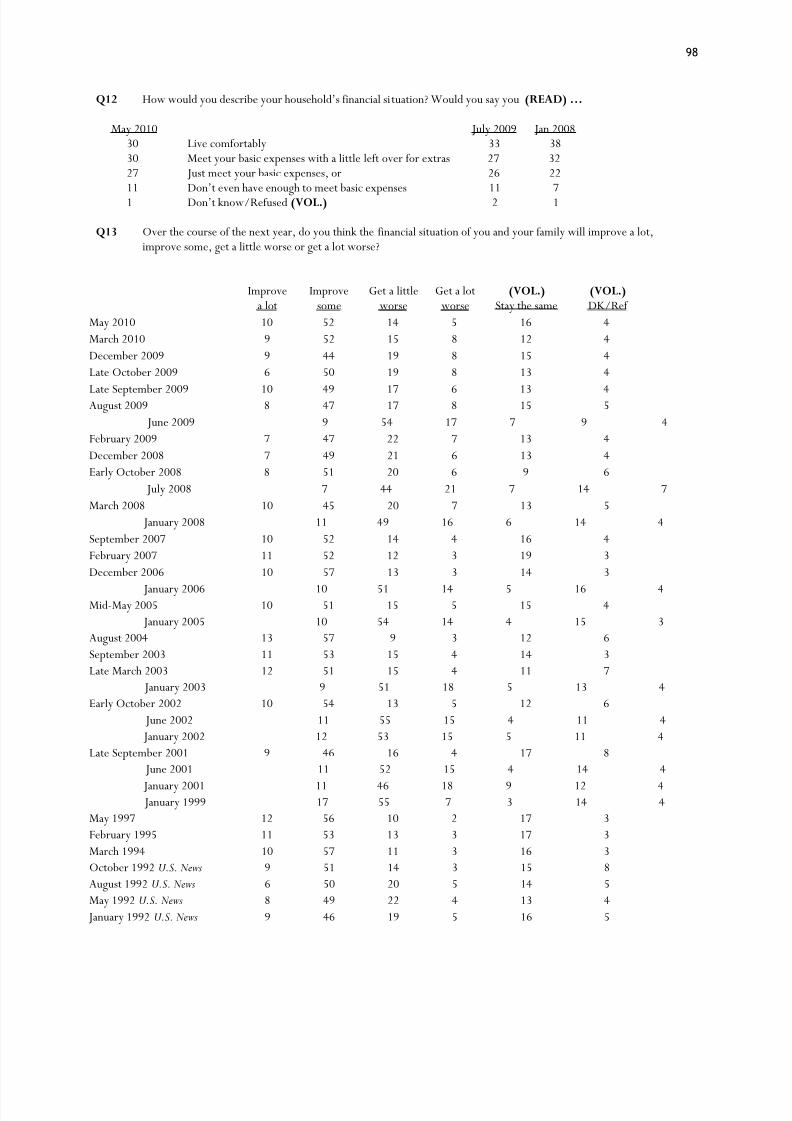
8/8/2019 Pew Research Center Recession
http://slidepdf.com/reader/full/pew-research-center-recession 104/120
98
Q12 How would you describe your household‘s financial situation? Would you say you(READ) …
May 2010 July 2009 Jan 200830 Live comfortably 33 3830 Meet your basic expenses with a little left over for extras 27 3227 Just meet your basic expenses, or 26 2211 Don‘t even have enough to meet basic expenses 11 71 Don‘t know/Refused(VOL.) 2 1
Q13 Over the course of the next year, do you think the financial situation of you and your family will improve a lot,improve some, get a little worse or get a lot worse?
Improvea lot
Improvesome
Get a littleworse
Get a lotworse
(VOL.)Stay the same
(VOL.)DK/Ref
May 2010 10 52 14 5 16 4March 2010 9 52 15 8 12 4December 2009 9 44 19 8 15 4Late October 2009 6 50 19 8 13 4
Late September 2009 10 49 17 6 13 4August 2009 8 47 17 8 15 5 June 2009 9 54 17 7 9 4February 2009 7 47 22 7 13 4December 2008 7 49 21 6 13 4Early October 2008 8 51 20 6 9 6 July 2008 7 44 21 7 14 7March 2008 10 45 20 7 13 5 January 2008 11 49 16 6 14 4September 2007 10 52 14 4 16 4February 2007 11 52 12 3 19 3December 2006 10 57 13 3 14 3
January 2006 10 51 14 5 16 4Mid-May 2005 10 51 15 5 15 4 January 2005 10 54 14 4 15 3August 2004 13 57 9 3 12 6September 2003 11 53 15 4 14 3Late March 2003 12 51 15 4 11 7 January 2003 9 51 18 5 13 4Early October 2002 10 54 13 5 12 6 June 2002 11 55 15 4 11 4 January 2002 12 53 15 5 11 4Late September 2001 9 46 16 4 17 8 June 2001 11 52 15 4 14 4
January 2001 11 46 18 9 12 4 January 1999 17 55 7 3 14 4May 1997 12 56 10 2 17 3February 1995 11 53 13 3 17 3March 1994 10 57 11 3 16 3October 1992U.S. News 9 51 14 3 15 8August 1992U.S. News 6 50 20 5 14 5May 1992U.S. News 8 49 22 4 13 4 January 1992U.S. News 9 46 19 5 16 5
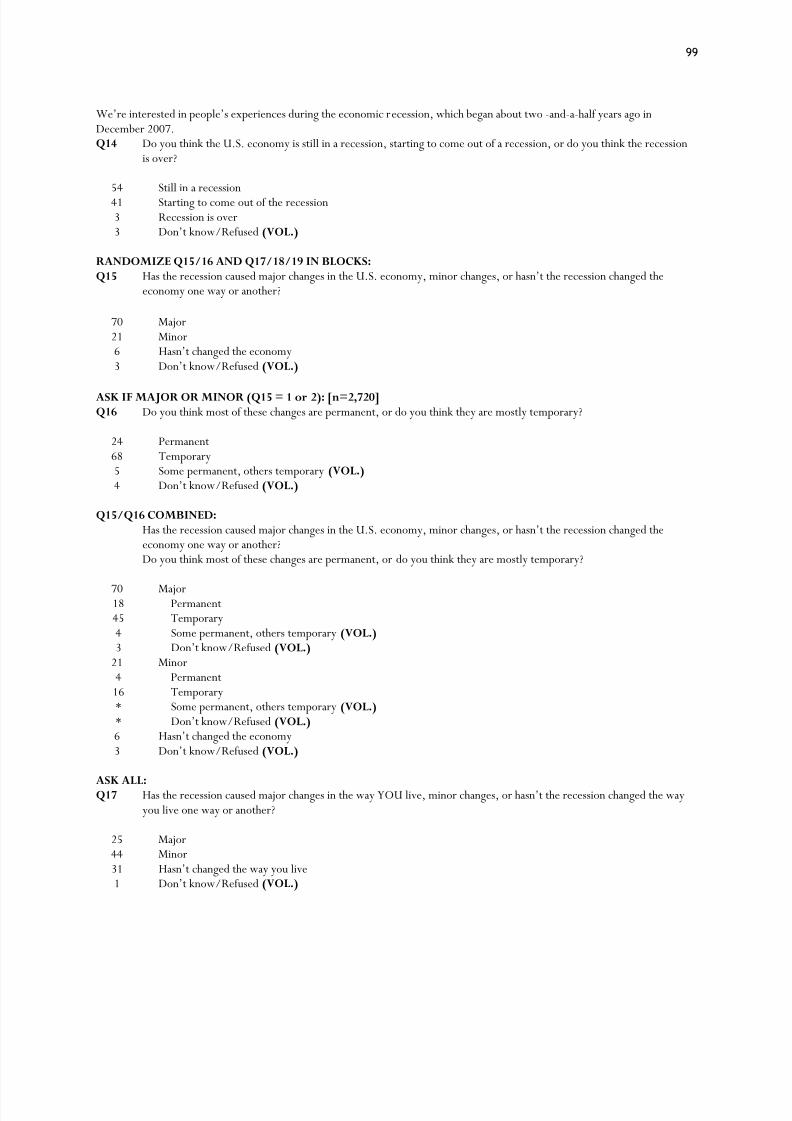
8/8/2019 Pew Research Center Recession
http://slidepdf.com/reader/full/pew-research-center-recession 105/120
99
We‘re interested in people‘s experiences during the economic recession, which began about two-and-a-half years ago inDecember 2007.Q14 Do you think the U.S. economy is still in a recession, starting to come out of a recession, or do you think the recession
is over?
54 Still in a recession41 Starting to come out of the recession3 Recession is over3 Don‘t know/Refused (VOL.)
RANDOMIZE Q15/16 AND Q17/18/19 IN BLOCKS:Q15 Has the recession caused major changes in the U.S. economy, minor changes, or hasn‘t the reces
economy one way or another?
70 Major21 Minor6 Hasn‘t changed the economy 3 Don‘t know/Refused (VOL.)
ASK IF MAJOR OR MINOR (Q15 = 1 or 2): [n=2,720]Q16 Do you think most of these changes are permanent, or do you think they are mostly temporary?
24 Permanent68 Temporary5 Some permanent, others temporary(VOL.)4 Don‘t know/Refused (VOL.)
Q15/Q16 COMBINED:Has the recession caused major changes in the U.S. economy, minor changes, or hasn‘t the receseconomy one way or another?Do you think most of these changes are permanent, or do you think they are mostly temporary?
70 Major18 Permanent45 Temporary4 Some permanent, others temporary(VOL.) 3 Don‘t know/Refused(VOL.)
21 Minor4 Permanent16 Temporary* Some permanent, others temporary(VOL.) * Don‘t know/Refused(VOL.) 6 Hasn‘t changed the economy 3 Don‘t know/Refused (VOL.)
ASK ALL:Q17 Has the recession caused major changes in the way YOU live, minor changes, or hasn‘t the receyou live one way or another?
25 Major44 Minor31 Hasn‘tchanged the way you live1 Don‘t know/Refused (VOL.)
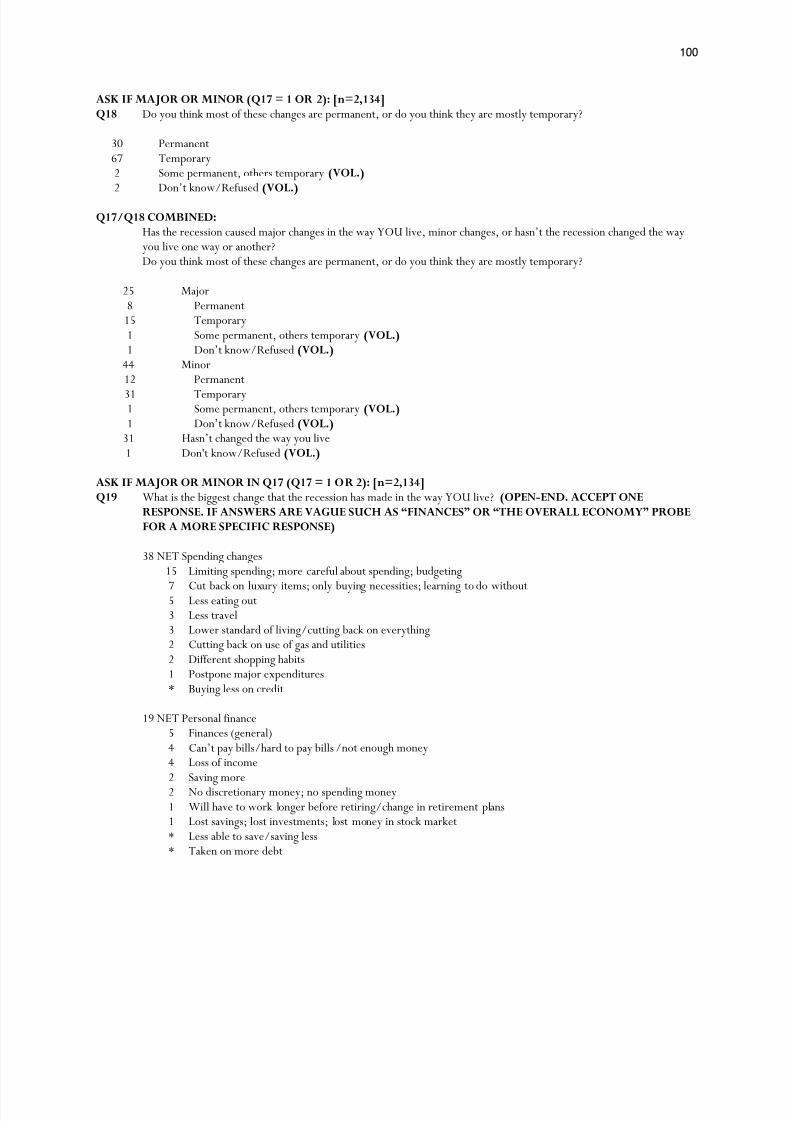
8/8/2019 Pew Research Center Recession
http://slidepdf.com/reader/full/pew-research-center-recession 106/120
100
ASK IF MAJOR OR MINOR (Q17 = 1 OR 2): [n=2,134]Q18 Do you think most of these changes are permanent, or do you think they are mostly temporary?
30 Permanent67 Temporary2 Some permanent, others temporary(VOL.)2 Don‘t know/Refused (VOL.)
Q17/Q18 COMBINED:Has the recession caused major changes in the way YOU live, minor changes, or hasn‘t the receyou live one way or another?Do you think most of these changes are permanent, or do you think they are mostly temporary?
25 Major8 Permanent15 Temporary1 Some permanent, others temporary(VOL.) 1 Don‘t know/Refused(VOL.)
44 Minor12 Permanent31 Temporary1 Some permanent, others temporary(VOL.) 1 Don‘t know/Refused(VOL.)
31 Hasn‘t changed the way you live 1 Don't know/Refused(VOL.)
ASK IF MAJOR OR MINOR IN Q17 (Q17 = 1 OR 2): [n=2,134]Q19 What is the biggest change that the recession has made in the way YOU live?(OPEN-END. ACCEPT ONE
RESPONSE. IF ANSWERS ARE VAGUE SUCH AS “FINANCES” OR “THE OVERALL ECONOMY” PROBEFOR A MORE SPECIFIC RESPONSE)
38 NET Spending changes15 Limiting spending; more careful about spending; budgeting
7 Cut back on luxury items; only buying necessities; learning to do without5 Less eating out3 Less travel3 Lower standard of living/cutting back on everything2 Cutting back on use of gas and utilities2 Different shopping habits1 Postpone major expenditures* Buying less on credit
19 NET Personal finance5 Finances (general)4 Can‘t pay bills/hard to pay bills/not enough money4 Loss of income2 Saving more2 No discretionary money; no spending money1 Will have to work longer before retiring/change in retirement plans1 Lost savings; lost investments; lost money in stock market* Less able to save/saving less* Taken on more debt
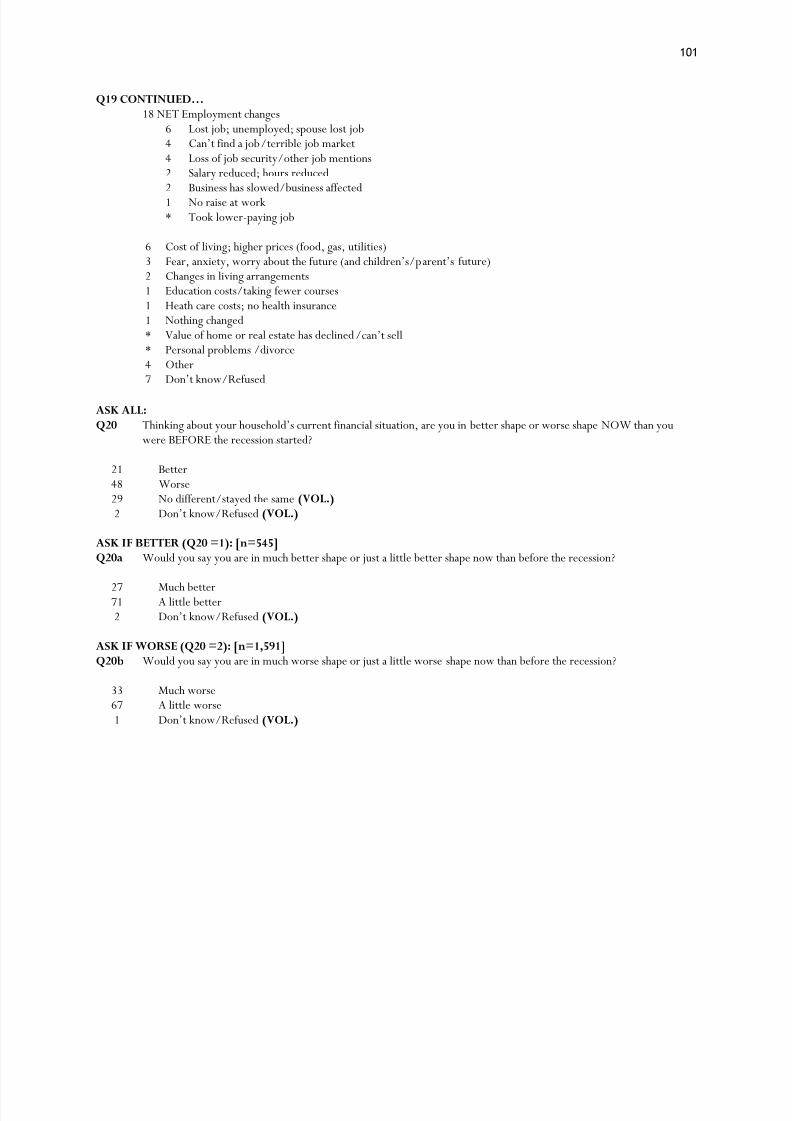
8/8/2019 Pew Research Center Recession
http://slidepdf.com/reader/full/pew-research-center-recession 107/120
101
Q19 CONTINUED… 18 NET Employment changes
6 Lost job; unemployed; spouse lost job4 Can‘t find a job/terrible job market4 Loss of job security/other job mentions2 Salary reduced; hours reduced2 Business has slowed/business affected1 No raise at work* Took lower-paying job
6 Cost of living; higher prices (food, gas, utilities)3 Fear, anxiety, worry about the future (and children‘s/parent‘sfuture)2 Changes in living arrangements1 Education costs/taking fewer courses1 Heath care costs; no health insurance1 Nothing changed* Value of home or real estate has declined/can‘t sell * Personal problems /divorce4 Other7 Don‘t know/Refused
ASK ALL:Q20 Thinking about your household‘s current financial situation, are you in better shape or worse sha
were BEFORE the recession started?
21 Better48 Worse29 No different/stayed the same(VOL.)2 Don‘t know/Refused (VOL.)
ASK IF BETTER (Q20 =1): [n=545]Q20a Would you say you are in much better shape or just a little better shape now than before the recession?
27 Much better71 A little better2 Don‘t know/Refused (VOL.)
ASK IF WORSE (Q20 =2): [n=1,591]Q20b Would you say you are in much worse shape or just a little worse shape now than before the recession?
33 Much worse67 A little worse1 Don‘t know/Refused (VOL.)
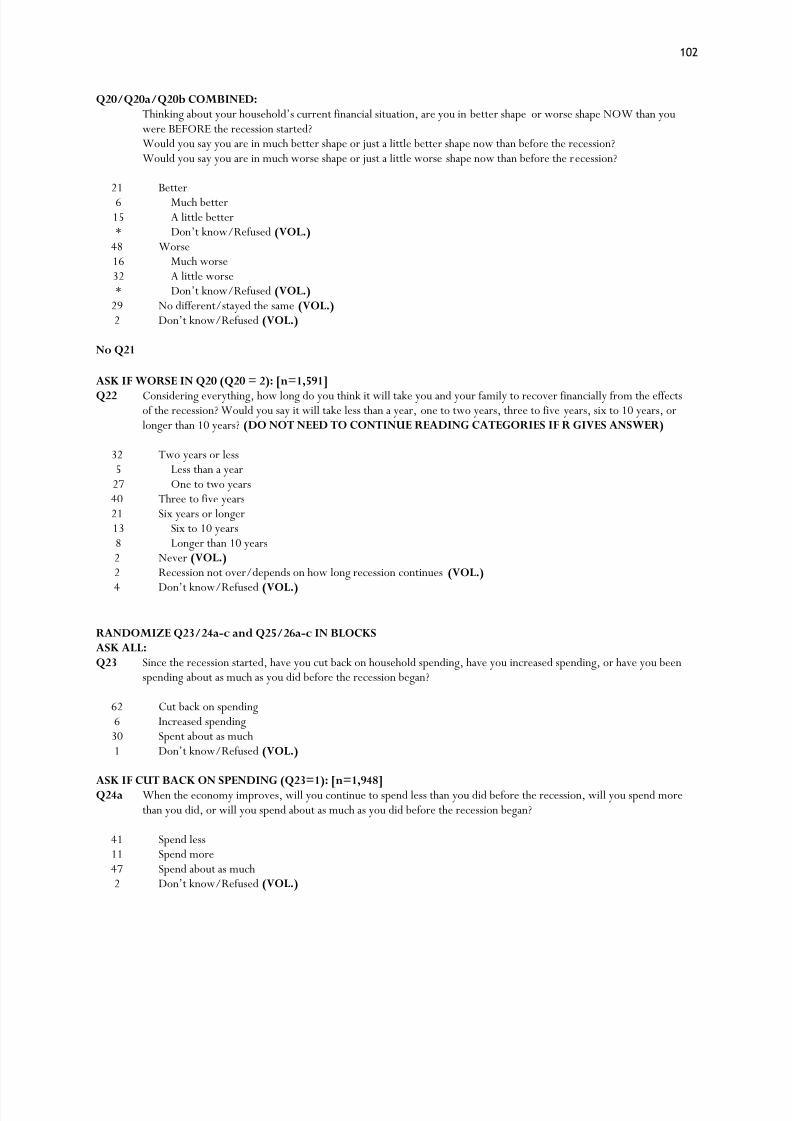
8/8/2019 Pew Research Center Recession
http://slidepdf.com/reader/full/pew-research-center-recession 108/120
102
Q20/Q20a/Q20b COMBINED:Thinking about your household‘s current financial situation, are you in better shapeor worse shape NOW than youwere BEFORE the recession started?Would you say you are in much better shape or just a little better shape now than before the recession?Would you say you are in much worse shape or just a little worse shape now than before the recession?
21 Better6 Much better15 A little better* Don‘t know/Refused (VOL.)
48 Worse16 Much worse32 A little worse* Don‘t know/Refused (VOL.)
29 No different/stayed the same(VOL.)2 Don‘t know/Refused (VOL.)
No Q21
ASK IF WORSE IN Q20 (Q20 = 2): [n=1,591]Q22 Considering everything, how long do you think it will take you and your family to recover financially from the effects
of the recession? Would you say it will take less than a year, one to two years, three to five years, six to 10 years, orlonger than 10 years?(DO NOT NEED TO CONTINUE READING CATEGORIES IF R GIVES ANSWER)
32 Two years or less5 Less than a year27 One to two years40 Three to five years21 Six years or longer13 Six to 10 years8 Longer than 10 years2 Never(VOL.) 2 Recession not over/depends on how long recession continues(VOL.)
4 Don‘t know/Refused (VOL.)
RANDOMIZE Q23/24a-c and Q25/26a-c IN BLOCKSASK ALL:Q23 Since the recession started, have you cut back on household spending, have you increased spending, or have you been
spending about as much as you did before the recession began?
62 Cut back on spending6 Increased spending30 Spent about as much1 Don‘t know/Refused (VOL.)
ASK IF CUT BACK ON SPENDING (Q23=1): [n=1,948]Q24a When the economy improves, will you continue to spend less than you did before the recession, will you spend morethan you did, or will you spend about as much as you did before the recession began?
41 Spend less11 Spend more47 Spend about as much2 Don‘t know/Refused (VOL.)
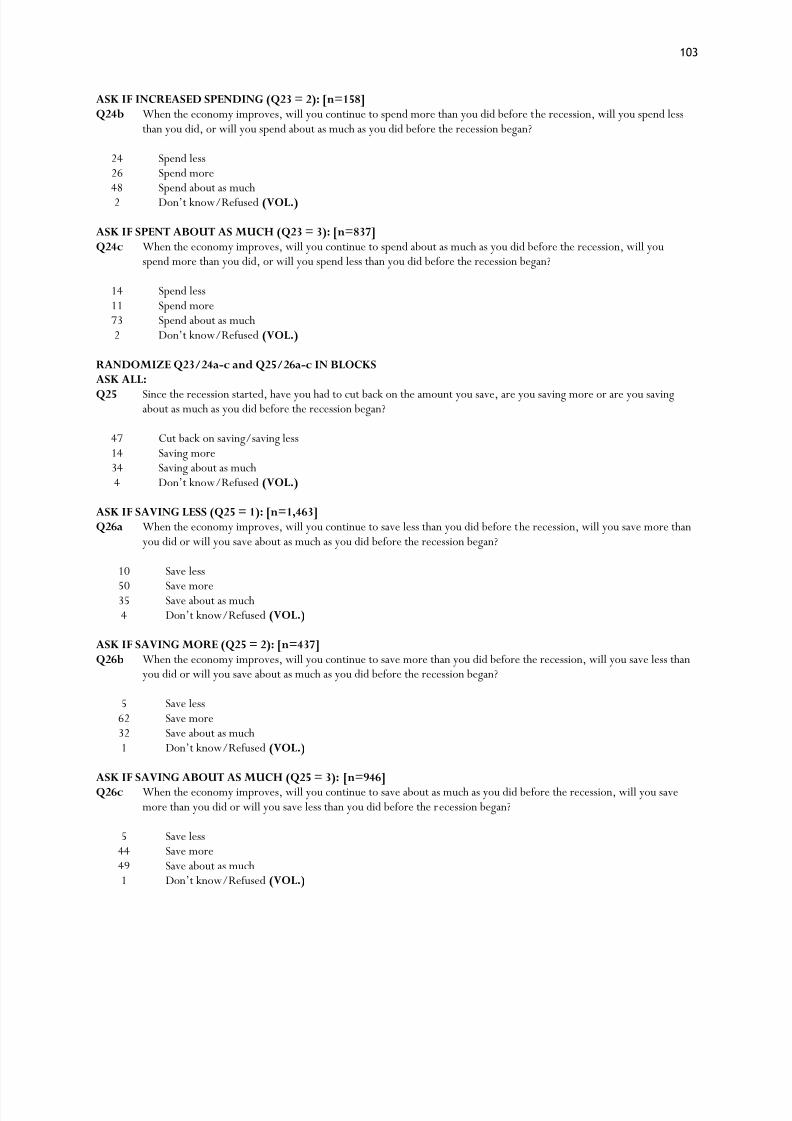
8/8/2019 Pew Research Center Recession
http://slidepdf.com/reader/full/pew-research-center-recession 109/120
103
ASK IF INCREASED SPENDING (Q23 = 2): [n=158]Q24b When the economy improves, will you continue to spend more than you did before the recession, will you spend less
than you did, or will you spend about as much as you did before the recession began?
24 Spend less26 Spend more48 Spend about as much2 Don‘t know/Refused (VOL.)
ASK IF SPENT ABOUT AS MUCH (Q23 = 3): [n=837]Q24c When the economy improves, will you continue to spend about as much as you did before the recession, will you
spend more than you did, or will you spend less than you did before the recession began?
14 Spend less11 Spend more73 Spend about as much2 Don‘t know/Refused (VOL.)
RANDOMIZE Q23/24a-c and Q25/26a-c IN BLOCKSASK ALL:Q25 Since the recession started, have you had to cut back on the amount you save, are you saving more or are you saving
about as much as you did before the recession began?
47 Cut back on saving/saving less14 Saving more34 Saving about as much4 Don‘t know/Refused (VOL.)
ASK IF SAVING LESS (Q25 = 1): [n=1,463]Q26a When the economy improves, will you continue to save less than you did before the recession, will you save more than
you did or will you save about as much as you did before the recession began?
10 Save less
50 Save more35 Save about as much4 Don‘t know/Refused (VOL.)
ASK IF SAVING MORE (Q25 = 2): [n=437]Q26b When the economy improves, will you continue to save more than you did before the recession, will you save less than
you did or will you save about as much as you did before the recession began?
5 Save less62 Save more32 Save about as much1 Don‘t know/Refused (VOL.)
ASK IF SAVING ABOUT AS MUCH (Q25 = 3): [n=946]Q26c When the economy improves, will you continue to save about as much as you did before the recession, will you save
more than you did or will you save less than you did before the recession began?
5 Save less44 Save more49 Save about as much1 Don‘t know/Refused (VOL.)
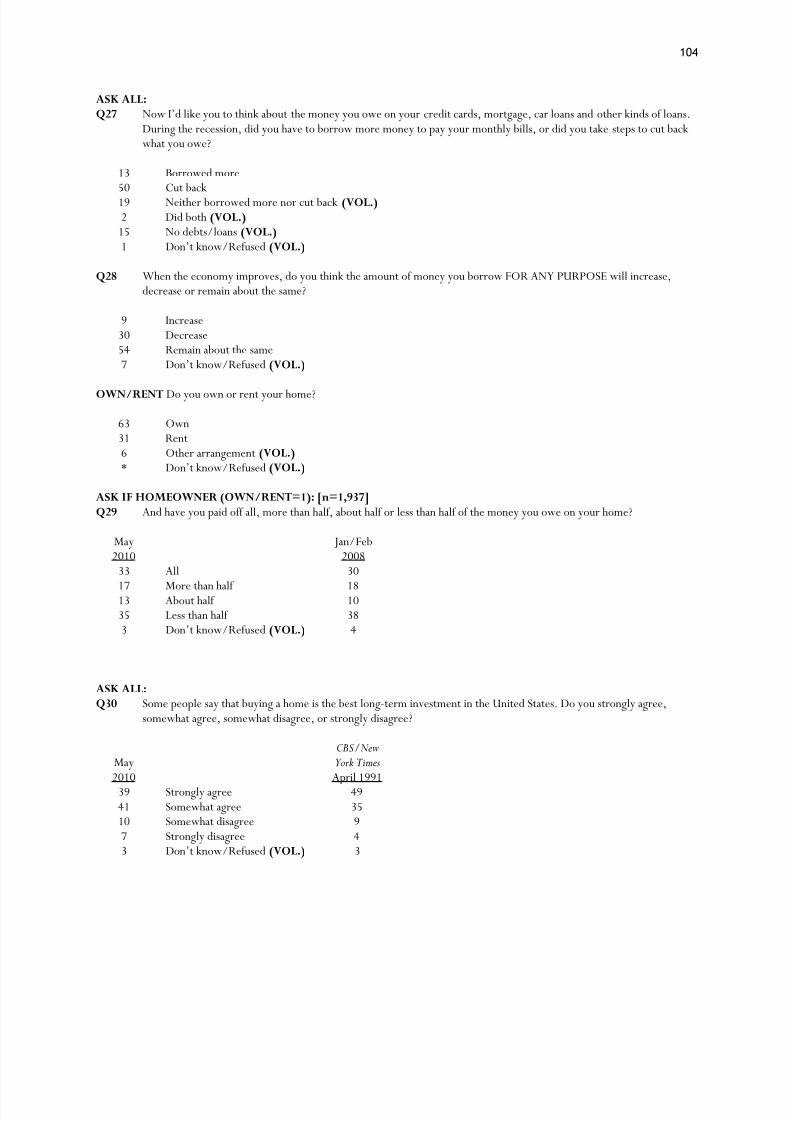
8/8/2019 Pew Research Center Recession
http://slidepdf.com/reader/full/pew-research-center-recession 110/120
104
ASK ALL:Q27 Now I‘d like you to think about the money you owe on your credit cards, mortgage, car loans an
During the recession, did you have to borrow more money to pay your monthly bills, or did you take steps to cut backwhat you owe?
13 Borrowed more50 Cut back19 Neither borrowed more nor cut back(VOL.) 2 Did both(VOL.) 15 No debts/loans(VOL.) 1 Don‘t know/Refused (VOL.)
Q28 When the economy improves, do you think the amount of money you borrow FOR ANY PURPOSE will increase,decrease or remain about the same?
9 Increase30 Decrease54 Remain about the same7 Don‘t know/Refused (VOL.)
OWN/RENT Do you own or rent your home?
63 Own31 Rent6 Other arrangement(VOL.) * Don‘t know/Refused(VOL.)
ASK IF HOMEOWNER (OWN/RENT=1): [n=1,937]Q29 And have you paid off all, more than half, about half or less than half of the money you owe on your home?
May2010
Jan/Feb2008
33 All 30
17 More than half 1813 About half 1035 Less than half 383 Don‘t know/Refused (VOL.)
4
ASK ALL:Q30 Some people say that buying a home is the best long-term investment in the United States. Do you strongly agree,
somewhat agree, somewhat disagree, or strongly disagree?
May2010
CBS/New York TimesApril 1991
39 Strongly agree 4941 Somewhat agree 3510 Somewhat disagree 97 Strongly disagree 43 Don‘t know/Refused (VOL.)
3
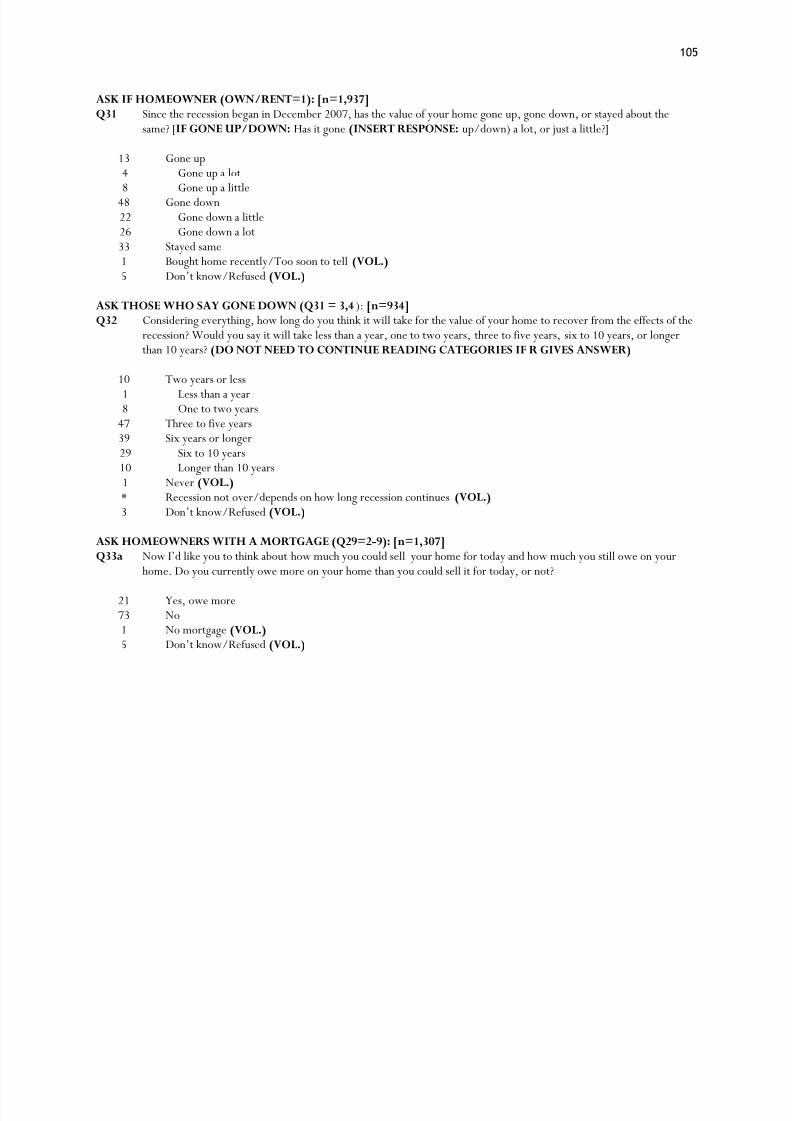
8/8/2019 Pew Research Center Recession
http://slidepdf.com/reader/full/pew-research-center-recession 111/120
105
ASK IF HOMEOWNER (OWN/RENT=1): [n=1,937]Q31 Since the recession began in December 2007, has the value of your home gone up, gone down, or stayed about the
same? [IF GONE UP/DOWN: Has it gone(INSERT RESPONSE: up/down) a lot, or just a little?]
13 Gone up4 Gone up a lot8 Gone up a little
48 Gone down22 Gone down a little26 Gone down a lot33 Stayed same1 Bought home recently/Too soon to tell(VOL.) 5 Don‘t know/Refused (VOL.)
ASK THOSE WHO SAY GONE DOWN (Q31 = 3,4 ): [n=934] Q32 Considering everything, how long do you think it will take for the value of your home to recover from the effects of the
recession? Would you say it will take less than a year, one to two years, three to five years, six to 10 years, or longerthan 10 years?(DO NOT NEED TO CONTINUE READING CATEGORIES IF R GIVES ANSWER)
10 Two years or less1 Less than a year8 One to two years
47 Three to five years39 Six years or longer29 Six to 10 years10 Longer than 10 years1 Never(VOL.) * Recession not over/depends on how long recession continues(VOL.) 3 Don‘t know/Refused (VOL.)
ASK HOMEOWNERS WITH A MORTGAGE (Q29=2-9): [n=1,307]Q33a Now I‘d like you to think about how much you could sellyour home for today and how much you still owe on your
home. Do you currently owe more on your home than you could sell it for today, or not?
21 Yes, owe more73 No1 No mortgage(VOL.)5 Don‘t know/Refused (VOL.)
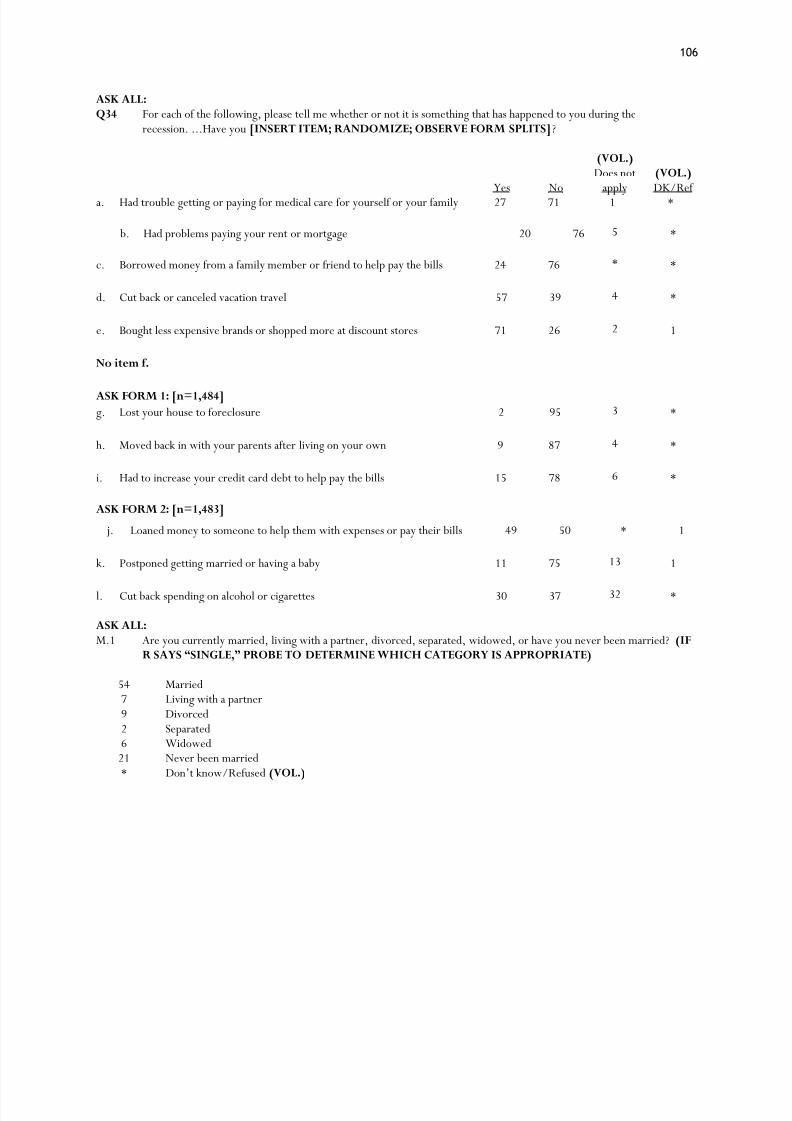
8/8/2019 Pew Research Center Recession
http://slidepdf.com/reader/full/pew-research-center-recession 112/120
106
ASK ALL:Q34 For each of the following, please tell me whether or not it is something that has happened to you during the
recession. ...Have you[INSERT ITEM; RANDOMIZE; OBSERVE FORM SPLITS] ?
Yes No
(VOL.)Does not
apply (VOL.) DK/Ref
a. Had trouble getting or paying for medical care for yourself or your family 27 71 1 *
b. Had problems paying your rent or mortgage 20 76 5 *
c. Borrowed money from a family member or friend to help pay the bills 24 76 * *
d. Cut back or canceled vacation travel 57 39 4 *
e. Bought less expensive brands or shopped more at discount stores 71 26 2 1
No item f.
ASK FORM 1: [n=1,484]g. Lost your house to foreclosure 2 95 3 *
h. Moved back in with your parents after living on your own 9 87 4 *
i. Had to increase your credit card debt to help pay the bills 15 78 6 *
ASK FORM 2: [n=1,483]
j. Loaned money to someone to help them with expenses or pay their bills 49 50 * 1
k. Postponed getting married or having a baby 11 75 13 1
l. Cut back spending on alcohol or cigarettes 30 37 32 *
ASK ALL:M.1 Are you currently married, living with a partner, divorced, separated, widowed, or have you never been married?(IF
R SAYS “SINGLE,” PROBE TO DETERMINE WHICH CATEGORY IS APPROPRIATE)
54 Married7 Living with a partner9 Divorced2 Separated6 Widowed21 Never been married* Don‘t know/Refused (VOL.)

8/8/2019 Pew Research Center Recession
http://slidepdf.com/reader/full/pew-research-center-recession 113/120
107
ASK ALL:Q35 Overall, how confident are you that YOU (IF M1=1: and your spouse) will have enough income and assets to last
throughout your retirement years? Are you[READ LIST]?
May2010
Feb2009
23 Very confident 3041 Somewhat confident 4119 Not too confident 1613 Not at all confident 91 Won‘t have anything/haven‘t been able to save (VOL.) n/a3 Don‘t know/Refused (VOL.) 3
ASK IF MARRIED (M.1 =1): [n=1,532]E5 Is your spouse now employed full-time, part-time or not employed?
54 Full-time10 Part-time35 Not employed
1 Don‘t know/Refused (VOL.) ASK ALL:Q36 Do you (IF M1=1 : or your spouse)(READ AND RANDOMIZE – ALWAYS ASK ITEM b LAST)
a. Own any stocks, bonds or mutual funds
May2010
Jan/Feb2008
37 Yes 4461 No 552 Don‘t know/Refused (VOL.) 1
b. Have a checking or savings account, or some other form of savings85 Yes14 No1 Don‘t know/Refused (VOL.)
c. Have an IRA, 401K or a similar kind of retirement account
May2010
Jan/Feb2008
55 Yes 5743 No 411 Don‘t know/Refused (VOL.) 2
ASK IF RESPONDENT OWNS ANY STOCKS, BONDS, MUTUAL FUNDS (Q36a = 1): [n=1,181]Q37 During the recession, did you have to sell some of your stocks, bonds or other investments to meet expenses or pay
your bills, or not?
19 Yes80 No* Don‘t know/Refused (VOL.)
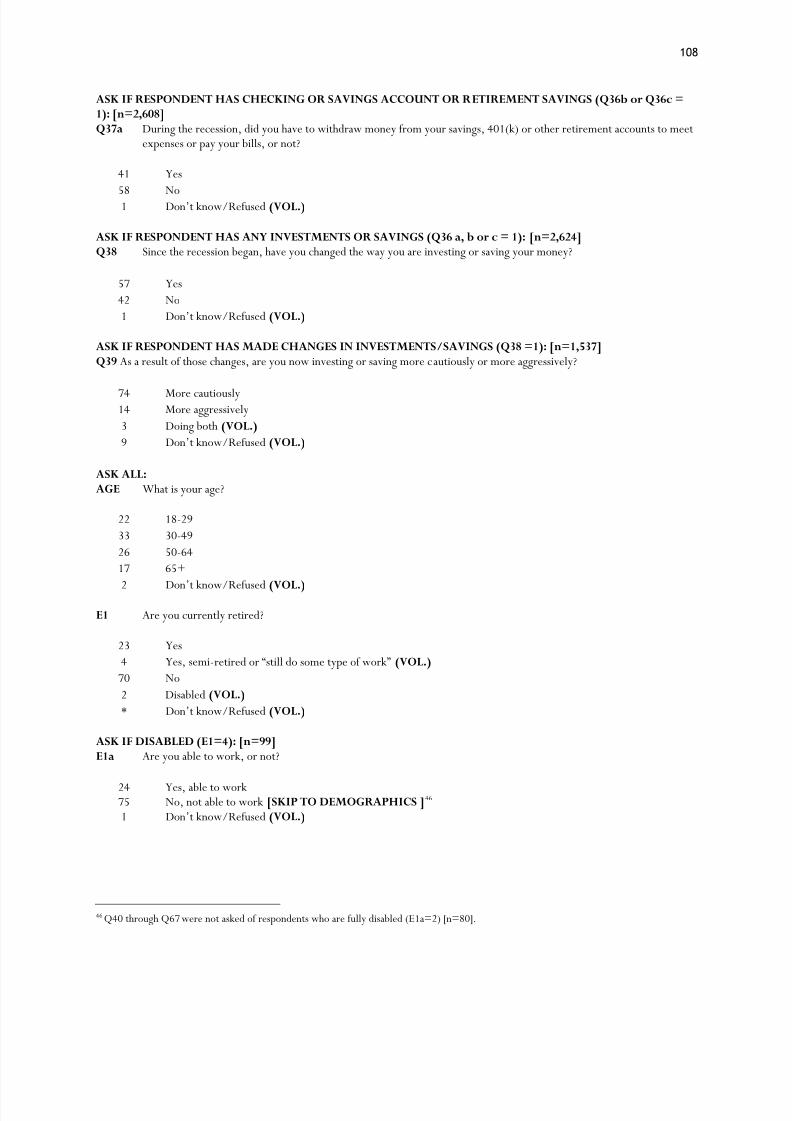
8/8/2019 Pew Research Center Recession
http://slidepdf.com/reader/full/pew-research-center-recession 114/120
108
ASK IF RESPONDENT HAS CHECKING OR SAVINGS ACCOUNT OR RETIREMENT SAVINGS (Q36b or Q36c =1): [n=2,608]Q37a During the recession, did you have to withdraw money from your savings, 401(k) or other retirement accounts to meet
expenses or pay your bills, or not?
41 Yes
58 No1 Don‘t know/Refused (VOL.)
ASK IF RESPONDENT HAS ANY INVESTMENTS OR SAVINGS (Q36 a, b or c = 1): [n=2,624]Q38 Since the recession began, have you changed the way you are investing or saving your money?
57 Yes42 No1 Don‘t know/Refused (VOL.)
ASK IF RESPONDENT HAS MADE CHANGES IN INVESTMENTS/SAVINGS (Q38 =1): [n=1,537]Q39 As a result of those changes, are you now investing or saving more cautiously or more aggressively?
74 More cautiously14 More aggressively3 Doing both(VOL.) 9 Don‘t know/Refused (VOL.)
ASK ALL:AGE What is your age?
22 18-2933 30-4926 50-6417 65+
2 Don‘t know/Refused (VOL.)
E1 Are you currently retired?
23 Yes4 Yes, semi-retired or ―still do some type of work‖(VOL.) 70 No2 Disabled(VOL.) * Don‘t know/Refused (VOL.)
ASK IF DISABLED (E1=4): [n=99]E1a Are you able to work, or not?
24 Yes, able to work75 No, not able to work[SKIP TO DEMOGRAPHICS ] 46 1 Don‘t know/Refused (VOL.)
46Q40 through Q67 were not asked of respondents who are fully disabled (E1a=2) [n=80].

8/8/2019 Pew Research Center Recession
http://slidepdf.com/reader/full/pew-research-center-recession 115/120

8/8/2019 Pew Research Center Recession
http://slidepdf.com/reader/full/pew-research-center-recession 116/120
110
ASK IF NOT EMPLOYED AND WOULD LIKE TO HAVE A JOB (E3 = 3 AND Q42 = 1): [n=830]Q43 Could you start a job now if one were offered to you?
75 Yes
20 No6 Don‘t know/Refused (VOL.)
ASK IF WORKING PART-TIME (E3=2): [n=467]E3a Would you prefer to be working full-time, or not?
47 Yes, prefer full-time52 No1 Don‘t know/Refused (VOL.)
ASK IF WORKING PART-TIME AND PREFER FULL-TIME (E3=2 AND E3a = 1): [n=238]Q44 Are you working part-time because you could not find full-time work, your employer cut back your hours, or is there
some other reason?
37 Could not find full-time work23 Employer cut back hours39 Other reason1 Don‘t know/Refused (VOL.)
ASK ALL WORKING (E3=1,2): [n=1,604]E3c. Are you self-employed, or not?[INTERVIEWER INSTRUCTION: IF R MENTIONS MORE THAN ONE
JOB/EMPLOYER ASK ABOUT THEIR “main job”]
22 Yes, self-employed (includes independent contractor, freelance worker)78 No, not self-employed* Don‘t know/Refused (VOL.)
ASK ALL WORKING (E3=1,2): [n=1,604]Q45 Overall, how satisfied are you with your job? Are you(READ)
May2010
July2009
Jan2008
June2006
PSRA49 July 1997
Gallup July 1989
86 Satisfied(NET) 90 87 89 86 8932 Completely satisfied 30 31 28 24 2854 Mostly satisfied 60 56 61 62 6112 Dissatisfied(NET) 9 12 10 13 117 Mostly dissatisfied 7 10 8 10 84 Completely dissatisfied 2 3 2 3 32 Don‘t know/Refused (VOL.) 1 * 1 1 *
49 The July 1997 PSRA question was worded ―Overall, how satisfied or dissatisfied are you with your current jobRESPONSES]‖
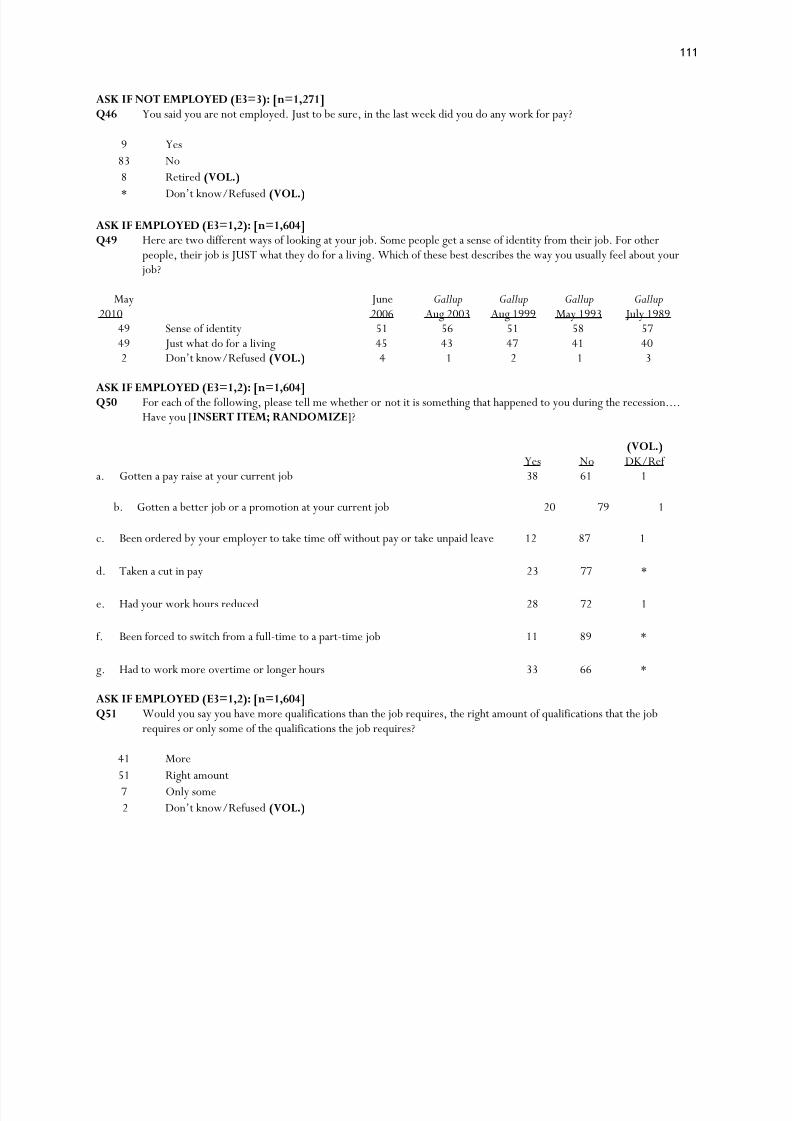
8/8/2019 Pew Research Center Recession
http://slidepdf.com/reader/full/pew-research-center-recession 117/120
111
ASK IF NOT EMPLOYED (E3=3): [n=1,271]Q46 You said you are not employed. Just to be sure, in the last week did you do any work for pay?
9 Yes83 No8 Retired(VOL.)
* Don‘t know/Refused (VOL.)
ASK IF EMPLOYED (E3=1,2): [n=1,604]Q49 Here are two different ways of looking at your job. Some people get a sense of identity from their job. For other
people, their job is JUST what they do for a living. Which of these best describes the way you usually feel about your job?
May2010
June2006
GallupAug 2003
GallupAug 1999
Gallup May 1993
Gallup July 1989
49 Sense of identity 51 56 51 58 5749 Just what do for a living 45 43 47 41 402 Don‘t know/Refused(VOL.) 4 1 2 1 3
ASK IF EMPLOYED (E3=1,2): [n=1,604]Q50 For each of the following, please tell me whether or not it is something that happened to you during the recession....Have you [INSERT ITEM; RANDOMIZE ]?
Yes No(VOL.) DK/Ref
a. Gotten a pay raise at your current job 38 61 1
b. Gotten a better job or a promotion at your current job 20 79 1
c. Been ordered by your employer to take time off without pay or take unpaid leave 12 87 1
d. Taken a cut in pay 23 77 *
e. Had your work hours reduced 28 72 1
f. Been forced to switch from a full-time to a part-time job 11 89 *
g. Had to work more overtime or longer hours 33 66 *
ASK IF EMPLOYED (E3=1,2): [n=1,604]Q51 Would you say you have more qualifications than the job requires, the right amount of qualifications that the job
requires or only some of the qualifications the job requires?
41 More51 Right amount7 Only some2 Don‘t know/Refused (VOL.)

8/8/2019 Pew Research Center Recession
http://slidepdf.com/reader/full/pew-research-center-recession 118/120
112
ASK IF EMPLOYED (E3 = 1,2): [n=1,604]Q52 Since the recession started in December 2007, was there a time when you were out of work AND LOOKING FOR A
JOB?
26 Yes73 No [SKIP TO Q67]
1 Retired/Does not apply (student, homemaker, disabled)(VOL.) [SKIP TO Q67] * Laid off/break in work, resumed same job(VOL.) [SKIP TO Q61] * Don‘t know/Refused (VOL.) [SKIP TO Q67]
ASK IF UNEMPLOYED NOW OR UNEMPLOYED SOMETIME DURING RECESSION/DK (E3=3 OR Q52=1):[n=1,647]Q53 IF UNEMPLOYED (E3=3) : Since the recession started, how many times, INCLUDING THIS TIME, have you been
unemployed?IF EMPLOYED (E3=1,2) : Since the recession started, how many times have you been unemployed?
60 One time9 Two times11 Three or more times
20 Don‘t know/Refused (VOL.)
ASK IF UNEMPLOYED AND OUT OF WORK MORE THAN ONE TIME DURING RECESSION (E3=3 AND Q53=2-8): [n=207]Q54a-c And what was the LONGEST period of time you were out of work?[INTERVIEWER: PROBE IF NECESSARY;
RECORD AS MONTHS IF LESS THAN ONE YEAR. 12 MONTHS SHOULD BE RECORDED AS 1 YEAR. IFMORE THAN ONE YEAR RECORD AS YEARS AND MONTHS]
ASK IF NOT SURE/DON’T KNOW (CODE 99 TO Q54a, b, c): Q54d Was it less than three months, or was it three months or longer?
5 Less than three months91 Three months or longer5 Three to five months16 Six to 11 months27 One year33 Two years or longer8 Unspecified1 Never worked/Homemaker(VOL.) 3 Don‘t know/Refused (VOL.)
Q55/56 COMBINED:BASED ON THOSE WHO ARE EMPLOYED BUT WERE UNEMPLOYED AT LEAST ONCE DURING THERECESSION: [n=360]
ASK IF EMPLOYED AND OUT OF WORK ONCE DURING RECESSION (E3=1,2 & Q53=1):Q55a-c How long were you out of work and looking for a job?[INTERVIEWER: PROBE IF NECESSARY; RECORD AS
MONTHS IF LESS THAN ONE YEAR. 12 MONTHS SHOULD BE RECORDED AS 1 YEAR. IF MORETHAN ONE YEAR RECORD AS YEARS AND MONTHS]
ASK IF NOT SURE/DON’T KNOW (CODE 99 TO Q55a, b, c): Q55d Was it less than three months, or was it three months or longer?
ASK IF EMPLOYED AND OUT OF WORK MORE THAN ONCE DURING RECESSION (E3=1,2 AND Q53=2-8):Q56a-c And what was the LONGEST period of time you were out of work?[INTERVIEWER: PROBE IF NECESSARY;
RECORD AS MONTHS IF LESS THAN ONE YEAR. 12 MONTHS SHOULD BE RECORDED AS 1 YEAR. IFMORE THAN ONE YEAR RECORD AS YEARS AND MONTHS]
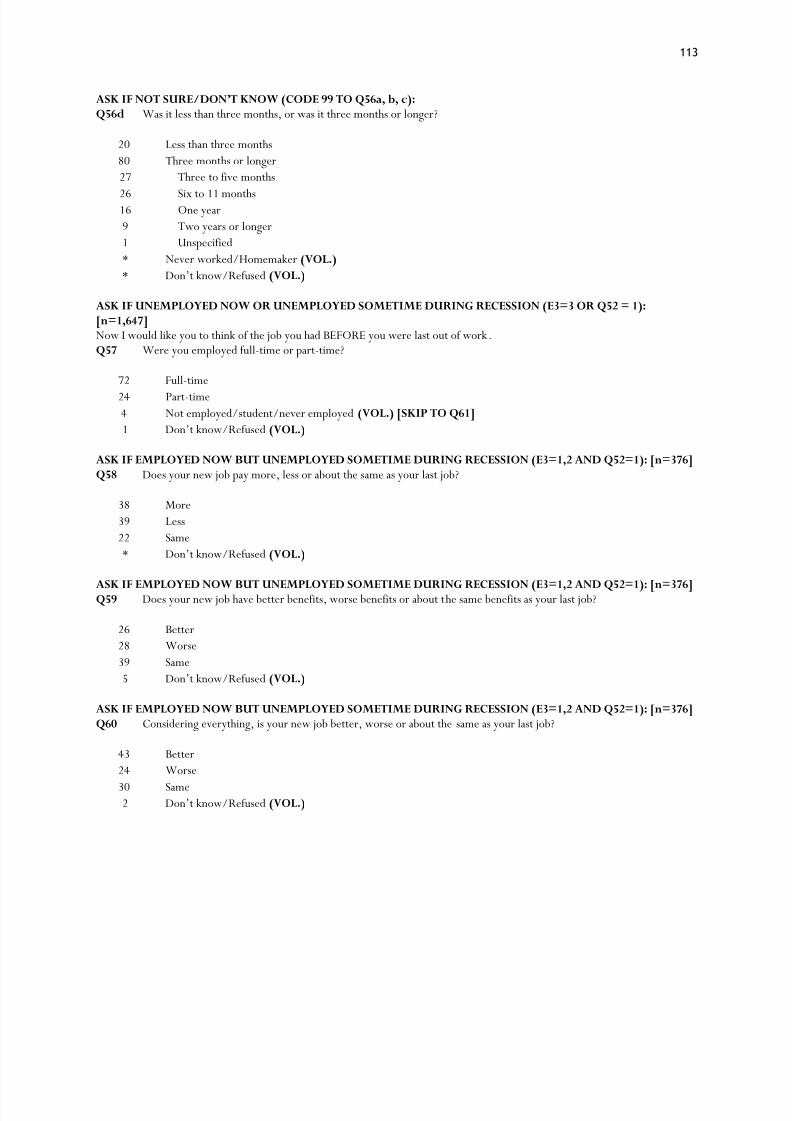
8/8/2019 Pew Research Center Recession
http://slidepdf.com/reader/full/pew-research-center-recession 119/120
113
ASK IF NOT SURE/DON’T KNOW (CODE 99 TO Q56a, b, c): Q56d Was it less than three months, or was it three months or longer?
20 Less than three months80 Three months or longer27 Three to five months
26 Six to 11 months16 One year9 Two years or longer1 Unspecified* Never worked/Homemaker(VOL.) * Don‘t know/Refused (VOL.)
ASK IF UNEMPLOYED NOW OR UNEMPLOYED SOMETIME DURING RECESSION (E3=3 OR Q52 = 1):[n=1,647]Now I would like you to think of the job you had BEFORE you were last out of work.Q57 Were you employed full-time or part-time?
72 Full-time24 Part-time4 Not employed/student/never employed(VOL.) [SKIP TO Q61] 1 Don‘t know/Refused (VOL.)
ASK IF EMPLOYED NOW BUT UNEMPLOYED SOMETIME DURING RECESSION (E3=1,2 AND Q52=1): [n=376]Q58 Does your new job pay more, less or about the same as your last job?
38 More39 Less22 Same* Don‘t know/Refused (VOL.)
ASK IF EMPLOYED NOW BUT UNEMPLOYED SOMETIME DURING RECESSION (E3=1,2 AND Q52=1): [n=376]Q59 Does your new job have better benefits, worse benefits or about the same benefits as your last job?
26 Better28 Worse39 Same5 Don‘t know/Refused (VOL.)
ASK IF EMPLOYED NOW BUT UNEMPLOYED SOMETIME DURING RECESSION (E3=1,2 AND Q52=1): [n=376]Q60 Considering everything, is your new job better, worse or about the same as your last job?
43 Better24 Worse
30 Same2 Don‘t know/Refused (VOL.)
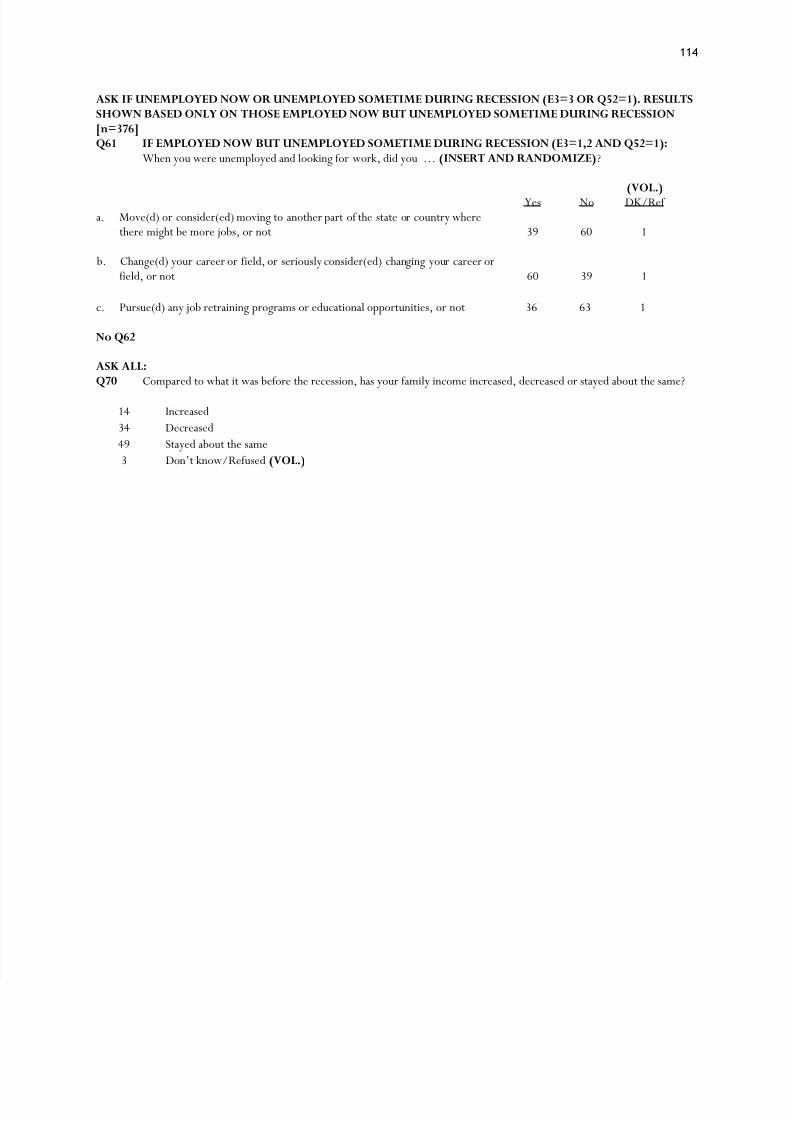
8/8/2019 Pew Research Center Recession
http://slidepdf.com/reader/full/pew-research-center-recession 120/120
114
ASK IF UNEMPLOYED NOW OR UNEMPLOYED SOMETIME DURING RECESSION (E3=3 OR Q52=1). RESULTSSHOWN BASED ONLY ON THOSE EMPLOYED NOW BUT UNEMPLOYED SOMETIME DURING RECESSION[n=376]Q61 IF EMPLOYED NOW BUT UNEMPLOYED SOMETIME DURING RECESSION (E3=1,2 AND Q52=1):
When you were unemployed and looking for work, did you… (INSERT AND RANDOMIZE) ?
Yes No(VOL.) DK/Ref
a. Move(d) or consider(ed) moving to another part of the state or country wherethere might be more jobs, or not 39 60 1
b. Change(d) your career or field, or seriously consider(ed) changing your career orfield, or not 60 39 1
c. Pursue(d) any job retraining programs or educational opportunities, or not 36 63 1
No Q62
ASK ALL:Q70 Compared to what it was before the recession, has your family income increased, decreased or stayed about the same?
14 Increased34 Decreased49 Stayed about the same3 Don‘t know/Refused (VOL.)