PETROLEUM AND N GAS SYSTEMS - …
20
2011-2012-2013 GHGRP Industrial Profiles Petroleum and Natural Gas Systems All emissions presented here are as of 8/18/2014 and exclude biogenic CO2. All GHG emissions data displayed in units of carbon dioxide equivalent (CO2e) reflect the global warming potential (GWP) values from IPCC AR4 . PETROLEUM AND NATURAL GAS SYSTEMS Introduction On September 30, 2014, the U.S. Environmental Protection Agency (EPA) released 2013 greenhouse gas (GHG) data for Petroleum and Natural Gas Systems 1 collected under the Greenhouse Gas Reporting Program (GHGRP). The GHGRP, which was required by Congress in the FY2008 Consolidated Appropriations Act, requires facilities to report data from large emission sources across a range of industry sectors, as well as suppliers of certain greenhouse gases and products that would emit GHGs if released or combusted. The data show 2013 GHG emissions from over 2,100 facilities conducting Petroleum and Natural Gas Systems activities, such as production, processing, transmission, and distribution. In total, these facilities accounted for GHG emissions of 224 million metric tons of carbon dioxide equivalent (CO2 e). This is a decrease of 1% compared to 2012 GHG emissions from this sector. The data represent a significant step forward in better understanding GHG emissions from Petroleum and Natural Gas Systems. The EPA is working to improve the quality of data from this sector and expects that the GHGRP will be an important tool for the Agency and the public to analyze emissions, identify opportunities for improving the data, and understand emissions trends. When reviewing these data and comparing it to other data sets or published literature, it is important to understand the GHGRP reporting requirements and the impacts of these requirements on the reported data. Facilities used uniform methods prescribed by the EPA to calculate GHG emissions, such as direct measurement, engineering calculations, or emission factors derived from direct measurement. In some cases, facilities had a choice of calculation methods for an emission source. In order to provide facilities with time to adjust to the requirements of the GHGRP, the EPA made available the optional use of Best Available Monitoring Methods (BAMM) for unique or unusual circumstances. Where a facility used BAMM, it was required to follow emission calculations specified by the EPA, but was allowed to use alternative methods for determining inputs to calculate emissions. Petroleum and Natural Gas Systems is one of the more complex source categories within the GHGRP because of the number of emission sources covered, technical complexity, and variability across facilities. It is expected that there can be differences in reported emissions from one facility to another. It is not uncommon for a handful of facilities to contribute the majority of the national reported emissions total for a specific emission source. As described in more detail below, there is a reporting threshold and the data does not cover certain emission sources, and therefore the data does not represent the entire universe of emissions from Petroleum and Natural Gas Systems. There is also variability in the methods used which could impact cross-segment, cross-source, or cross-facility comparisons. Emission changes may not solely be due to the change in the number of facilities, and could be the result of a number of factors. It is important to be aware of these 1 The implementing regulations of the Petroleum and Natural Gas Systems source category of the GHGRP are located at 40 CFR Part 98 Subpart W. 1
Transcript of PETROLEUM AND N GAS SYSTEMS - …

2011-2012-2013 GHGRP Industrial Profiles Petroleum and Natural Gas Systems
All emissions presented here are as of 8/18/2014 and exclude biogenic CO2. All GHG emissions data displayed in units of carbon dioxide equivalent (CO2e) reflect the global warming potential (GWP) values from IPCC AR4.
PETROLEUM AND NATURAL GAS SYSTEMS Introduction On September 30, 2014, the U.S. Environmental Protection Agency (EPA) released 2013 greenhouse gas (GHG) data for Petroleum and Natural Gas Systems1 collected under the Greenhouse Gas Reporting Program (GHGRP). The GHGRP, which was required by Congress in the FY2008 Consolidated Appropriations Act, requires facilities to report data from large emission sources across a range of industry sectors, as well as suppliers of certain greenhouse gases and products that would emit GHGs if released or combusted. The data show 2013 GHG emissions from over 2,100 facilities conducting Petroleum and Natural Gas Systems activities, such as production, processing, transmission, and distribution. In total, these facilities accounted for GHG emissions of 224 million metric tons of carbon dioxide equivalent (CO2e). This is a decrease of 1% compared to 2012 GHG emissions from this sector. The data represent a significant step forward in better understanding GHG emissions from Petroleum and Natural Gas Systems. The EPA is working to improve the quality of data from this sector and expects that the GHGRP will be an important tool for the Agency and the public to analyze emissions, identify opportunities for improving the data, and understand emissions trends. When reviewing these data and comparing it to other data sets or published literature, it is important to understand the GHGRP reporting requirements and the impacts of these requirements on the reported data. Facilities used uniform methods prescribed by the EPA to calculate GHG emissions, such as direct measurement, engineering calculations, or emission factors derived from direct measurement. In some cases, facilities had a choice of calculation methods for an emission source. In order to provide facilities with time to adjust to the requirements of the GHGRP, the EPA made available the optional use of Best Available Monitoring Methods (BAMM) for unique or unusual circumstances. Where a facility used BAMM, it was required to follow emission calculations specified by the EPA, but was allowed to use alternative methods for determining inputs to calculate emissions. Petroleum and Natural Gas Systems is one of the more complex source categories within the GHGRP because of the number of emission sources covered, technical complexity, and variability across facilities. It is expected that there can be differences in reported emissions from one facility to another. It is not uncommon for a handful of facilities to contribute the majority of the national reported emissions total for a specific emission source. As described in more detail below, there is a reporting threshold and the data does not cover certain emission sources, and therefore the data does not represent the entire universe of emissions from Petroleum and Natural Gas Systems. There is also variability in the methods used which could impact cross-segment, cross-source, or cross-facility comparisons. Emission changes may not solely be due to the change in the number of facilities, and could be the result of a number of factors. It is important to be aware of these
1 The implementing regulations of the Petroleum and Natural Gas Systems source category of the GHGRP are located at 40 CFR Part 98 Subpart W.
1

2011-2012-2013 GHGRP Industrial Profiles Petroleum and Natural Gas Systems
limitations and differences when using this data, particularly when attempting to draw broad conclusions about emissions from this sector.
Petroleum and Natural Gas Systems in the GHG Reporting Program The Petroleum and Natural Gas Systems source category of the GHGRP requires reporting from the following eight industry segments, which account for most of the largest emission sources:
• Onshore Production: Production of petroleum and natural gas associated with onshore production wells and related equipment.
• Offshore Production: Production of petroleum and natural gas from offshore production platforms.
• Natural Gas Processing: Processing of field -quality gas to produce pipeline-quality natural gas.
• Natural Gas Transmission: Compressor stations used to transfer natural gas through transmission pipelines.
• Underground Natural Gas Storage: Facilities that store natural gas in underground formations.
• Natural Gas Distribution: Distribution systems that deliver natural gas to customers. • Liquified Natural Gas (LNG) Import/Export: Liquified Natural Gas import and export
terminals. • LNG Storage: Liquified Natural Gas storage equipment.
The diagram below illustrates the segments of the Petroleum and Natural Gas Systems source category that are required to report under the GHGRP. Figure 1: Petroleum and Natural Gas Systems in the GHG Reporting Program
2
2011-2012-2013 GHGRP Industrial Profiles Petroleum and Natural Gas Systems
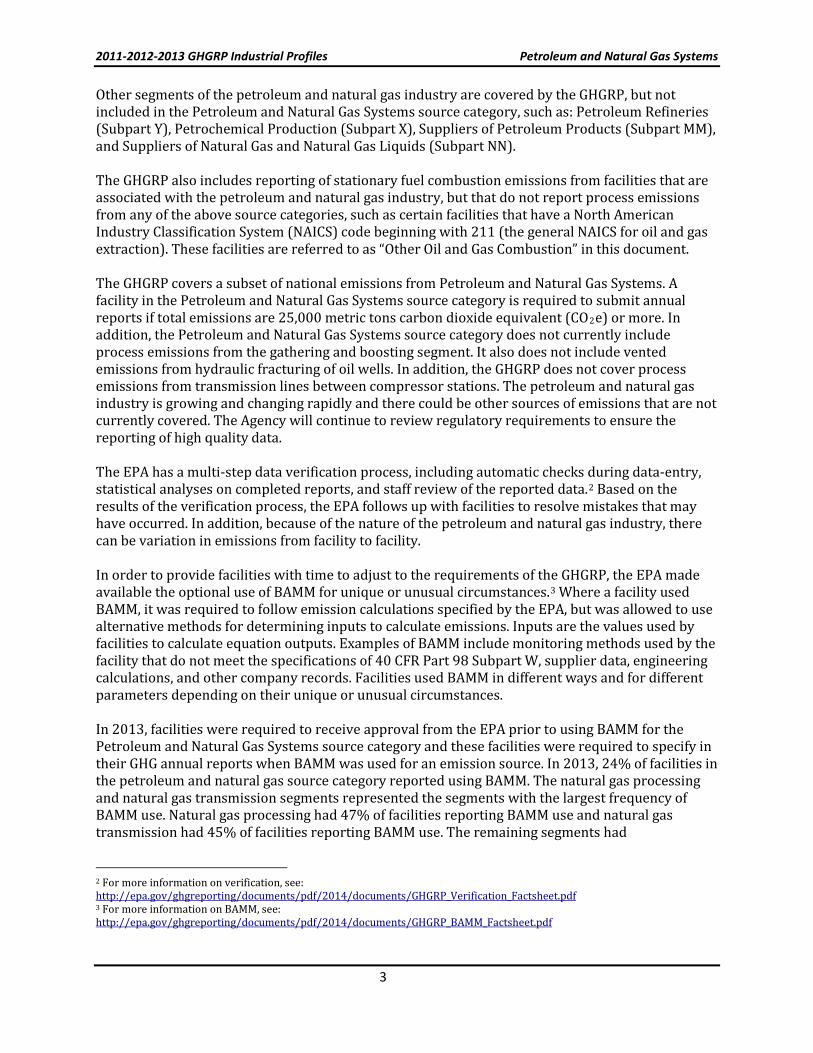
Other segments of the petroleum and natural gas industry are covered by the GHGRP, but not included in the Petroleum and Natural Gas Systems source category, such as: Petroleum Refineries (Subpart Y), Petrochemical Production (Subpart X), Suppliers of Petroleum Products (Subpart MM), and Suppliers of Natural Gas and Natural Gas Liquids (Subpart NN). The GHGRP also includes reporting of stationary fuel combustion emissions from facilities that are associated with the petroleum and natural gas industry, but that do not report process emissions from any of the above source categories, such as certain facilities that have a North American Industry Classification System (NAICS) code beginning with 211 (the general NAICS for oil and gas extraction). These facilities are referred to as “Other Oil and Gas Combustion” in this document. The GHGRP covers a subset of national emissions from Petroleum and Natural Gas Systems. A facility in the Petroleum and Natural Gas Systems source category is required to submit annual reports if total emissions are 25,000 metric tons carbon dioxide equivalent (CO2e) or more. In addition, the Petroleum and Natural Gas Systems source category does not currently include process emissions from the gathering and boosting segment. It also does not include vented emissions from hydraulic fracturing of oil wells. In addition, the GHGRP does not cover process emissions from transmission lines between compressor stations. The petroleum and natural gas industry is growing and changing rapidly and there could be other sources of emissions that are not currently covered. The Agency will continue to review regulatory requirements to ensure the reporting of high quality data. The EPA has a multi-step data verification process, including automatic checks during data-entry, statistical analyses on completed reports, and staff review of the reported data.2 Based on the results of the verification process, the EPA follows up with facilities to resolve mistakes that may have occurred. In addition, because of the nature of the petroleum and natural gas industry, there can be variation in emissions from facility to facility. In order to provide facilities with time to adjust to the requirements of the GHGRP, the EPA made available the optional use of BAMM for unique or unusual circumstances.3 Where a facility used BAMM, it was required to follow emission calculations specified by the EPA, but was allowed to use alternative methods for determining inputs to calculate emissions. Inputs are the values used by facilities to calculate equation outputs. Examples of BAMM include monitoring methods used by the facility that do not meet the specifications of 40 CFR Part 98 Subpart W, supplier data, engineering calculations, and other company records. Facilities used BAMM in different ways and for different parameters depending on their unique or unusual circumstances. In 2013, facilities were required to receive approval from the EPA prior to using BAMM for the Petroleum and Natural Gas Systems source category and these facilities were required to specify in their GHG annual reports when BAMM was used for an emission source. In 2013, 24% of facilities in the petroleum and natural gas source category reported using BAMM. The natural gas processing and natural gas transmission segments represented the segments with the largest frequency of BAMM use. Natural gas processing had 47% of facilities reporting BAMM use and natural gas transmission had 45% of facilities reporting BAMM use. The remaining segments had
2 For more information on verification, see: http://epa.gov/ghgreporting/documents/pdf/2014/documents/GHGRP_Verification_Factsheet.pdf 3 For more information on BAMM, see: http://epa.gov/ghgreporting/documents/pdf/2014/documents/GHGRP_BAMM_Factsheet.pdf
3

2011-2012-2013 GHGRP Industrial Profiles Petroleum and Natural Gas Systems
proportionally lower BAMM use. LNG import/export had 38% of facilities reporting BAMM use, underground natural gas storage had 27% of facilities reporting BAMM use, LNG storage had 20% of facilities reporting BAMM use, onshore production had 15% of facilities reporting BAMM use, and natural gas distribution had 2% of facilities reporting BAMM use. No facilities in the offshore production segment reported BAMM use. In addition, facilities in the other oil and gas combustion category were not permitted to use BAMM. For purposes of this document, facilities are recorded as using BAMM if they indicated the use of BAMM for any piece of equipment from any emission source.
Reported GHG Emissions from Petroleum and Natural Gas Systems The following section provides information on reported GHG emissions by industry segment, by greenhouse gas, by combustion and process emissions, and by emission source for the 2013 calendar year. Reported Emissions by Industry Segment The 2013 calendar year was the third year that GHG emissions from Petroleum and Natural Gas Systems activities were required to be collected. Annual reports were due to the EPA by March 31, 2014. The EPA received reports from over 2,100 facilities4 with Petroleum and Natural Gas Systems activities, with total reported GHG emissions of 224 Million Metric Tons (MMT) CO2e. The largest industry segment in terms of reported GHG emissions was onshore production, with a total of 95 MMT CO2e, followed by natural gas processing, with reported emissions of 59 MMT CO2e. Other oil and gas combustion accounted for 25 MMT CO2e. The next largest segment was natural gas transmission, with reported emissions of 23 MMT CO2e. Reported emissions from
4 In general, a “facility” for purposes of the GHGRP means all co-located emission sources that are commonly owned or operated. However, the GHGRP has developed specialized facility definitions for natural gas distribution and onshore production. For natural gas distribution, the “facility” is a local distribution company as regulated by a single state public utility commission. For onshore production, the “facility” includes all emissions associated with wells owned or operated by a single company in a specific hydrocarbon producing basin (as defined by the geologic provinces published by the American Association of Petroleum Geologists).
221 202
74
415
170 35
266 231
107 429
0 100 200 300 400 500 600
Other Oil and Gas Combustion LNG Storage
LNG Import/Export Natural Gas Distribution
Underground Natural Gas Storage Natural Gas Transmission
Natural Gas Processing Offshore Production Onshore Production
Facility Count
Figure 2: 2013 BAMM Use by Segment
BAMM Used No BAMM
4

2011-2012-2013 GHGRP Industrial Profiles Petroleum and Natural Gas Systems
natural gas distribution totaled 15 MMT CO2e. The remaining segments accounted for total reported emissions of less than 10 MMT CO2e. Table 1: 2013 Reported Emissions by Industry Segment
Industry Segment Number of Facilities Reported Emissions (Million Metric Tons CO2e)
Onshore Production 503 95 Offshore Production 107 6 Natural Gas Processing 433 59 Natural Gas Transmission 487 23 Underground Natural Gas Storage 48 1 Natural Gas Distribution 173 15 LNG Import/Export 8 < 1 LNG Storage 5 < 1 Other Oil and Gas Combustion 415 25 Total 2,164 224 Note: Total number of facilities is smaller than the sum of facilities from each segment because some facilities reported under multiple segments. A facility is included in the count of number of facilities if it reported emissions (even if the reported emissions were zero) under a given segment. Reported Emissions by Greenhouse Gas For all segments combined, carbon dioxide (CO2) emissions accounted for 150 MMT CO2e of reported emissions and methane (CH4) emissions accounted for 74 MMT CO2e of reported emissions. Reported emissions from onshore production and natural gas distribution were primarily methane while reported emissions from natural gas transmission and natural gas processing were primarily carbon dioxide.
25
18 55
5 46
15
5 4
49
0 20 40 60 80 100
Other Oil and Gas Combustion LNG Storage
LNG Import/Export Natural Gas Distribution
Underground Natural Gas Storage Natural Gas Transmission
Natural Gas Processing Offshore Production Onshore Production
Emissions, MMT CO2e
Figure 3: 2013 Reported Emissions by Greenhouse Gas
CO₂ Emissions CH₄ Emissions N₂O Emissions
5

2011-2012-2013 GHGRP Industrial Profiles Petroleum and Natural Gas Systems
Reported Combustion and Process Emissions Each segment of Petroleum and Natural Gas Systems has unique emission sources. Emissions may result from the combustion of fossil fuels or from process sources that result in the direct emission of GHGs. Reported combustion emissions in Petroleum and Natural Gas Systems totaled 112 MMT CO2e and reported process emissions totaled 112 MMT CO2e. The majority of combustion emissions were reported by natural gas processing, onshore production, other oil and gas combustion, and natural gas transmission. The majority of process emissions were reported by onshore production, natural gas processing, and natural gas distribution.
Process emissions may be further classified as vented emissions, equipment leaks, and flaring. Reported vented emissions totaled 54 MMT CO2e, reported equipment leaks totaled 31 MMT CO2e, and reported flaring emissions totaled 27 MMT CO2e. Reported vented emissions in onshore production were primarily methane while reported vented emissions in natural gas processing were primarily carbon dioxide. Reported equipment leak emissions were primarily methane and reported flaring emissions were primarily carbon dioxide.
25
18 38
4 25
15
5 21
2 69
0 20 40 60 80 100
Other Oil and Gas Combustion LNG Storage
LNG Import/Export Natural Gas Distribution
Underground Natural Gas Storage Natural Gas Transmission
Natural Gas Processing Offshore Production Onshore Production
Emissions, MMT CO2e
Figure 4: 2013 Reported Combustion and Process Emissions
Combustion Emissions Process Emissions
2 14
37
15
3 2
9
4
22
0 20 40 60 80
LNG Storage LNG Import/Export
Natural Gas Distribution Underground Natural Gas Storage
Natural Gas Transmission Natural Gas Processing
Offshore Production Onshore Production
Emissions, MMT CO2e
Figure 5: 2013 Reported Process Emissions by Vented Emissions, Equipment Leaks, and Flaring
Vented Emissions Equipment Leaks Flaring
6

2011-2012-2013 GHGRP Industrial Profiles Petroleum and Natural Gas Systems
Reported Process Emission Sources The top reported process emission source in Petroleum and Natural Gas Systems was pneumatic devices with reported emissions of 25 MMT CO2e. Natural gas pneumatic devices are automated flow control devices powered by pressurized natural gas and used for maintaining a process condition such as liquid level, pressure, delta-pressure and temperature. Emissions from natural gas pneumatic devices are calculated by applying a facility determined population count to a default emission factor.
1
1
4
8
10
13
1
1
2
1
2
2
3
4
4
4
2
1
9
10
2
25
0 5 10 15 20 25 30
Enhanced Oil Recovery Pumps
Enhanced Oil Recovery Liquids
Gas Well Compl. and Work. without HF
Transmission Tanks
Well Testing
Distribution M-R Stations
Dehydrators
Centrifugal Compressors
Offshore Sources
Blowdown Vent Stacks
Gas Well Compl. and Work. with HF
Pneumatic Pumps
Reciprocating Compressors
Distribution Services
Liquids Unloading
Atmospheric Tanks
Other Flare Stacks
Distribution Mains
Misc Equipment Leaks
Associated Gas Venting and Flaring
Acid Gas Removal Units
Pneumatic Devices
Emissions, MMT CO2e
Figure 6: 2013 Reported Process Emission Sources
CO₂ Emissions CH₄ Emissions N₂O Emissions
7

2011-2012-2013 GHGRP Industrial Profiles Petroleum and Natural Gas Systems
Acid gas removal units were the top reported contributor to CO2 emissions from non-combustion sources and the top reported source of process emissions in the natural gas processing segment (13 MMT CO2e). Acid gas removal units are process units that separate hydrogen sulfide, carbon dioxide or both hydrogen sulfide and carbon dioxide from sour natural gas using absorbents or membrane separators. The CO2 emitted from acid gas removal units is a part of the gas stream that is produced at the wellhead. Natural gas processing creates pipeline quality natural gas and removal of CO2 from the gas streams is a key step in this process. Associated gas and other flare stacks were the top reported sources of process emissions from flaring for Petroleum and Natural Gas Systems. Associated gas is natural gas that is produced out of oil wells, but due to proximity and pipeline limitations, may be vented or flared instead of being processed. The other flare stacks category is a catch-all category applicable to the onshore production and natural gas processing segments and it is intended to cover all flares not otherwise reported for other sources at these facilities. For example, flaring for gas well completions and workovers with hydraulic fracturing would be reported under the gas well completions and workovers with hydraulic fracturing emission source rather than the other flare stacks emission source.
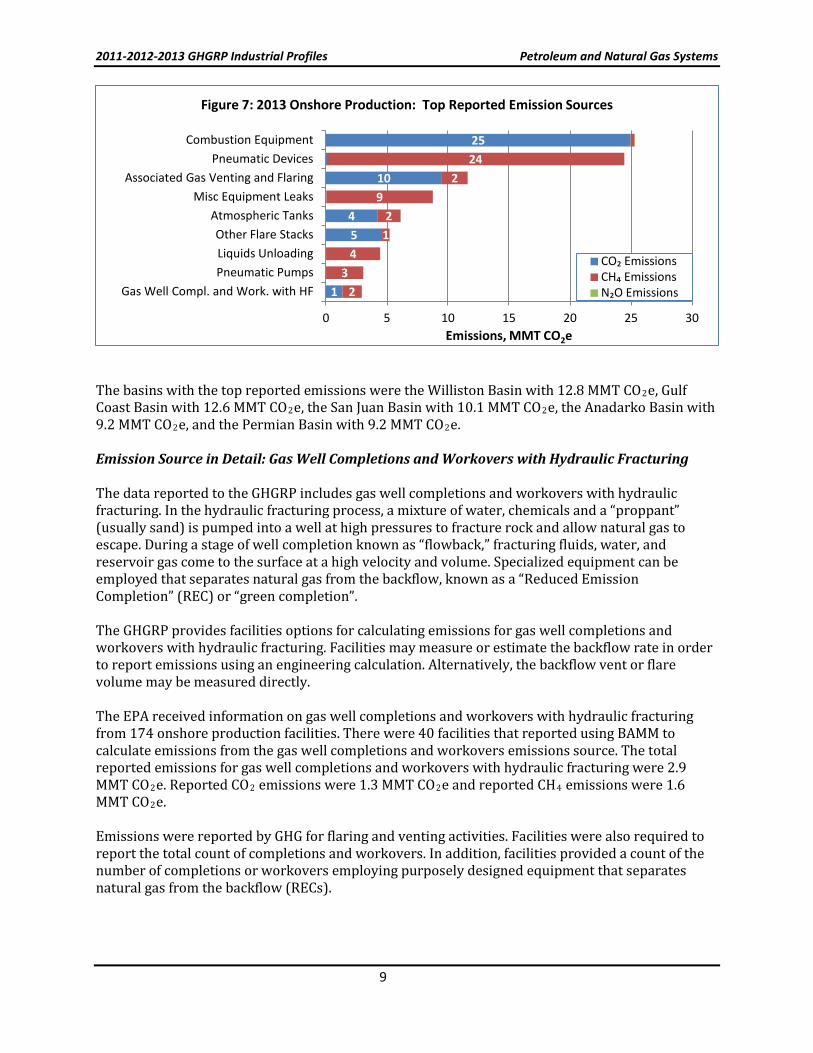
Reported GHG Emissions by Industry Segment and Source The following section provides information on reported GHG emissions organized by industry segment. For each segment, the top reported emission sources are presented, as well as additional information on emission sources for which stakeholders have expressed interest. Over time, we hope to provide additional information on other emission sources of interest to stakeholders. Onshore Production The EPA received annual reports from 503 facilities in the onshore production segment and reported emissions totaled 95 MMT CO2e. Methane emissions totaled 49 MMT CO2e and carbon dioxide emissions totaled 46 MMT CO2e. The top reported emission sources for onshore production were generally consistent with the top reported emission sources for Petroleum and Natural Gas Systems. Combustion equipment (25.3 MMT CO2e) and pneumatic devices (24.4 MMT CO2e) were the top reported emission sources, followed by associated gas venting and flaring (11.6 MMT CO2e), miscellaneous equipment leaks (8.8 MMT CO2e), atmospheric tanks (6.1 MMT CO2e), and other flare stacks (5.2 MMT CO2e).
8
2011-2012-2013 GHGRP Industrial Profiles Petroleum and Natural Gas Systems
The basins with the top reported emissions were the Williston Basin with 12.8 MMT CO2e, Gulf Coast Basin with 12.6 MMT CO2e, the San Juan Basin with 10.1 MMT CO2e, the Anadarko Basin with 9.2 MMT CO2e, and the Permian Basin with 9.2 MMT CO2e. Emission Source in Detail: Gas Well Completions and Workovers with Hydraulic Fracturing The data reported to the GHGRP includes gas well completions and workovers with hydraulic fracturing. In the hydraulic fracturing process, a mixture of water, chemicals and a “proppant” (usually sand) is pumped into a well at high pressures to fracture rock and allow natural gas to escape. During a stage of well completion known as “flowback,” fracturing fluids, water, and reservoir gas come to the surface at a high velocity and volume. Specialized equipment can be employed that separates natural gas from the backflow, known as a “Reduced Emission Completion” (REC) or “green completion”. The GHGRP provides facilities options for calculating emissions for gas well completions and workovers with hydraulic fracturing. Facilities may measure or estimate the backflow rate in order to report emissions using an engineering calculation. Alternatively, the backflow vent or flare volume may be measured directly. The EPA received information on gas well completions and workovers with hydraulic fracturing from 174 onshore production facilities. There were 40 facilities that reported using BAMM to calculate emissions from the gas well completions and workovers emissions source. The total reported emissions for gas well completions and workovers with hydraulic fracturing were 2.9 MMT CO2e. Reported CO2 emissions were 1.3 MMT CO2e and reported CH4 emissions were 1.6 MMT CO2e. Emissions were reported by GHG for flaring and venting activities. Facilities were also required to report the total count of completions and workovers. In addition, facilities provided a count of the number of completions or workovers employing purposely designed equipment that separates natural gas from the backflow (RECs).
1
5 4
10
25
2 3
4 1 2
9 2
24
0 5 10 15 20 25 30
Gas Well Compl. and Work. with HF Pneumatic Pumps Liquids Unloading Other Flare Stacks
Atmospheric Tanks Misc Equipment Leaks
Associated Gas Venting and Flaring Pneumatic Devices
Combustion Equipment
Emissions, MMT CO2e
Figure 7: 2013 Onshore Production: Top Reported Emission Sources
CO₂ Emissions CH₄ Emissions N₂O Emissions
9

2011-2012-2013 GHGRP Industrial Profiles Petroleum and Natural Gas Systems
The table below shows reported activity data and emissions nationally for gas well completions and workovers with hydraulic fracturing. Data collected by the GHGRP also allows for county-level analysis of reported data. As noted earlier, when reviewing the data it is important to be aware of the GHGRP reporting requirements and the impacts of these requirements on the reported data. For example, the GHGRP covers a subset of national emissions and there is variability in the methods used in calculating emissions and some reporters used BAMM.
Table 2: 2013 Reported Emissions from Gas Well Completions and Workovers with Hydraulic Fracturing
Activity Total
Number Number of RECs
Reported Venting CO2 Emissions (MT CO2e)
Reported Venting CH4
Emissions (MT CO2e)
Reported Flaring CO2 Emissions (MT CO2e)
Reported Flaring CH4 Emissions (MT CO2e)
Total Reported Emissions (MT CO2e)
Gas Well Completions
with Hydraulic Fracturing
7,053 4,961 3,976 1,367,592 1,330,722 184,495 2,887,546
Gas Well Workovers with
Hydraulic Fracturing
732 312 136 36,607 10,525 1,556 48,831
Total 7,785 5,273 4,112 1,404,198 1,341,247 186,051 2,936,377 Emission Source in Detail: Liquids Unloading In mature gas wells, the accumulation of fluids in the well can impede and sometimes halt gas production. Liquids unloading is the process by which liquids are removed from the well through venting, the use of plunger lift systems, or other remedial treatments. The liquids unloading source within the GHGRP covers emissions from facilities that have wells that are venting or using plunger lifts. A total of 255 facilities reported emissions for well venting for liquids unloading in onshore production. Of these facilities 32 reported using BAMM to calculate emissions. Total reported emissions for liquids unloading were 4.4 MMT CO2e. Facilities were given the option between three methods for calculating emissions from liquids unloading. The first calculation method involved using a representative well sample to calculate emissions for both wells with and without plunger lifts. The second and third calculation methods provided engineering equations for wells without plunger lifts and with plunger lifts, respectively. The following table shows total activity count and reported emissions for the different calculation methods.
10

2011-2012-2013 GHGRP Industrial Profiles Petroleum and Natural Gas Systems
Table 3: 2013 Reported Emissions from Liquids Unloading
Calculation Method
Number of Wells Venting During
Liquids Unloading
Number of Wells Equipped
With Plunger Lifts
Reported CO2
Emissions (MT CO2e)
Reported CH4
Emissions (MT CO2e)
Total Reported Emissions (MT CO2e)
Method 1: Direct Measurement of Representative Well Sample
4,344 2,404 1,285 111,323 112,608
Method 2: Engineering Calculation for Wells without Plunger Lifts
25,539 N/A 4,407 1,990,894 1,995,300
Method 3: Engineering Calculation for Wells with Plunger Lifts
25,610 25,610 3,904 2,333,021 2,336,925
Total 55,493 28,014 9,596 4,435,237 4,444,833 Offshore Production The EPA received annual reports from 107 facilities in the offshore production segment and reported emissions totaled 6.2 MMT CO2e. Methane emissions totaled 1.5 MMT CO2e and carbon dioxide emissions totaled 4.7 MMT CO2e. For offshore production, facilities calculate process emissions using requirements that were established by the Bureau of Ocean Energy Management (BOEM). In addition, the GHGRP collects data on combustion emissions. The full list of process emission sources is extensive, but can generally be categorized into vented emissions, flaring and equipment leaks. The top reported source of emissions for offshore production was from combustion (4.4 MMT CO2e), followed by venting (1.0 MMT CO2e), equipment leaks (0.5 MMT CO2e), and flaring (0.4 MMT CO2e).
Natural Gas Processing The EPA received annual reports from 433 facilities in the natural gas processing segment and reported emissions totaled 59 MMT CO2e. Methane emissions totaled 3.6 MMT CO2e and carbon dioxide emissions totaled 55.4 MMT CO2e. The top reported emission sources were combustion equipment (38.4 MMT CO2e), acid gas removal units (13.1 MMT CO2e), and other flare stacks (3.6
4
1
0.0 1.0 2.0 3.0 4.0 5.0
Flaring
Equipment Leaks
Venting
Combustion
Emissions, MMT CO2e
Figure 8: 2013 Offshore Production: Top Reported Emission Sources
CO₂ Emissions CH₄ Emissions N₂O Emissions
11

2011-2012-2013 GHGRP Industrial Profiles Petroleum and Natural Gas Systems
MMT CO2e). Emissions from the three top reported sources were primarily in the form of CO2. Emissions from compressors were the top reported source of methane emissions, but reported emissions from reciprocating compressors (1.5 MMT CO2e) and centrifugal compressors (0.5 MMT CO2e) were smaller than the three top reported sources from this segment.
Natural Gas Transmission The EPA received annual reports from 487 facilities in the natural gas transmission segment and reported emissions totaled 23.0 MMT CO2e. Methane emissions totaled 4.5 MMT CO2e and carbon dioxide emissions totaled 18.1 MMT CO2e. Combustion emissions (18.1 MMT CO2e) were larger than process emissions. Following combustion equipment, the top reported emission sources were reciprocating compressors (2.0 MMT CO2e) and blowdown vent stacks (1.3MMT CO2e).
3 13
38
0 10 20 30 40 50
Misc Equipment Leaks Centrifugal Compressors
Blowdown Vent Stacks Dehydrators
Reciprocating Compressors Other Flare Stacks
Acid Gas Removal Units Combustion Equipment
Emissions, MMT CO2e
Figure 9: 2013 Natural Gas Processing: Top Reported Emission Sources
CO₂ Emissions CH₄ Emissions N₂O Emissions
18
1
2
0 5 10 15 20
Transmission Tanks
Pneumatic Devices
Misc Equipment Leaks
Centrifugal Compressors
Blowdown Vent Stacks
Reciprocating Compressors
Combustion Equipment
Emissions, MMT CO2e
Figure 10: 2013 Natural Gas Transmission: Top Reported Emission Sources
CO₂ Emissions
CH₄ Emissions
N₂O Emissions
12

2011-2012-2013 GHGRP Industrial Profiles Petroleum and Natural Gas Systems
Underground Natural Gas Storage The EPA received annual reports from 48 facilities in the underground natural gas storage segment and reported emissions totaled 1.3 MMT CO2e. Methane emissions totaled 0.5 MMT CO2e and carbon dioxide emissions totaled 0.9 MMT CO2e. Combustion equipment (0.9 MMT CO2e) was the top reported source of emissions for underground natural gas storage, followed by reciprocating compressors (0.3 MMT CO2e).
Emission Source in Detail: Compressors Compressors are used in the production, processing, transmission, and storage segments to keep pipelines at a high enough pressure so natural gas will continue flowing through the pipelines. The two primary types of compressors in use in the petroleum and natural gas industry are reciprocating compressors and centrifugal compressors. Compressors are a large source of combustion emissions in Petroleum and Natural Gas Systems, and combustion emissions for Petroleum and Natural Gas Systems were presented earlier in this document. Compressors can also be a source of process emissions. The primary source of process emissions from compressors are from leaks in rod packing (reciprocating compressors), emissions from wet or dry seals (centrifugal compressors), emissions from blowdown vents, and emissions from isolation valve leakage. The source of emissions may vary based on the mode of operation that the compressor is in. A compressor in operating mode may have different emissions from a compressor in a shutdown depressurized mode. Because the emissions are from seal leakage, even compressors of the same manufacture can have different emissions based on the quality of the compressor seals. Emissions can be mitigated through rigorous maintenance practices and leak surveys, routing emissions to a flare, or capturing emissions. Total reported compressor emissions from all industry segments were 5.7 MMT CO2e. Reported carbon dioxide emissions were 0.1 MMT CO2e and reported methane emissions were 5.6 MMT CO2e. The calculation method varied by industry segment. Emissions from compressors in onshore production were calculated by using population counts multiplied by an emission factor and accounted for 0.7 MMT CO2e of reported emissions. Emissions from compressors in the other industry segment were calculated by the use of direct measurement.
0.0 0.2 0.4 0.6 0.8 1.0
Centrifugal Compressors Misc Equipment Leaks
Pneumatic Devices Reciprocating Compressors
Combustion Equipment
Emissions, MMT CO2e
Figure 11: 2013 Underground Natural Gas Storage: Top Reported Emission Sources
CO₂ Emissions CH₄ Emissions N₂O Emissions
13

2011-2012-2013 GHGRP Industrial Profiles Petroleum and Natural Gas Systems
The table below shows activity data and emissions for reciprocating compressors by industry segment (excluding onshore production which used population counts). The EPA received data from 4,986 reciprocating compressors, including 2,518 reciprocating compressors in natural gas processing, 2,111 reciprocating compressors in natural gas transmission, and 318 reciprocating compressors in underground natural gas storage. Of these reciprocating compressors, 1,779 reported using BAMM to calculate emissions, including 881 in natural gas processing, 814 in natural gas transmission, and 73 in underground natural gas storage.
Table 4: 2013 Reported Process Emissions from Reciprocating Compressors in Natural Gas Processing, Natural Gas Transmission, Underground Natural Gas Storage, LNG
Import/Export, and LNG Storage
Industry Segment
Total Number of
Reciprocating Compressors
Number of Reciprocating Compressors
that used BAMM
Reported CO2
Emissions (MT CO2e)
Reported CH4
Emissions (MT CO2e)
Total Reported Process
Emissions (MT CO2e)
Natural Gas Processing 2,518 881 97,089 1,471,562 1,568,710
Natural Gas Transmission 2,111 814 29,999 1,989,781 2,019,796
Underground Natural Gas Storage
318 73 299 257,845 258,144
LNG Import/Export 26 11 9 18,964 18,975
LNG Storage 11 0 71 619 691 Total 4,984 1,779 127,467 3,738,773 3,866,315
The table below shows activity data and emissions for centrifugal compressors by industry segment. For centrifugal compressors the number of compressors with wet seals is also shown. Overall emissions from centrifugal compressors were lower than those for reciprocating compressors, but the total number of reported compressors was lower as well. The EPA received data from 1,288 centrifugal compressors, including 460 centrifugal compressors in natural gas processing, 779 centrifugal compressors in natural gas transmission, and 34 centrifugal compressors in underground natural gas storage. Of these centrifugal compressors, 574 reported using BAMM to calculate emissions, including 232 in natural gas processing, 321 in natural gas transmission, and 9 in underground natural gas storage.
14

2011-2012-2013 GHGRP Industrial Profiles Petroleum and Natural Gas Systems
Table 5: 2013 Reported Process Emissions from Centrifugal Compressors in Natural Gas
Processing, Natural Gas Transmission, Underground Natural Gas Storage, LNG Import/Export, and LNG Storage
Industry Segment
Total Number of Centrifugal Compressors
Number of Centrifugal
Compressors that used
BAMM
Number of Centrifugal
Compressors with Wet
Seals
Reported CO2
Emissions (MT
CO2e)
Reported CH4
Emissions (MT CO2e)
Total Reported Process
Emissions (MT CO2e)
Natural Gas Processing 460 232 278 15,104 475,878 491,104
Natural Gas Transmission 779 321 310 678 568,300 568,981
Underground Natural Gas Storage
34 9 20 36 29,415 29,451
LNG Import/Export 13 12 4 41 38,780 38,821
LNG Storage 2 0 2 0 0 0
Total 1,288 574 614 15,860 1,112,372 1,128,357 Natural Gas Distribution The EPA received annual reports from 173 facilities in the natural gas distribution segment and reported emissions totaled 15.1 MMT CO2e. Methane emissions totaled 14.8 MMT CO2e and carbon dioxide emissions totaled 0.3 MMT CO2e. For the natural gas distribution segment, combustion emissions (0.3 MMT CO2e) were relatively lower compared to other industry segments. The primary sources of emission for natural gas distribution were distribution mains (9.1 MMT CO2e) and distribution services (4.4 MMT CO2e), which are caused by natural gas equipment leaks and calculated by multiplying population counts by default emission factors that are specific to pipe material.
1
4
9
0 2 4 6 8 10
Misc Equipment Leaks
Combustion Equipment
Distribution Metering-Regulating Stations
Distribution Services
Distribution Mains
Emissions, MMT CO2e
Figure 12: 2013 Natural Gas Distribution: Top Reported Emission Sources
CO₂ Emissions CH₄ Emissions N₂O Emissions
15

2011-2012-2013 GHGRP Industrial Profiles Petroleum and Natural Gas Systems
LNG Import/Export The EPA received emission reports from 8 LNG import/export terminals and reported emissions totaled 0.4 MMT CO2e. Methane emissions totaled 0.1 MMT CO2e and carbon dioxide emissions totaled 0.3 MMT CO2e. The top reported source of emissions was combustion equipment (0.3 MMT CO2e), followed by centrifugal compressors (0.04 MMT CO2e), reciprocating compressors (0.02 MMT CO2e), and equipment leaks (0.01 MMT CO2e).
LNG Storage LNG storage had the fewest number of facilities of the industry segments that comprise Petroleum and Natural Gas Systems, with 5 facilities reporting. Total reported emissions from LNG storage were 0.03 MMT CO2e. Combustion equipment (0.02 MMT CO2e) was the top reported source of emissions, followed by equipment leaks (0.01 MMT CO2e).
0.0 0.1 0.2 0.3 0.4
Blowdown Vent Stacks
Misc Equipment Leaks
Reciprocating Compressors
Centrifugal Compressors
Combustion Equipment
Emissions, MMT CO2e
Figure 13: 2013 LNG Import/Export: Top Reported Emission Sources
CO₂ Emissions CH₄ Emissions N₂O Emissions
0.00 0.01 0.02 0.03
Reciprocating Compressors
Misc Equipment Leaks
Combustion Equipment
Emissions, MMT CO2e
Figure 14: 2013 LNG Storage: Top Reported Emission Sources
CO₂ Emissions CH₄ Emissions N₂O Emissions
16

2011-2012-2013 GHGRP Industrial Profiles Petroleum and Natural Gas Systems
Changes from 2011 to 2013 The following section describes changes between the reported data for the 2011 through 2013 calendar years for Petroleum and Natural Gas Systems. The EPA received resubmissions of 2011 and 2012 data from certain facilities and the resubmitted 2011 and 2012 data is reflected below. Changes in Number of Facilities From 2011 to 2013, the number of facilities in Petroleum and Natural Gas Systems increased from 1,913 facilities to 2,162 facilities. The largest increases occurred in natural gas transmission (62), and natural gas processing (59), onshore production (45). The increased number of facilities is primarily a result of facilities triggering the 25,000 metric ton CO2e reporting threshold. Emissions can be variable in the Petroleum and Natural Gas Systems sector and it is not unexpected that emissions for a facility may go above 25,000 metric tons CO2e in a given year. Once the reporting threshold is triggered, facilities must report to the GHGRP until emissions are below the threshold for a period of time specified in the regulations, or until all emission sources at a facility cease operation. As a result, the number of facilities reporting to the GHGRP may vary from year to year.
Table 6: Changes in Number of Facilities by Industry Segment: 2011 to 2013
Industry Segment 2011
Number of Facilities
2012 Number of Facilities
2013 Number of Facilities
2012-13 Change in Number of Facilities
2011-13 Change in Number of Facilities
Onshore Production 458 502 503 1 45 Offshore Production 99 106 107 1 8 Natural Gas Processing 374 396 433 37 59 Natural Gas Transmission 425 460 487 27 62 Underground Natural Gas Storage 45 49 48 -1 3
Natural Gas Distribution 179 181 173 -8 -6 LNG Import/Export 8 8 8 0 0 LNG Storage 6 5 5 0 -1 Other Oil and Gas Combustion 340 384 415 31 75 Total 1,913 2,074 2,164 90 251 Changes in Reported Emissions Total reported emissions slightly increased from 2011 to 2013. The largest increases occurred in onshore production (2.2 MMT CO2e) and other oil and gas combustion (1.7 MMT CO2e). The largest decreases were seen in natural gas transmission (-1.5 MMT CO2e) and natural gas distribution (-1.4 MMT CO2e).
17

2011-2012-2013 GHGRP Industrial Profiles Petroleum and Natural Gas Systems
Table 7: Changes in Reported Emissions by Industry Segment: 2011 to 2013
Industry Segment
2011 Reported Emissions
(MMT CO2e)
2012 Reported Emissions
(MMT CO2e)
2013 Reported Emissions
(MMT CO2e)
2012-13 Change in Reported Emissions
(MMT CO2e)
2011-13 Change in Reported Emissions
(MMT CO2e) Onshore Production 92 93 95 1.5 2.2 Offshore Production 7 7 6 -0.5 -0.4 Natural Gas Processing 58 60 59 -1.5 0.2
Natural Gas Transmission 24 24 23 -0.9 -1.5
Underground Natural Gas Storage 1 1 1 -0.1 -0.2
Natural Gas Distribution 17 16 15 -0.5 -1.4
LNG Import/Export 1 1 < 1 -0.3 -0.4 LNG Storage < 1 < 1 < 1 0.0 0.0 Other Oil and Gas Combustion 23 25 25 0.0 1.7
Total 223 226 224 -2.3 0.2 Emission changes may not solely be due to the change in the number of facilities, and could be the result of a number of factors, such as operational changes (e.g. increased flaring), calculation changes (e.g. reduced BAMM use), and changes in the regulatory landscape. Changes in BAMM Use There was a decrease in the number of facilities using BAMM between 2011 and 2013. The number of facilities reporting BAMM use decreased from 1,053 facilities in 2011 to 515 facilities in 2013.
Table 8: Changes in BAMM Use by Industry Segment: 2011 to 2013
Industry Segment 2011 BAMM Use
2012 BAMM Use
2013 BAMM Use
2012-2013 Change in BAMM Use
2011-2013 Change in BAMM Use
Onshore Production 73% 44% 15% -66% -78% Offshore Production 15% 4% 0% -100% -100% Natural Gas Processing 84% 53% 47% -3% -36% Natural Gas Transmission 71% 45% 45% 6% -26% Underground Natural Gas Storage 56% 35% 27% -24% -48%
Natural Gas Distribution 34% 12% 2% -86% -95% LNG Import/Export 50% 25% 38% 50% -25% LNG Storage 50% 20% 20% 0% -67% Other Oil and Gas Combustion 0% 0% 0% 0% 0%
Total 55% 33% 24% -24% -51%
18

2011-2012-2013 GHGRP Industrial Profiles Petroleum and Natural Gas Systems
Changes in Reported Emissions by Emission Source
The change in emissions from 2011 to 2013 is not attributable to any individual emission source. Several sources saw increased emissions, including combustion equipment (3.6 MMT CO2e), associated gas venting and flaring (3.5 MMT CO2e), pneumatic devices (3.3 MMT CO2e), and other flare stacks (3.0 MMT CO2e). Other sources saw decreased emissions. For gas well completions and workovers with hydraulic fracturing, total reported emissions decreased by 5.9 MMT CO2e (including a decrease in reported methane emissions of 4.2 MMT CO2e). Overall, reported methane emissions from Petroleum and Natural Gas Systems have decreased by 12 percent since 2011, with the largest methane reductions coming from gas well completions and workovers with hydraulic fracturing which have decreased by 73 percent.
Table 9: Changes in Reported Emissions by Emission Source: 2011 to 2013
Emission Source
2011 Reported Emissions
(MMT CO2e)
2012 Reported Emissions
(MMT CO2e)
2013 Reported Emissions
(MMT CO2e)
2012-13 Change in Reported Emissions
(MMT CO2e)
2011-13 Change in Reported Emissions
(MMT CO2e)
Combustion Equipment 108.8 111.4 112.4 1.0 3.6 Associated Gas Venting and Flaring 8.1 11.0 11.6 0.6 3.5 Pneumatic Devices 21.4 22.4 24.7 2.4 3.3 Other Flare Stacks 5.8 8.2 8.8 0.7 3.0 Atmospheric Tanks 4.2 5.6 6.1 0.5 1.9 Distribution Metering-Regulating Stations 0.8 0.9 1.3 0.4 0.5
Blowdown Vent Stacks 1.5 2.4 2.0 -0.4 0.5 Reciprocating Compressors 3.7 3.5 4.0 0.5 0.3 Well Testing 0.8 0.7 0.9 0.2 0.1 Pneumatic Pumps 3.0 3.4 3.1 -0.3 0.1 Enhanced Oil Recovery Pumps < 0.1 < 0.1 < 0.1 0.0 0.0 Enhanced Oil Recovery Liquids < 0.1 < 0.1 < 0.1 0.0 0.0 Transmission Tanks 0.1 0.1 0.1 0.0 0.0 Offshore Sources 2.2 2.0 1.8 -0.2 -0.4 Centrifugal Compressors 2.1 2.5 1.7 -0.7 -0.4 Dehydrators 1.9 1.6 1.5 -0.1 -0.4 Gas Well Completions and Workovers without Hydraulic Fracturing
0.8 0.2 0.1 -0.1 -0.7
Distribution Services 5.2 4.8 4.4 -0.4 -0.8 Distribution Mains 10.2 9.7 9.1 -0.6 -1.1 Misc Equipment Leaks 10.7 9.8 9.6 -0.3 -1.1 Acid Gas Removal Units 15.9 15.4 13.2 -2.2 -2.7 Liquids Unloading 7.4 6.0 4.4 -1.5 -2.9 Gas Well Completions and Workovers with Hydraulic Fracturing
8.9 4.6 2.9 -1.6 -5.9
19

2011-2012-2013 GHGRP Industrial Profiles Petroleum and Natural Gas Systems
Additional Information Access GHGRP data: http://www.epa.gov/ghgreporting/ Additional information about Petroleum and Natural Gas Systems in the GHGRP, including reporting requirements and calculation methods: http://www.epa.gov/ghgreporting/reporters/subpart/w.html
20