Petra Ahrweiler Improving Innovation Process
33
IMPROVING THE INNOVATION PROCESS WITH THE FIRM NEW INSIGHTS AND METHODS Masterclass Prof. Dr. Petra Ahrweiler Innovation Lab Johannes Gutenberg University Mainz (JGU), Germany EA European Academy 1
Transcript of Petra Ahrweiler Improving Innovation Process

IMPROVING THE INNOVATION PROCESS WITH THE FIRM
NEW INSIGHTS AND METHODS Masterclass
Prof. Dr. Petra Ahrweiler Innovation Lab
Johannes Gutenberg University Mainz (JGU), Germany
EA European Academy
1

Contents
• Introduction
• Interactive session 1: Science Cafe „Utility of new methods“ • Table 1: If I had a “computer dummy” of my organisation in an artificial world: what would I let it do and try out?
• Table 2: What are the “unknown unknowns” in the innovation network of my organisation, and what would be the benefit to get reliable information about them?
• Table 3: What would be the exact added-value for my organisation in using these new methodologies?
• Table 4: What can the new methodologies offer to address the top-5questions for future development of my organisation?
• Interim summary and lecturer input
• Interactive session 2: Method Lab „Hands-on“ • Social Network Analysis
• ABM and Netlogo
• To take home
2

Lead question for the Science Cafe Whatis the utility of the new methodologies for the future developmentof my organisation?
• With the new simulation methodologies counterfactual analysis is possible
• offering a benchmark including measurable indicators for impact assessment of managerial interventions
• offering a tool for „changing history“ (backward counterfactual analysis) and for „looking into the future“ (forward counterfactual analysis)
• exploring what-if questions
3

Additional table questions 10min per table (40 min)
• Table 1: If I had a “computer dummy” of my organisation in an artificial world: what would I let it do and try out?
• Table 2: What are the “unknown unknowns” in the innovation network of my organisation, and what would be the benefit to get reliable information about them?
• Table 3: What would be the exact added-value for my organisation in using these new methodologies?
• Table 4: What can the new methodologies offer to address the top-5 questions for future development of my organisation?
4

World cafe methodology
• We need 4 volunteers as chairs (chairs are staying at their table updating new people to what was said so far, keeping time, and introducing their table paper)
• Please distribute equally at tables (chairs write the table question on the paper)
• First round: Please scribble down your ideas how to address the table question; then start discussing your ideas; everybody can make notes on the paper, after 10 min change table
• All following rounds: chairs update newcomers about existing notes and past discussions, otherwise same as first round
• After last round: chairs introduce their table notes in plenum for general discussion
• Moderator collects aspects for answering the lead question: What is the utility of the new methodologies for the future development of my organisation?
5

Counterfactual analysis has ambitious methodological requirements
• An adequate empirical description of the situation as it is now as a benchmark -including measurable indicators you are interested in
• while repeating the history which produced the situation if you are especially interested in changing the history to see what happens
• and with an endless-trap scenario where nothing ever happens if you are especially interested in evaluating potential futures experimenting with different interventions
• How complex, laborious, costly, time-consuming... is this?
• Can I do it myself to get a feeling for it?
6

How to get:an adequate empirical description of the situation as it is now?
• Empirical research (quantitative and qualitative)
• The description must be detailed enough to give you some causal ideas of what produces/changes your output indicators • Define your output indicators (e.g. revenues from new products and services,
position in the industry etc.)
• Collect empirical data concerning the micro/macro structures and dynamics of your innovation network producing the relevant output indicators
7

Social Network Analysis (SNA)
Here: • Nodes: funded organisations • Links/edges:„having a project with..“
SNA offers an adequate empirical description of the situation as it is now as a benchmark -including measurable indicators
SNA is used to show central actors (hubs) and clusters, analyse and visualise the position and role of particular actor types (e.g. SMEs), look at cohesion and density of networks etc.
8

SNA – some examples to see what we need for it
9
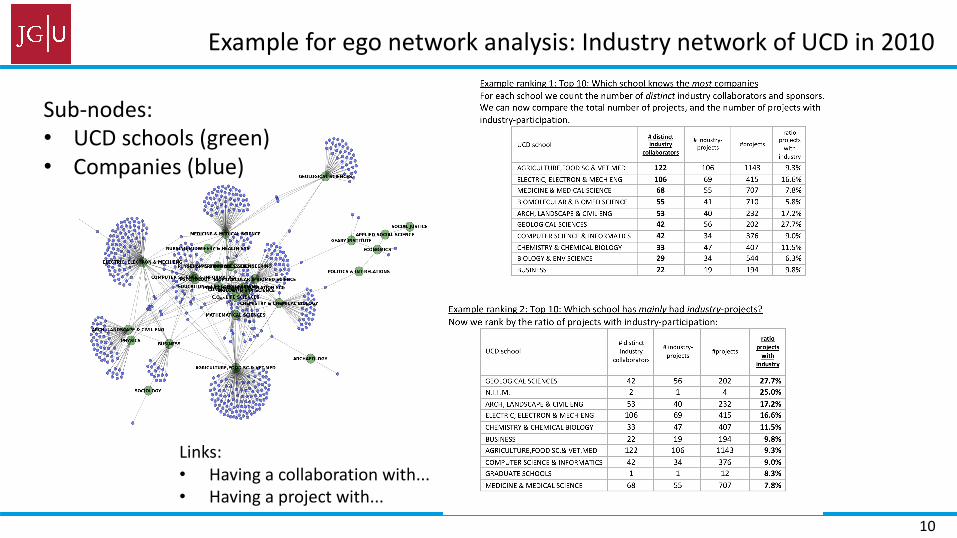
Example for ego network analysis: Industry network of UCD in 2010
Sub-nodes: • UCD schools (green) • Companies (blue)
Links: • Having a collaboration with... • Having a project with...
10

With company names TOP 10
11
A1 A2 A3 A4 A5
A1 - 0 0 1 0
A2 0 - 1 0 0
A3 1 1 - 1 1
A4 0 1 0 - 0
A5 0 0 0 0 -
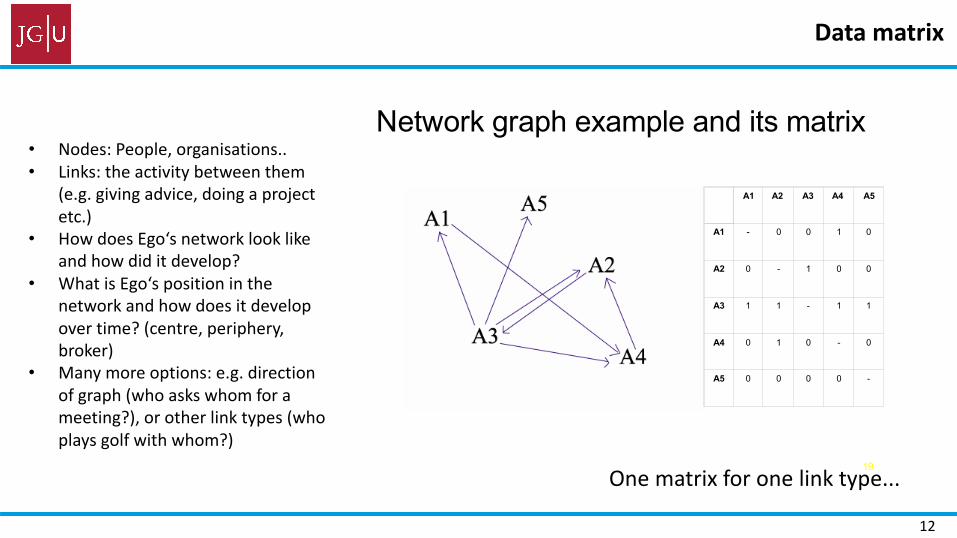
Data matrix
Network graph example and its matrix • Nodes: People, organisations.. • Links: the activity between them
(e.g. giving advice, doing a project etc.)
• How does Ego‘s network look like and how did it develop?
• What is Ego‘s position in the network and how does it develop over time? (centre, periphery, broker)
• Many more options: e.g. direction of graph (who asks whom for a meeting?), or other link types (who plays golf with whom?)
19
One matrix for one link type...
12
This is scalable for a..
• small group (class in school etc.)
• organisation (firm, university, public agency, association etc.)
• cluster (Silicon Valley etc.)
• industry sector (see biotech example following)
• region
• country
• EU....
13

Data format for SNA
Source: Pyka and Saviotti 2000 14

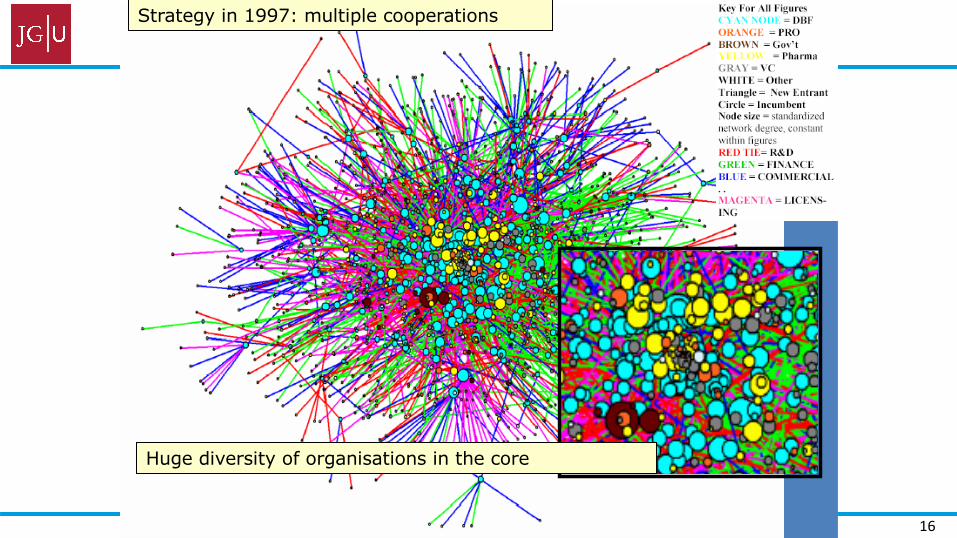
Mapping and SNA
Walter Powell, Stanford
US Biotech industry1985
15
16
Huge diversity of organisations in the core
Strategy in 1997: multiple cooperations

Network measures
• density of the network
• number of components • size of the largest component • average degree
• average distance
• Clustering coefficient • information on small-world properties (short average distance and
high degree of local clustering?) • information on scale-free properties (power law yes/no, degree
distribution of agents?)
17

SNA – hands-on
18

We need
• A database in matrix format
• A program for doing network analysis
• Please try out yourself to work with this!
19
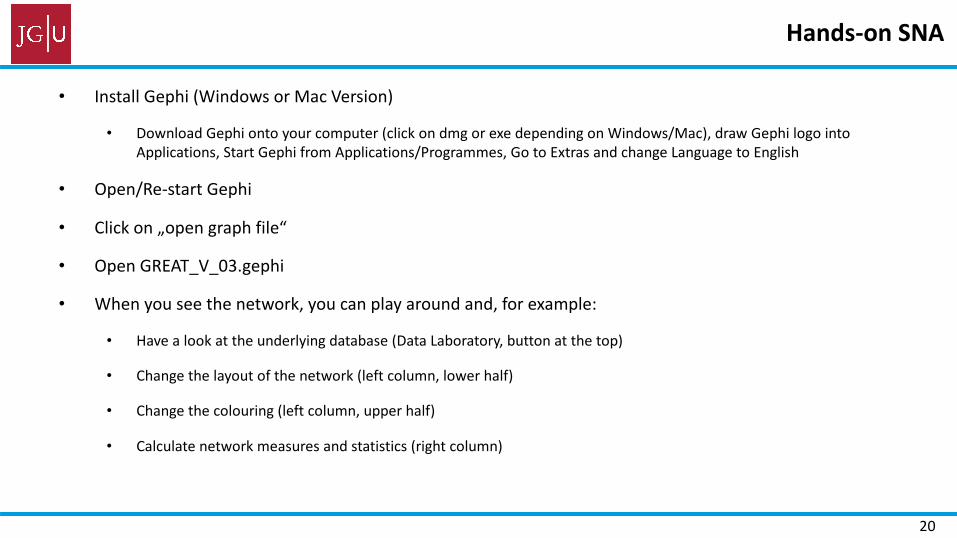
Hands-on SNA
• Install Gephi (Windows or Mac Version)
• Download Gephi onto your computer (click on dmg or exe depending on Windows/Mac), draw Gephi logo into Applications, Start Gephi from Applications/Programmes, Go to Extras and change Language to English
• Open/Re-start Gephi
• Click on „open graph file“
• Open GREAT_V_03.gephi
• When you see the network, you can play around and, for example:
• Have a look at the underlying database (Data Laboratory, button at the top)
• Change the layout of the network (left column, lower half)
• Change the colouring (left column, upper half)
• Calculate network measures and statistics (right column)
20

Counterfactual analysis has ambitious methodological requirements
• With the new simulation methodologies counterfactual analysis is possible • offering a benchmark including measurable indicators for impact
assessment of managerial interventions • offering a tool for „changing history“ (backward counterfactual
analysis) and for „looking into the future“ (forward counterfactual analysis)
• exploring what-if questions • How complex, laborious, costly, time-consuming... is this?
• Can I do it myself to get a feeling for it?
21

ABM – understanding the basics
22

Agent-based Models (ABM)
• Agent-based Modelling is a computational methodology that allows the analyst to create, analyse, and experiment with artificial worlds populated by agents (computer programs) that interact in non-trivial ways.
• Agents are units that have behaviour • They act within a (simulated) environment • Agents can
• react to other agents, • pursue goals, • communicate with other agents, • remember what they have done
• Macro-level features can emerge from the interaction of agents
Schelling model of residential segregation
2 3 23
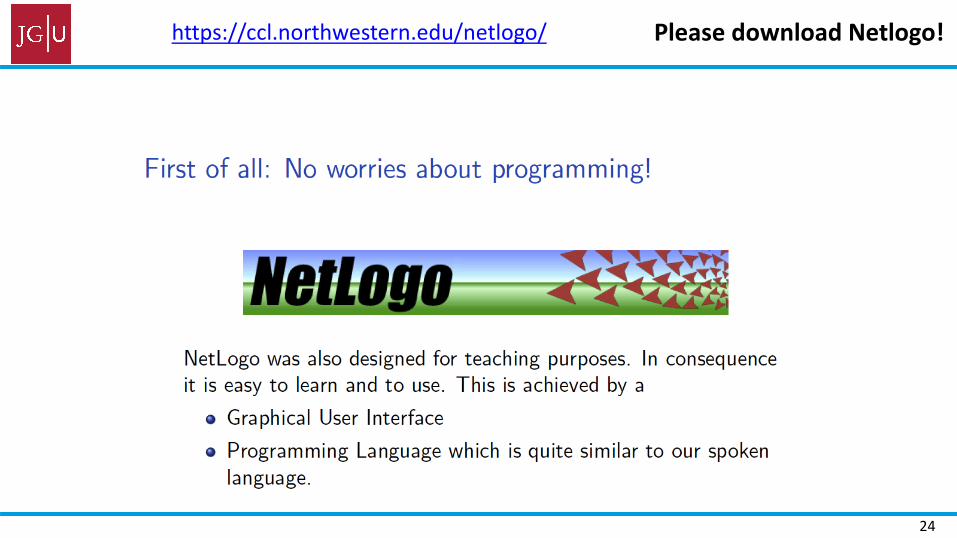
https://ccl.northwestern.edu/netlogo/ Please download Netlogo!
24

ABM – hands-on
25

Hands-on ABM
• Install Netlogo (Windows or Mac Version)
• Open Netlogo
• Go to „File“ and „Models Library“
• Go to „Social Science“ and „Party“
• You see the Netlogo Interface: Go to „Info“ (button at the top) and read what it is
• Go to „Code“: there you see the program (your will see that you can even read it)
• Go back to the Interface
• You can play around and, for example, do what-if counterfactual forward analysis: • Change the number of party guests
• Change the number of tables to stand at
• Change the tolerance level of people
• Do not forget to press „set-up“ and „go“ after you have changed things
26

A tool to change history and to look into the future exploring what-if questions
• Define your evaluative questions (e.g. what if my company increases its open innovation activities:will this improve my innovation performance in the long run?) and your hypotheses („theory of change“)
http://cress.soc.surrey.ac.uk/skinwp/ 2 7 27
Open Source: CC Licence for Basic SKIN model and all SKIN derivates
Free for any public research; For commercial use (tenders, contract research, industry projects etc.), use must be granted and fees apply
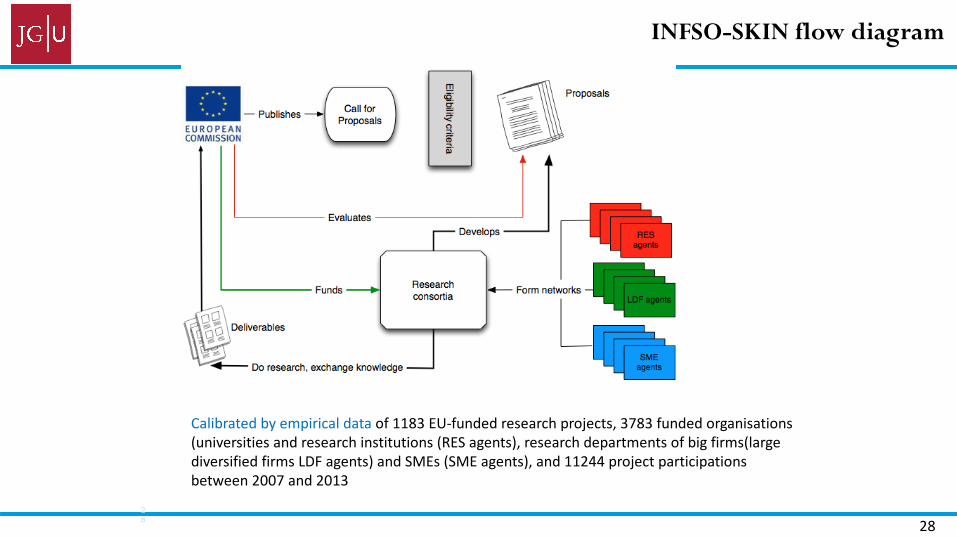
INFSO-SKIN flow diagram
Calibrated by empirical data of 1183EU-funded research projects, 3783 funded organisations (universities and research institutions (RES agents), research departments of big firms(large diversified firms LDF agents) and SMEs (SME agents), and 11244 project participations between 2007 and 2013
2 8 28

Screenshot Interface INFSO-SKIN
29

To take home
30

To take home from SNA
• Data requirements for getting an adequate description of the situation as it is can be high...
• Sometimes SNA is good, sometimes not: it depends on your questions and on your output indicators
• SNA only captured the structural aspects of the innovation landscape.
• Actors, processes and causes producing these structures are invisible between frozen snapshots of two network states following upon each other.
• Managers and strategists are convinced that it would be useful to know about these procedural aspects to find appropriate options and access points for interventions and changes.
• Furthermore, SNA just allows to evaluate the structures produced by certain strategies“ex post”; ex-ante evaluation is only possible in the very limited ways of statistical modelling
• The future is not addressed properly
• However, you can use your status quo analysis as a benchmark…
31

To take home from ABM
• ABM can shed light into the darkness of the future (coping with the challenges of complexity, understanding the dynamics of innovation), identifying potential access points for successful intervention
• Simulation results can inform about likely future effects of managerial interventions • Some of these effects are suprising and counter-intuitive. New knowledge is generated. Complex
contexts are made available and accessible via experimentation. Simulations can help and practice how to deal with them.
• Asking what-if questions (ex-ante evaluation) - an option that is normally not easily available in the management world
• Decision makers can use scenario modelling as a worksite for their ‘reality constructions’ • Experiments can be used to give an indication of the likely effect of a wide variety of management measures • Empirical ‘Un-observables’, such as knowledge flows in innovation or learning of agents, can be measured
32

Thank you for your participation!
33