Peter O'Neill - Making Analytics Valuable MKTFEST 2014
24
one + two + three + four Making Analytics Valuable
-
Upload
marketing-festival -
Category
Business
-
view
546 -
download
0
Transcript of Peter O'Neill - Making Analytics Valuable MKTFEST 2014
one + two + three + four
Making Analytics Valuable

G’day, I’m Peter
@peter_oneill Page 2 1st Nov 2014
Making Analytics Valuable } A lesson learnt over the years –
understand your Audience } You just heard from Avinash } You are inspired } I can’t compete
} Instead of inspiration, I am aiming for immediately actionable
} This is a set of tips to get more impact in less time
1st Nov 2014 @peter_oneill Page 3
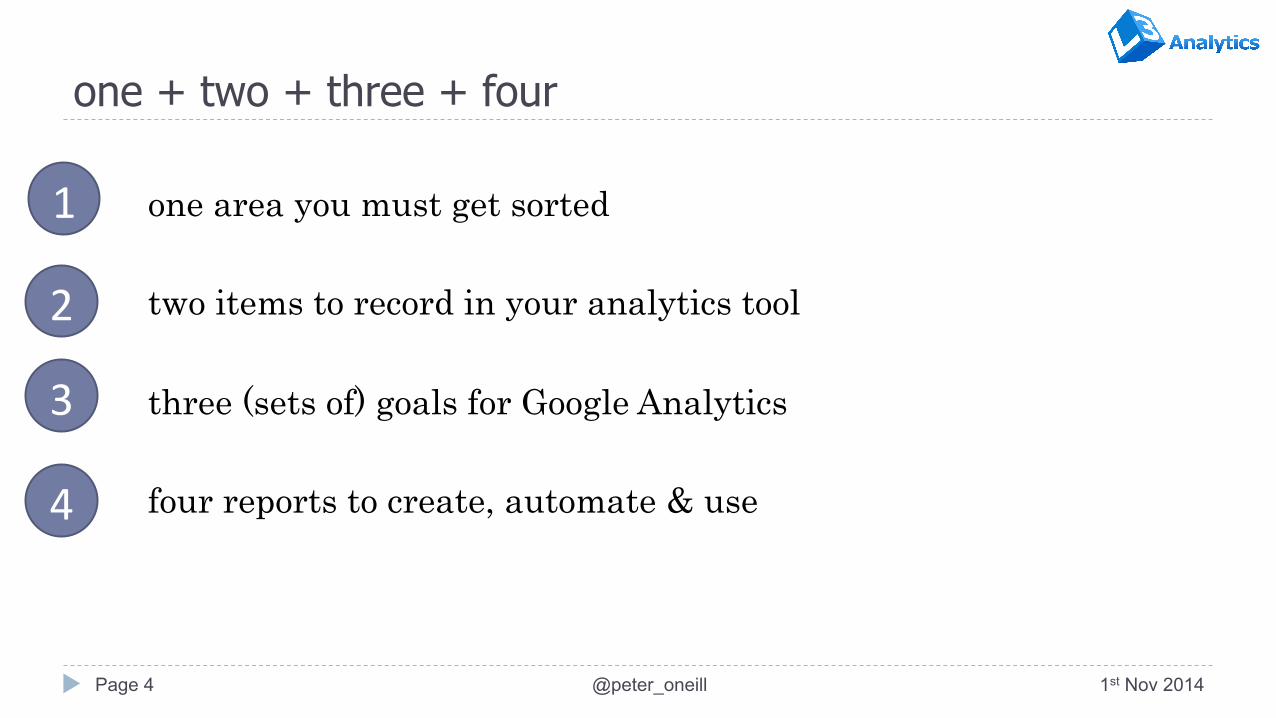
one + two + three + four
one area you must get sorted two items to record in your analytics tool three (sets of) goals for Google Analytics four reports to create, automate & use
1st Nov 2014 @peter_oneill Page 4
1
2
3
4
Page 5
ONE AREA YOU MUST GET SORTED
1st Nov 2014 @peter_oneill
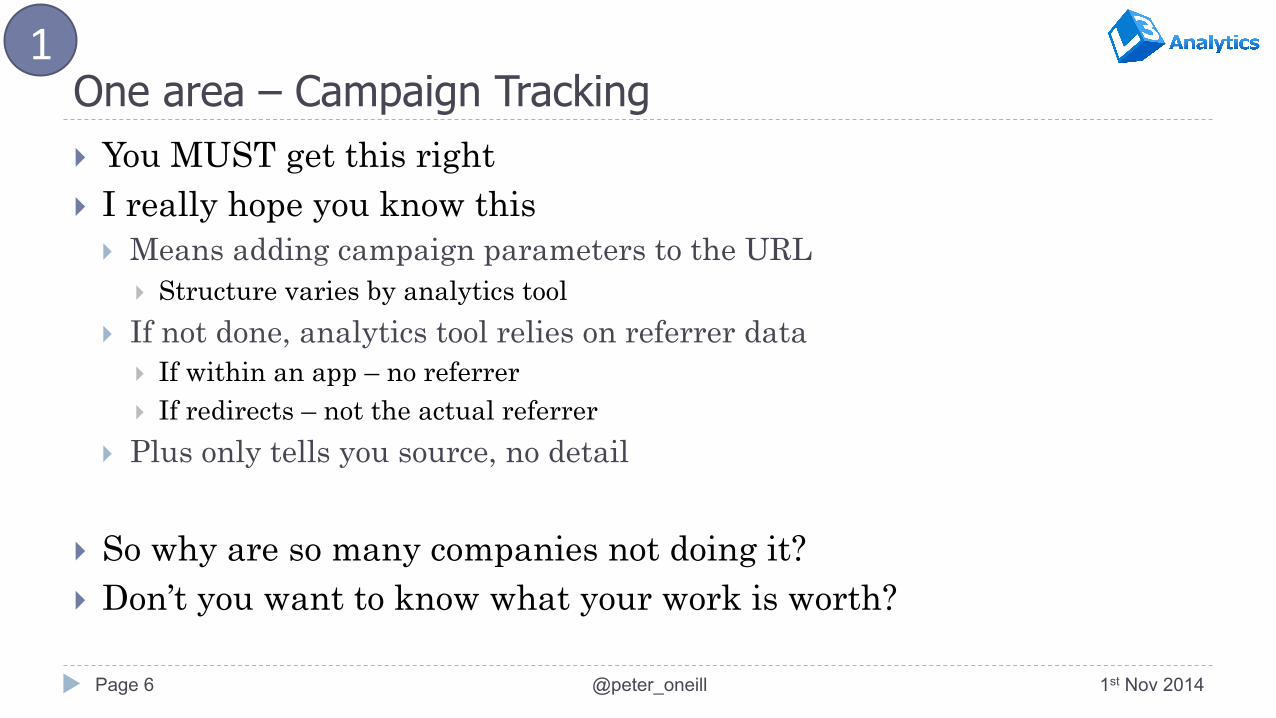
One area – Campaign Tracking } You MUST get this right } I really hope you know this
} Means adding campaign parameters to the URL } Structure varies by analytics tool
} If not done, analytics tool relies on referrer data } If within an app – no referrer } If redirects – not the actual referrer
} Plus only tells you source, no detail
} So why are so many companies not doing it? } Don’t you want to know what your work is worth?
1st Nov 2014 @peter_oneill Page 6
1
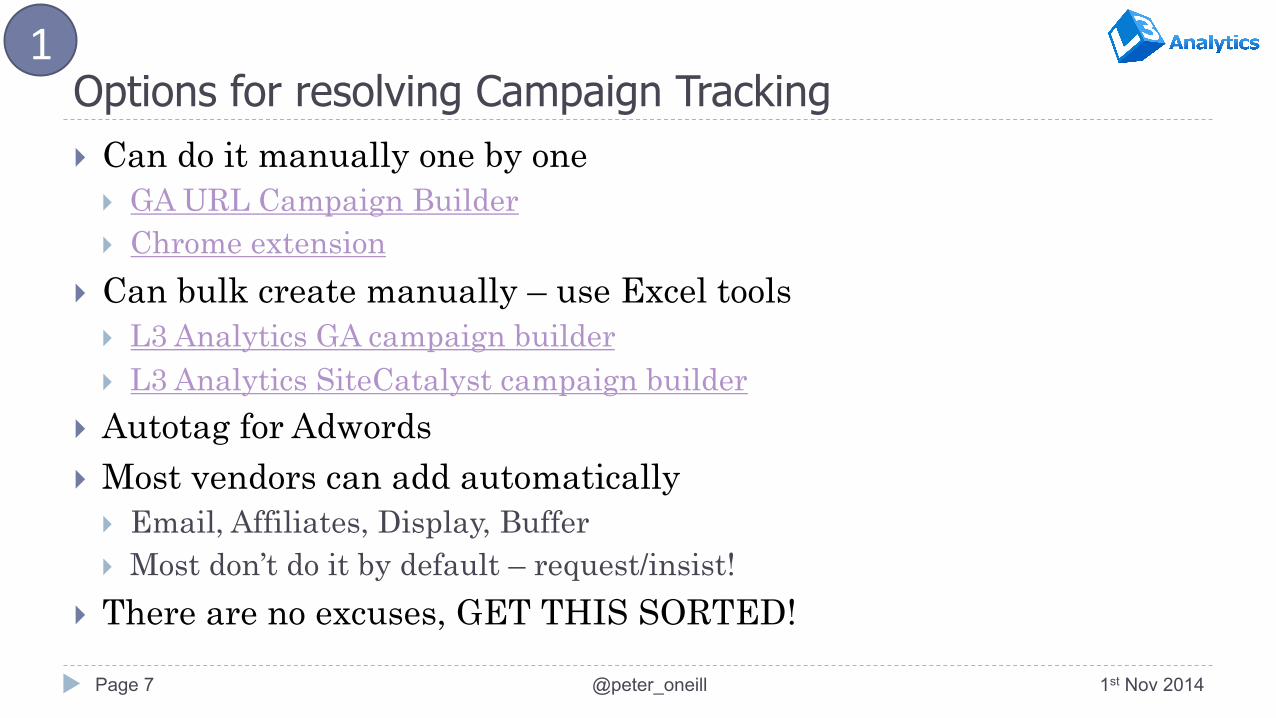
Options for resolving Campaign Tracking } Can do it manually one by one
} GA URL Campaign Builder } Chrome extension
} Can bulk create manually – use Excel tools } L3 Analytics GA campaign builder } L3 Analytics SiteCatalyst campaign builder
} Autotag for Adwords } Most vendors can add automatically
} Email, Affiliates, Display, Buffer } Most don’t do it by default – request/insist!
} There are no excuses, GET THIS SORTED!
1st Nov 2014 @peter_oneill Page 7
1
Page 8
TWO ITEMS TO RECORD IN YOUR ANALYTICS TOOL
1st Nov 2014 @peter_oneill
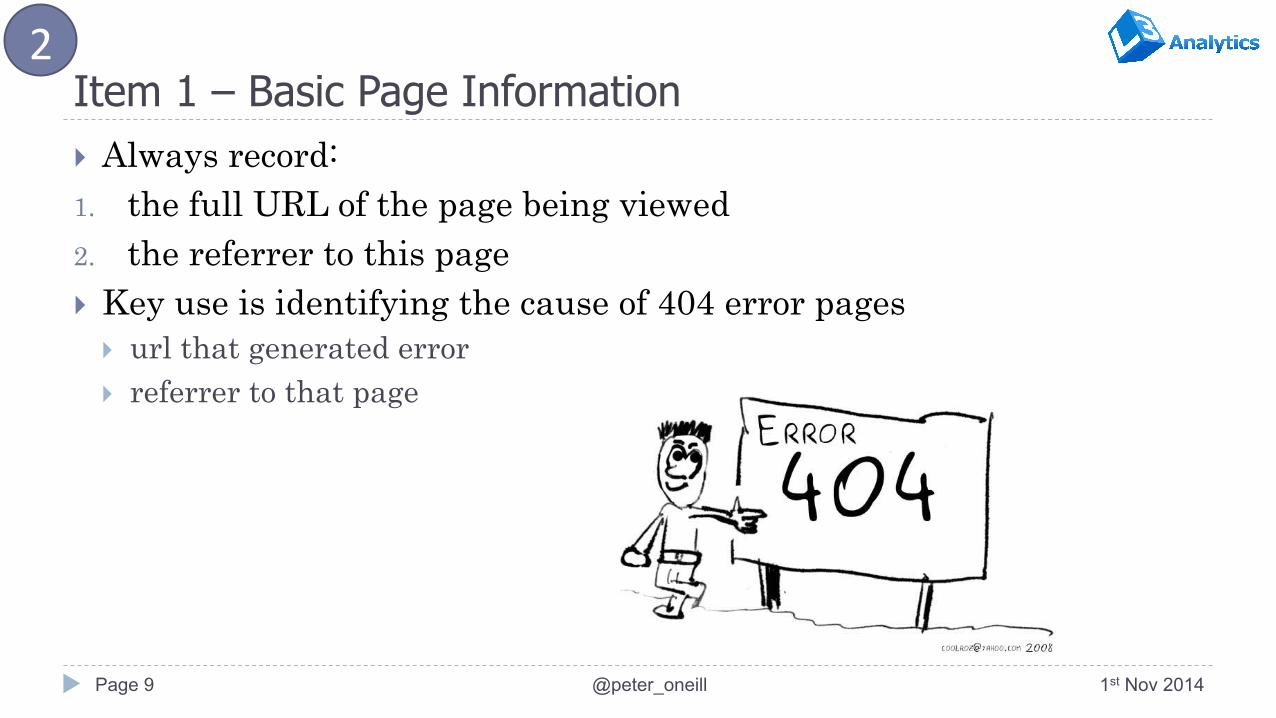
Item 1 – Basic Page Information } Always record: 1. the full URL of the page being viewed 2. the referrer to this page } Key use is identifying the cause of 404 error pages
} url that generated error } referrer to that page
1st Nov 2014 @peter_oneill Page 9
2
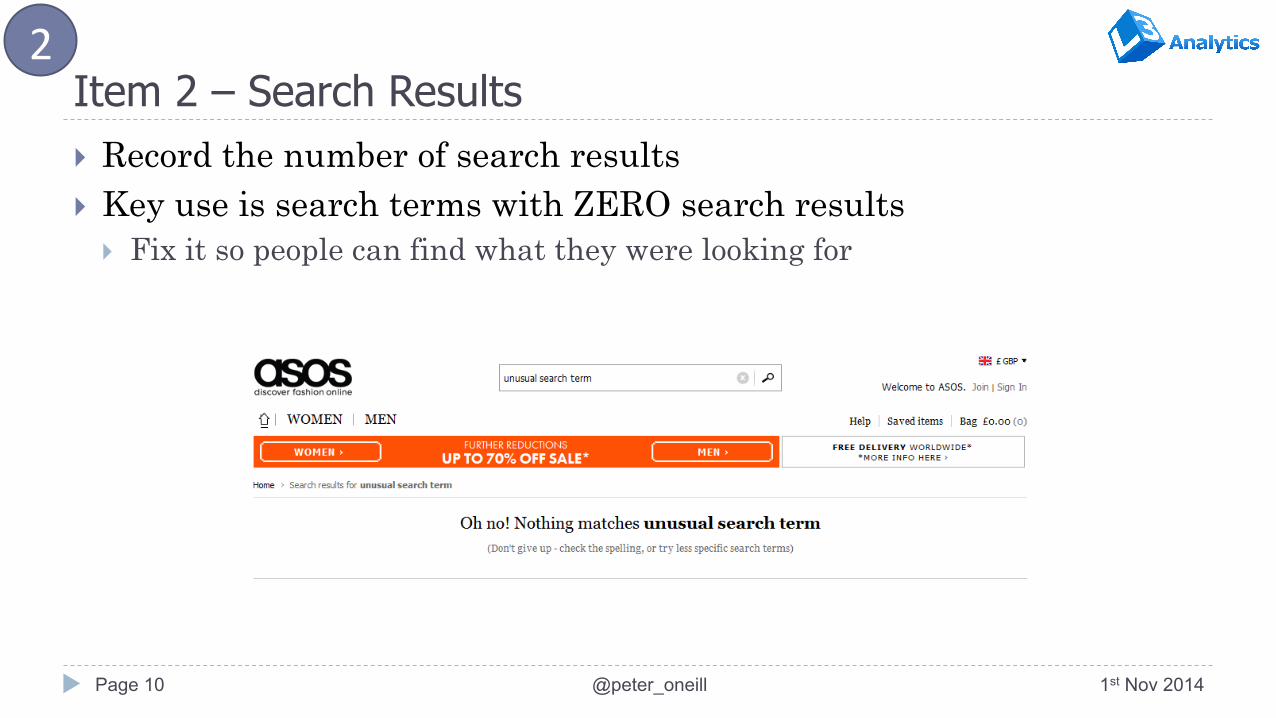
Item 2 – Search Results } Record the number of search results } Key use is search terms with ZERO search results
} Fix it so people can find what they were looking for
1st Nov 2014 @peter_oneill Page 10
2
Page 11
THREE (SETS OF) GOALS FOR GOOGLE ANALYTICS
1st Nov 2014 @peter_oneill
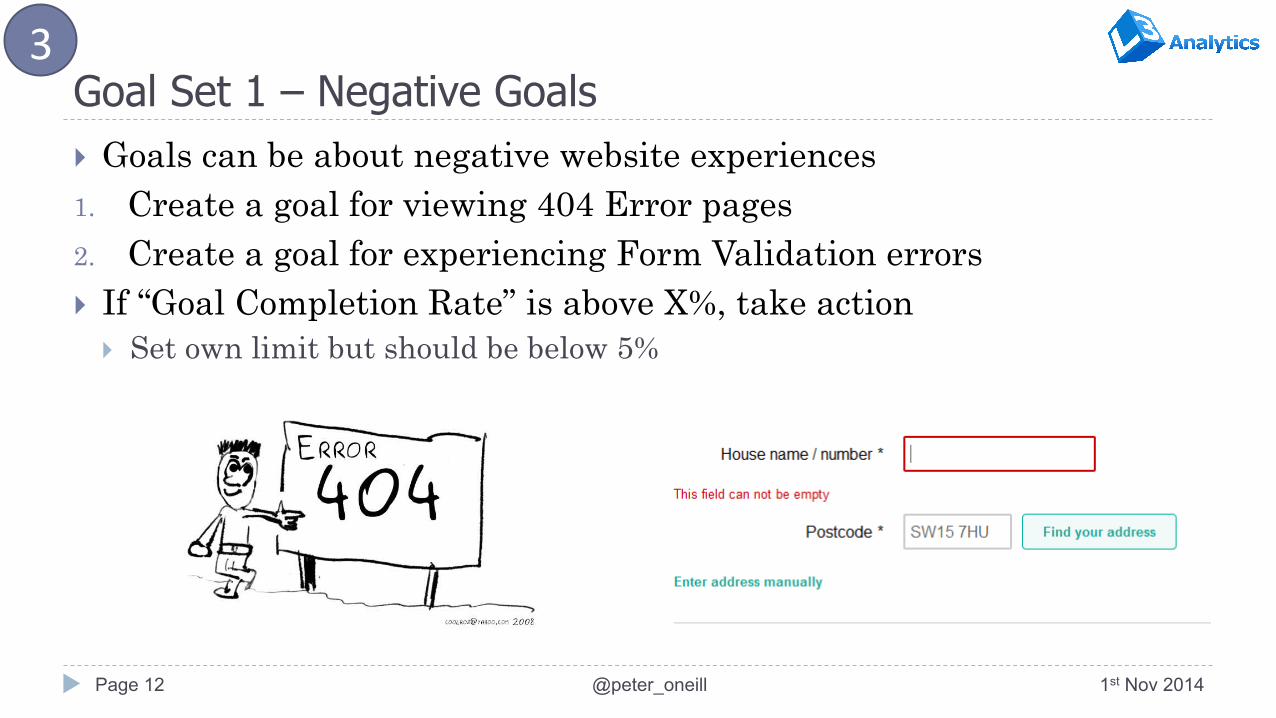
Goal Set 1 – Negative Goals } Goals can be about negative website experiences 1. Create a goal for viewing 404 Error pages 2. Create a goal for experiencing Form Validation errors } If “Goal Completion Rate” is above X%, take action
} Set own limit but should be below 5%
1st Nov 2014 @peter_oneill Page 12
3
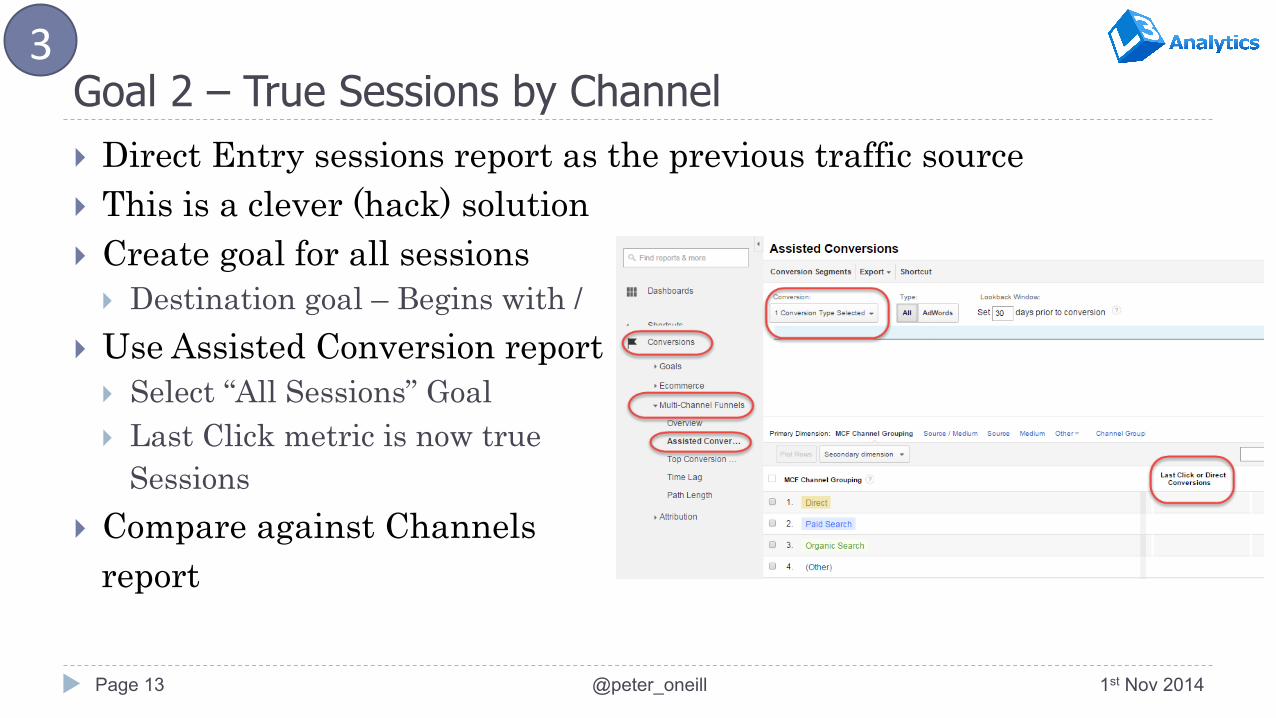
Goal 2 – True Sessions by Channel } Direct Entry sessions report as the previous traffic source } This is a clever (hack) solution } Create goal for all sessions
} Destination goal – Begins with / } Use Assisted Conversion report
} Select “All Sessions” Goal } Last Click metric is now true
Sessions } Compare against Channels
report
1st Nov 2014 @peter_oneill Page 13
3
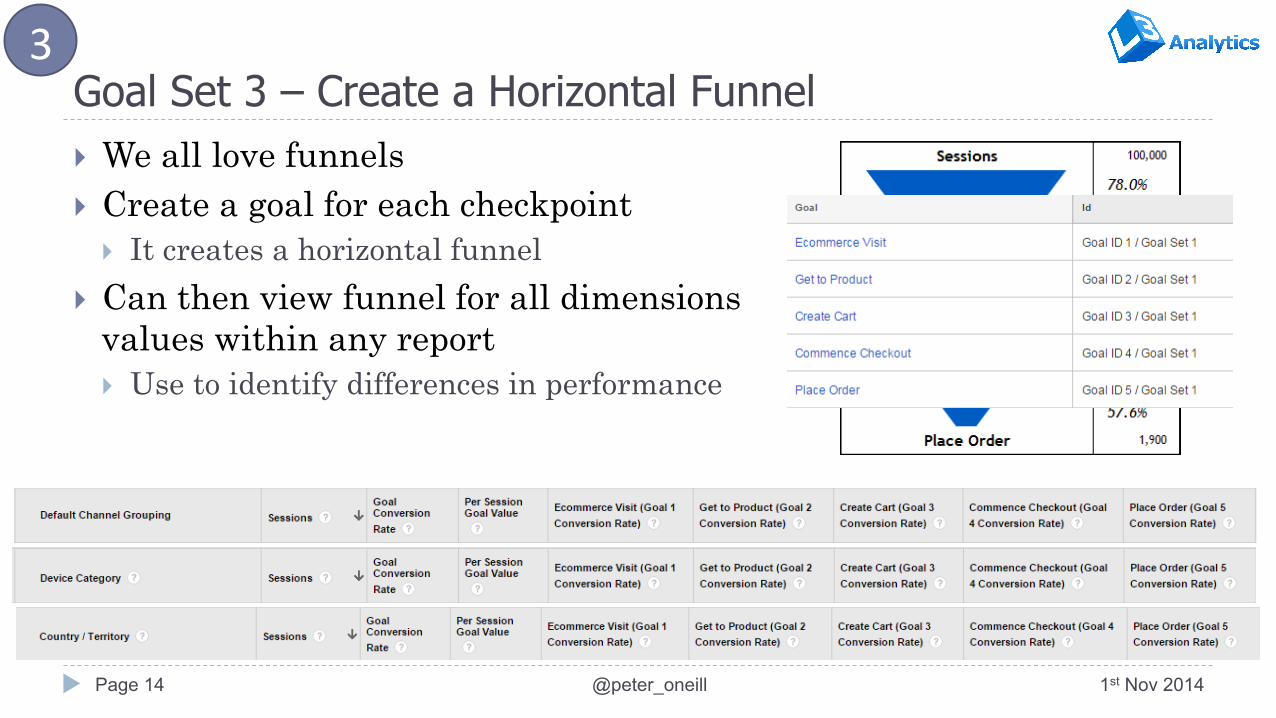
Goal Set 3 – Create a Horizontal Funnel } We all love funnels } Create a goal for each checkpoint
} It creates a horizontal funnel } Can then view funnel for all dimensions
values within any report } Use to identify differences in performance
1st Nov 2014 @peter_oneill Page 14
3
Page 15
FOUR REPORTS TO CREATE, AUTOMATE & USE
1st Nov 2014 @peter_oneill
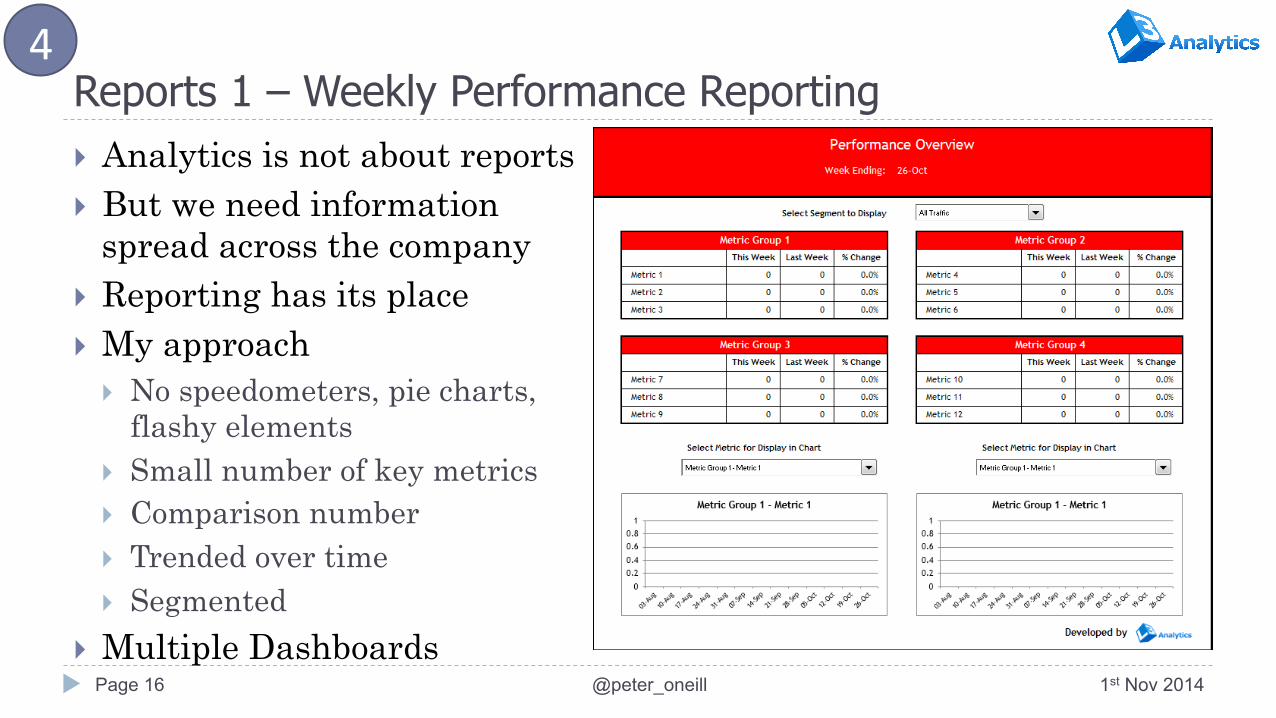
Reports 1 – Weekly Performance Reporting } Analytics is not about reports } But we need information
spread across the company } Reporting has its place } My approach
} No speedometers, pie charts, flashy elements
} Small number of key metrics } Comparison number } Trended over time } Segmented
} Multiple Dashboards 1st Nov 2014 @peter_oneill Page 16
4
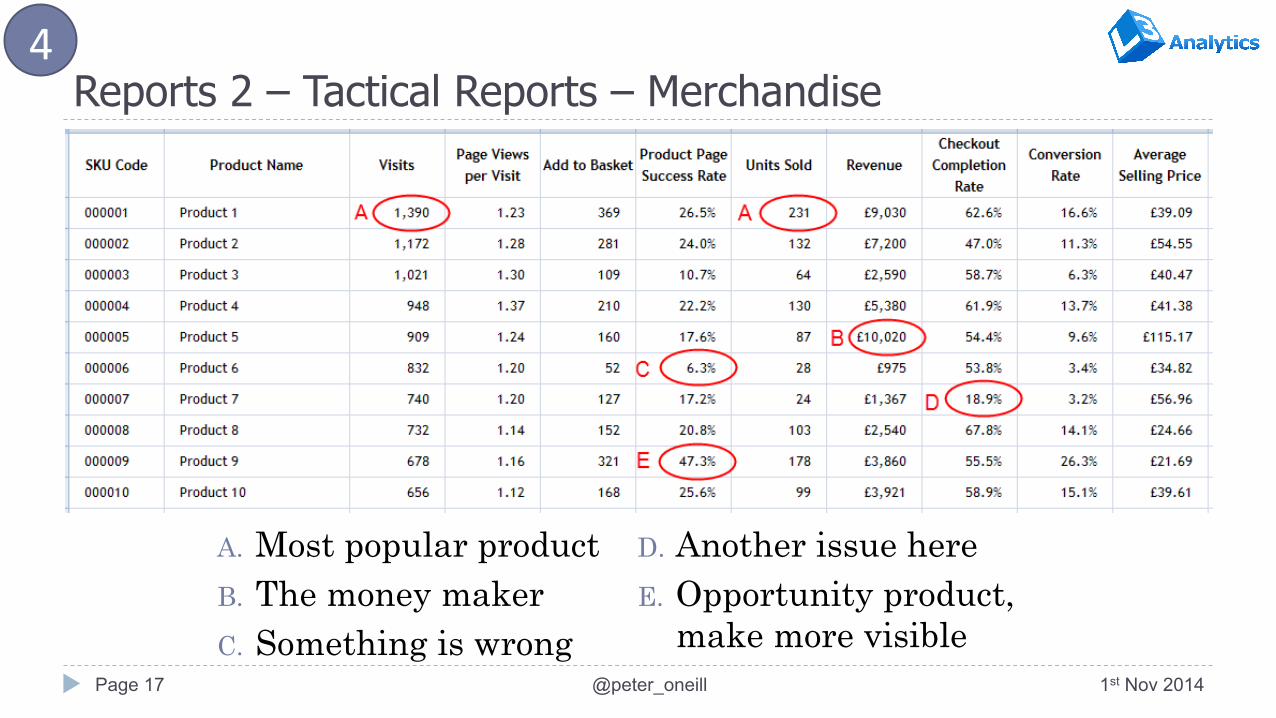
Reports 2 – Tactical Reports – Merchandise
A. Most popular product B. The money maker C. Something is wrong
D. Another issue here E. Opportunity product,
make more visible Page 17
4
1st Nov 2014 @peter_oneill
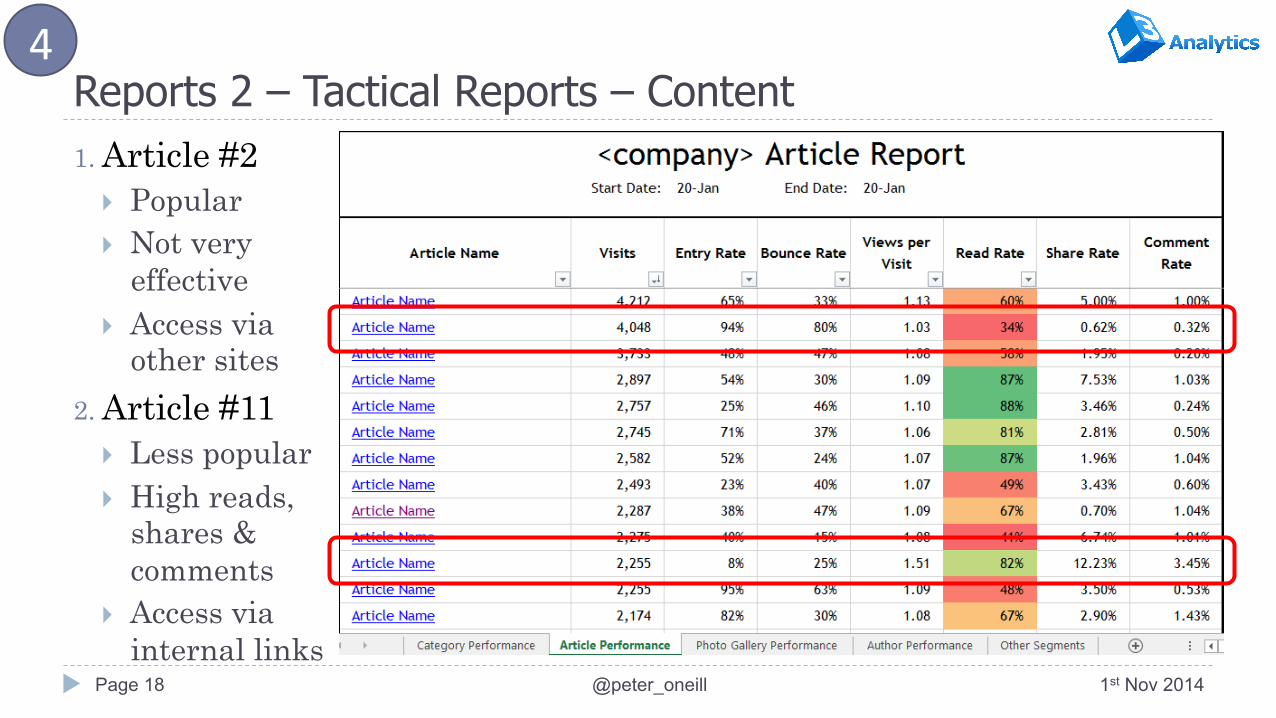
Reports 2 – Tactical Reports – Content 1. Article #2
} Popular } Not very
effective } Access via
other sites 2. Article #11
} Less popular } High reads,
shares & comments
} Access via internal links
1st Nov 2014 @peter_oneill Page 18
4
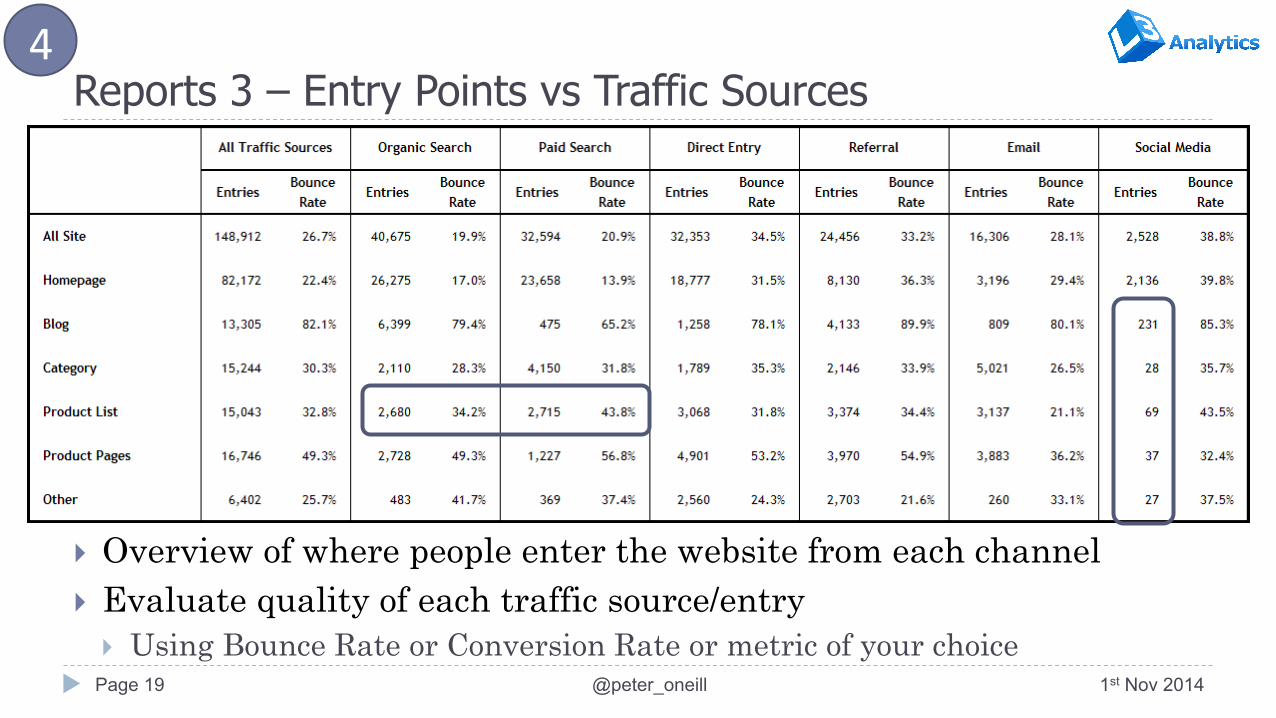
Reports 3 – Entry Points vs Traffic Sources
} Overview of where people enter the website from each channel } Evaluate quality of each traffic source/entry
} Using Bounce Rate or Conversion Rate or metric of your choice 1st Nov 2014 @peter_oneill Page 19
4
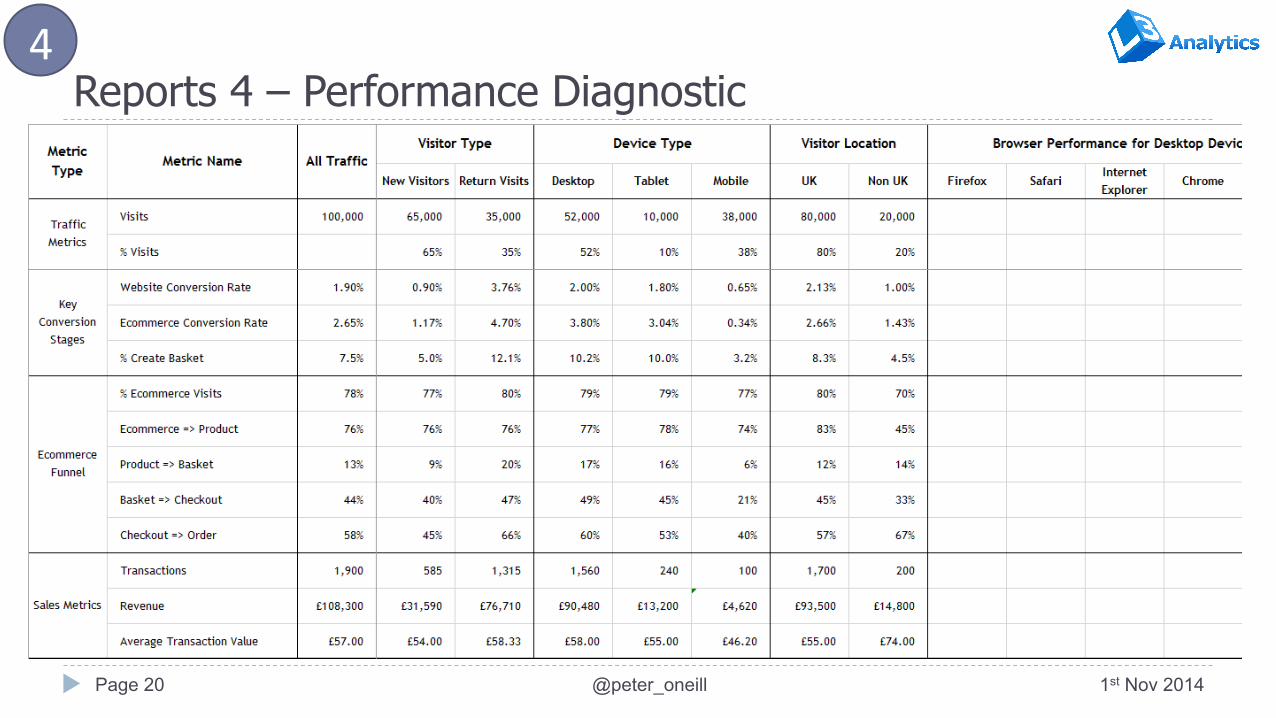
Reports 4 – Performance Diagnostic
1st Nov 2014 @peter_oneill Page 20
4

Reports 4 – Using Performance Diagnostic reports } Extend the report
} Metrics – traffic, engagement, performance, etc } Dimensions – traffic source, entry point, device, gender, etc
} Create Internal Benchmarks } Internal benchmarks are the maximum for each metric } Look for biggest gaps in performance vs these benchmarks } If ecommerce conversion rate is 3.2% for domestic traffic using Chrome on
desktop devices – why is it so poor elsewhere? } Identify the weak points & calculate value of fixing } Based on data, this is a prioritisation list for improving performance } Gives you a set of actions for the next 3 months (to make more money)
1st Nov 2014 @peter_oneill Page 21
4
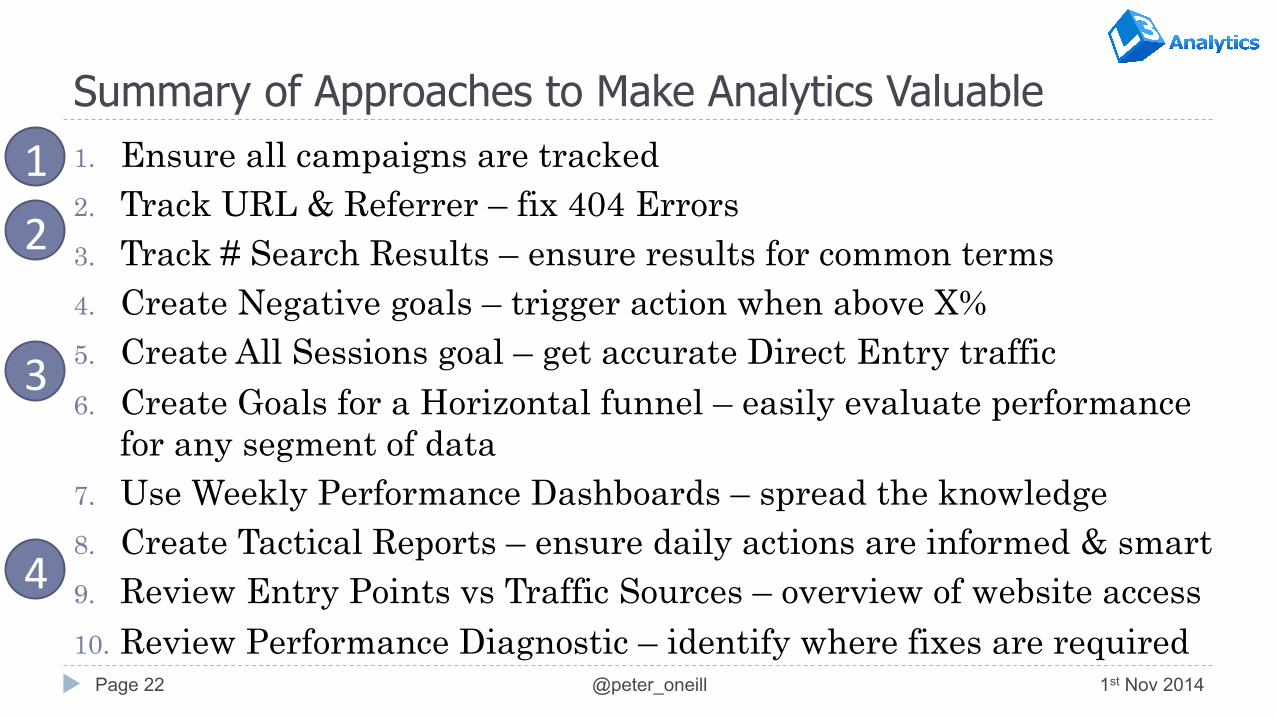
Summary of Approaches to Make Analytics Valuable 1. Ensure all campaigns are tracked 2. Track URL & Referrer – fix 404 Errors 3. Track # Search Results – ensure results for common terms 4. Create Negative goals – trigger action when above X% 5. Create All Sessions goal – get accurate Direct Entry traffic 6. Create Goals for a Horizontal funnel – easily evaluate performance
for any segment of data 7. Use Weekly Performance Dashboards – spread the knowledge 8. Create Tactical Reports – ensure daily actions are informed & smart 9. Review Entry Points vs Traffic Sources – overview of website access 10. Review Performance Diagnostic – identify where fixes are required
1st Nov 2014 @peter_oneill Page 22
12
3
4
Access Templates } All templates can be found & downloaded from
www.l3analytics.com/marketing-festival
1st Nov 2014 @peter_oneill Page 23
THANK YOU
I can be found at
• @peter_oneill
• +44 7843 617 347
• www.linkedin.com/in/peteroneill
1st Nov 2014 Page 24 @peter_oneill