Peter O)Connor Wolfram H6pken Information and ... · Peter O)Connor Wolfram H6pken Ulrike Gretzel...
8
Peter O)Connor Wolfram H6pken Ulrike Gretzel (eds.) Information and Communication Technologies in Tourism 2008 Proceedings of the International Conference in Innsbruck, Austria, 2008 " SpringerWienNewYork
-
Upload
duongquynh -
Category
Documents
-
view
222 -
download
1
Transcript of Peter O)Connor Wolfram H6pken Information and ... · Peter O)Connor Wolfram H6pken Ulrike Gretzel...

Peter O)Connor
Wolfram H6pken
Ulrike Gretzel (eds.)
Information
and Communication Technologies
in Tourism 2008
Proceedings of the International Conference
in Innsbruck, Austria,
2008
" SpringerWienNewYork
Dr. Peter 0'Connor Institut de Management Hotelier International
Ecole Superieure des Sciences Economiques et Commerciales Business School, Cergy-Pontoise, France
Dr. Wolfram H6pken eTourism Competence Center Austria, Innsbruck, Austria
Dr. Ulrike Gretzel Department of Recreation, Park, and Tourism Sciences Texas A&M University, College Station, Texas, U.S.A.
This work is subject to copyright. All rights are reserved, whether the whole or part of the material is concerned, specifically those of translation, reprinting, re-use of illustrations, broadcasting, reproduction by photo
copying machines or similar means, and storage in data banks. Product Liability: The publisher can give no guarantee for the information contained in this book. This also refers to that on drug dosage and application thereof. In each individual case the respective user must check the accuracy of the information given by consulting other
pharmaceutical literature. The use of registered names, trademarks, etc. in this publication does not imply, even in the absence of a specific statement, that such names are exempt from the relevant protective
laws and regulations and therefore free for general use. © 2008 Springer-Verlag Wien
Printed in Austria SpringerWienNewYork is a part of Springer Science of Business Media
springeronline.com
Typesetting: Camera ready by authors Printing: Novographic Druck G.m.b.H., 1230 Wien, Austria
Printed on acid-free and chlorine-free bleached paper SPIN 12204250
With 120 Figures
ISBN 978-3-211-77279-9 SpringerWienNewYork
Preface In 1993, academics from universities in Austria, Germany and Switzerland collaborated with the Tyrolean Tourist Board to organise a conference focusing on the interface between tourism and technology. This fledgling conference, which they called ENTER, has steadily matured into the world's premier global conference on Information and Communication Technologies (lCT) in Travel and Tourism. ENTER is unique in that it brings industry practitioners and representatives from national and regional tourist boards together with academics and researchers working on the cutting edge of this rapidly developing subject area. Both sets of constituents actively learn from each other, producing a knowledge sharing experience much richer than traditional industry-focused or purely academic conferences. This year, in an effort to further develop this cross pollination, authors of refereed research papers were asked to put special emphasis on the industry applications of their work. Reinforced through the review process, this approach will help to further bring the two communities together and enhance knowledge transfer and cross-fertilization.
The primary purpose of the ENTER 2008 Research Track is to disseminate high quality research findings on new theories, methodologies and applications in the field of information and communications technologies in travel and tourism. As such, these conference proceedings represent the more current developments in the global corpus of state-of-the-art research in this arena, tying in with the overa)) conference theme of "eTourism: The View from the Future". This year's Research Track continues to raise the bar in terms of quality. Over seventy research papers were submitted and subject to the double-blind review process. The fifty-one that were successful include a variety of diverse studies - e.g. theoretical, empirical, experimental, case studies and policy - addressing a myriad of different topics, themes, disciplines and approaches, so that any conference participant or reader of these proceedings will find several studies meeting their interests and expectations.
Recognising that the quality of the ENTER's Research Track depends heavily on reviewers' time and expertise, the Research Track Chairs would like to thank each of the members of the Research Program Committee. With the growing number of papers being received each year, heavy demands are placed on these individuals - often in a short time frame - and they deserve far more recognition than they currently receive. On behalf of the ENTER community, we would like to take this opportunity to thank them for their hard work and commitment. Lastly, the most important stakeholders of the ENTER conference are the authors themselves, many of whom return year after year to present, discuss and debate their research. Thank you for your efforts and your continued support, and we look forward to a fruitful conference this year in Innsbruck.
Peter O'Connor, Wolfram Hapken and Ulrike Gretzel
Innsbruck, 2008

474
Paolillo, 1.C. & Penumarthy, S. (2007).The Social Structure of Tagging Internet Video On del.icio.us. Proceedings of the 40th HICSS, IEEE, Haiwaii, USA, 3 - 6 January, 2007
Park, C. & Kim, Y. (2003). A framework of dynamic CRM: linking marketing with infonnation strategy. Business Process Management Journal 9(5): 652-671
Pitta, D. & Fowler, D. (2005). Online consumer communities and their value to New Product Developers. Journal ofProduct & Brand Management 14(5): 283-291
Reinartz, W., Krafft, M., & Hoyer, W. D. (2004). The CRM process: Its measurement and impact on perfonnance. Journal ofMarketing Research 41 (3): 293-305.
Rigby, D. K., Reichheld, F. F., & Schefter, P. (2002). Avoid the four perils ofCRM. Harvard Business Review 80(2): 101-109.
Rowley, 1., Teahan, B. & Leeming, E. (2007). Customer community and co-creation: a case study. Marketing Intelligence & Planning 25(2): 136-146
Scullin, S., Fjennestad, 1. & Romano, N. C. (2004). E-relationships marketing: changes in traditional marketing as the outcome of eCRM. Journal of Enterprise Information Management 17 (6): 410-15.
Sigala, M. (2006). Culture: the software of CRM. Journal ofMarketing Communications 12(3): 203- 223
Wang, Y., & Feserunaier, (2004). Modelling participation in an online travel community. Journal ofTravel Research 42 (3): 261-270
Webster, F. (1992). Changing Marketing Role. Journal ofMarketing 56(4): 1-17. Ying Z. & Davis, J. (2007). Web Communities in Blogspace. Proceedings of the 40th HIeSS,
IEEE, Haiwaii, USA, 3 - 6 January, 2007
Mobile Positioning Based Tourism Monitoring System: Positium Barometer
Rein Ahas", Erki Saluveerb, Margus Tirub and
Siiri Silm"
"Department of Geography University ofTartu
b Positium LBS Tartu, Estonia
Abstract
This paper introduces experiences with mobile positIOning data in the web-based tourism management and monitoring system: "Positium Barometer". The system has been developed for tourism enterprises, public authorities, scientists and planners to obtain statistical overviews and standardized analyses about the space-time movement of tourists. Positium Barometer uses passive mobile positioning data - location data that is stored automatically in the memory files (billing memory., hand-over logs etc) of mobile operators. Our database consists of records of the locations of roaming call activities in Estonia. Data is stored for every call activity of a foreign phone in Estonia. The data is anonymous, phone numbers and user data. are not identified by mobile operators. LBS (Location Based Services) data is a new and promising source for studying the geography of tourism and space-time behaviour since the data. is spatially more precise than questionnaires or accommodation statistics. The biggest problem of mobile positioning is fear of surveillance.
Keywords: mobile positioning, tourism geography, LBS, passive mobile positioning, Positiurn Barometer.
1 Introduction
Positium Barometer was worked out to meet the need for a tourism monitoring system in Estonia. The tourism industry has been developing very fast in Estonia: in 1995 there were 1.2 million visiting tourists and 10 years later, already 2.2 million. The main reasons for this fast growth are connected with European Union enlargement and the need for new tourism destinations in Europe, especially in Northern-Europe. Estonia's wild nature, medieval towns, spa areas and relatively low prices have made Estonia a popular tourism destination.
In order to study, evaluate, plan and manage developing tourism, appropriate data and analyses are needed. Traditional tourism data have not met the needs of these new tourism analyses. Statistics regarding border crossings have not been recorded since Estonia joined the European Union and accommodation statistics are too general
476
spatially, providing only accommodation location information. Also more and more tourists are not staying with official accommodation providers, but often use alternative accommodation or visit Estonia only for a day.
For the reasons mentioned above, the Institute of Geography at the University of Tartu, Positium LBS and Estonian mobile operators have been developing a monitoring system with mobile positioning data since 2002. LBS (Location Based Services) data has better spatio-temporal coverage than traditional sources which makes it a good base for in-depth tourist behaviour studies (Ahas et aI., 2007a). The use of LBS data in geography and geography related studies has been covered by various geographers (Mountain & Raper, 2001; Ahas & Mark, 2005; Ratti et al., 2006). The objective of this paper is to introduce the LBS application Positium Barometer (www.positium.comlbarometer/tourism); its functionality, usability and technical solution; and to discuss the methodological aspects of passive mobile positioning based tourism monitoring tools. From an academic point of view it is important to discuss the methodological aspects of using LBS to study human behaviour. Using LBS data makes Positium Barometer unique, but also raises a number of problems. Data is hard to get, privacy concerns have to be addressed and a special knowledge of LBS data processing is required (Klinkenberg, 2007). These are also reasons why mobile positioning is not very wide spread.
2 Need for monitoring system
The need for a tourism barometer arose mainly from the rapid growth of the Estonian tourism industry and also the need to manage geographical change, investment and improve spatial planning in development The most important need was to obtain information about actual tourists' movements and to detennine specific geographical locations and events which have many traditional and new applications. Positium barometer applications are divided into 5 groups (Table I), these applications have been developed within our tourism geography research and planning works (Ahas et aI., 2007b; Ahas et aI., 2007c). Strategic planning. The main consumers in this area are public sector and local municipality representatives who need good spatial statistics for strategic planning and also to a certain extent analyses of spatio-temporal behaviour. Business- and investment plans, funding applications. This information is needed by municipalities for developing a tourism supportive infrastructure and by businesses for their business plans. Often this information is supportive in business plans when applying for a loan or funding. Statistics and analyses with good spatial and temporal coverage help to make a strong business plan and help donors with management. Marketing and advertisement. Businesses dealing with tourism or advertisement need general statistics of tourism for their marketing strategy. Also they need spatio-temporal behaviour information of target groups and event-specific tourism information. The marketing sector has become one of most important in tourism promotion and their need for spatio-temporal behaviour information and the impact of specific events is the greatest. Business management. The market of tourism related businesses is very variable, depending on weather, political situation, security
477
and many other matters. Therefore businesses need to monitor the current situation and make decisions based on it An almost real-time monitoring system would help in these matters. Public administration. Public administration has, besides planning duties, other management and monitoring responsibilities: enterprise support, ensuring an infrastructure and planning money flows. As it deals actively with tourism, it needs statistical information for planning and also real-time monitoring information for everyday management. Positium Barometer follows the interests of these consumer groups. During the testing period of Positium Barometer there was much to learn regarding the consumers' actual needs, their computer skills and considerations for pricing schemes.
Table 1. Applications of mobile positioning data in tourism management
Space-time Event Real-timeStatistics, movementcbange modelling monitoringanalvses
Development plans, strategies and xxx xx x xstrategic olannin Business- and investment plans, I xxx I xx I xx xfunding aoolications Marketing and advertisement I xx I xxx I xxx xx Business management I xx I xx I xxx xxx Public administration I xxx I xx I xxx xxx xxx - high applicability, xx - medium applicability x -lower applicability
3 Input data
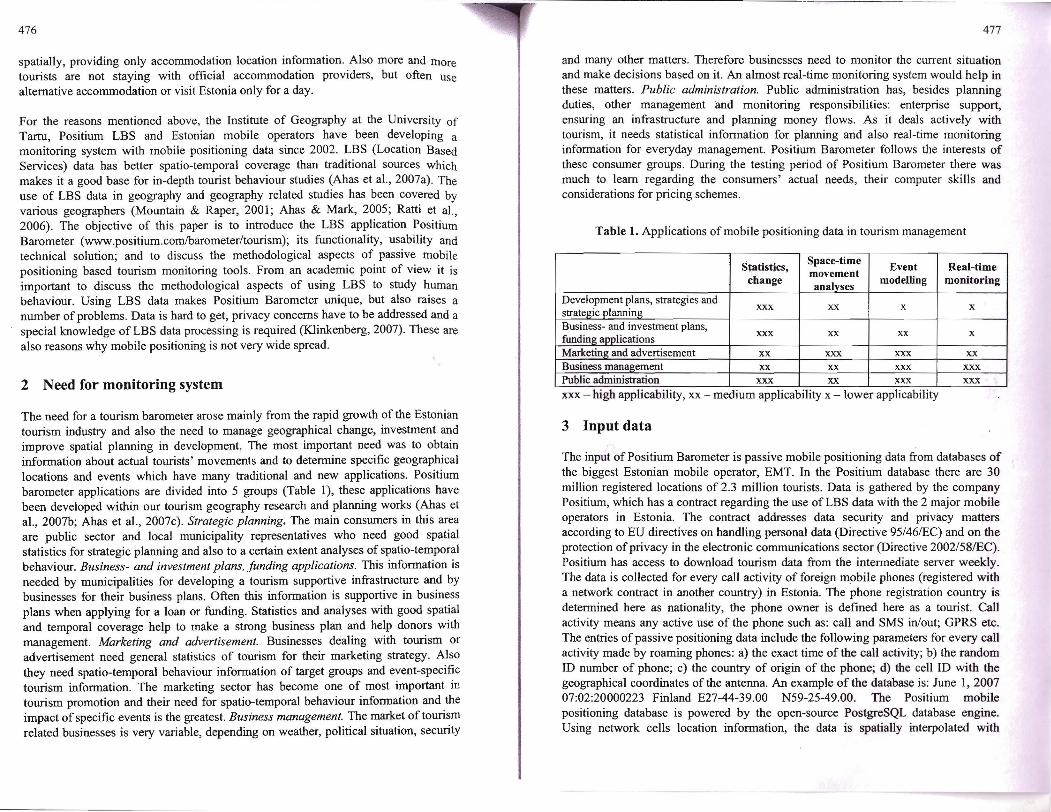
The input of Positium Barometer is passive mobile positioning data from databases of the biggest Estonian mobile operator, EMT. In the Positium database there are 30 million registered locations of 2.3 million tourists. Data is gathered by the company Positium, which has a contract regarding the use of LBS data with the 2 major mobile operators in Estonia. The contract addresses data security and privacy matters according to EU directives on handling personal data (Directive 95/46/EC) and on the protection ofprivacy in the electronic communications sector (Directive 2002/58/EC). Positium has access to download tourism data from the intermediate server weekly. The data is collected for every call activity of foreign mobile phones (registered with a network contract in another country) in Estonia. The phone registration country is determined here as nationality, the phone owner is defined here as a tourist. Call activity means any active use of the phone such as: call and SMS in/out; GPRS etc. The entries of passive positioning data include the following parameters for every call activity made by roaming phones: a) the exact time of the call activity; b) the random ID number of phone; c) the country of origin of the phone; d) the cell ID with the geographical coordinates of the antenna. An example of the database is: June I, 2007 07:02:20000223 Finland E27-44-39.00 N59-25-49.00. The Positium mobile positioning database is powered by the open-source PostgreSQL database engine. Using network cells location information, the data is spatially interpolated with
478 479
P~ITIUM
Dirichlet tessellation. In order to specify mobile positioning data and for making additional surveys, accommodation statistics (data correlation to mobile positioning data is O.~) and census data are used. Other sources of statistical data are hard to use within Barometer, because data owners are not interested in mediation services and want to sell the data themselves.
~l
ESl
W~lcome to Tourism Barometer! Tourism Barometer lets You make: -statistical reports about foreign visitors in Estonian municipalities.
Data i~ our database: 01.04.2004 . 31.08.2007
~ PI~"se log ifl!
in
J' ,,~: iP.POrt.
«') Data and methO<l
Demo Report
I]J Order an extensive tourism stUdy
iExllmple oftourists movement:
IU1VIans visiting lII"tallica concert
2006.6.1222:00:00
I
C" PositJvn) 185 b"'Of\'tdc"'po,itium,~
Fig. 1. Positium Barometer main page
4 Description of Positium Barometer
The Positium Barometer web-based tourism information query environment is located at URL http://www.positium.comJbarometer/tourism. Positium Barometer uses a pre generated database of tourist mobile positioning data for fast data retrieval. All data is interpolated within municipality distribution and an administrative hierarchy is used. The barometer query environment is developed in PHP language allowing for a dynamic web page and graph generation. A map-server is used for generating maps on the fly.
On the main page of Positium Barometer (Fig. I) a user can log in to the system or register for a new account by ordering reports within the interested municipalities and time frames. Cost calculations are made on the fly and bills are generated according to user selections, which can be paid by the liser through an internet bank. User rights to access Positium Barometer will be. sent to the user bye-mail within 24 hours following a money transfer.
A user can order reports on 4 administrative levels: whole country, county, municipality (parish or city) and the Estonian capital which is divided into city districts. Time frames can be chosen in monthly, weekly or daily units. Generally the more precise and more spatially detailed the data is, the more it costs. For example it is possible to place an order for specific days at certain locations only as an extensive order, as detailed data in large amounts is not delivered. Though, there is a wholesale discount. For every order, the user has to accept the Barometer terms of use. The methodology and description of data collection and processing are available from almost any page. On the main page there is an example of an interactive tourism event animation application that could be made by placing a custom order.
.., Pl)SfTlU!'I
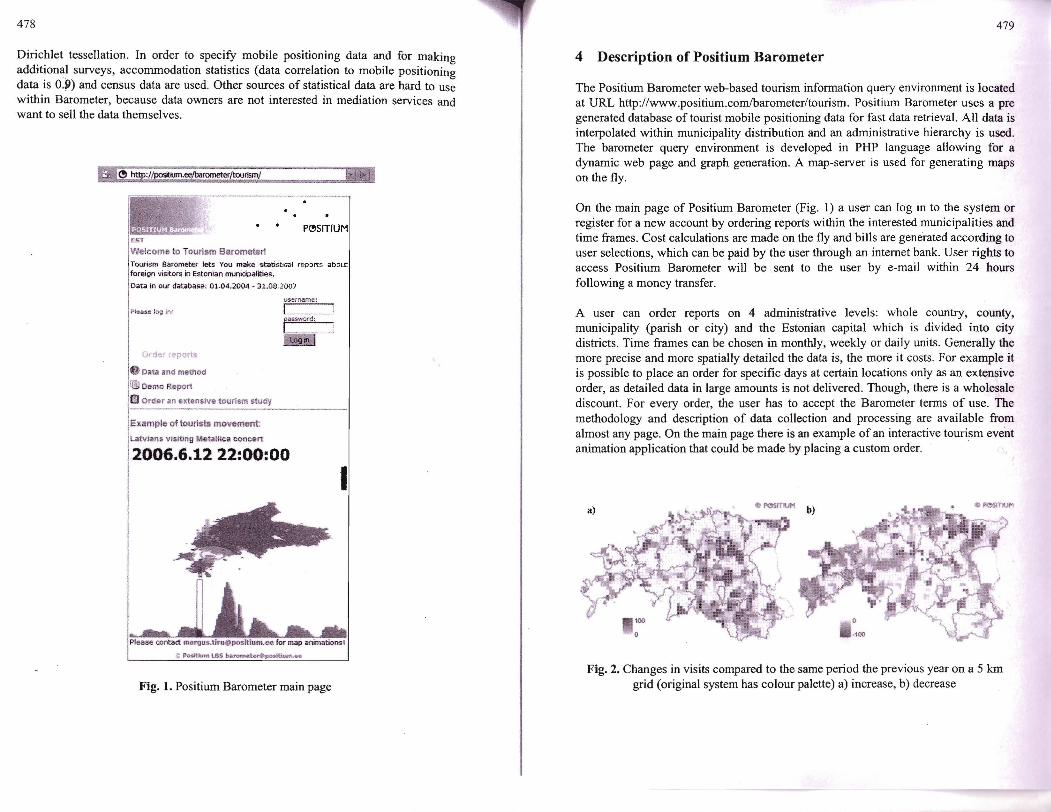
Fig. 2. Changes in visits compared to the same period the previous year on a 5 km grid (original system has colour palette) a) increase, b) decrease

481 480
After logging into Barometer and choosing a time frame and territory, the system calculates within seconds a report with eleven modules. The first is a general overview of the number of tourists and main visiting groups within the observed area and time period. It will be followed by 3 map modules of which the first represents the observed area and its surroundings. The second one represents the locations of foreign visitors during the observed period on a 5 Ian grid and the third a trend in the amount of tourists compared to the same period the previous year (see Figure 2). Better geographical distributions of tourists and also trends within a period are often asked questions by the consumers mentioned above.
C P~StT1UMa) Ru.8l> (6"4)----------=
L Norwav (6"4)
~----L~huania(S');)
Lalvio(13');)------,
s..._n(S'I.)
UMed KIngdom (3'%)
Ger"""'Y (3'%)
f't>Iond(2'I.) --Denmark (''1.)
'---other Com!"" (1 0');)
FI-lIand (41'1.)-----
bi X' ,'WSWI 'mum' J!i.~
1 Finland 2~ "~,..iiftr; 3 Russia
~ ""'~ay 5 Lithuania f!:', ~'¥I~-!'''''''_T ".Jir:
... '.;. & "'''6 000 -~_ ....;p_.ar__
7 United Kingdom "",,"~a:--:"--flGe-rn;r.y.• .
9 Poland
tq: :.-~~ 11 other Countries
flOOd.].}. I.uffil\;
Fig. 3. A Graph oftop 10 countries of origin (a) and same table with changes compared to the same period in the previous year (b)
The fifth module represents the top 10 countries of tourist origin on graph and table (see Figure 3). Although there are more than 120 countries listed as possible origin of tourists, those other than the top 10 are marginal. Also some tourists from "exotic" countries have been generalised into a group "Other Countries" for privacy concerns, so it is not possible to identify spatially or in time any tourist or group of tourists.
In the following module the temporal trend of tourists is represented on graph and table (see Figure 4). The table of temporal trends is quite popular, and is used in the everyday work of many public sector institutions and businesses.
© pesrnUMa) I 400 000
.----------,-, .- ..__ ..•_. -._----_.--_._--_.~1200000
1000000 -,------------ .---------fl .",,-,--,' BOO 000
- ._~ r-··',.::...= _. 'c_ ...
.- ::.;~ " ;;;.
--1 ,. I', ,'. -
. -I 032007 042007 052007 062007 072007 082007
b) Time Step . ' , Visitors * Change " March 2007 ,,',' . .,.: , ,,[., 613000 - ,- .. n., ".. ~ ...........~-... """'--~~~--...-""...- ...-,--~--- _. _...... ..
April 2007 _ 698 000 Mai~o07, _~~~:.:~. !E!~~:~.:.:j~~=~;'VO'..76600fl June 2007 868 000
JU!Y~O? ..._ <. ~'~:::~L..:..~" ,- ct., :,,"~.L.;L:~"'; !090 OQ.O August 2007 936 000
Fig. 4. Visitor's distribution in the observed period on graph (a) and table with changes compared to the same period in the previous year (b)
Temporal variation is represented on separate graphs for the top 10 countries (see Figure 5) as tourist behaviour in time is very different and changes are different.
a) 600000
500000
400 000
300000
200 000
100000
o
P~SITlUM
'~
r-- .----'_ j-'-----;-
.. --.-- .-
1- I -I-
,.: ~ I I-Ir-~
i I- - I· l ~i-l-
II" 03.2007 04.2007 05.2007 06.2007 07.2007 08.2007

483 482
~ ~SITIUM b) ~~I I
40000
30000
20000
10000
o II I I f J. I J I I I I I I
03.2007 04.2007 05.2007 06.2007 07.2007 08.2007
Fig. 5. Temporal trend of visitors from Finland (a) and Great Britain (b) in Tallinn
The rest of the Barometer modules compare observed territory statistics from higher administrative unit territory statistics, the amount of countries of origin and changes compared to the same period in the previous year, and the division oftourists between workdays and weekends.
5 Discussion and conclusions
Our experiences with LBS based tourism monitoring system and relevant studies show that there is a demand for such data and monitoring system. The first important advantage of LBS data is a better geographical preciseness than accommodation data. Mobile positioning data enables more precise studies of tourists' spatio-temporal behaviour and especially the analysis of visits to certain territories or specific events. We can study transit in less habited areas or visits to natural parks which do not have hotels. Standardised methodology helps to study larger territories such as the whole of Estonia. And even if the methodology has some weaknesses (we will discuss them later) we can compare visits to different regions or objects and trends 'in a visit. Geographically the LBS data used in Estonia also enables the study of tourist flow movement: where they came from, how long they stayed and where they went etc. Indepth analyses and modelling can be carried out on the impacts of events that are attractive to tourists. We have thoroughly studied weather impact on tourists' everyday behaviour in Estonia, which are quite accurate for summer and winter tourism (Ahas et al 2007b). A second important aspect whY our monitoring system has a number of users is that this web based solution is simple and cheap for users. Our experiences show that Estonian local municipalities and also consulting firms do not have the personnel and programs for GIS analyses or even for basic statistics. Web based standard reports have also 3-5 times lower prices than relevant research projects as they do not waste the time of researchers with simple questions.
5.1 Users of Barometer
Positium barometer has gathered a number of users, among whom the biggest group are municipalities involved in tourism. The most common use is for composing
tourism development strategies or applications for funding. It is interesting that the very tourism based areas such as the Western Estonian municipalities are not as interested as the less developed areas in Central Estonia which want to develop tourism as their only chance to keep the economies running in rural areas. Also some public institutions, to~sm managers and consulting companies are active users of Barometer. There are some common features for municipalities and institutions which use Positium Barometer actively; they have younger and more open-minded persons in their teams who start using the system and data. This means that even if our system is simple there is still a need for active persons on the user side "to open web-site for the first time". This is a typical problem of the majority of web-based applications. Although there is a lot to evolve, especially regarding user friendliness, Barometer reports are important to certain research projects and users. In reality, besides Barometer statistics, extensive scientific studies are often required. In connection with Positium Barometer, a user can order an extensive study or development plan which will be carried out by Positium in l;p-operation with scientists from University of Tartu and planners from the architectural office Urban Mark. Tourism related planning projects are in great need in fast developing tourism countries like Estonia.
5.2 Weaknesses in mobile positioning data
One point for discussion is sampling. The data source is new, and there is a need for future analysis concerning sampling and methodology. For example we do not know the exact proportion of phones and phone use between nationalities and social groups in their home country or when travelling. Therefore we can say that we are studying the geography of foreigners in Estonia who use mobile phones registered abroad (roaming) (Ahas et al 2007a). With the latest Eurobarometer survey (2007), we know that the average number of mobile phone users has reached 79% as an average for the EU. But different social groups in one nation use phones differently. Different nations also use phones differently because of the different costs of roaming calls. For tourism studies there is also the important methodological question of how to distinguish between business and leisure travellers who have different objectives, behaviour and phone usage. Still, our studies in the major tourist region in Tallinn show that business visitors are also active users of tourist attractions in the historical centre (Silin 2006). As the database is setup from call activities it is clear that different user groups and nationalities make a different number of call activities during a day. For example the number of call activities per visitor is up to 20 calls for Scandinavians and 5-7 for southern Europeans during their stay in Estonia. The activity of phone use is also determined by differences in network standards. American and Asian countries use phones with different standards and cheaper handsets that are not compatible with the GSM networks in Estonia. Therefore tourists from some countries may be under-represented in the database. The database is also influenced by tourists' behaviour - when they use phones, this determines the location of points. Business travellers may call throughout the day but members of group excursions may not have the chance to use their phone during parts of the day. This all influences the location of call activities and our geographical studies. The database is also influenced by cross-border noise or "hand-over"· between mobile

484 485
networks especially in coastal areas with empowered base stations of GSM. Samples are influenced by the possibilities for recharging batteries (hiking in the forest) and the quality of radio coverage (Ahas et aI., 2007a). For a better understanding of this huge quantitative dataset we have many important aspects to study about phone use routines and statistics.
5.3 Real-time GIS
A great part of LBS data and its applications is to create real-time maps and monitoring systems, which geographers have been successfully developing for years (Gartner, 2004). Inside Positium Barometer we have deployed an interactive 3D testing application of tourism events. It allows visualising tourists' movements during a specific event. This information is used in planning processes, evaluating impacts, analysing traffic during large events and also used as a nice feature on homepages or during presentations. In the future, Positium Barometer will become a real-time monitoring system with more analytical filters using both domestic and visiting tourism data. Also the "smart street and road" concept (Ahas & Saluveer, 2007) may find use in Barometer. For example restaurants on the road can get information of approaching tourists and show information in the tourists' language on a dynamic information board. Still the systems that are used for LBS data collection and the policies of mobile operators do not favour real-time systems using mobile positioning data. In addition to these reasons the biggest problem still is data privacy concerns and fear of monitoring. Mobile phones have become very personal for their users and often users are afraid of anything related to mobile phone monitoring. In conclusion it has to be pointed out that regardless of LBS data specifics and the functionality of the internet it is not possible to replace humans and create such a smart system capable of managing tourists and making decisions. Attempts have been made to build planning tools and systems, but so far the human has always been the user and the decision maker.
References
Ahas, R., Aasa, A., Roose, A., Mar~j D. & Silm, S. (2007a). Mobile positioning as a new data source and method for tourism surveys: an Estonian Case Study. Tourism Management (Published online June 2007) http://www.sciencedirect.com/science/joumaV02615177. [Please refer to the PAPER pubIication]
Ahas, R., Aasa, A., Mark, 0., Pae, T. & Kul1, A. (2007b). Seasonal tourism spaces in Estonia: case study with mobile positioning data. Tourism Management 28(3): 898-910.
Ahas, R., Aasa, A., Silm, S. & Tiru, M. (2007c). Mobile positioning data in tourism studies and monitoring: case study in Tartu, Estonia. In M. Sigala, L. Mich and J. Murphy (Eds.), Springer Computer Science: Information and Communication Technologies in Tourism (pp. 119-128). WienlNew York, Springer.
Ahas, R. & Saluveer E. (2007). Concept of Smart Street: observing street life with passive mobile positioning data. IGU Commission on the Geography of Information Society. Digital Communities 2007. Tallinn, Estonia - Helsinki, Finland, July 8-12, 2007. [Editor, publisher, place, pages?] ,
Ahas, R. & Mark, D. (2005). Location based services - new challenges for planning and public administration? Futures 37(6): 547-561.
Directive 95/461EC of the European Parliament and of the Council of 24 October 1995 on the protection of individuals with regard to the processing of personal data and on the free movement of such data. http://eur-ex.europa.eulLexUriServ/LexUriServ. do?uri-CELEX:31995L0046:EN:HTML
Directive 2002/581EC of the European Parliament and of the Council of 12 July 2002 concerning the processing of personal data and the protection of privacy in the electronic communications sector (Directive on privacy and electronic comrnunications)http://eur-lex.europa.eu/LexUriServ/site/en/oj/2002/1 20 III 20120020731 en003 70 047.pdf
Eurobaromeeter 2007. http://ec.europa.eulpublic_opinion/index_en.htrn. Gartner, G. (2004). From "Internet cartography" to "ubiquitous cartography". Mitteilungen der
osterreichischen geographischen gesellschaJt 146: 303-322. [Clarify Volume / Iss~e in format 32 (2)]
Klinkeoberg, B. (2007). Geospatial technologies and the geographies of hope and fear. Annals ofthe association ofAmerican Geographers 97(2): 350-360.
Mountain, D. & Raper, J. (2001). Positioning techniques for location-based services (LBS): characteristics and limitations of proposed solutions. Aslib proceedings 53 (10): 404412. [Editor, publisher, place of publication and pages omitted)
Ratti, C., Frenchman, D., Pulselli, R.M. & Williams, S. (2006). Mobile landscapes: Using location data from cell phones for urban analysis. Environment And Planning BPlanning & Design 33(5): 727-748.
Acknowledgements
This paper was supported by Target Funding Project No. SF0180052s07 and Grant of Estonian Science Foundation No. ETF 7204. Special thanks to all data providers, especially EMT, and anonymous tourists mapped during this study.