Peter and Rosemary Grant’s Finches Name: Period: Date: In ... · Peter and Rosemary Grant’s...
6
© 2015 Science Rocks Peter and Rosemary Grant’s Finches Name: Period: Date: Background: In 1834 Charles Darwin studied birds on the Galapagos Islands. He observed that even though all the birds he saw were finches, the various species had different shaped beaks. He proposed that the finches all descended from a common ancestor, and the beak shapes changed as the birds adapted to eat different foods. It was a great theory, but at the time he had no way to prove it. More than 100 years later, Peter and Rosemary Grant from Princeton University set out to prove Darwin’s hypothesis. They studied medium ground finches on Daphne Major, a tiny island in the Galapagos. They were able to measure the beak depth of the 1,200 finches that live on the island. The finches on this volcanic island eat seeds by cracking them open with their beaks. They found that the finch’s beak size was correlated with the size of the seed they ate (large beaked finches ate large seeds, and small beaked finches ate small seeds). Daphne Major typically receives 130mm of rain per year. Then, in 1977 there was a drought and the island only received 24mm of rain. Because of the little rain, there were fewer seeds growing, and 84% of the birds died of starvation. Predict: Which type of birds do you think survived the drought- finches with big beaks or finches with small beaks? Why? ________________________________________________________________________ ________________________________________________________________________ ________________________________________________________________________ Directions: 1. You will be completing 3 line graphs on the following page (number of finches, number of seeds, and seed size). The graphs show data from before, during, and after the drought. 2. After plotting your points, connect all the dots. 3. Answer the analysis questions based on the graphs. CC image courtesy Michael Dvorak on Wikimedia.org
Transcript of Peter and Rosemary Grant’s Finches Name: Period: Date: In ... · Peter and Rosemary Grant’s...

© 2015 Science Rocks
Peter and Rosemary Grant’s Finches Name: Period: Date: Background:
In 1834 Charles Darwin studied birds on the Galapagos Islands. He observed that even though all the birds he saw were finches, the various species had different shaped beaks. He proposed that the finches all descended from a common ancestor, and the beak shapes changed as the birds adapted to eat different foods. It was a great theory, but at the time he had no way to prove it.
More than 100 years later, Peter and Rosemary Grant from Princeton University set out to prove Darwin’s hypothesis. They studied medium ground finches on Daphne Major, a tiny island in the Galapagos. They were able to measure the beak depth of the 1,200 finches that live on the island. The finches on this volcanic island eat seeds by cracking them open with their beaks. They found that the finch’s beak size was correlated with the size of the seed they ate (large beaked finches ate large seeds, and small beaked finches ate small seeds). Daphne Major typically receives 130mm of rain per year. Then, in 1977 there was a drought and the island only received 24mm of rain. Because of the little rain, there were fewer seeds growing, and 84% of the birds died of starvation. Predict: Which type of birds do you think survived the drought- finches with big beaks or finches with small beaks? Why? ________________________________________________________________________________________________________________________________________________________________________________________________________________________
Directions:
1. You will be completing 3 line graphs on the following page (number of finches, number of seeds, and seed size). The graphs show data from before, during, and after the drought.
2. After plotting your points, connect all the dots. 3. Answer the analysis questions based on the graphs.
CC image courtesy Michael Dvorak on Wikimedia.org
© 2015 Science Rocks
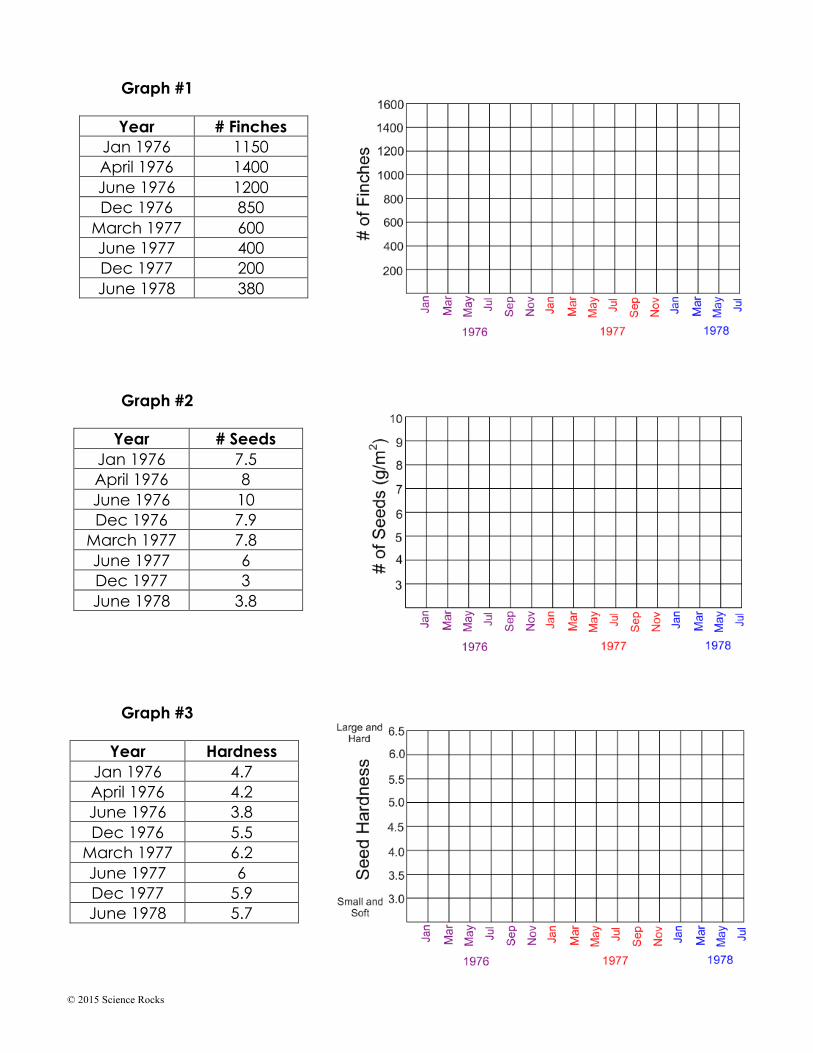
Graph #1 Year # Finches
Jan 1976 1150 April 1976 1400 June 1976 1200 Dec 1976 850
March 1977 600 June 1977 400 Dec 1977 200 June 1978 380
Graph #2
Year # Seeds Jan 1976 7.5 April 1976 8 June 1976 10 Dec 1976 7.9
March 1977 7.8 June 1977 6 Dec 1977 3 June 1978 3.8
Graph #3
Year Hardness Jan 1976 4.7 April 1976 4.2 June 1976 3.8 Dec 1976 5.5
March 1977 6.2 June 1977 6 Dec 1977 5.9 June 1978 5.7

© 2015 Science Rocks
Analysis Questions:
1. What is the relationship between the number of seeds available and the number of finches? (Graphs 1 & 2) ______________________________________________________________________________________________________________________________________________________________________________________________________
2. Which type of seeds survived after the drought? (Graph #3) ____________________________________________________________________________________________________________________________________
3. Based on the seeds available after the drought, which type of bird
do you think survived the drought? Explain your reasoning. ____________________________________________________________________________________________________________________________________
4. In 1983, there was an abundance of rain- 1359mm! Predict what the
bird population looked like in 1984. What types of beaks were most common? Explain. ______________________________________________________________________________________________________________________________________________________________________________________________________
5. How does the Grant’s research help prove Darwin’s theory of
evolution by natural selection? ________________________________________________________________________________________________________________________________________________________________________________________________________________________________________________________________________
6. Explain the following statement: “Selection occurs within generations; evolution occurs between generations.” ______________________________________________________________________________________________________________________________________________________________________________________________________

© 2015 Science Rocks
Graph #1 Year # Finches
Jan 1976 1150 April 1976 1400 June 1976 1200 Dec 1976 850
March 1977 600 June 1977 400 Dec 1977 200 June 1978 380
Graph #2
Year # Seeds Jan 1976 7.5 April 1976 8 June 1976 10 Dec 1976 7.9
March 1977 7.8 June 1977 6 Dec 1977 3 June 1978 3.8
Graph #3
Year Hardness Jan 1976 4.7 April 1976 4.2 June 1976 3.8 Dec 1976 5.5
March 1977 6.2 June 1977 6 Dec 1977 5.9 June 1978 5.7
© 2015 Science Rocks
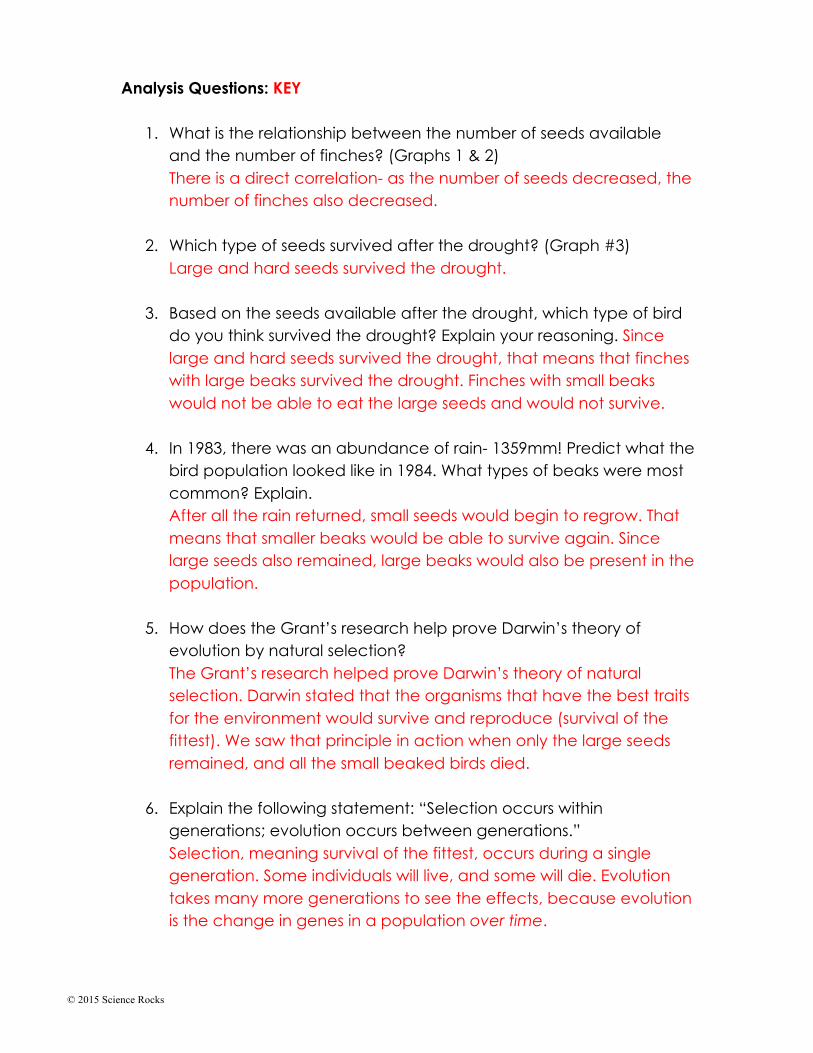
Analysis Questions: KEY
1. What is the relationship between the number of seeds available and the number of finches? (Graphs 1 & 2) There is a direct correlation- as the number of seeds decreased, the number of finches also decreased.
2. Which type of seeds survived after the drought? (Graph #3) Large and hard seeds survived the drought.
3. Based on the seeds available after the drought, which type of bird
do you think survived the drought? Explain your reasoning. Since large and hard seeds survived the drought, that means that finches with large beaks survived the drought. Finches with small beaks would not be able to eat the large seeds and would not survive.
4. In 1983, there was an abundance of rain- 1359mm! Predict what the
bird population looked like in 1984. What types of beaks were most common? Explain. After all the rain returned, small seeds would begin to regrow. That means that smaller beaks would be able to survive again. Since large seeds also remained, large beaks would also be present in the population.
5. How does the Grant’s research help prove Darwin’s theory of
evolution by natural selection? The Grant’s research helped prove Darwin’s theory of natural selection. Darwin stated that the organisms that have the best traits for the environment would survive and reproduce (survival of the fittest). We saw that principle in action when only the large seeds remained, and all the small beaked birds died.
6. Explain the following statement: “Selection occurs within generations; evolution occurs between generations.” Selection, meaning survival of the fittest, occurs during a single generation. Some individuals will live, and some will die. Evolution takes many more generations to see the effects, because evolution is the change in genes in a population over time.

© 2015 Science Rocks
Please Note: The Grants have multiple publications of their research available online:
1) P. T. Boag and P. R. Grant. 1984. The classical case of character release: Darwin's finches (Geospiza) on Isla Daphne Major, Galápagos. Biological Journal of the Linnean Society 22: 243-287. Can be found at http://deepblue.lib.umich.edu/bitstream/handle/2027.42/75575/j.1095-8312.1984.tb01679.x.pdf?sequence=1
2) P. R. Grant and B. R . Grant. 1995. Predicting microevolutionary responses to directional selection on heritable variation. Evolution 49: 241-251. Can be found at http://www.d.umn.edu/~jetterso/Ecological%20Genetics/documents/GrantandGrant1995Predictingmicroevolutionarychange.pdf
Due to copyright restrictions, the data used in this lab is not the exact data from the journal articles. The data is estimated with the intention of showing students trends between seed and beak size. For higher-level students (honors or AP) you may have the students read the journal articles prior to this activity.
Thank you for your purchase!
Copyright ©2015 Science Rocks All rights reserved by author. Permission to copy for single classroom use only. Electronic distribution limited to single classroom use only. Not for public display.