PETE 411 Well Drilling
41
1 PETE 411 Well Drilling Lesson 20 Abnormal Pressure
description
PETE 411 Well Drilling. Lesson 20 Abnormal Pressure. Abnormal Pressure. Normal Pore Pressures Abnormal Pore Pressure Gradients Fracture Gradients Mud Weights Casing Seat Depths What Causes Abnormal Pressure? Detection of Abnormal Pressure - PowerPoint PPT Presentation
Transcript of PETE 411 Well Drilling
1
PETE 411
Well Drilling
Lesson 20
Abnormal Pressure

2
Abnormal Pressure
Normal Pore Pressures Abnormal Pore Pressure Gradients Fracture Gradients Mud Weights Casing Seat Depths What Causes Abnormal Pressure? Detection of Abnormal Pressure Quantification of Abnormal Pressure
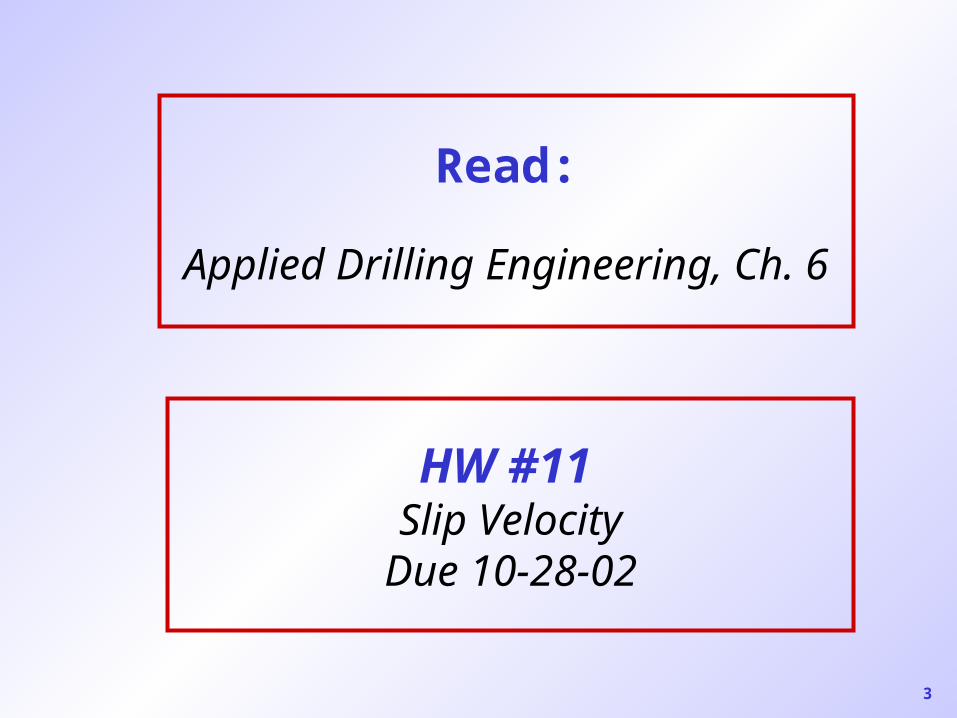
3
HW #11 Slip Velocity
Due 10-28-02
Read:
Applied Drilling Engineering, Ch. 6
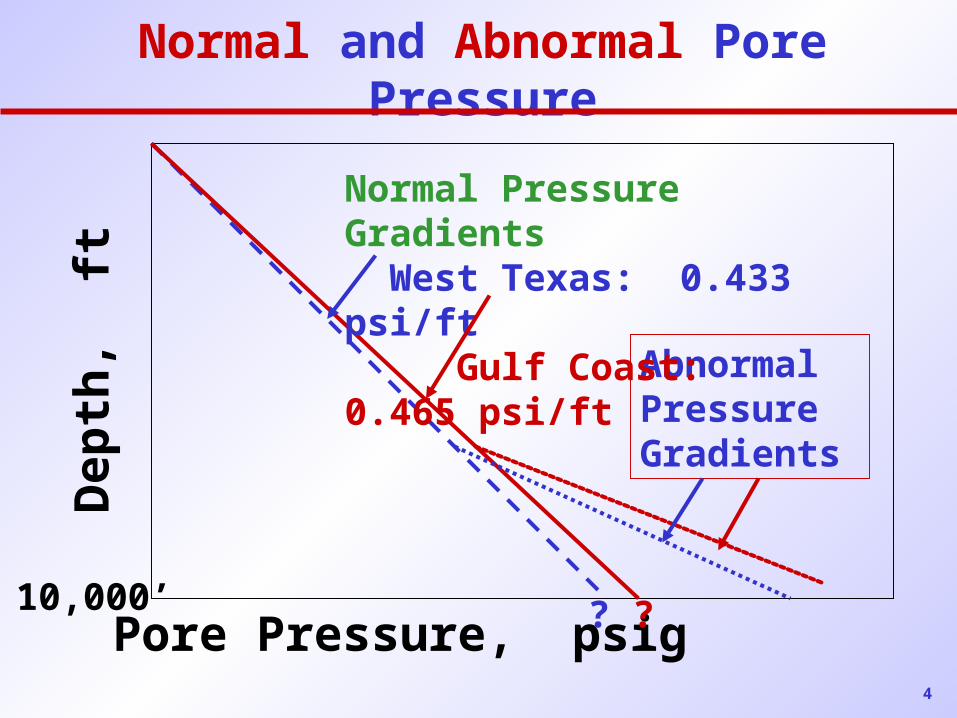
4
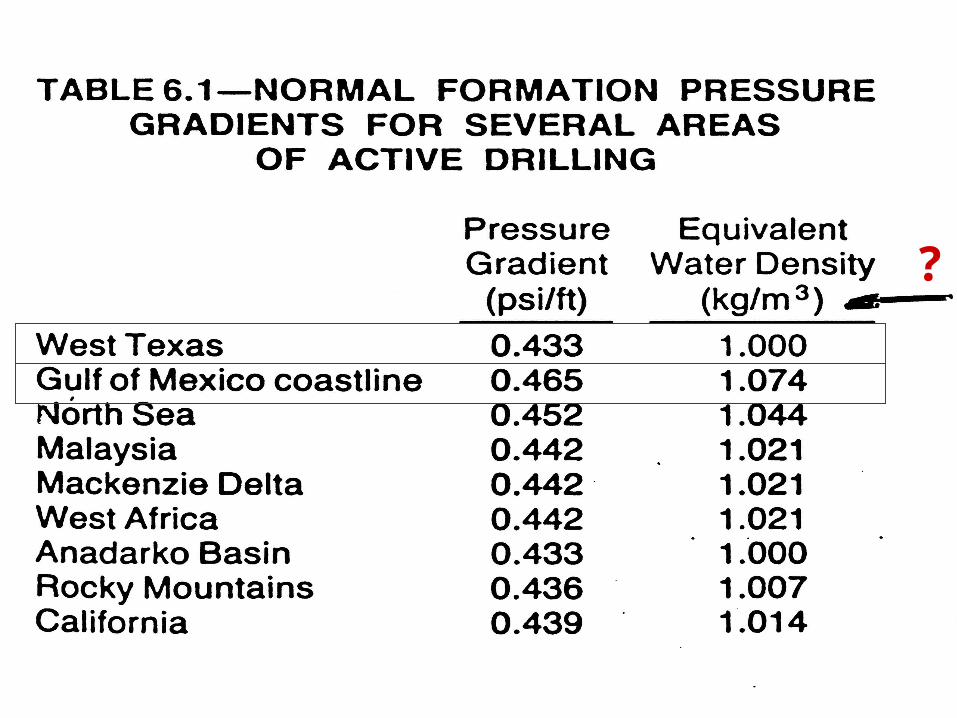
Abnormal Pressure Gradients
Normal Pressure Gradients West Texas: 0.433 psi/ft Gulf Coast: 0.465 psi/ft
Normal and Abnormal Pore Pressure
Pore Pressure, psig
Dep
th,
ft
10,000’ ? ?
5
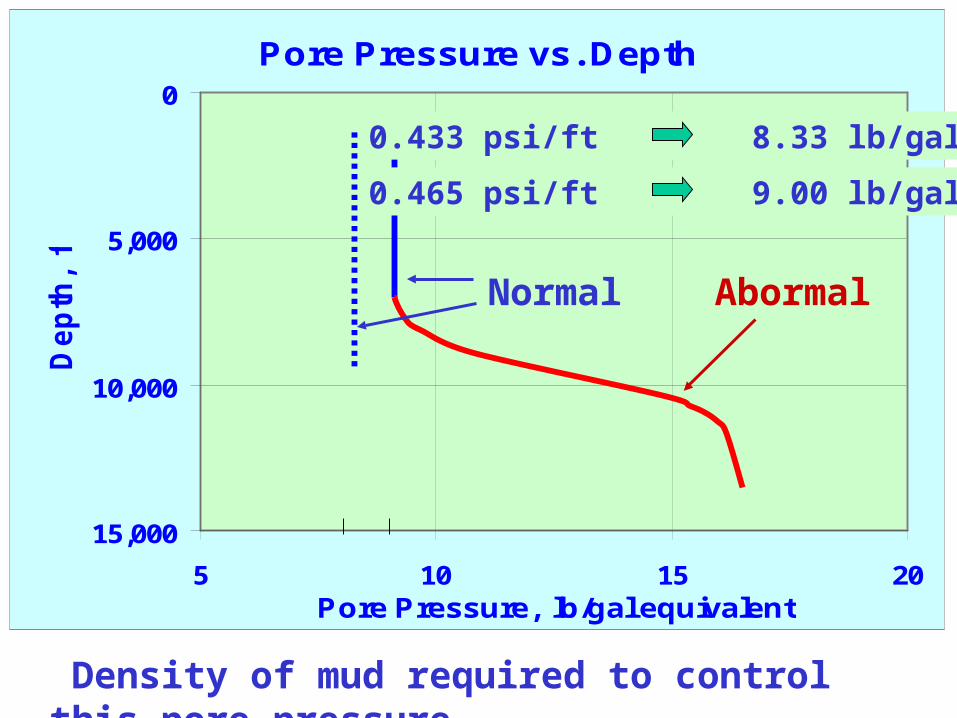
Pore Pressure vs. Depth0
5,000
10,000
15,000
5 10 15 20Pore Pressure, lb/gal equivalent
De
pth
, f
t
Normal Abormal
Density of mud required to control this pore pressure
0.433 psi/ft 8.33 lb/gal
0.465 psi/ft 9.00 lb/gal
6
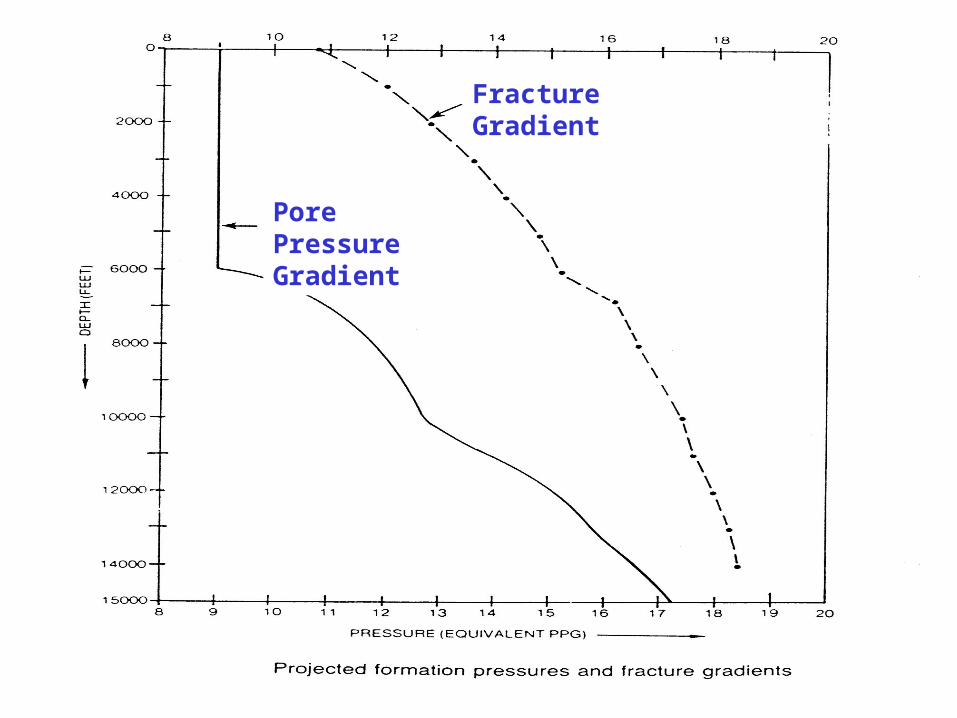
Pore Pressure Gradient
Fracture Gradient
7
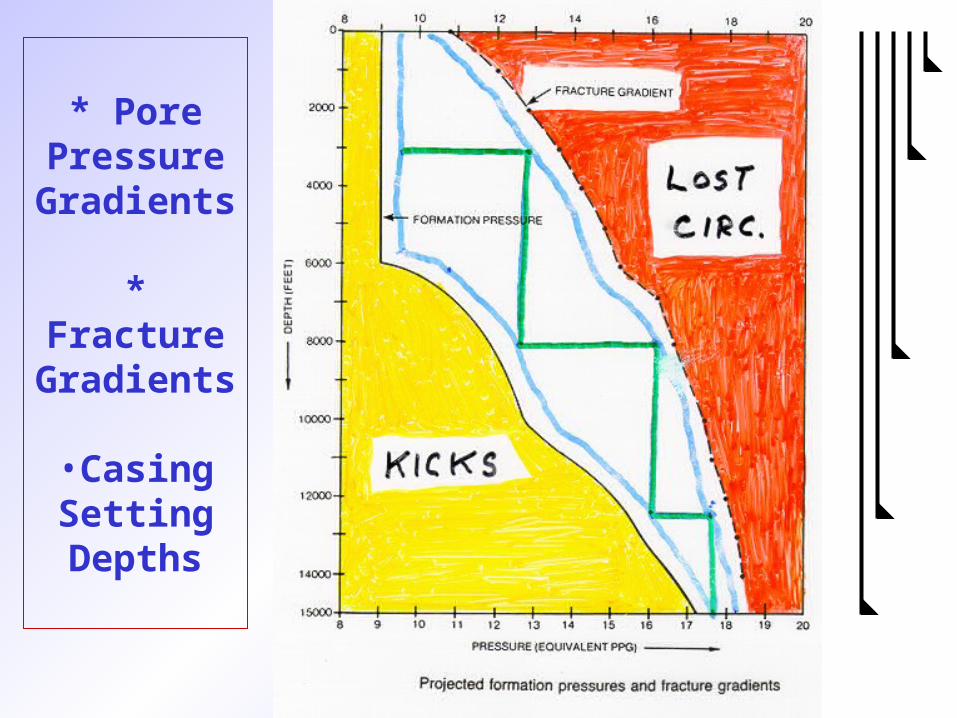
* Pore
Pressure Gradients
* Fracture Gradients
•Casing Setting Depths

8
Some Causes of Abnormal Pressure
1. Incomplete compaction of sediments Fluids in sediments have not
escaped and help support the overburden.
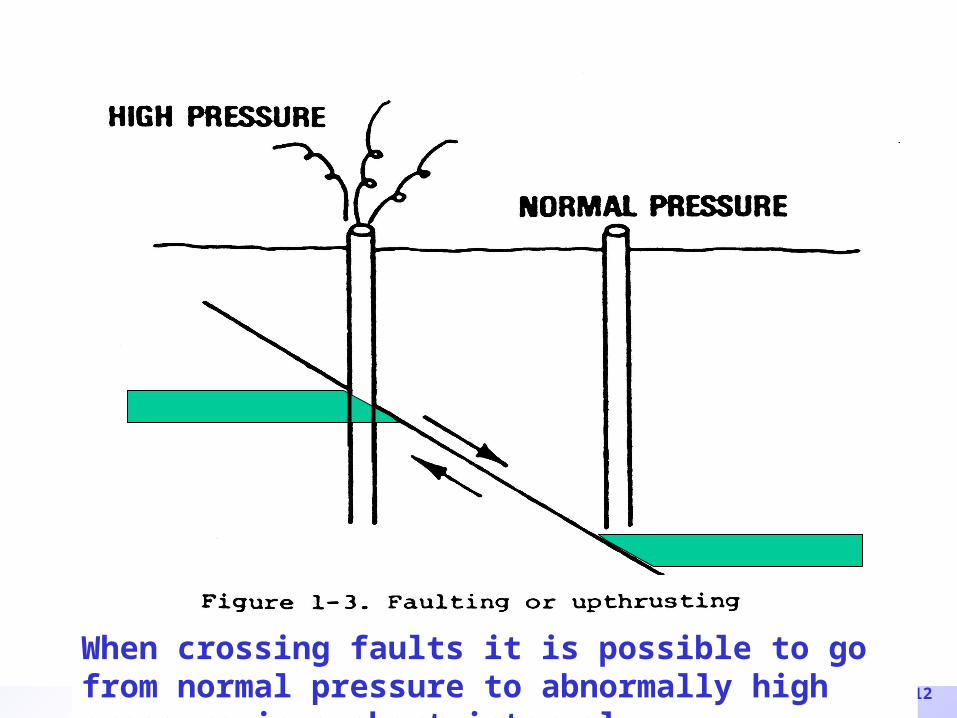
2. Tectonic movements
Uplift
Faulting

9
Some Causes of Abnormal Pressure
3. Aquifers in Mountainous Regions Aquifer recharge is at higher
elevation than drilling rig location.
4. Charged shallow reservoirs due to nearby underground blowout.
5. Large structures...
10
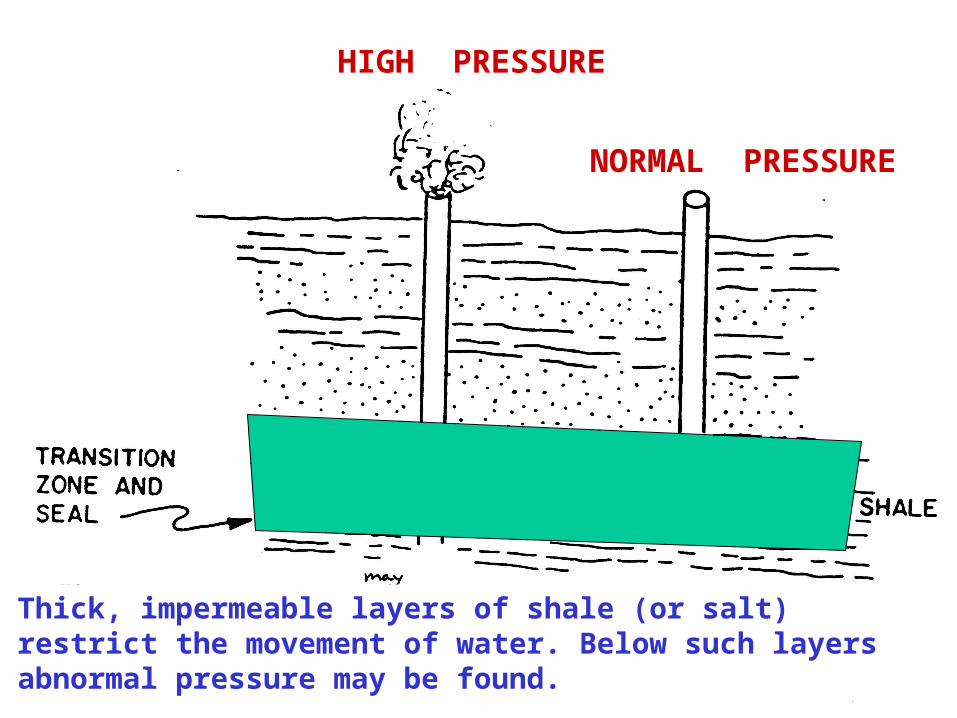
HIGH PRESSURE
NORMAL PRESSURE
Thick, impermeable layers of shale (or salt) restrict the movement of water. Below such layers abnormal pressure may be found.

11
HIGH PRESSURE
NORMAL PRESSURE
Hydrostatic pressure gradient is lower in gas or oil than in water.
12
When crossing faults it is possible to go from normal pressure to abnormally high pressure in a short interval.

13
Well “A” found only Normal Pressure ...
14
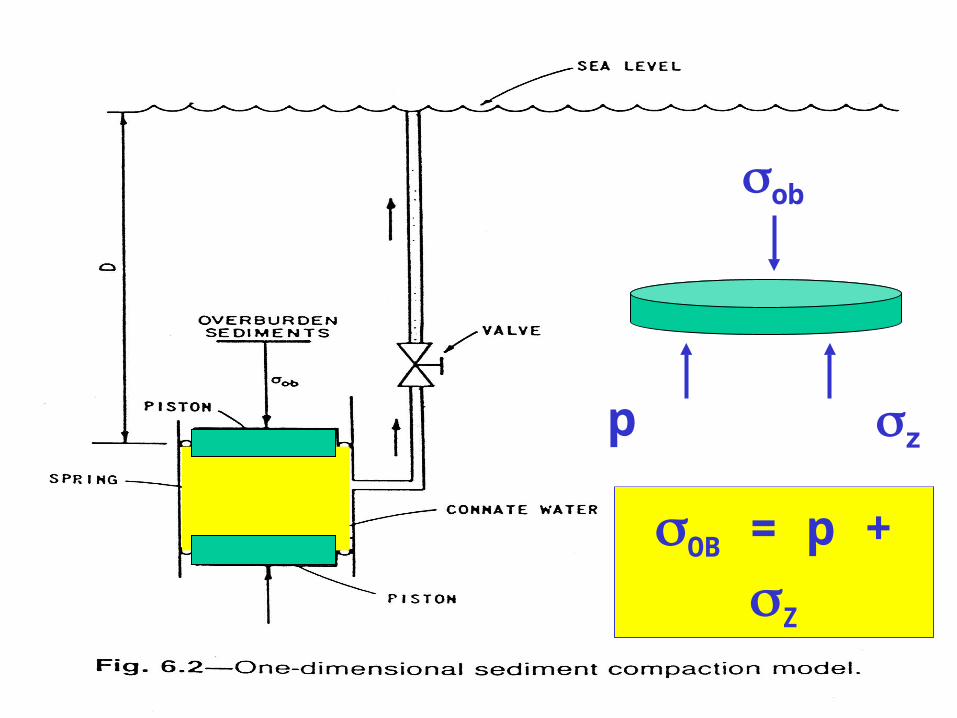
OB = p + Z
ob
pz
15
?
16
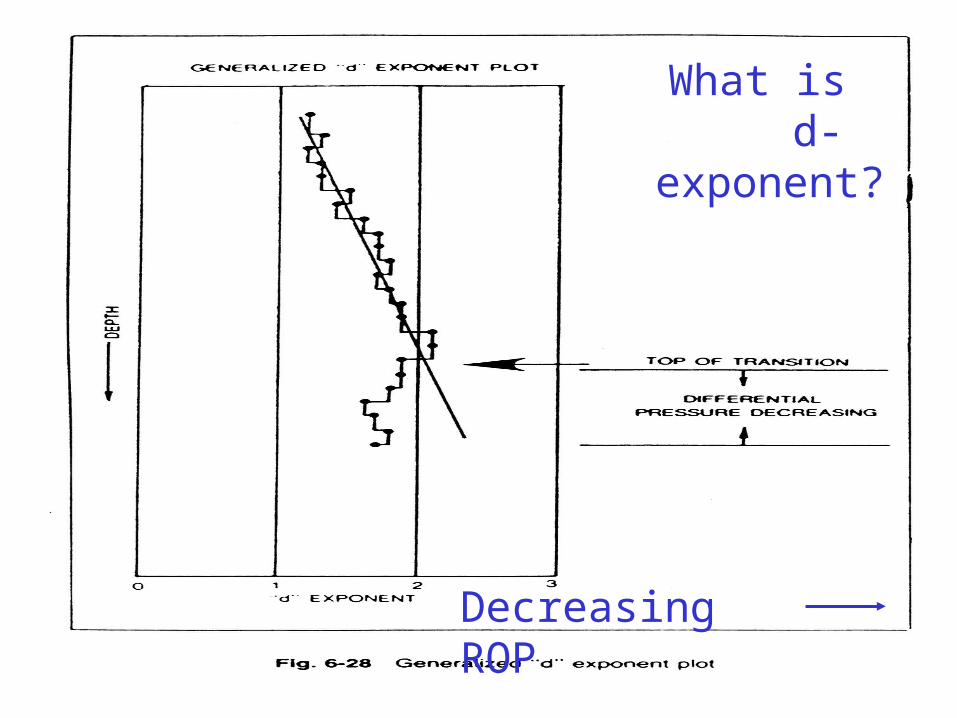
Abnormal Pressure cont’d
Detection of Abnormal Pore Pressures
Prediction of Abnormal Pore Pressures
D-Exponent
DC-Exponent
Example
Importance of Shale Density

17
Indications of Abnormal Pore Pressures
Methods:
1. Seismic data
2. Drilling rate
3. Sloughing shale
4. Gas units in mud
5. Shale density
6. Chloride content
18
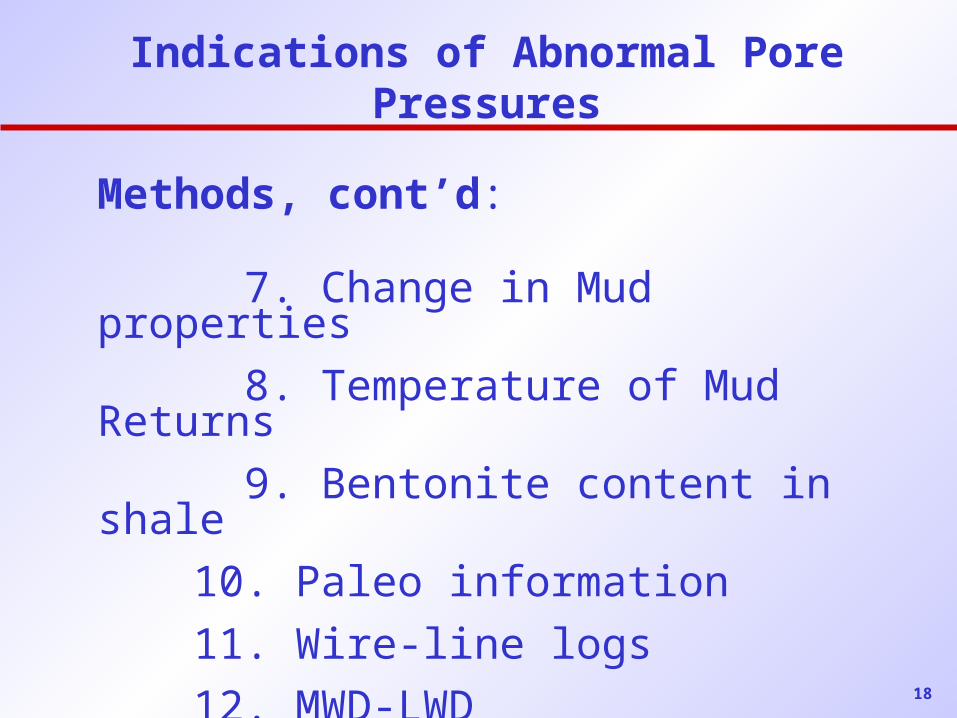
Indications of Abnormal Pore Pressures
Methods, cont’d:
7. Change in Mud properties
8. Temperature of Mud Returns
9. Bentonite content in shale
10. Paleo information
11. Wire-line logs
12. MWD-LWD
19
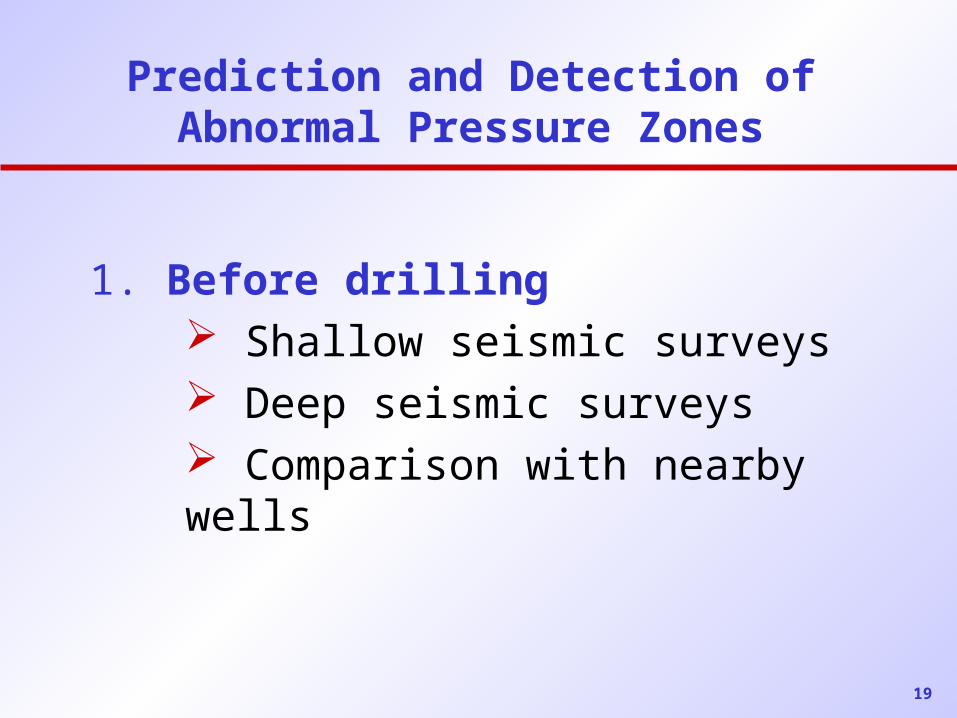
Prediction and Detection of Abnormal Pressure Zones
1. Before drilling Shallow seismic surveys Deep seismic surveys Comparison with nearby wells

20
Prediction and Detection of Abnormal Pressure Zones
2. While drilling Drilling rate, gas in mud, etc. etc. D - Exponent
DC - Exponent
MWD - LWD Density of shale (cuttings)
21
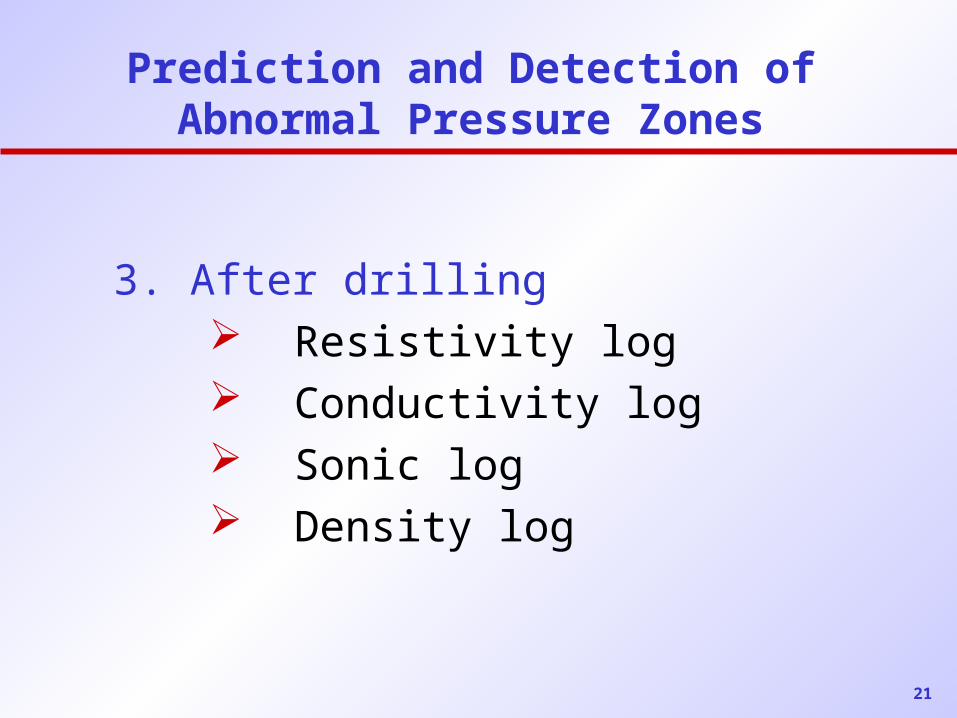
Prediction and Detection of Abnormal Pressure Zones
3. After drilling Resistivity log Conductivity log Sonic log Density log
22
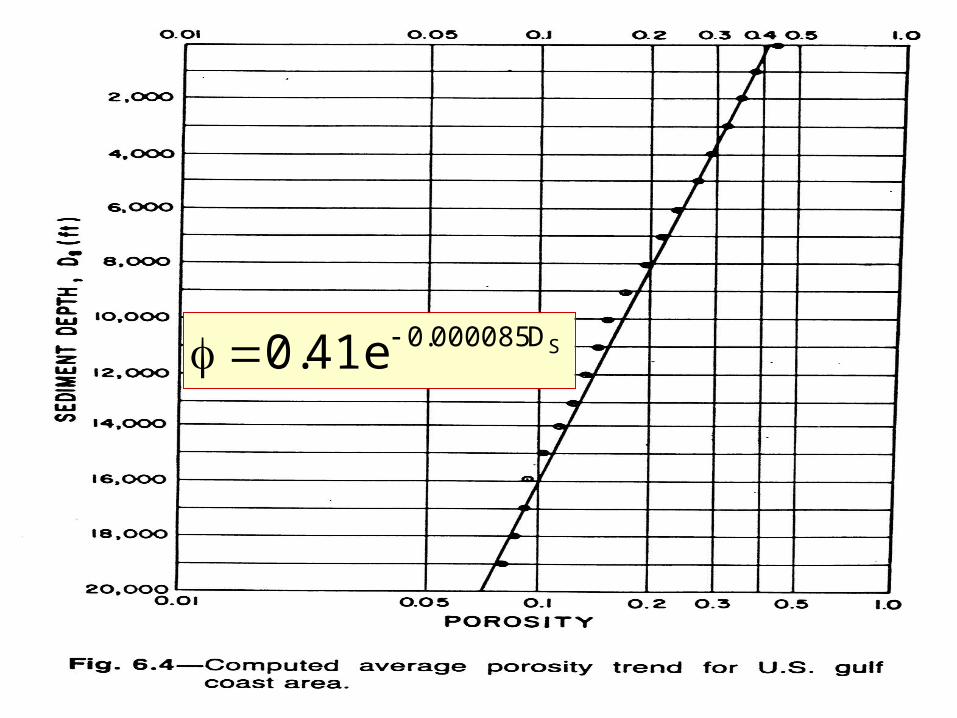
. – . SD000085.0e41.0
23
24
Decreasing ROP
What is d-exponent?

25
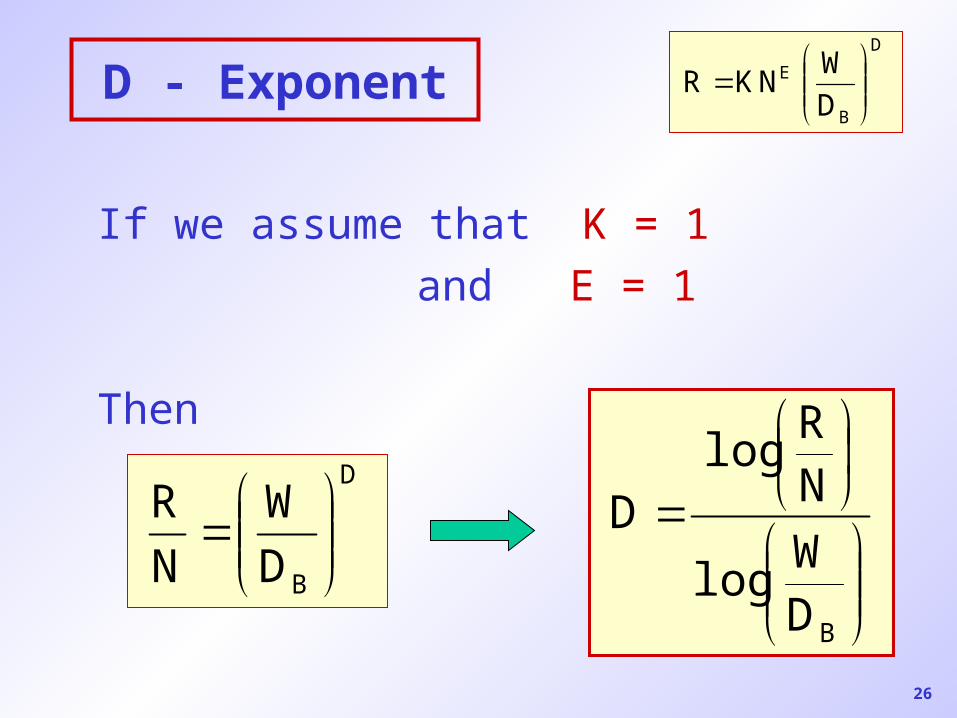
D - Exponent
The
drilling rate
equation:
Where
R = drilling rate, ft/hr
K = drillability constant
N = rotary speed, RPM
E = rotary speed expon.
W = bit weight, lbs
DB = bit diameter, in
D = bit wt. Exponent
or D - exponent
D
B
E
D
WNKR
26
D - Exponent
If we assume that K = 1
and E = 1
Then
D
B
E
D
WNKR
BDW
log
NR
logD
D
BD
W
N
R
27
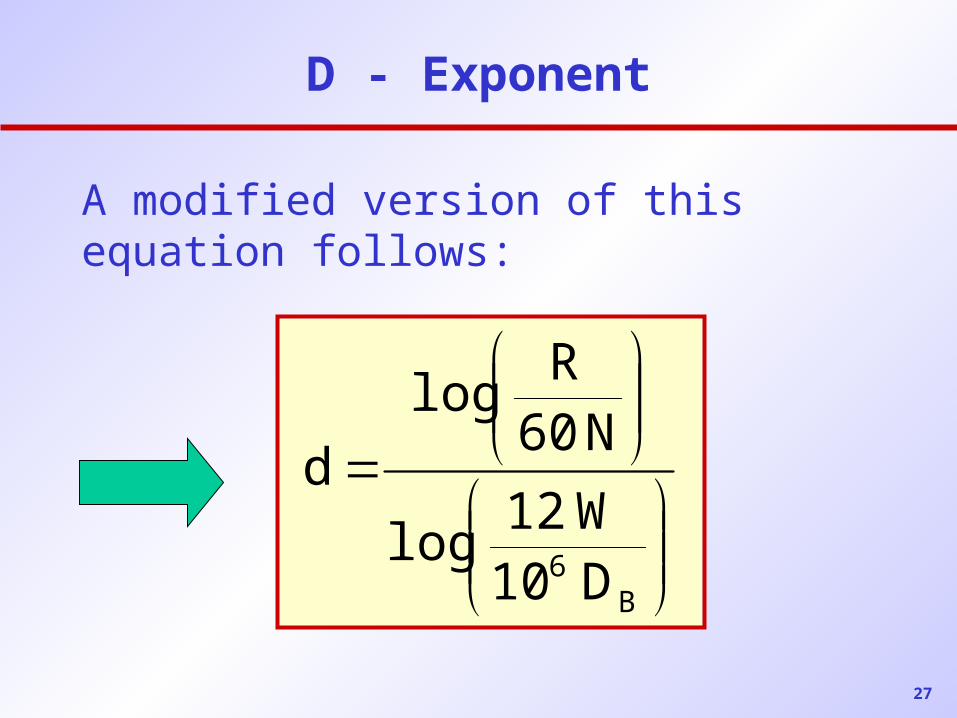
D - Exponent
A modified version of this equation follows:
B6 D10W12
log
N60R
log
d
28
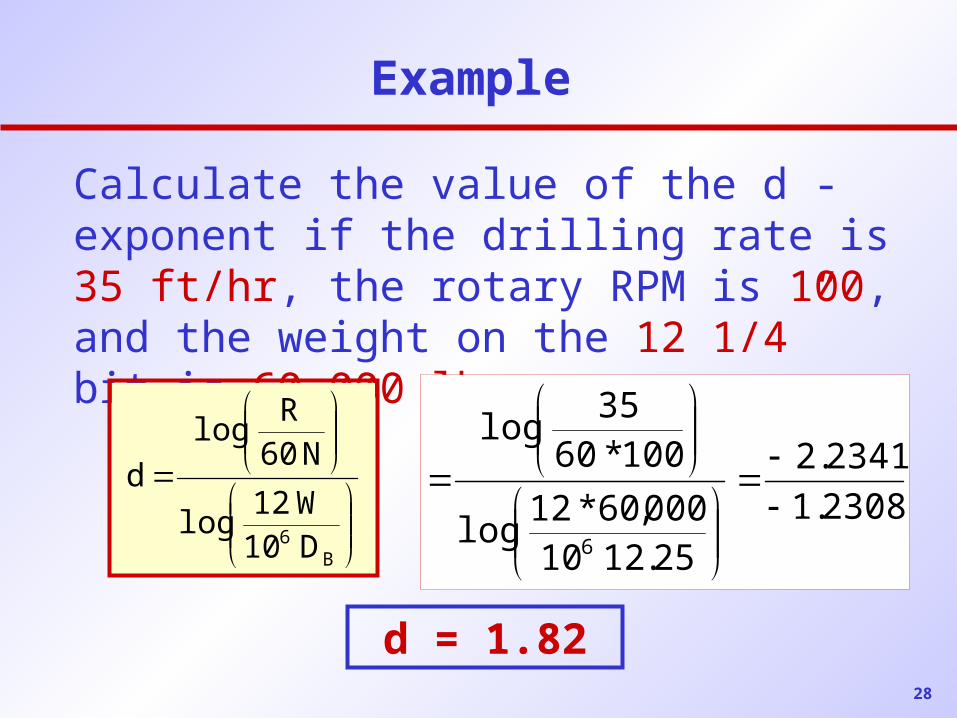
Example
Calculate the value of the d - exponent if the drilling rate is 35 ft/hr, the rotary RPM is 100, and the weight on the 12 1/4” bit is 60,000 lbs.
B6 D10W12
log
N60R
log
d2308.1
2341.2
25.1210000,60*12
log
100*6035
log
6
d = 1.82
29
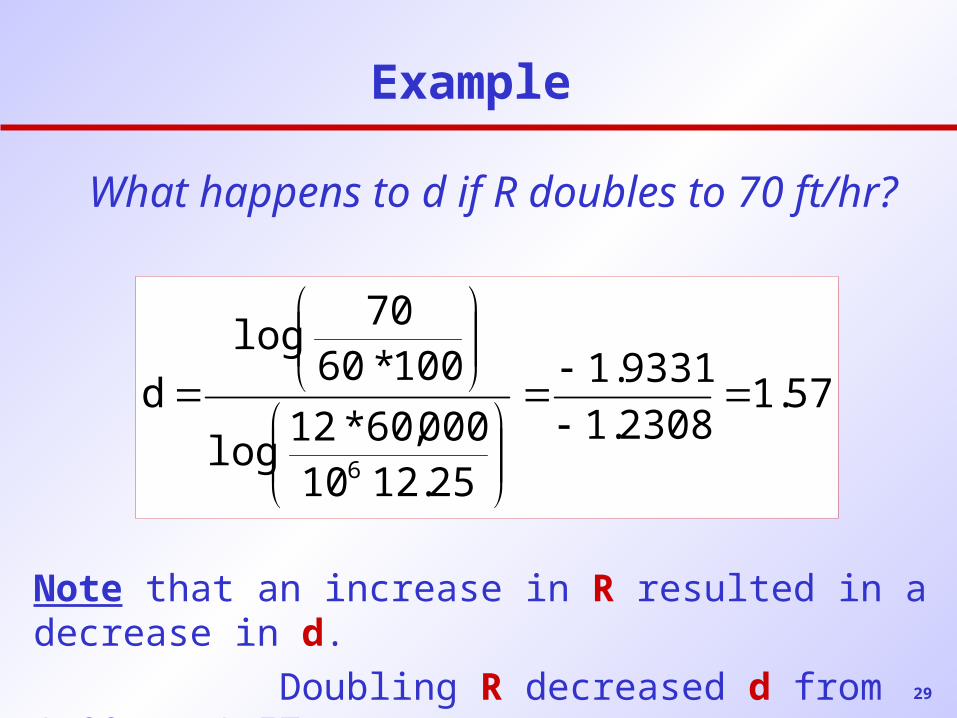
Example
What happens to d if R doubles to 70 ft/hr?
Note that an increase in R resulted in a decrease in d.
Doubling R decreased d from 1.82 to 1.57
57.12308.1
9331.1
25.1210000,60*12
log
100*6070
log
d
6

30
Example
d may be Corrected for density as follows
)ppg(useinweightmudactual
)ppg(gradientnormalforweightmudddc
37.112
9*82.1
12
9dd.,g.e c
31
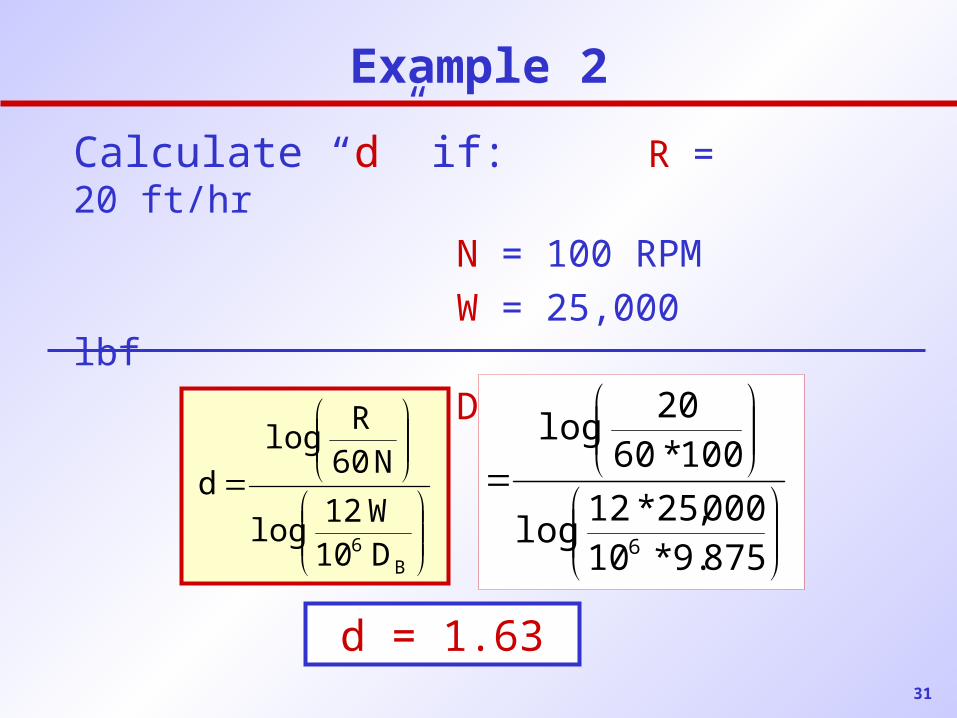
Example 2
Calculate “d” if: R = 20 ft/hr
N = 100 RPM
W = 25,000 lbf
DB = 9 7/8 in
875.9*10000,25*12
log
100*6020
log
6
B6 D10W12
log
N60R
log
d
d = 1.63
32
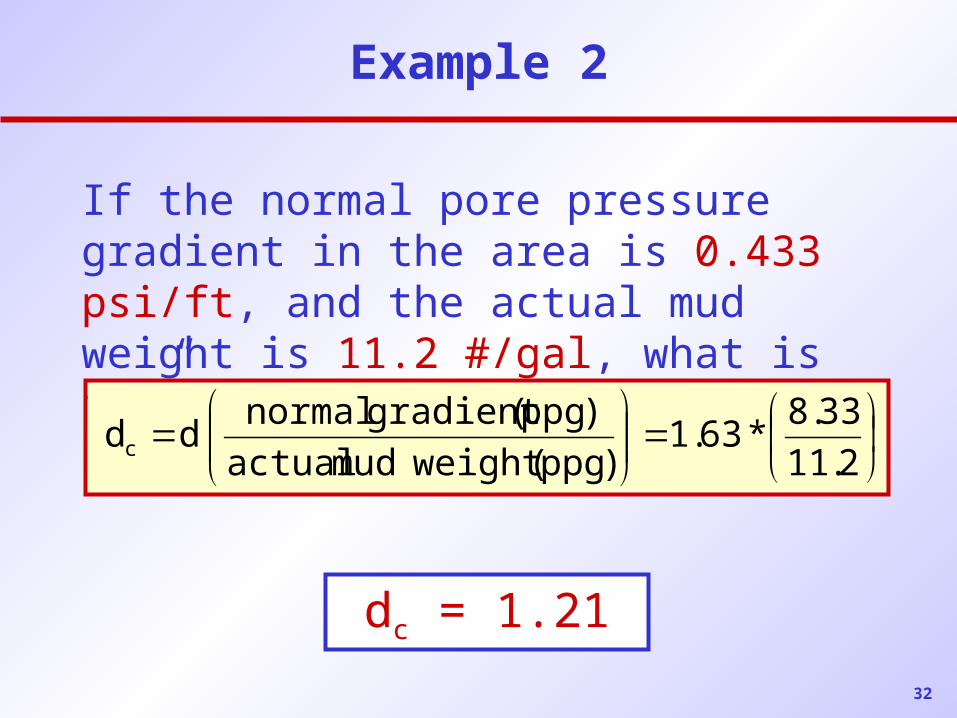
Example 2
If the normal pore pressure gradient in the area is 0.433 psi/ft, and the actual mud weight is 11.2 #/gal, what is “dc”?
2.11
33.8*63.1
)ppg(weightmudactual
)ppg(gradientnormalddc
dc = 1.21
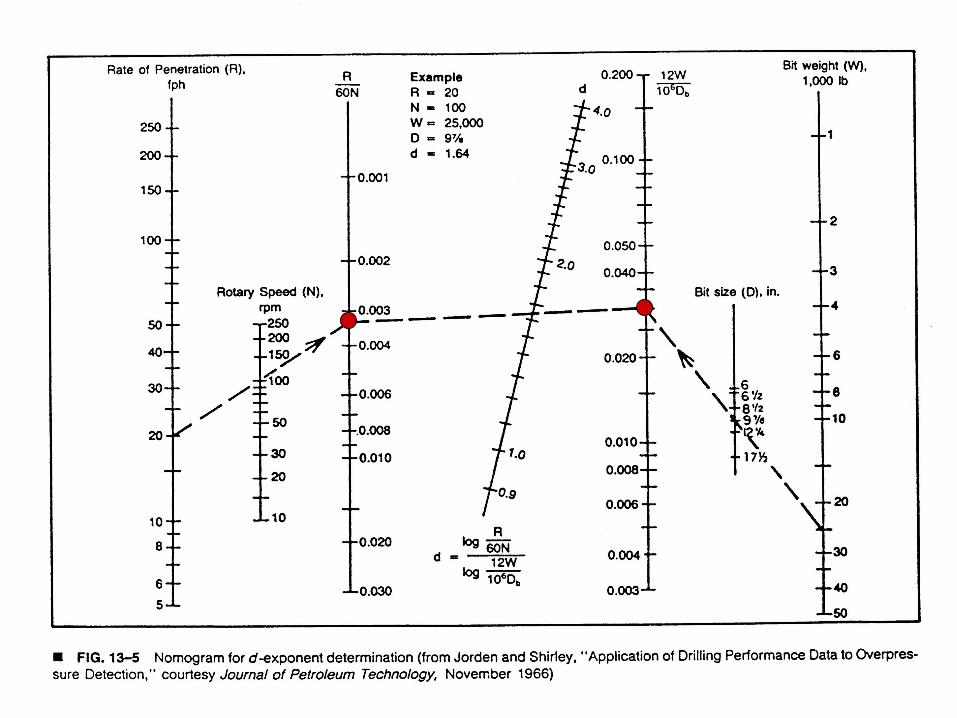
33

34
Procedure for Determining Pore Pressure From dc - Exponent
Calculate dc over 10-30 ft intervals
Plot dc vs depth (use only date from Clean shale sections)
Determine the normal line for the dc vs. depth plot.
Establish where dc deviates from the normal line to determine abnormal pressure zone
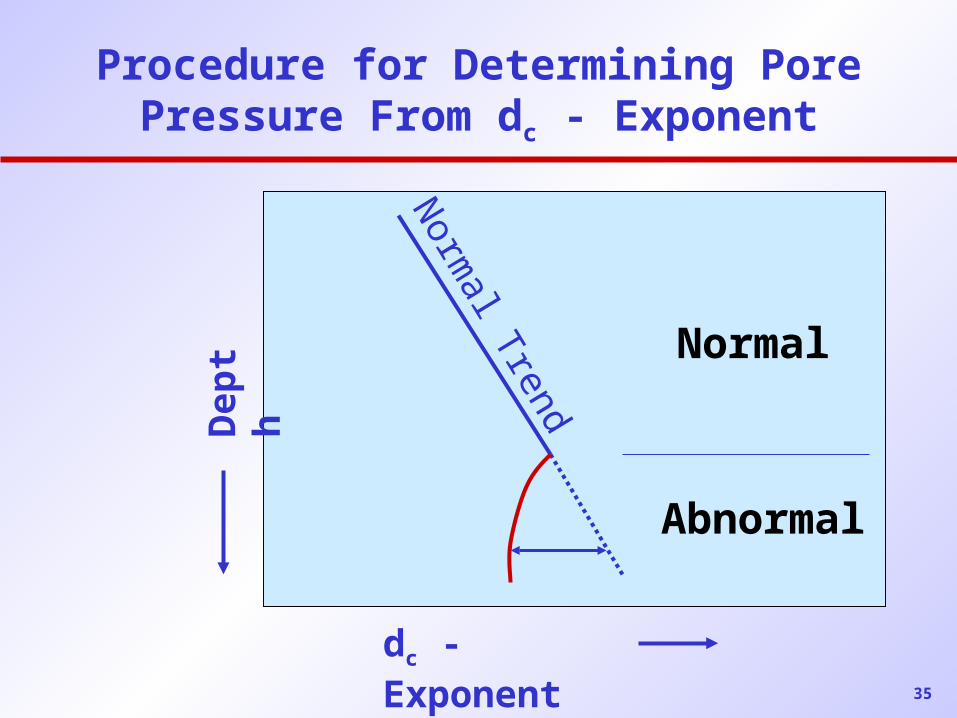
35
Procedure for Determining Pore Pressure From dc - Exponent
dc - Exponent
Dep
th Normal
AbnormalN
ormal Trend
36
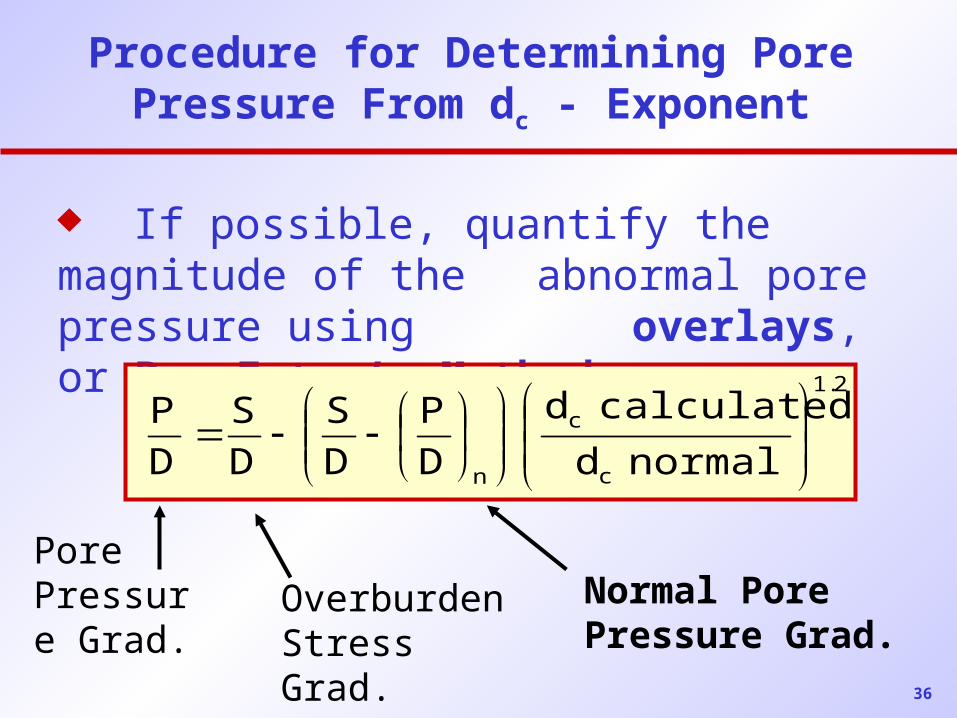
Procedure for Determining Pore Pressure From dc - Exponent
If possible, quantify the magnitude of the abnormal pore pressure using overlays, or Ben Eaton’s Method
Pore Pressure Grad.
Overburden Stress Grad.
Normal Pore Pressure Grad.
2.1
c
c
n normald
calculatedd
D
P
D
S
D
S
D
P
37
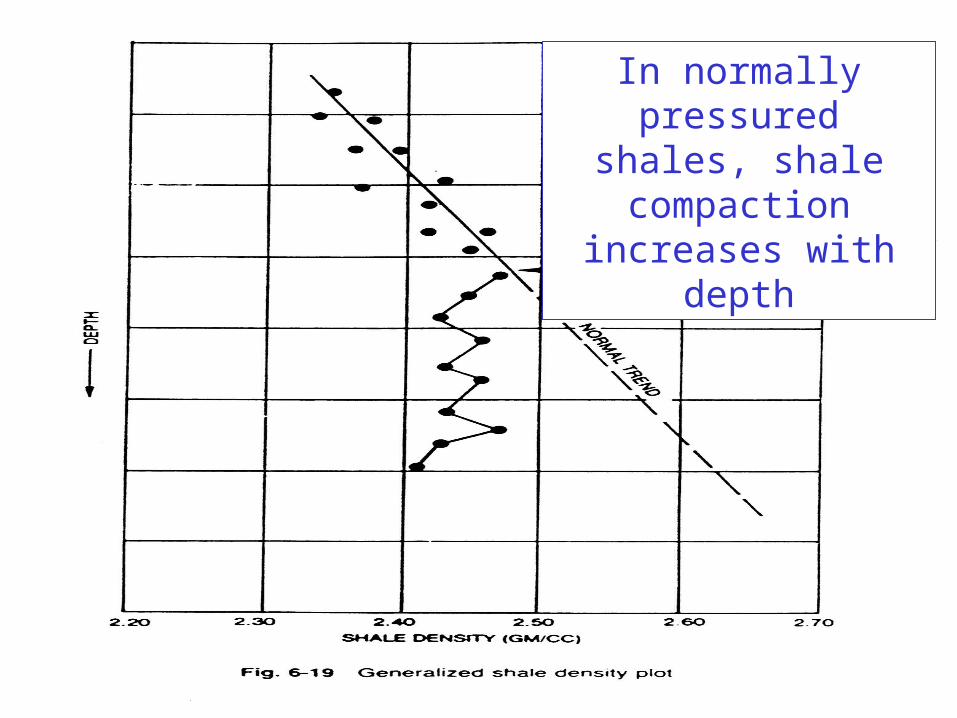
In normally pressured shales, shale
compaction increases with depth
38
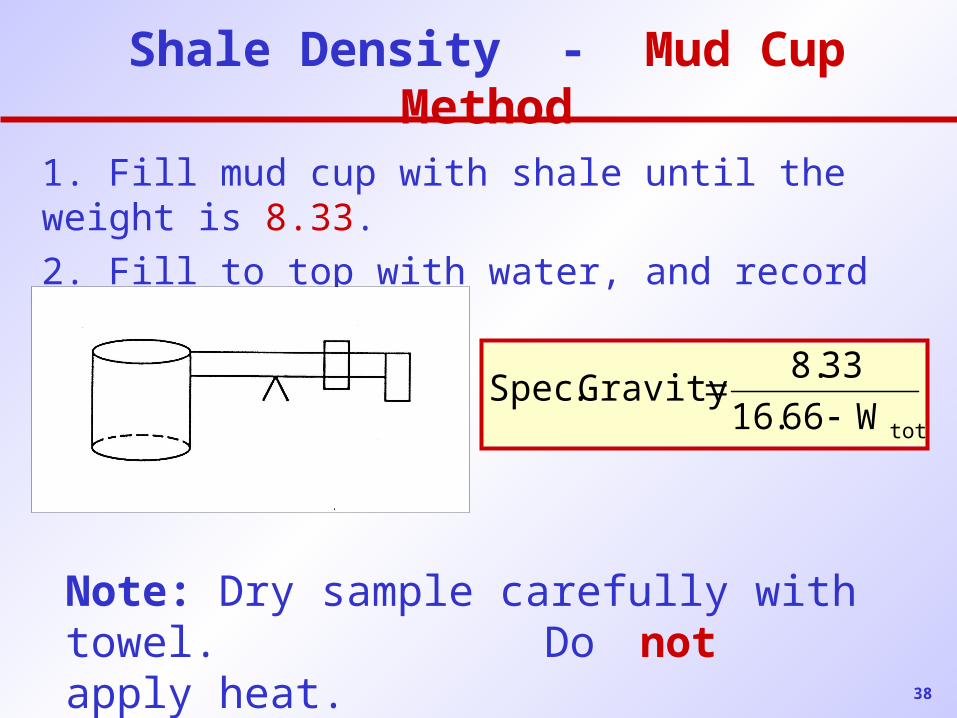
Shale Density - Mud Cup Method
1. Fill mud cup with shale until the weight is 8.33.
2. Fill to top with water, and record the reading Wtot.
Note: Dry sample carefully with towel. Do not apply heat.
totW66.16
33.8Gravity.Spec
39
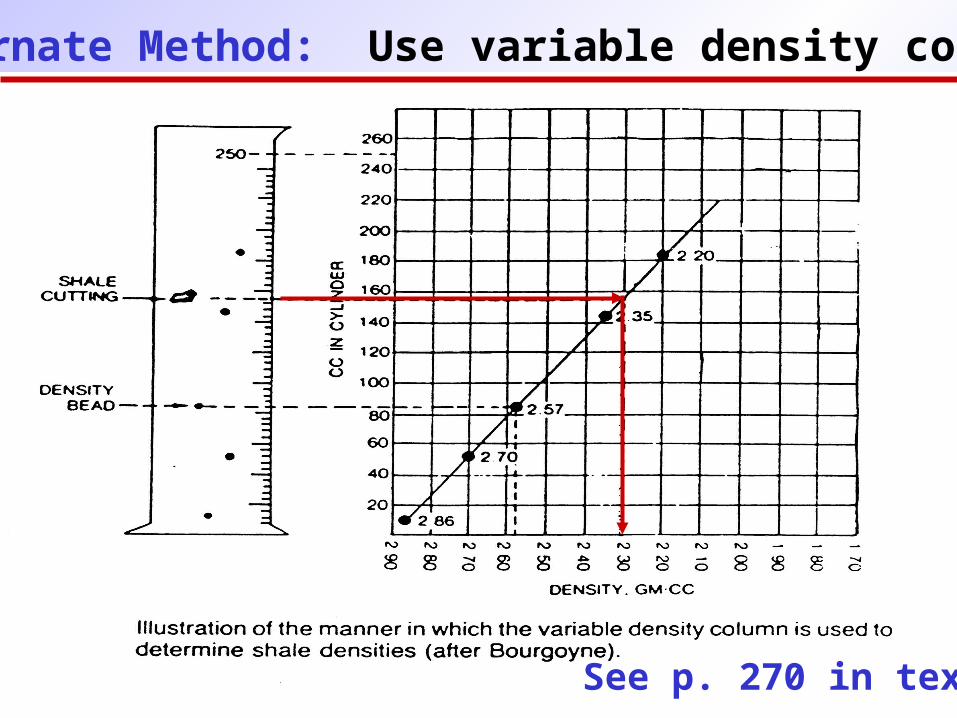
Alternate Method: Use variable density column.
See p. 270 in text
40
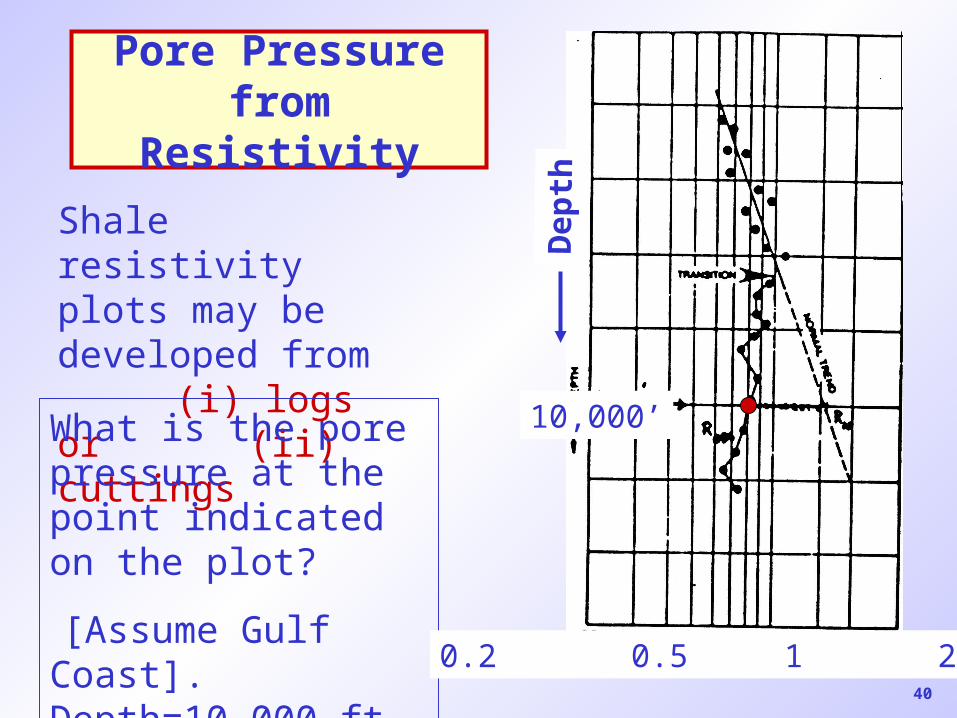
Pore Pressure from Resistivity
Shale resistivity plots may be developed from (i) logs or
(ii) cuttings
What is the pore pressure at the point indicated on the plot?
[Assume Gulf Coast]. Depth=10,000 ft
0.2 0.5 1 2 3
10,000’
Dep
th
41
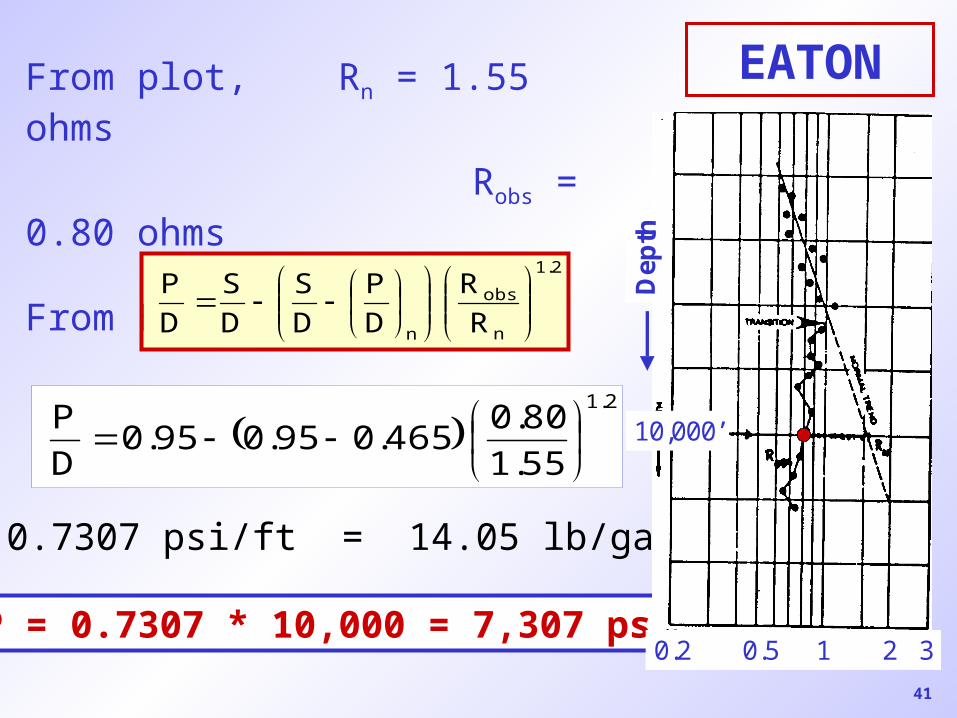
From plot, Rn = 1.55 ohms
Robs = 0.80 ohms
From Eaton:
EATON
2.1
n
obs
n R
R
D
P
D
S
D
S
D
P
2.1
55.1
80.0465.095.095.0
D
P
= 0.7307 psi/ft = 14.05 lb/gal
P = 0.7307 * 10,000 = 7,307 psi 0.2 0.5 1 2 3
10,000’
Dep
th