Peru Retail Foods 2011 - USDA GAIN Publications/Retail Foods... · partner before signing permanent...
21
THIS REPORT CONTAINS ASSESSMENTS OF COMMODITY AND TRADE ISSUES MADE BY USDA STAFF AND NOT NECESSARILY STATEMENTS OF OFFICIAL U.S. GOVERNMENT POLICY Date: GAIN Report Number: Approved By: Prepared By: Report Highlights: In 2010, Peru’s total food retail market reached $18 billion, 80 percent of which is concentrated in Lima. Supermarket chains reached almost $2.5 billion in food sales, a 12 percent increase from 2009. Food sales by these supermarket chains accounted for 30 percent of the retail market share in Lima in 2010, which is considered to be low in comparison with neighboring Latin American countries. The implementation of the U.S. - Peru Trade Promotion Agreement, supported by favorable market conditions in Peru, has and will continue to have a significant impact on U.S. food exports for the retail market. Alvaro Loza Emiko Purdy 2011 Retail Foods Peru 12/22/2011 Required Report - public distribution
Transcript of Peru Retail Foods 2011 - USDA GAIN Publications/Retail Foods... · partner before signing permanent...

THIS REPORT CONTAINS ASSESSMENTS OF COMMODITY AND TRADE ISSUES MADE BY
USDA STAFF AND NOT NECESSARILY STATEMENTS OF OFFICIAL U.S. GOVERNMENT
POLICY
Date:
GAIN Report Number:
Approved By:
Prepared By:
Report Highlights:
In 2010, Peru’s total food retail market reached $18 billion, 80 percent of which is concentrated in
Lima. Supermarket chains reached almost $2.5 billion in food sales, a 12 percent increase from
2009. Food sales by these supermarket chains accounted for 30 percent of the retail market share
in Lima in 2010, which is considered to be low in comparison with neighboring Latin American
countries. The implementation of the U.S. - Peru Trade Promotion Agreement, supported by
favorable market conditions in Peru, has and will continue to have a significant impact on U.S.
food exports for the retail market.
Alvaro Loza
Emiko Purdy
2011
Retail Foods
Peru
12/22/2011
Required Report - public distribution
Post:
Executive Summary:
Section I. Market Summary
Peru has demonstrated to the world its economic stability and continuous growth within the region,
even during times of world financial crisis. Peru posted impressive results in 2010, such a GDP of
8.8 percent -proof that Peru’s economy is highly dynamic, driven mostly by private investment,
foreign trade, and domestic demand. The commercial sector appears amongst the sectors that
have contributed the most to this growth.
Last year South America survived the recession better than most regions and posted an impressive
6 percent GDP growth. Peru led the list of best performing economies and was one of the
countries least affected by the 2008 crisis.
Peru’s good economic position has also been validated by the World Bank’s ranking of Peru as
36 of 183 economies in its 2011 Ease of Doing Business report, gaining 10 positions in
comparison with 2010 as a result of introducing positive reforms in 4 categories. Peru's strength
lies in its sound regulations although the amount of red tape is still relatively high despite the
aforementioned improvements.
Similarly, credit rating agencies as Standard and Poor, Fitch and Moody’s, acknowledge the good
fiscal and economic performance of the country, placing it amongst the economies that are certain
to comply with their obligations.
Fostered by higher levels of employment, income and consumption, Peru’s retail market exhibits a
large list of opportunities for consumer goods. Peru has experienced a spectacular growth in the
modern retail channel in the last ten years. This year A.T. Kearney’s ranking included Peru
amongst the 10 favorite emerging countries for retail investment, based on its low retail
penetration and average young age of consumers (26 years old).
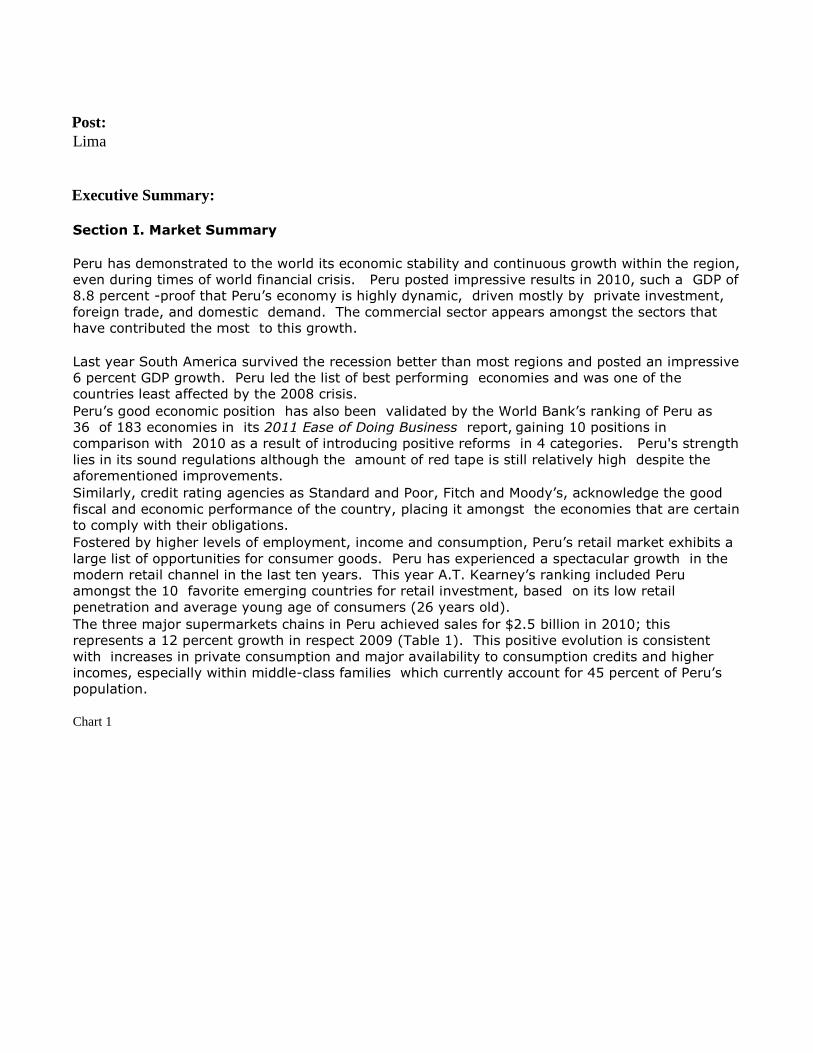
The three major supermarkets chains in Peru achieved sales for $2.5 billion in 2010; this
represents a 12 percent growth in respect 2009 (Table 1). This positive evolution is consistent
with increases in private consumption and major availability to consumption credits and higher
incomes, especially within middle-class families which currently account for 45 percent of Peru’s
population.
Chart 1
Lima

Source: Skotiabank Economic Department
There were 156 stores (all formats included) by the end of 2010, with 121 in Lima and 35 in the
provinces. The results obtained outside of the capital have gone beyond any expectation.
Supermarkets have founded their success on identifying and developing new market segments,
which will eventually help them gain more terrain in the future.
Despite how well the modern retail channel may have advanced in its expansionist phase, the
traditional market (convenience stores, grocery stores or “bodegas”) remains to be the main
channel for distributors, wholesalers, etc. As 75 percent of food retails sales occur within the
traditional market, companies often have to consider their strategies for traditional channels.
Even though some experts predict that traditional channels will reduce their presence or even
disappear due to the growth of modern retail channels, grocery store sales are increasing. It is
estimated that this year, the average ticket will increase by 9 percent in grocery and average
receipt in the traditional market may increase 9 percent also.
Consumption in 2010 increased by 3.8 percent, with increases in both the traditional channel (2.9
percent) and the modern channel (7.8 percent). Also, supermarkets are gaining more preference
among consumers, which is why beverage and food sales have increased by 10 and 8 percent,
respectively. Local consumers are motivated by good prices and prefer to purchase assorted
products such as yogurt, packaged bread, oil, noodles, etc., at modern retail channels. The
traditional channel is still the preferred channel for beverages. Nevertheless, both channels offer
products that are sharply different in terms of presentation.
The lack of large spaces in Lima is becoming a real concern to supermarket chains. It is expected
that supermarkets will open about 25 stores per year. However, this obstacle, plus higher prices
for land within commercial areas create a window to new smaller formats (less than 1,000 square
meters) which not only might be a solution to keep a higher penetration but can be used also as a
mean to gain market share from convenience store.
It is known that Peruvian food retail markets have become attractive to foreign investors.
Recently, the Chilean group Saieh, which operates 350 supermarket stores and wholesaler formats
in Chile, acquired Alvi supermarkets (third largest player in the wholesaler segment in Chile). Alvi
supermarket acquired Mayorsa in Peru a few years ago, allowing the Saieh group to enter the
Peruvian market using the same strategy as they did in Chile. The Saieh Group is planning to
operate with its main brand Supermercados Unimarc (SMU) in the retail channel. In addition, SMU
already handles 11 Mayorsa stores. SMU’s last acquisition was the home appliances chain, La
Curacao, which already owned supermarket stores in Piura and Ica. SMU’s plan is to build at least
75 outlets in five years. However, their long-term strategy must differ from what they do in Chile
and success will be determined by their ability to develop innovative and new formats that can be
used for unexplored segments.

While Chilean supermarkets have made the first step entering Peruvian retail market, other large
players, such as Wal-Mart, are expected to also enter the market. In 2009, Wal-Mart acquired the
largest Chilean food retailer company D&S (D&S has more than 180 stores, 10 shopping centers
and 85 Presto financial services branches) which also owned 35 percent of Alvi's supermarket chain
and is also Mayorsa's main shareholder. After D&S acquisition, Wal-Mart had the intention to
enter Peru’s retail sector using D&S’s format known as “A Cuenta” but it did not happen at the
end. Subsequently it was speculated that Wal-Mart Mexico would be the company that would
enter Peru. However, it did not happen and Mayorsa was sold to the Saieh group, ending Wal-
Mart’s opportunity to start operating in the country.
Other players that have demonstrated their interest in Peruvian market are Almacenes Exito S.A.
from Colombia, Corporacion Favorita and Importadora el Rosado, both from Ecuador, and the
supermarket chain Ketal from Boliva.
According to Peru’s customs data, total agricultural imports to Peru from United States grew to
$787 million in 2010, up 41 percent from the 2009 level. Moreover, consumer oriented products
reached $107 million in 2010 growing 81 percent in respect 2009. The United States became the
second largest supplier of consumer oriented products, accounting the 14 percent of the market
share which has certainly decreased the reach of Chile and has left Colombia as the third largest
supplier of this category.
In 2010, Peru’s total food retail market reached $18 billion, 80 percent of which is concentrated in
Lima. Supermarket chains reached almost $2.5 billion in food sales, a 12 percent increase from
2009. Food sales by these supermarket chains accounted for 30 percent of the retail market share
in Lima in 2010, which is considered to be low in comparison with the neighboring Latin American
countries.
Retail Sales in Country by Sub-Sector (million dollars)
Sub-Sector 2008 2009 2010
Supermarkets and hypermarkets 1,800 2,216 2,483
Traditional Channel (grocery stores,
wet markets, convenient stores, etc.) 8,720 14,428 15,520
Total 10,520 16,644 18,002 Source: Post Estimated values
Lima is the major market for consumer-oriented foods. Lima’s roughly 9 million inhabitants
account for almost one-third of Peru’s total population and more than 60 percent of the national
income.
The U.S. – Peru Trade Promotion Agreement (PTPA) provided duty free access for two-thirds of
U.S. food and agricultural products. PTPA, supported by favorable market conditions in Peru, will
create opportunities to expand U.S. food exports in the retail market for snacks, fruit and
vegetable juices, fresh fruits (especially pears, apples and grapes), canned fruits and vegetables,
dairy products (especially cheeses), beef and poultry meats and their products, wines and liquors
and pet foods.
Advantages and Challenges Facing U.S. Products in Peru
Advantages
Challenges
1. Peru TPA grants duty free access to
two-thirds of U.S. food and
agricultural products, including most
high-value foods.
2. Proactive supermarket industry that
will result in increased demand for
high-value products.
3. Supermarket sales are growing fast,
mainly through the opening of new
outlets in the suburbs of Lima and
other cities.
4. Appreciation for U.S. food quality and
culture.
5. Growing perception of retail outlets
as cleaner, more convenient and
time saving than traditional markets.
6. People are becoming aware of diet,
lite, and healthy food products
through the media.
7. Income growth, especially of middle-
class.
8. More competitors are expected in the
market. Traditional retail channel
(convenient stores and open
markets) is improving its strategy
1. Consumers have a preference for buying
fresh products in traditional markets.
2. Supermarkets, the main source of
imported food products, account for only
30 percent of retail market share in Lima
and 14 percent in the country.
3. New local food brands are appearing in
the market at very low prices.
4. Supplies in the Provinces still depend on
companies that are based in Lima.
5. Lack of brand awareness among
consumers.
6. A government-promoted campaign called
“Buy Peruvian.”
7. Traditional markets strongly dominate
retail sales in secondary cities.
8. Domestic Producers1
1 The boom of the Peruvian economy has not only benefited multinational food producers looking to export their products to Peru, but has also improved
the operating environment for domestic producers which, in many cases, are in a better position to offer products in line with Peruvian consumers’ tastes and at lower prices than imported food products.
Section II. Road Map for Market Entry
1. Entry Strategy
Supermarket chains are constituted to be the main market for imported food products
whose target customers are high and middle-income consumers. U.S. exporters should
contact large importers, wholesalers/distributors or supermarkets directly.
U.S. exporters can approach Gas Marts, grocery and mom-and-pop stores through major
local suppliers (wholesalers/distributors).
Be diligent when selecting a partner (an agent or a representative) in Peru. Personal
visits/meetings are highly recommended. Conduct a background check of the prospective
partner before signing permanent contractual arrangement.
The local partner should be able to provide updated information on consumer trends to
identify niche markets, current market development (merchandising, point of sale and
promotion activities), and business practices.
1. Market Structure
Negotiating power of major supermarkets towards food suppliers is strong.
Suppliers to major supermarkets have wide range of distribution channels ranging from
those for fancy foods to those for foods for mass consumption.
Major food importers/distributors supply all major supermarket chains and provincial
retailers. It should be noted that major supermarket chains usually request product
exclusivity to new suppliers.
Food is primarily imported in mixed containers.
Major supermarket chains prefer to import expensive high-end products directly in order to
earn higher margins.
Distributors and wholesalers make constant in-store promotional activities. They count with
support personnel in every store and all distribution channels.
1. Supermarkets, Hypermarkets
A. Company Profiles
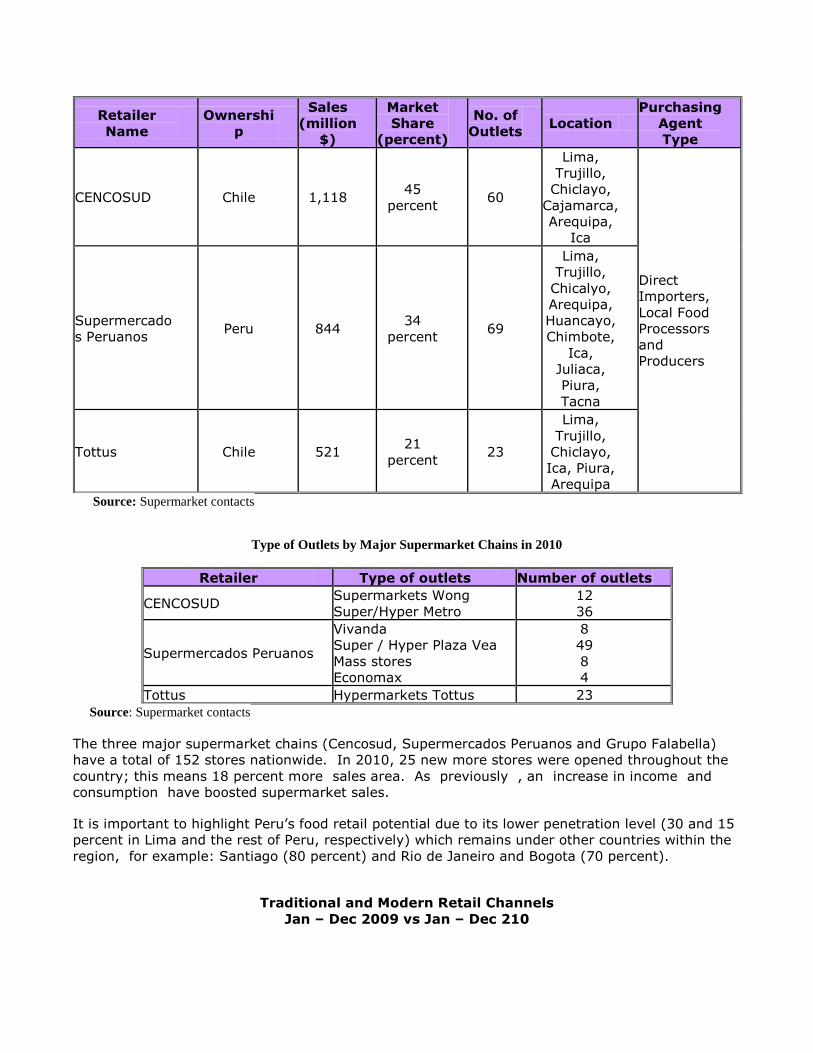
Profiles of Major Supermarkets Chains in 2010
Retailer
Name
Ownershi
p
Sales
(million
$)
Market
Share
(percent)
No. of
Outlets Location
Purchasing
Agent
Type
CENCOSUD Chile 1,118 45
percent 60
Lima,
Trujillo,
Chiclayo,
Cajamarca,
Arequipa,
Ica
Direct
Importers,
Local Food
Processors
and
Producers
Supermercado
s Peruanos Peru 844
34
percent 69
Lima,
Trujillo,
Chicalyo,
Arequipa,
Huancayo,
Chimbote,
Ica,
Juliaca,
Piura,
Tacna
Tottus Chile 521 21
percent 23
Lima,
Trujillo,
Chiclayo,
Ica, Piura,
Arequipa
Source: Supermarket contacts
Type of Outlets by Major Supermarket Chains in 2010
Retailer Type of outlets Number of outlets
CENCOSUD Supermarkets Wong
Super/Hyper Metro
12
36
Supermercados Peruanos
Vivanda
Super / Hyper Plaza Vea
Mass stores
Economax
8
49
8
4
Tottus Hypermarkets Tottus 23
Source: Supermarket contacts
The three major supermarket chains (Cencosud, Supermercados Peruanos and Grupo Falabella)
have a total of 152 stores nationwide. In 2010, 25 new more stores were opened throughout the
country; this means 18 percent more sales area. As previously , an increase in income and
consumption have boosted supermarket sales.
It is important to highlight Peru’s food retail potential due to its lower penetration level (30 and 15
percent in Lima and the rest of Peru, respectively) which remains under other countries within the
region, for example: Santiago (80 percent) and Rio de Janeiro and Bogota (70 percent).
Traditional and Modern Retail Channels
Jan – Dec 2009 vs Jan – Dec 210
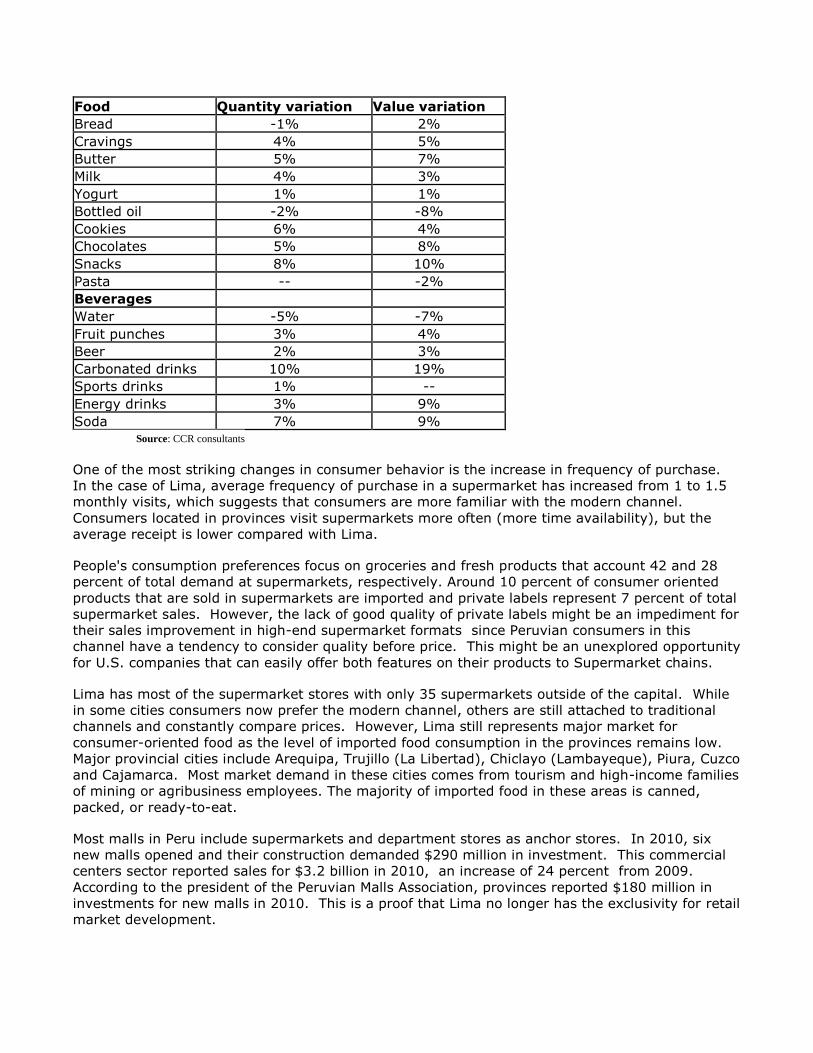
Food Quantity variation Value variation
Bread -1% 2%
Cravings 4% 5%
Butter 5% 7%
Milk 4% 3%
Yogurt 1% 1%
Bottled oil -2% -8%
Cookies 6% 4%
Chocolates 5% 8%
Snacks 8% 10%
Pasta -- -2%
Beverages
Water -5% -7%
Fruit punches 3% 4%
Beer 2% 3%
Carbonated drinks 10% 19%
Sports drinks 1% --
Energy drinks 3% 9%
Soda 7% 9% Source: CCR consultants
One of the most striking changes in consumer behavior is the increase in frequency of purchase.
In the case of Lima, average frequency of purchase in a supermarket has increased from 1 to 1.5
monthly visits, which suggests that consumers are more familiar with the modern channel.
Consumers located in provinces visit supermarkets more often (more time availability), but the
average receipt is lower compared with Lima.
People's consumption preferences focus on groceries and fresh products that account 42 and 28
percent of total demand at supermarkets, respectively. Around 10 percent of consumer oriented
products that are sold in supermarkets are imported and private labels represent 7 percent of total
supermarket sales. However, the lack of good quality of private labels might be an impediment for
their sales improvement in high-end supermarket formats since Peruvian consumers in this
channel have a tendency to consider quality before price. This might be an unexplored opportunity
for U.S. companies that can easily offer both features on their products to Supermarket chains.
Lima has most of the supermarket stores with only 35 supermarkets outside of the capital. While
in some cities consumers now prefer the modern channel, others are still attached to traditional
channels and constantly compare prices. However, Lima still represents major market for
consumer-oriented food as the level of imported food consumption in the provinces remains low.
Major provincial cities include Arequipa, Trujillo (La Libertad), Chiclayo (Lambayeque), Piura, Cuzco
and Cajamarca. Most market demand in these cities comes from tourism and high-income families
of mining or agribusiness employees. The majority of imported food in these areas is canned,
packed, or ready-to-eat.
Most malls in Peru include supermarkets and department stores as anchor stores. In 2010, six
new malls opened and their construction demanded $290 million in investment. This commercial
centers sector reported sales for $3.2 billion in 2010, an increase of 24 percent from 2009.
According to the president of the Peruvian Malls Association, provinces reported $180 million in
investments for new malls in 2010. This is a proof that Lima no longer has the exclusivity for retail
market development.

A.1. CENCOSUD Peru S.A. Profile
In December 2007, Corporación E. Wong was acquired by Chilean Cencosud (Centros Comerciales
Sudamericanos), one of the largest companies in Latin America’s retail sector. The agreement
between these two important companies was to transfer the entirety of Wong’s shares to Cencosud
for $500 million as well as real estate assets including commercial centers, 23 supermarkets and
17 more in the pipeline. Cencosud agreed to give 49.75 million shares to Wong shareholders,
valued at 2000 Chilean pesos each ($4.00 each share). The handover took place on January 31,
2008.
CENCOSUD has kept the majority of the chain brands, and has only reduced the outlets of
Almacenes Eco, turning it into the “Metro” chain. Moreover, the new administration decided
to sell the chain “American Outlet.”
Wong Supermarket: aimed at high-end consumers and offers customer oriented
service. These outlets offer a variety of imported products depending on their
location.
Metro Supermarket: convenient prices and less personal service for the middle
income consumers.
Metro Hypermarket: Semi self-service format for price sensitive low-income
customers.
Cencosud spent two years getting to know the Peruvian consumer, and even though their
sales increased, total sales have decreased by 12.7 percent since 2008. These valuable
points have been distributed among its two strongest competitors, Supermercados
Peruanos (Interbank Group), and Tottus (Falabella Group). The group wants to recover its
market share and expects to grow in the 2011-2012 period, but this will not be an easy
task.
Cencosud stopped its aggressive expansion since it acquired Wong, including new outlets
and formats such as Paris and Easy. According to the new administration, the reason for
this has been an increase in credit cost and fluctuations in exchange rates.
Cencosud Peru has started its expansion plan and is planning to invest $220 million,
basically for new store opening. So far, Cencosud has 14 stores outside of Lima (3 Wong
and 11 Metro).
Cencosud has already registered Banco Paris, the financial branch of the corporation, to
strengthen its financial support for its customers through credit cards. Cencosud has
everything prepared for the opening of their Paris Department Stores in 2012.
A.2. Supermercados Peruanos Profile
Supermercados Peruanos (SPSA) was created in 2004 when a local company, Interbank Group,
acquired it from the Dutch Company Disco Ahold International Holding. Currently, IFH Retail Corp
is SPSA’s principal shareholder. Interbank Bank is part of the corporation; it is the financial branch
of SPSA.
Supermercados Peruanos divides its points of sales into three formats:
Vivanda Supermarket: aimed at high-end consumers, offering customer oriented
service. Provided “a loyalty card” to its customers.
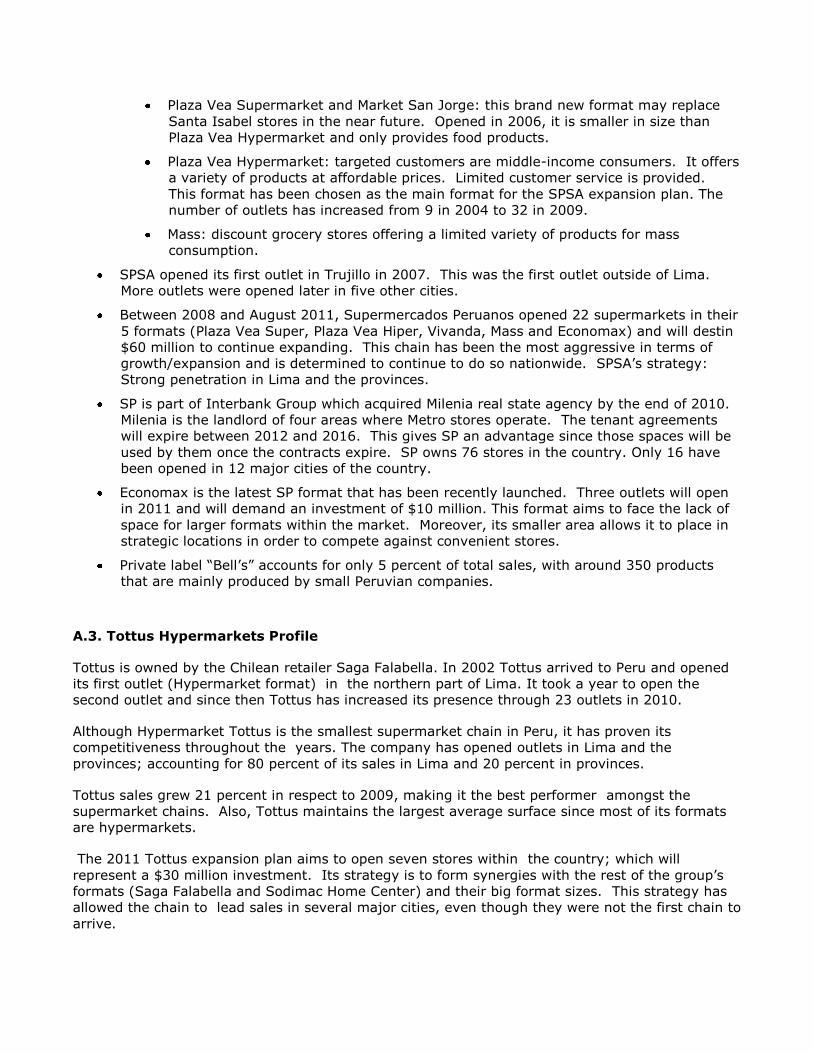
Plaza Vea Supermarket and Market San Jorge: this brand new format may replace
Santa Isabel stores in the near future. Opened in 2006, it is smaller in size than
Plaza Vea Hypermarket and only provides food products.
Plaza Vea Hypermarket: targeted customers are middle-income consumers. It offers
a variety of products at affordable prices. Limited customer service is provided.
This format has been chosen as the main format for the SPSA expansion plan. The
number of outlets has increased from 9 in 2004 to 32 in 2009.
Mass: discount grocery stores offering a limited variety of products for mass
consumption.
SPSA opened its first outlet in Trujillo in 2007. This was the first outlet outside of Lima.
More outlets were opened later in five other cities.
Between 2008 and August 2011, Supermercados Peruanos opened 22 supermarkets in their
5 formats (Plaza Vea Super, Plaza Vea Hiper, Vivanda, Mass and Economax) and will destin
$60 million to continue expanding. This chain has been the most aggressive in terms of
growth/expansion and is determined to continue to do so nationwide. SPSA’s strategy:
Strong penetration in Lima and the provinces.
SP is part of Interbank Group which acquired Milenia real state agency by the end of 2010.
Milenia is the landlord of four areas where Metro stores operate. The tenant agreements
will expire between 2012 and 2016. This gives SP an advantage since those spaces will be
used by them once the contracts expire. SP owns 76 stores in the country. Only 16 have
been opened in 12 major cities of the country.
Economax is the latest SP format that has been recently launched. Three outlets will open
in 2011 and will demand an investment of $10 million. This format aims to face the lack of
space for larger formats within the market. Moreover, its smaller area allows it to place in
strategic locations in order to compete against convenient stores.
Private label “Bell’s” accounts for only 5 percent of total sales, with around 350 products
that are mainly produced by small Peruvian companies.
A.3. Tottus Hypermarkets Profile
Tottus is owned by the Chilean retailer Saga Falabella. In 2002 Tottus arrived to Peru and opened
its first outlet (Hypermarket format) in the northern part of Lima. It took a year to open the
second outlet and since then Tottus has increased its presence through 23 outlets in 2010.
Although Hypermarket Tottus is the smallest supermarket chain in Peru, it has proven its
competitiveness throughout the years. The company has opened outlets in Lima and the
provinces; accounting for 80 percent of its sales in Lima and 20 percent in provinces.
Tottus sales grew 21 percent in respect to 2009, making it the best performer amongst the
supermarket chains. Also, Tottus maintains the largest average surface since most of its formats
are hypermarkets.
The 2011 Tottus expansion plan aims to open seven stores within the country; which will
represent a $30 million investment. Its strategy is to form synergies with the rest of the group’s
formats (Saga Falabella and Sodimac Home Center) and their big format sizes. This strategy has
allowed the chain to lead sales in several major cities, even though they were not the first chain to
arrive.
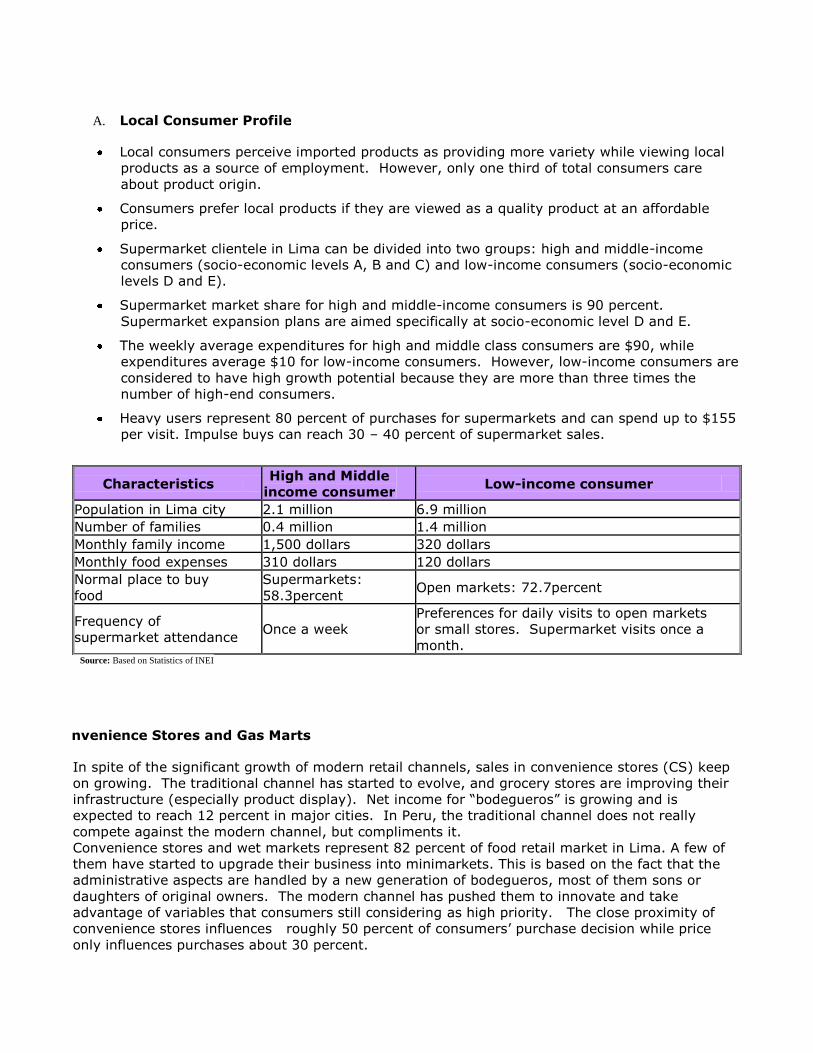
A. Local Consumer Profile
Local consumers perceive imported products as providing more variety while viewing local
products as a source of employment. However, only one third of total consumers care
about product origin.
Consumers prefer local products if they are viewed as a quality product at an affordable
price.
Supermarket clientele in Lima can be divided into two groups: high and middle-income
consumers (socio-economic levels A, B and C) and low-income consumers (socio-economic
levels D and E).
Supermarket market share for high and middle-income consumers is 90 percent.
Supermarket expansion plans are aimed specifically at socio-economic level D and E.
The weekly average expenditures for high and middle class consumers are $90, while
expenditures average $10 for low-income consumers. However, low-income consumers are
considered to have high growth potential because they are more than three times the
number of high-end consumers.
Heavy users represent 80 percent of purchases for supermarkets and can spend up to $155
per visit. Impulse buys can reach 30 – 40 percent of supermarket sales.
Characteristics High and Middle
income consumer Low-income consumer
Population in Lima city 2.1 million 6.9 million
Number of families 0.4 million 1.4 million
Monthly family income 1,500 dollars 320 dollars
Monthly food expenses 310 dollars 120 dollars
Normal place to buy
food
Supermarkets:
58.3percent Open markets: 72.7percent
Frequency of
supermarket attendance Once a week
Preferences for daily visits to open markets
or small stores. Supermarket visits once a
month. Source: Based on Statistics of INEI
4. Convenience Stores and Gas Marts
In spite of the significant growth of modern retail channels, sales in convenience stores (CS) keep
on growing. The traditional channel has started to evolve, and grocery stores are improving their
infrastructure (especially product display). Net income for “bodegueros” is growing and is
expected to reach 12 percent in major cities. In Peru, the traditional channel does not really
compete against the modern channel, but compliments it.
Convenience stores and wet markets represent 82 percent of food retail market in Lima. A few of
them have started to upgrade their business into minimarkets. This is based on the fact that the
administrative aspects are handled by a new generation of bodegueros, most of them sons or
daughters of original owners. The modern channel has pushed them to innovate and take
advantage of variables that consumers still considering as high priority. The close proximity of
convenience stores influences roughly 50 percent of consumers’ purchase decision while price
only influences purchases about 30 percent.
While convenience stores acquire this classification when they offer massive products such as
sugar, milk, rice, noodles and sodas, a few have started too modernized. The future of
convenience stores is uncertain due to supermarket’s initiative to build smaller formats in middle
and low income areas. However, supermarket’s aggressive penetration might start affecting
directly these small businesses in the near future. These stores have wisely fared against to a long
list benefits offered by supermarkets by focusing their efforts on ways to satisfy consumer needs
not met by large chains.
Convenience stores have started to upgrade their business structures to a well organized scheme
(minimarkets) and probably this might be one of the big challenges along with implementation of
new services that CS would face in the future in order to persist in the market. However, as we
said before, both channels compliments their presence within the market, thus, this may not be
consider as a cause-effect action derived from supermarket growth.
5. Traditional Markets
A. Sub-sector Profile
Traditional markets have made new strategies in order to face competition from
supermarkets. These new strategies include 40 new projects, accounting for an estimated
$200 million dollars in investment. According to the plan, Plaza Ceres became the first open
market built in 2008. It cost $3 million to build the Plaza Ceres which houses 700 small
businesses.
Traditional markets in Peru include 200,000 grocery stores and 2,500 open markets. Lima
has 70,000 grocery stores and almost 1,250 open markets. In 2010, open market sales
increased by 12 percent.
Open markets are very popular among Peruvians for providing staples, diary, and personal
hygiene products. Peruvians also visit open markets to purchase fresh fruits and
vegetables and meats at lower prices.
Traditional markets offer limited opportunity for sales of high-end imported goods. Most
food products sold in traditional markets (open markets, street vendors and grocery stores)
are locally produced inexpensive perishable products which are aimed at low-income
consumers.
Open markets are dominated by 25 major companies.
Section III. Competition
Source: World Trade Atlas (2010)
Peru grants tariff preferences to the Andean Community of Nations (CAN - Bolivia, Colombia
and Ecuador), and to Mexico, Paraguay, Argentina, Brazil, Uruguay and Cuba.
Peru’s trade policy is oriented towards open markets. Peru has signed different commercial
and trade agreements, while others have not entered into force yet and just a few still in
negotiations:
Country Type Status
Andean Community (Bolivia, Ecuador
and Colombia) Free Trade Agreement In force
MERCOSUR (Argentina, Brasil, Uruguay,
Paraguay)
Economic Complementation
Agreement In force
Cuba Economic Complementation
Agreement In force
Chile Free Trade Agreement In force
Mexico Trade Integration Agreement In force
United States Free Trade Agreement In force
Canada Free Trade Agreement In force
Singapore Free Trade Agreement In force
China Free Trade Agreement In force
South Korea Free Trade Agreement In force
European Free Trade Association (EFTA) Free Trade Agreement In force
Thailand Third Protocol To come into
force
Japan Economic Partnership Agreement To come into
force
European Union Free Trade Agreement To come into

force
Costa Rica Free Trade Agreement To come into
force
Panama Free Trade Agreement To come into
force
Guatemala Free Trade Agreemnent Negotiating
El Salvador Free Trade Agreemnent Negotiating
Honduras Free Trade Agreemnent Negotiating
The PTPA reinforces U.S. competitiveness within the Peruvian market. The quality of U.S. products is already
appreciated among the high-end consumers.
For a complete list of products that have benefited from PTPA, please check
http://www.ustr.gov/Trade_Agreements/Bilateral/Peru_TPA/Section_Index.html.
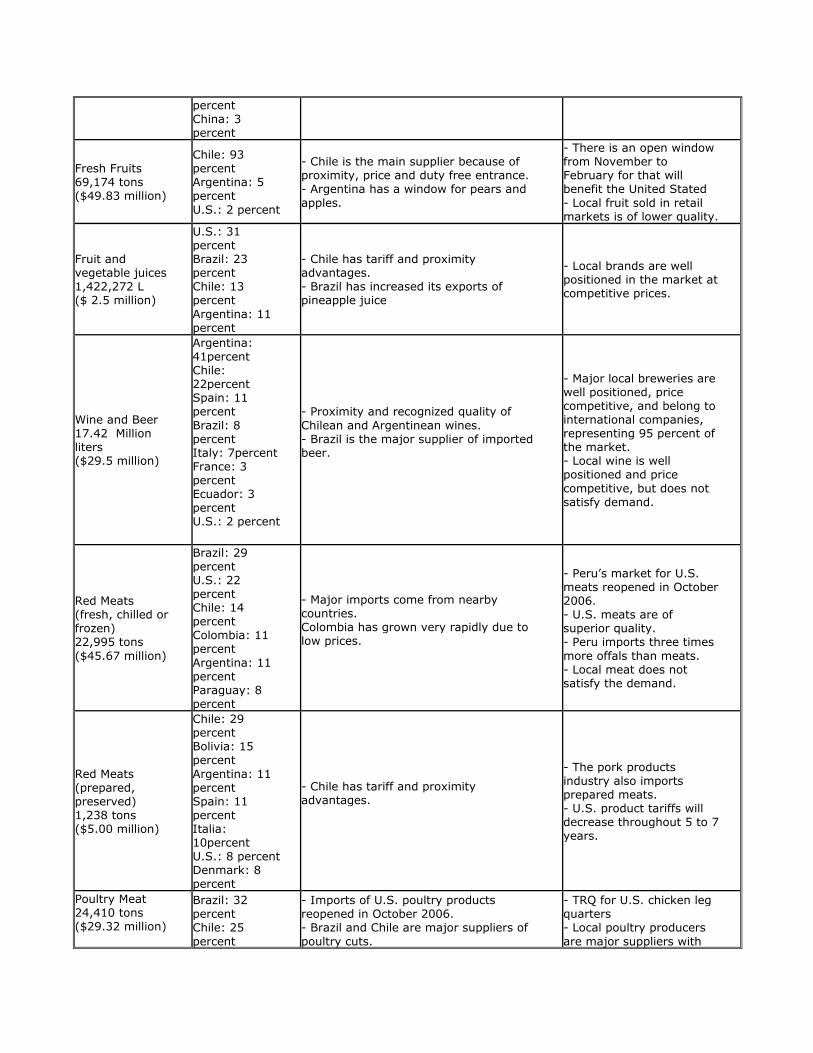
Competitive Situation facing U.S. Suppliers in the Retail Market in 2010
Product Category/
Net Imports
Major Supply Sources
Strengths of Key Supply Countries Advantages and
Disadvantages of Local Suppliers
Dairy Products (Excl. Cheese)
($127.85 million)
New Zealand: 31 percent U.S.: 21 percent Chile: 12 percent Bolivia: 12 percent Argentina: 6 percent
- New Zealand is a major supplier of dairy ingredients, especially HS 040210 milk accounting 36 percent of total imports.
- Only two companies are major producers of evaporated milk and yogurt.
Cheese
2,431 tons ($11.59 million)
U.S: 38 percent Argentina: 15 percent Uruguay: 15 percent Netherlands: 7 percent New Zealand: 7 percent
Argentina and Uruguay are part of MERCOSUR and have tariff preferences
Local homemade cheeses are commonly sold. Gourmet cheeses are not
made locally.
Snack Foods 19,505 tons ($54.1 million)
Colombia: 52 percent Ecuador: 10 percent Chile: 7 percent U.S.: 7 percent Argentina: 6 percent
- Tariff preferences are applied to neighboring countries.
- Local producers are major
food processors. They import food ingredients for snacks and snacks in bulk.
Processed Fruits and Vegetables 47,885 tons ($65.93million)
Chile: 60 percent U.S.: 12 percent Argentina: 6 percent Netherlands: 4 percent Italy: 3
Chile sells at cheaper
prices due to proximity and tariff preferences.
- EU products are viewed as good quality. - Argentina has increased its potato
exports and fruit jellies
- Local processors are major exporters, but their local supply is limited.
percent China: 3 percent
Fresh Fruits 69,174 tons ($49.83 million)
Chile: 93 percent Argentina: 5 percent U.S.: 2 percent
- Chile is the main supplier because of proximity, price and duty free entrance. - Argentina has a window for pears and
apples.
- There is an open window from November to February for that will benefit the United Stated - Local fruit sold in retail markets is of lower quality.
Fruit and vegetable juices 1,422,272 L ($ 2.5 million)
U.S.: 31 percent Brazil: 23 percent Chile: 13 percent Argentina: 11 percent
- Chile has tariff and proximity advantages. - Brazil has increased its exports of pineapple juice
- Local brands are well positioned in the market at competitive prices.
Wine and Beer 17.42 Million liters ($29.5 million)
Argentina: 41percent Chile: 22percent Spain: 11 percent Brazil: 8 percent Italy: 7percent France: 3 percent Ecuador: 3 percent U.S.: 2 percent
- Proximity and recognized quality of
Chilean and Argentinean wines. - Brazil is the major supplier of imported beer.
- Major local breweries are well positioned, price competitive, and belong to international companies, representing 95 percent of the market. - Local wine is well positioned and price
competitive, but does not satisfy demand.
Red Meats (fresh, chilled or frozen) 22,995 tons ($45.67 million)
Brazil: 29 percent U.S.: 22 percent Chile: 14 percent Colombia: 11 percent Argentina: 11 percent Paraguay: 8 percent
- Major imports come from nearby countries. Colombia has grown very rapidly due to low prices.
- Peru’s market for U.S. meats reopened in October 2006. - U.S. meats are of superior quality. - Peru imports three times
more offals than meats. - Local meat does not satisfy the demand.
Red Meats (prepared, preserved) 1,238 tons ($5.00 million)
Chile: 29 percent Bolivia: 15 percent
Argentina: 11 percent Spain: 11 percent Italia: 10percent U.S.: 8 percent Denmark: 8 percent
- Chile has tariff and proximity advantages.
- The pork products industry also imports prepared meats. - U.S. product tariffs will decrease throughout 5 to 7 years.
Poultry Meat 24,410 tons ($29.32 million)
Brazil: 32 percent Chile: 25
percent
- Imports of U.S. poultry products reopened in October 2006. - Brazil and Chile are major suppliers of
poultry cuts.
- TRQ for U.S. chicken leg quarters - Local poultry producers
are major suppliers with

U.S.: 20 percent Argentina: 16 percent Bolivia: 8 percent
good distribution channels. - Imports are mainly chicken and turkey parts.
Note: Net imports correspond to the three food sectors: Food Service, Retail and Food Processing. Source: World Trade Atlas
Section IV. Best Product Prospects
Source: World Trade Atlas (2010)
A. Products Present in the Market Which Have Good Sales Potential:
Product/ Product Category
Market
Size 2010 est.
Imports
2010
Average Annual Import Growth (2005-
10)
Import Tariff Rate
Key Constraints
Over Market Development
Market
Attractiveness for the U.S.
Cheese (HS 0406)
18,480 MT
2,341 tons ($11.59
14.4 percent
040610, 20 and 40 0
- U.S. competitors are: Uruguay (16percent) and Netherlands
- U.S. cheeses are mainly used in the food processing sector, but have
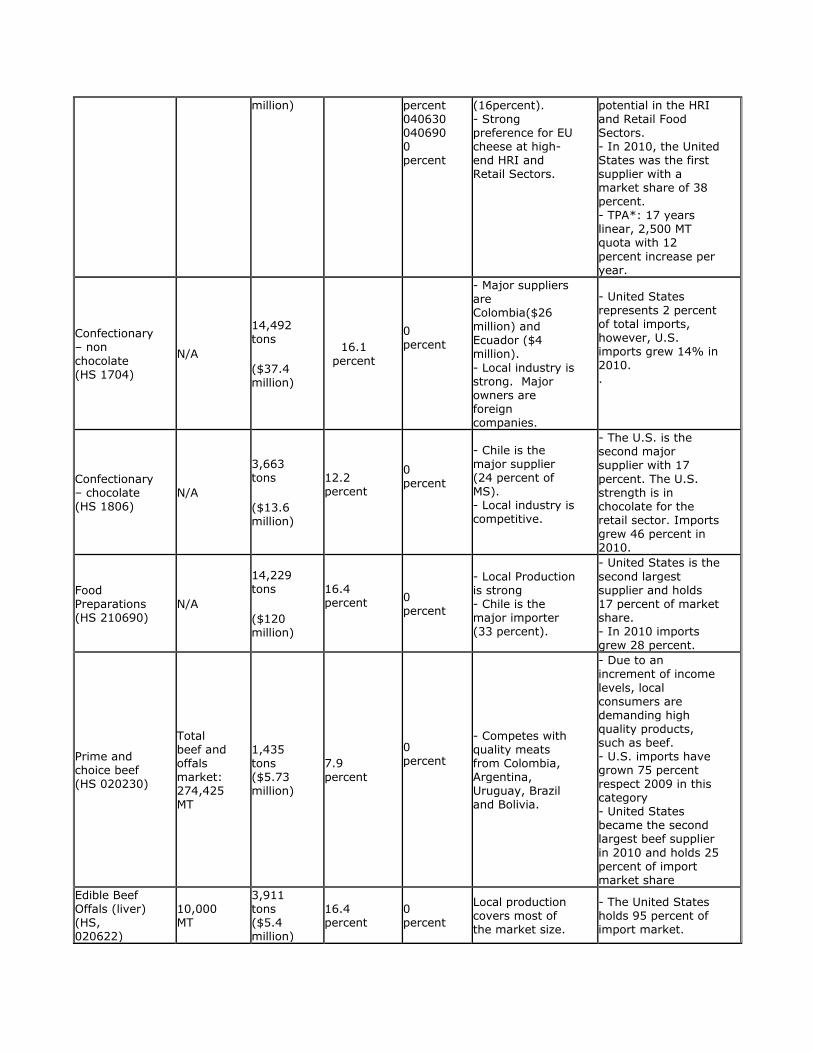
million) percent 040630 040690 0 percent
(16percent). - Strong preference for EU cheese at high-end HRI and Retail Sectors.
potential in the HRI and Retail Food Sectors. - In 2010, the United States was the first supplier with a market share of 38 percent. - TPA*: 17 years linear, 2,500 MT quota with 12
percent increase per year.
Confectionary – non
chocolate (HS 1704)
N/A
14,492 tons ($37.4 million)
16.1
percent
0 percent
- Major suppliers are Colombia($26 million) and Ecuador ($4 million). - Local industry is strong. Major owners are foreign companies.
- United States represents 2 percent of total imports, however, U.S. imports grew 14% in 2010. .
Confectionary – chocolate (HS 1806)
N/A
3,663 tons ($13.6 million)
12.2 percent
0 percent
- Chile is the major supplier (24 percent of MS). - Local industry is competitive.
- The U.S. is the second major supplier with 17
percent. The U.S. strength is in chocolate for the retail sector. Imports grew 46 percent in 2010.
Food Preparations (HS 210690)
N/A
14,229 tons ($120 million)
16.4 percent
0 percent
- Local Production is strong - Chile is the major importer (33 percent).
- United States is the
second largest supplier and holds 17 percent of market share. - In 2010 imports grew 28 percent.
Prime and choice beef (HS 020230)
Total beef and offals market: 274,425 MT
1,435 tons ($5.73 million)
7.9 percent
0 percent
- Competes with quality meats from Colombia, Argentina, Uruguay, Brazil and Bolivia.
- Due to an increment of income
levels, local consumers are demanding high quality products, such as beef. - U.S. imports have grown 75 percent respect 2009 in this category - United States became the second largest beef supplier
in 2010 and holds 25 percent of import market share
Edible Beef Offals (liver) (HS, 020622)
10,000 MT
3,911 tons ($5.4 million)
16.4 percent
0 percent
Local production covers most of the market size.
- The United States holds 95 percent of import market.
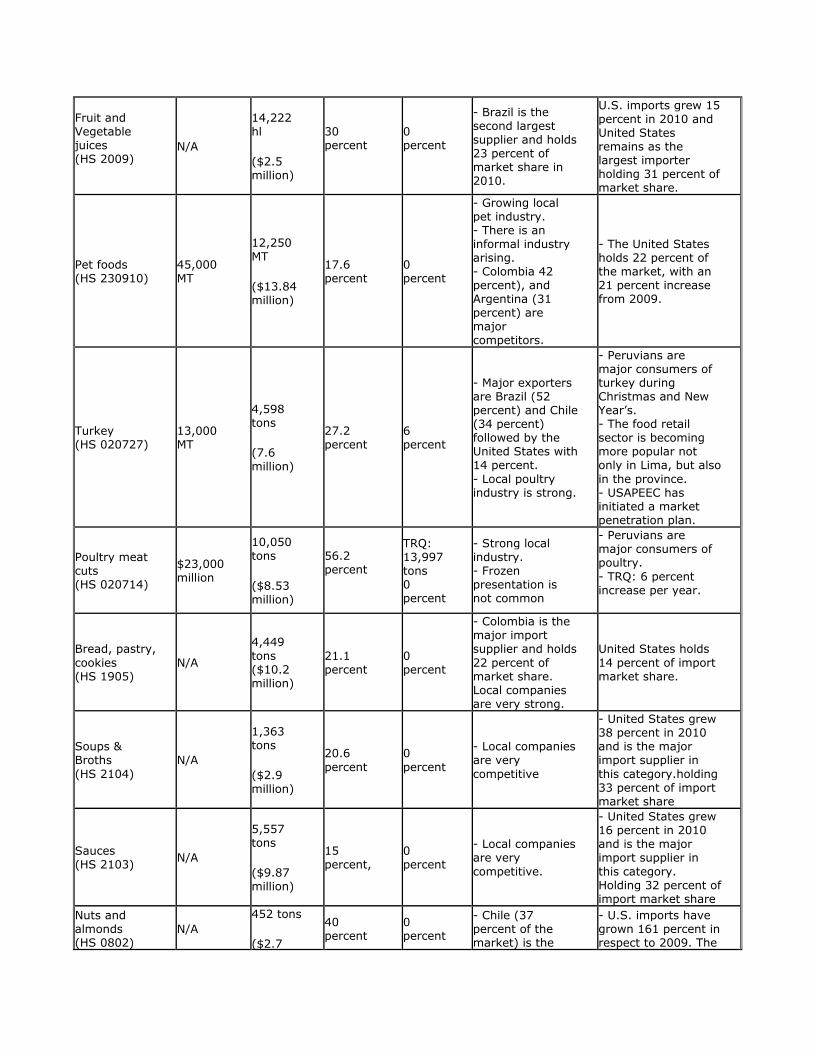
Fruit and Vegetable juices (HS 2009)
N/A
14,222 hl ($2.5 million)
30 percent
0 percent
- Brazil is the second largest supplier and holds 23 percent of market share in 2010.
U.S. imports grew 15 percent in 2010 and United States remains as the largest importer holding 31 percent of market share.
Pet foods (HS 230910)
45,000 MT
12,250 MT ($13.84 million)
17.6 percent
0 percent
- Growing local pet industry. - There is an informal industry arising. - Colombia 42 percent), and Argentina (31 percent) are major competitors.
- The United States holds 22 percent of the market, with an 21 percent increase from 2009.
Turkey (HS 020727)
13,000 MT
4,598 tons (7.6 million)
27.2 percent
6 percent
- Major exporters are Brazil (52 percent) and Chile (34 percent) followed by the United States with 14 percent. - Local poultry industry is strong.
- Peruvians are major consumers of turkey during Christmas and New Year’s. - The food retail sector is becoming more popular not only in Lima, but also
in the province. - USAPEEC has initiated a market penetration plan.
Poultry meat cuts (HS 020714)
$23,000 million
10,050 tons ($8.53 million)
56.2 percent
TRQ: 13,997 tons 0 percent
- Strong local industry. - Frozen presentation is not common
- Peruvians are major consumers of poultry. - TRQ: 6 percent increase per year.
Bread, pastry,
cookies (HS 1905)
N/A
4,449
tons ($10.2 million)
21.1 percent
0 percent
- Colombia is the major import supplier and holds
22 percent of market share. Local companies are very strong.
United States holds
14 percent of import market share.
Soups & Broths (HS 2104)
N/A
1,363 tons ($2.9 million)
20.6
percent 0
percent
- Local companies are very
competitive
- United States grew 38 percent in 2010 and is the major import supplier in
this category.holding 33 percent of import market share
Sauces (HS 2103)
N/A
5,557 tons ($9.87 million)
15 percent,
0 percent
- Local companies are very
competitive.
- United States grew 16 percent in 2010 and is the major import supplier in
this category. Holding 32 percent of import market share
Nuts and almonds (HS 0802)
N/A 452 tons ($2.7
40 percent
0 percent
- Chile (37 percent of the market) is the
- U.S. imports have grown 161 percent in respect to 2009. The

million) second largest supplier.
United States is the major supplier with 61 percent of the import market. - Importers recognize that U.S. quality of nuts and almonds is better than competitors.
Wine (HS 2204)
21 million liters
8.1 million liters ($24.87 million)
15.7 percent
0 percent
- Argentina (53 percent), Chile (32 percent), and
Spain (7 percent) are major exporters. - Only regular wine consumers recognize U.S. wine quality.
- There is a niche market for quality wines for which the
United States can be appreciated and price competitive. - Peru’s wine consumption is growing. Right now is above 1.3 liters.
Note: TRQ = Tariff Rate Quota, on a first-come first-serve basis. Sources: World Trade Atlas, USTR, Ministry of Agriculture (Minag), Gestion and El Comercio Newspapers
B. Products not Present in Significant Quantities, but which have good sales Potential:
Product/ Product Category
Imports
2010
Average
Annual Import Growth
(2005-10)
Import Tariff Rate
Key Constraints Over Market Development
Market Attractiveness
for the U.S.
Peaches, cherries and Nectarines (HS 0809)
2,968 tons ($2.3
million)
13.6 percent
0 percent
- Chile is major supplier with 99 percent of the market.
- Importers are interested in U.S. peaches and nectarines. - Duty free access for
this category.
Apples and Pears (HS 0808)
61,859
Tons $44 million
20.2 percent
0 percent
- Chile is the major supplier with 92 percent of the market. - The United States is the third largest supplier with 2 percent of the market.
- There is a window of opportunity for the United States between November and February. Local consumers recognize U.S. apples and pears quality.
Grapes, raisins (HS 080620)
6,633 tons ($14.3 million)
22 percent
0 percent
- Chile holds almost 88 percent of the market.
- U.S. window: September to December. In 2010 U.S. imports reached $1.1 million due to a less Chilean production.
Citrus (HS 0805)
35 tons $30,546
-23 percent
2.4 percent
- Chile is the second major supplier with 40 percent of the market.
- United States holds 60 percent of import market - Recognized quality of U.S. oranges and tangerines. - Export window for the United States is from January to March.

Pork Meat (HS 0203)
3,005 tons ($6.9 million)
63 percent 2.4 percent
- Peruvians are not used to eating pork. - Local industry produces more than 100,000 MT - The industry is the same as the poultry industry. - Chile is the major supplier with 79 percent of the market and
second is Canada with 15 percent
- Pork imports are growing. - U.S. pork benefit from
TPA implementation. -
Sausages (HS 1601)
547 tons ($1.6 million)
28 percent 2.4 percent
- Major exporter is Chile
with 44 percent of the market
- There is a high-end segment for gourmet sausages, in which the United States can compete. United States holds 19
percent of import market. Imports has grown 142 percent in 2010. Fast food restaurants are main channel for this category.
Ham, processed HS 160241
74 tons ($0.84 million)
32 percent 3.42 percent
- Major suppliers are Italy (43 percent of the market) and Spain (39 percent).
- The United States has
quality products to introduce to the gourmet market - TPA: 7 years U.S. imports grew 95 percent in 2010.
Beer (HS 2203)
8.9 million liters ($4.5 million)
5.6 percent 0 percent
- Local breweries are
very strong and owned by international companies. - Local breweries produce and import new brands for introduction in the market. Brazil is the major supplier (53 percent of the market).
- Niche market for premium beers. - Growing consumption of beer (over 40 lts per capita) - Duty free entrance. Lack of U.S. brands within the market.
Note: TRQ = Tariff Rate Quota, on a first-come first-serve basis. Sources: World Trade Atlas, USTR, Ministry of Agriculture (Minag), Gestion and El Comercio Newspapers
C. Products Not Present Because They Face Significant Barriers:
None.
Section V. Key Contacts and Further Information
If you have any questions or comments regarding this report or need assistance, please contact
the Foreign Agricultural Service in Lima, Peru at the following address:
U.S. Embassy Lima, Foreign Agricultural Service (FAS)
Mailing Address: Office of Agricultural Affairs, Unit 3785, APO AA 34031
Address: Av. La Encalada cdra. 17, Monterrico, Lima 33
Phone: (511) 434-3042
Fax: (511) 434-3043
E-mail: [email protected]
For further information, check the FAS web site www.fas.usda.gov or our web site
www.usdaperu.org.pe. Please, also refer to our other current food market related reports:
Exporter Guide, Food and Agricultural Import Regulations and Standards (FAIRS), FAIRS Export
Certificate, Food Processing Ingredients Sector and HRI Food Service Sector.
Author Defined: