Personality‐obesity associations are driven by narrow ...
11
OBESITY REVIEW Personality‐obesity associations are driven by narrow traits: A meta‐analysis Uku Vainik 1,2 | Alain Dagher 1 | Anu Realo 2,3 | Lucía Colodro‐Conde 4 | Erik Lykke Mortensen 5 | Kerry Jang 6 | Ando Juko 7 | Christian Kandler 8 | Thorkild I.A. Sørensen 9 | René Mõttus 2,10 1 Montreal Neurological Institute, McGill University, Montreal, Canada 2 Institute of Psychology, University of Tartu, Tartu, Estonia 3 Department of Psychology, University of Warwick, Coventry, UK 4 QIMR Berghofer Medical Research Institute, Brisbane, Australia 5 Department of Public Health, University of Copenhagen, Copenhagen, Denmark 6 Division of Behavioural Sciences, Department of Psychiatry, The University of British Columbia, Vancouver, Canada 7 Faculty of Letters, Keio University, Tokyo, Japan 8 Department of Psychology, University of Bremen, Bremen, Germany 9 Novo Nordisk Foundation Center for Basic Metabolic Research, Section of Metabolic Genetics, and Department of Public Health, Section of Epidemiology, Faculty of Health and Medical Sciences, University of Copenhagen, Copenhagen, Denmark 10 Department of Psychology, University of Edinburgh, Edinburgh, UK Correspondence Uku Vainik, Montreal Neurological Institute, McGill University, 3801 Rue University, Montreal, QC H3A 2B4, Canada. Email: [email protected] Funding information Canadian Institutes of Health Research; Danish Diabetes Association; Danish Medical Research Fund; Fonds de Recherche du Québec ‐ Santé; Hjerteforeningen; QIMR Berghofer Fellowship; National Health and Medical Research Council, Grant/Award Numbers: 241944, 901061 and 950998; Apotekerfonden; Danish Heart Foundation; NOVO Foundation; QIMR Berghofer Fellow- ship; Estonian Ministry of Education and Science; Estonian Research Council, Grant/ Award Number: PUTJD654 Summary Obesity has inconsistent associations with broad personality domains, possibly because the links pertain to only some facets of these domains. Collating published and unpublished studies (N = 14 848), we meta‐analysed the associations between body mass index (BMI) and Five‐Factor Model personality domains as well as 30 Five‐Factor Model personality facets. At the domain level, BMI had a positive associ- ation with Neuroticism and a negative association with Conscientiousness domains. At the facet level, we found associations between BMI and 15 facets from all five per- sonality domains, with only some Neuroticism and Conscientiousness facets among them. Certain personality‐BMI associations were moderated by sample properties, such as proportions of women or participants with obesity; these moderation effects were replicated in the individual‐level analysis. Finally, facet‐based personality “risk” scores accounted for 2.3% of variance in BMI in a separate sample of individuals (N = 3569), 409% more than domain‐based scores. Taken together, personality‐BMI associations are facet specific, and delineating them may help to explain obesity‐ related behaviours and inform intervention designs. Preprint and data are available at https://psyarxiv.com/z35vn/. KEYWORDS body mass index, personality, prediction, risk score Received: 15 November 2018 Revised: 22 February 2019 Accepted: 3 March 2019 DOI: 10.1111/obr.12856 Obesity Reviews. 2019;20:1121–1131. © 2019 World Obesity Federation wileyonlinelibrary.com/journal/obr 1121
Transcript of Personality‐obesity associations are driven by narrow ...

Received: 15 November 2018 Revised: 22 February 2019 Accepted: 3 March 2019
DOI: 10.1111/obr.12856
OB E S I T Y R E V I EW
Personality‐obesity associations are driven by narrow traits:A meta‐analysis
Uku Vainik1,2 | Alain Dagher1 | Anu Realo2,3 | Lucía Colodro‐Conde4 |
Erik Lykke Mortensen5 | Kerry Jang6 | Ando Juko7 | Christian Kandler8 |
Thorkild I.A. Sørensen9 | René Mõttus2,10
1Montreal Neurological Institute, McGill
University, Montreal, Canada
2 Institute of Psychology, University of Tartu,
Tartu, Estonia
3Department of Psychology, University of
Warwick, Coventry, UK
4QIMR Berghofer Medical Research Institute,
Brisbane, Australia
5Department of Public Health, University of
Copenhagen, Copenhagen, Denmark
6Division of Behavioural Sciences, Department
of Psychiatry, The University of British
Columbia, Vancouver, Canada
7Faculty of Letters, Keio University, Tokyo,
Japan
8Department of Psychology, University of
Bremen, Bremen, Germany
9Novo Nordisk Foundation Center for Basic
Metabolic Research, Section of Metabolic
Genetics, and Department of Public Health,
Section of Epidemiology, Faculty of Health and
Medical Sciences, University of Copenhagen,
Copenhagen, Denmark
10Department of Psychology, University of
Edinburgh, Edinburgh, UK
Correspondence
Uku Vainik, Montreal Neurological Institute,
McGill University, 3801 Rue University,
Montreal, QC H3A 2B4, Canada.
Email: [email protected]
Funding information
Canadian Institutes of Health Research; Danish
Diabetes Association; Danish Medical
Research Fund; Fonds de Recherche du
Québec ‐ Santé; Hjerteforeningen; QIMR
Berghofer Fellowship; National Health and
Medical Research Council, Grant/Award
Numbers: 241944, 901061 and 950998;
Apotekerfonden; Danish Heart Foundation;
NOVO Foundation; QIMR Berghofer Fellow-
ship; Estonian Ministry of Education and
Science; Estonian Research Council, Grant/
Award Number: PUTJD654
Obesity Reviews. 2019;20:1121–1131.
Summary
Obesity has inconsistent associations with broad personality domains, possibly
because the links pertain to only some facets of these domains. Collating published
and unpublished studies (N = 14 848), we meta‐analysed the associations between
body mass index (BMI) and Five‐Factor Model personality domains as well as 30
Five‐Factor Model personality facets. At the domain level, BMI had a positive associ-
ation with Neuroticism and a negative association with Conscientiousness domains.
At the facet level, we found associations between BMI and 15 facets from all five per-
sonality domains, with only some Neuroticism and Conscientiousness facets among
them. Certain personality‐BMI associations were moderated by sample properties,
such as proportions of women or participants with obesity; these moderation effects
were replicated in the individual‐level analysis. Finally, facet‐based personality “risk”
scores accounted for 2.3% of variance in BMI in a separate sample of individuals
(N = 3569), 409% more than domain‐based scores. Taken together, personality‐BMI
associations are facet specific, and delineating them may help to explain obesity‐
related behaviours and inform intervention designs. Preprint and data are available
at https://psyarxiv.com/z35vn/.
KEYWORDS
body mass index, personality, prediction, risk score
© 2019 World Obesity Federationwileyonlinelibrary.com/journal/obr 1121

1122 VAINIK ET AL.
1 | INTRODUCTION
Obesity is a widespread1 and broadly consequential health condition,2
characterized by excess body fat. Studies using body mass index (BMI;
kg/m2) as a proxy for body fat percentage have associated BMI with
several personality traits.3-8 As personality traits summarize stable pat-
terns in how people typically think, act, feel, and behave,9 they may
prove instrumental in delineating how people with obesity differ from
people with normal weight status in their typical, weight‐relevant
behaviour. While cross‐sectional studies on personality‐BMI associa-
tions cannot imply causality, they can generate hypotheses on the
association between psychological traits and physical health.
So far, the research on personality‐BMI associations has focused
on broad personality traits, such as domains of the Five‐Factor Model
(FFM). Each FFM domain encompasses a wide range of behaviours,
thoughts, and feelings. In a meta‐analysis, Jokela et al5 found obesity
to negatively associate with the Conscientiousness domain, a broad
tendency for orderliness, diligence, and goal‐directed behaviour. If
education was not controlled for, there was also an association with
the Openness to Experience domain,5 which reflects intellectual curi-
osity and aesthetic sensitivity. The meta‐analysis by Emery and
Levine3 similarly supported the link with Conscientiousness but addi-
tionally reported a positive association between BMI and the Neurot-
icism domain, a broad tendency to experience negative emotions.
Reviews have further suggested that BMI may have a positive associ-
ation with the Extraversion domain,4,6 capturing responsiveness to
positive emotions, and negative associations with the Agreeableness
domain,4 a trait reflecting altruism and being sympathetic with others.
However, the same reviews and meta‐analyses have shown that these
domain‐obesity associations vary substantially across studies3-5 and
personality questionnaires.3
Such inconsistencies in findings point to the possibility that the
personality‐BMI associations pertain only to subtraits of the broad
domains that disparate measures sample differently.10-12 This possibil-
ity can be addressed by using personality questionnaires that divide
broad personality domains into more specific facets, such as the
Revised NEO Personality Inventory (NEO PI‐R13) and its updated ver-
sion, the NEO PI‐3.14 Because the NEO PI‐R/3 facets of the same
domains display only moderate intercorrelations (mean r = 0.38,
SD = 0.1213), the questionnaire describes a considerably wider set of
personality characteristics than the broad FFM domains alone. For
other phenomena, facet‐level analyses have already provided
more detailed accounts than domain‐based analyses (eg, other
studies15-17). Indeed, BMI may be associated with only selected facets
of broad personality domains such as the N5: Impulsiveness facet
within Neuroticism (eg, Sutin et al10). This can explain the variability
in domain‐based personality‐BMI studies: The associations only
emerge when relevant facets happen to be covered by the question-
naire in use. Although not necessarily a limitation of broad domain‐
based analyses, a facet‐based approach provides an opportunity to
develop more detailed accounts of BMI‐personality links.
A possible further cause of variability between studies is modera-
tors of BMI‐personality associations. For instance, the associations
of Neuroticism and Extraversion with BMI may be moderated by
sex7: Conceivably, women are more likely to engage in negative but
men in positive emotional eating.18 Sutin and Terracciano7 also
discussed cultural difference such as Conscientiousness having
weaker associations with BMI in Asia or Neuroticism having weaker
associations in Latin America. However, they omitted sample differ-
ences in age and prevalence of obesity as potential moderators; these
variables have been tested as moderators in a meta‐analysis on the
associations between BMI and executive function.19
To empirically demonstrate the usefulness of a more detailed per-
sonality profile, we seek to compare the ability of domain‐ and facet‐
based personality profiles to predict BMI in a new sample. This can be
achieved by calculating “poly‐trait risk scores” for domains and facets,
respectively, called domain risk score (DRS) and facet risk score (FRS).
To yield a DRS or FRS in every participant, a participant's score on
each trait is multiplied by the meta‐analytic association between this
trait and obesity, and the products are then summed across domains
or facets. It is important that the meta‐analytic associations do not
include the sample for which the risk scores are calculated. The
poly‐trait risk score represents as much variance in BMI that can be
collectively predicted by the set of traits, be they domains or facets.
This approach has already been successfully used in personality
research,20-22 and it is conceptually very similar to polygenic risk
scores widely used in genetics.23,24 We expect FRS to explain more
variance in BMI than DRS.
Using published and unpublished data from various countries and
cohorts, we provide a comprehensive meta‐analysis of how narrow
personality traits derived from FFM facets are associated with obesity,
operationalized as BMI. Given that personality‐BMI associations may
vary across samples, we test typical moderators used in other meta‐
analyses (eg, Yang et al19), such as sex, age, and proportion of the sam-
ple exceeding the obesity cut‐off (BMI > 30.00 kg/m2). We attempt to
replicate these moderation effects at participant‐level data. Further,
we compare the collective predictive power of the FFM personality
facets with that of FFM domains by the ability of DRS vs FRS in
predicting BMI in an independent sample.
2 | METHODS
2.1 | Obtaining data
We were interested in the 30 facets defined by the NEO PI‐R/3 man-
ual.13,14 However, we were open to alternative instruments targeting
the same facets, such as the IPIP‐NEO25 or the National Character
Survey.26 On February 5, 2019, we used Web of Science topic search
for “obesity” OR “BMI” OR “body mass index” or “body‐mass index,”
yielding 454 396 articles. This search was then refined by further
topics: “personality” and “facet” or “NEO PI” or “ipip‐neo” or “national
character survey.” The resulting 49 titles and abstracts were scanned
for detailed personality facet–obesity associations across all 30 facets.
We found six candidate studies, with four using full the NEO
PI‐R/3,10-12,27 one using a Korean shortened NEO PI‐R,28 and one
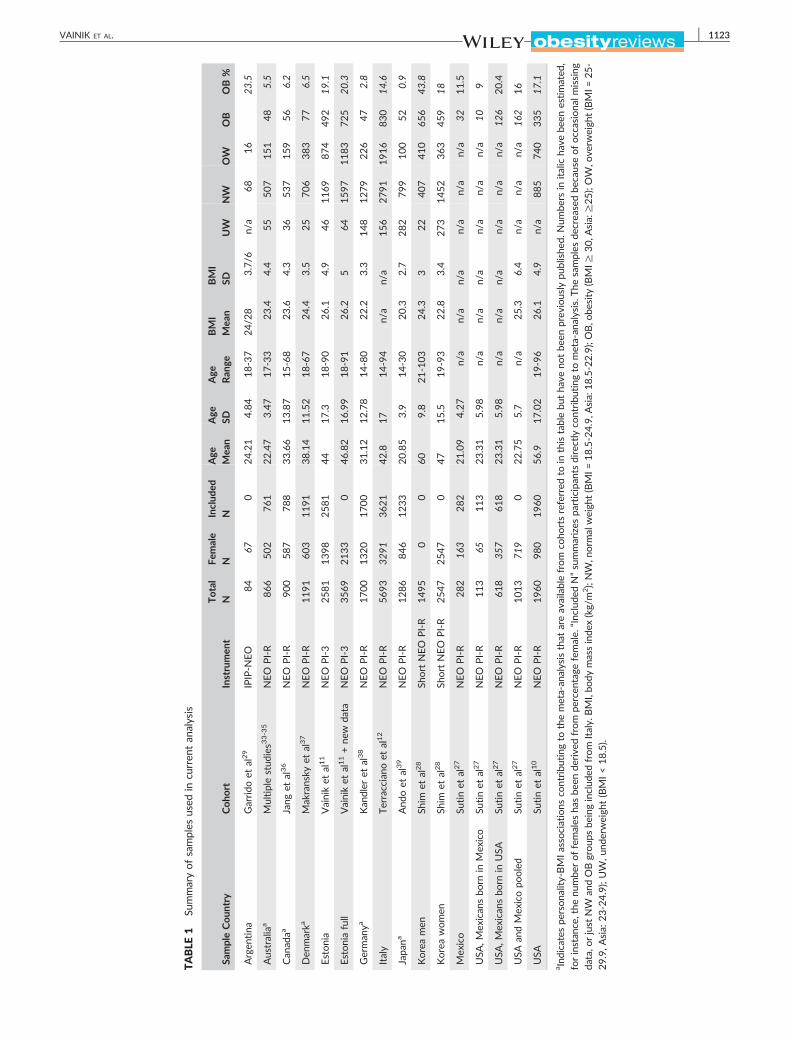
TABLE
1Su
mmaryofsamples
used
incu
rren
tan
alysis
SampleCoun
try
Coho
rtInstrumen
t
Total
N
Female
N
Includ
ed
N
Age
Mea
n
Age
SD
Age
Ran
ge
BMI
Mea
n
BMI
SDUW
NW
OW
OB
OB%
Argen
tina
Garrido
etal29
IPIP‐N
EO
84
670
24.21
4.84
18‐37
24/2
83.7/6
n/a
68
16
23.5
Australiaa
Multiplestud
ies3
3-35
NEO
PI‐R
866
502
761
22.47
3.47
17‐33
23.4
4.4
55
507
151
48
5.5
Can
adaa
Jang
etal36
NEO
PI‐R
900
587
788
33.66
13.87
15‐68
23.6
4.3
36
537
159
56
6.2
Den
marka
Makransky
etal37
NEO
PI‐R
1191
603
1191
38.14
11.52
18‐67
24.4
3.5
25
706
383
77
6.5
Estonia
Vainiket
al11
NEO
PI‐3
2581
1398
2581
44
17.3
18‐90
26.1
4.9
46
1169
874
492
19.1
Estoniafull
Vainiket
al11+ne
wda
taNEO
PI‐3
3569
2133
046.82
16.99
18‐91
26.2
564
1597
1183
725
20.3
German
yaKan
dler
etal38
NEO
PI‐R
1700
1320
1700
31.12
12.78
14‐80
22.2
3.3
148
1279
226
47
2.8
Italy
Terracciano
etal12
NEO
PI‐R
5693
3291
3621
42.8
17
14‐94
n/a
n/a
156
2791
1916
830
14.6
Japa
na
And
oet
al39
NEO
PI‐R
1286
846
1233
20.85
3.9
14‐30
20.3
2.7
282
799
100
52
0.9
Koreamen
Shim
etal28
Short
NEO
PI‐R
1495
00
60
9.8
21‐103
24.3
322
407
410
656
43.8
Koreawomen
Shim
etal28
Short
NEO
PI‐R
2547
2547
047
15.5
19‐93
22.8
3.4
273
1452
363
459
18
Mex
ico
Sutinet
al27
NEO
PI‐R
282
163
282
21.09
4.27
n/a
n/a
n/a
n/a
n/a
n/a
32
11.5
USA
,Mex
ican
sbo
rnin
Mex
ico
Sutinet
al27
NEO
PI‐R
113
65113
23.31
5.98
n/a
n/a
n/a
n/a
n/a
n/a
10
9
USA
,Mex
ican
sbo
rnin
USA
Sutinet
al27
NEO
PI‐R
618
357
618
23.31
5.98
n/a
n/a
n/a
n/a
n/a
n/a
126
20.4
USA
andMex
icopo
oled
Sutinet
al27
NEO
PI‐R
1013
719
022.75
5.7
n/a
25.3
6.4
n/a
n/a
n/a
162
16
USA
Sutinet
al10
NEO
PI‐R
1960
980
1960
56.9
17.02
19‐96
26.1
4.9
n/a
885
740
335
17.1
aIndicatespe
rsona
lity‐BMIassociations
contribu
ting
tothemeta‐an
alysisthat
areavailablefrom
coho
rtsreferred
toin
thistablebu
tha
veno
tbe
enpreviouslypublished
.Numbersin
italic
havebee
nestimated
,
forinstan
ce,the
numbe
roffemales
hasbe
ende
rive
dfrom
percen
tage
female.
“Inc
lude
dN”summarizes
participan
tsdirectly
contribu
ting
tometa‐an
alysis.T
hesamplesdecreased
becau
seofoccasional
missing
data,o
rjust
NW
andOBgroup
sbe
inginclud
edfrom
Italy.
BMI,bo
dymassinde
x(kg/m
2);NW
,norm
alweigh
t(BMI=
18.5‐24.9,A
sia:
18.5‐22.9);OB,o
besity(BMI≥
30,A
sia:
≥25);OW
,ove
rweigh
t(BMI=
25‐
29.9,A
sia:
23‐24.9);UW
,und
erweigh
t(BMI<18.5).
VAINIK ET AL. 1123

1124 VAINIK ET AL.
using the IPIP‐NEO questionnaire.29 As this paper pool was domi-
nated by the full NEO PI‐R/3, we based the main meta‐analysis only
on this instrument for consistency. However, the profiles obtained
with other instruments28,29 were compared with the meta‐analytic
NEO PI‐R/3 facet profile.
We then scanned for potential grey literature on facet‐obesity
associations, such as dissertations and other unpublished works. As
we decided to focus on the NEO PI‐R/3 in the previous step, we lim-
ited our search to all papers that have cited either the NEO PI‐R man-
ual (N = 17 885)13 or the NEO PI‐3 manual (N = 4726).30 Within this
subset of papers, we carried out a keyword search for “obesity” or
“BMI” or “body mass index” or “body‐mass index” and “facet,”
resulting in 313 + 68 papers for NEO PI‐R and NEO PI‐3, respectively.
No results that could be used for the meta‐analysis ultimately
emerged from this search.
NEO PI‐R/3 domain/facet‐BMI correlations were extracted from
three papers.10,11,27 The fourth published paper12 and two compari-
son papers28,29 reported group differences in personality traits and
facets separately for each of the groups—people whose weight sta-
tus was underweight, normal weight, overweight, or obese.12 In
these cases, akin to the study by Vainik et al,31 we extracted the
mean, standard errors (converted to standard deviations), and sample
sizes for the groups with normal weight or obesity, used these sum-
mary statistics to perform a t test between the groups for each trait
and facet, and converted the t statistics into correlation coefficients
(see Vainik et al31 for further details). As shown by Vainik et al,31
personality‐trait BMI correlations obtained from comparing partici-
pants with normal weight or obesity are very similar to correlations
with continuous BMI.
Next, we approached several cohorts known to have the informa-
tion on both the NEO PI‐R/3 and BMI and solicited access to five
datasets. All these datasets contained sibling data. To avoid inflated
effect sizes due to genetic and family environment overlap between
participants,32 analysis was conducted within multilevel framework,
using a random intercept for family. We controlled for age, age2, and
sex. BMI and personality scores were transformed into z scores, so
that the resulting regression weights could be interpreted as correla-
tions. All data sources are summarized in Table 1. Transformed corre-
lations, list of control variables used in each cohort, and results from
individual cohorts are available in Tables S1 and S2.
2.2 | Data analysis
Altogether, we meta‐analysed BMI data from 11 samples across
14 848 participants. We chose a random effects model as imple-
mented in metacor() function of meta R package,40 because the sam-
ples varied in cultural background and demographic characteristics
(Table 1). We also estimated the extent to which the NEO PI‐R/3
domain and facet‐BMI associations profiles from different samples
concurred. For this, we calculated the intraclass correlation estimates
and their 95% confidence intervals, using the ICC() function from
psych package,41 based on a mean rating (k = 11), absolute agreement,
two‐way random effects model (ICC (2,k)). Random effects absolute
agreement models should generalize to any other similar personality
study.42 The same ICC approach was used to compare the meta‐
analytic personality profiles with the profiles obtained with other
instruments.28,29
For moderation analysis, we selected facets that had significant
heterogeneity, such that I2 confidence intervals did not span zero.
We then applied meta‐regression43 to test whether sample properties
tested in previous meta‐analyses (eg, Yang et al19), such as proportion
of people with obesity, proportion male, or age, could explain variation
in effect size across different samples. Because the number of samples
was small, we tested each variable separately as a predictor.
We also sought to replicate the moderation effects at the
participant level using the NEO PI‐3 and BMI data from the Estonian
Biobank44 (Table 1). The Estonian Biobank was chosen as it was the
largest sample with raw data accessible to the first author, has
wide age range, and contains both self‐ and informant‐report
personality data, allowing for cross‐validation. After standardizing all
continuous variables (M = 0, SD = 1), we tested whether the
personality‐BMI effects were non‐linear. For each personality trait
highlighted by meta‐regression, we set the trait to predict BMI while
controlling for age, age2, education, and sex; we also set the trait to
interact with weight group (BMI above 30 vs BMI below 30), sex,
and age. Statistically significant interaction effects would demonstrate
moderation.
We then compared the extent to which the NEO PI‐R/3 domains
vs facets allowed for the prediction of BMI in an independent sample,
the Estonian Biobank. We first reran the meta‐analysis, as above,
without the Estonian Biobank contribution (N = 12 536). We then
used the meta‐analytic effect sizes for (a) NEO PI‐R/3 domains or (b)
facets as weights, with which each Estonian Biobank participants'
respective (a) domain and (b) facet z scores were multiplied. These
weighted NEO PI‐R/3 (a) domain and (b) facet scores were then aver-
aged, yielding either DRS or FRS. We included all NEO PI‐R/3 domains
in DRS and all facets in FRS regardless of the magnitude or signifi-
cance of their respective meta‐analytic weights, as many papers work-
ing on polygenic risk scores have shown that the best prediction can
generally be achieved when all predictors are included in risk scores,
no matter the effect size.21,23 The observed BMI was then predicted
from the DRS and FRS (all expressed in z scores), controlling for sex,
age, age2, and education. We emphasize that estimating the meta‐
analytic weights and applying them to calculate risk scores in indepen-
dent participants mitigated against model overfitting.
Typically, published BMI‐personality associations with NEO PI‐R/3
control for education.5,10-12 Therefore, we also controlled for educa-
tion in our participant‐level analyses. However, education is known
to both influence BMI45,46 and be genetically intertwined with person-
ality,20 and controlling for education may thus reduce the effect size
(eg, Openness effect in Jokela et al5). To facilitate different approaches
to interpretation, we also present our participant‐level analyses with-
out controlling for education in Figure S71 and Table S4.
All analysis was conducted in Microsoft R Open 3.5.147 using the
August 2018 version of several add‐on packages.40,41,48-53
VAINIK ET AL. 1125
3 | RESULTS
3.1 | Meta‐analytic personality profile
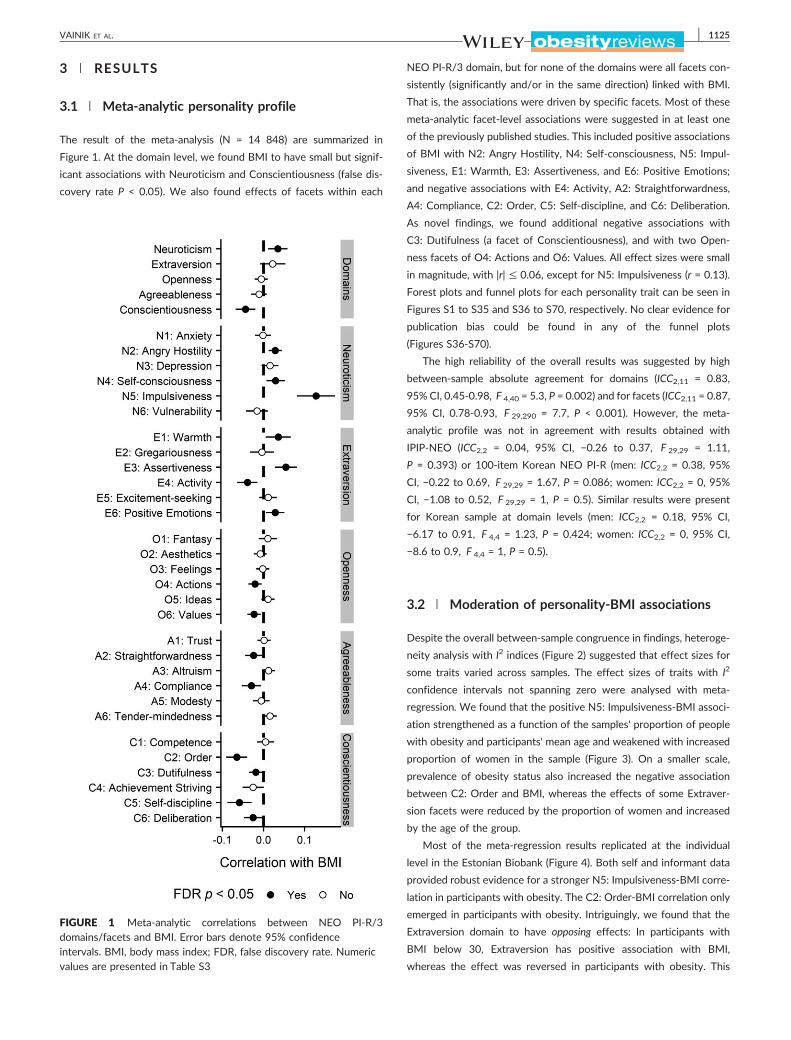
The result of the meta‐analysis (N = 14 848) are summarized in
Figure 1. At the domain level, we found BMI to have small but signif-
icant associations with Neuroticism and Conscientiousness (false dis-
covery rate P < 0.05). We also found effects of facets within each
FIGURE 1 Meta‐analytic correlations between NEO PI‐R/3domains/facets and BMI. Error bars denote 95% confidenceintervals. BMI, body mass index; FDR, false discovery rate. Numericvalues are presented in Table S3
NEO PI‐R/3 domain, but for none of the domains were all facets con-
sistently (significantly and/or in the same direction) linked with BMI.
That is, the associations were driven by specific facets. Most of these
meta‐analytic facet‐level associations were suggested in at least one
of the previously published studies. This included positive associations
of BMI with N2: Angry Hostility, N4: Self‐consciousness, N5: Impul-
siveness, E1: Warmth, E3: Assertiveness, and E6: Positive Emotions;
and negative associations with E4: Activity, A2: Straightforwardness,
A4: Compliance, C2: Order, C5: Self‐discipline, and C6: Deliberation.
As novel findings, we found additional negative associations with
C3: Dutifulness (a facet of Conscientiousness), and with two Open-
ness facets of O4: Actions and O6: Values. All effect sizes were small
in magnitude, with |r| ≤ 0.06, except for N5: Impulsiveness (r = 0.13).
Forest plots and funnel plots for each personality trait can be seen in
Figures S1 to S35 and S36 to S70, respectively. No clear evidence for
publication bias could be found in any of the funnel plots
(Figures S36‐S70).
The high reliability of the overall results was suggested by high
between‐sample absolute agreement for domains (ICC2,11 = 0.83,
95% CI, 0.45‐0.98, F 4,40 = 5.3, P = 0.002) and for facets (ICC2,11 = 0.87,
95% CI, 0.78‐0.93, F 29,290 = 7.7, P < 0.001). However, the meta‐
analytic profile was not in agreement with results obtained with
IPIP‐NEO (ICC2,2 = 0.04, 95% CI, −0.26 to 0.37, F 29,29 = 1.11,
P = 0.393) or 100‐item Korean NEO PI‐R (men: ICC2,2 = 0.38, 95%
CI, −0.22 to 0.69, F 29,29 = 1.67, P = 0.086; women: ICC2,2 = 0, 95%
CI, −1.08 to 0.52, F 29,29 = 1, P = 0.5). Similar results were present
for Korean sample at domain levels (men: ICC2,2 = 0.18, 95% CI,
−6.17 to 0.91, F 4,4 = 1.23, P = 0.424; women: ICC2,2 = 0, 95% CI,
−8.6 to 0.9, F 4,4 = 1, P = 0.5).
3.2 | Moderation of personality‐BMI associations
Despite the overall between‐sample congruence in findings, heteroge-
neity analysis with I2 indices (Figure 2) suggested that effect sizes for
some traits varied across samples. The effect sizes of traits with I2
confidence intervals not spanning zero were analysed with meta‐
regression. We found that the positive N5: Impulsiveness‐BMI associ-
ation strengthened as a function of the samples' proportion of people
with obesity and participants' mean age and weakened with increased
proportion of women in the sample (Figure 3). On a smaller scale,
prevalence of obesity status also increased the negative association
between C2: Order and BMI, whereas the effects of some Extraver-
sion facets were reduced by the proportion of women and increased
by the age of the group.
Most of the meta‐regression results replicated at the individual
level in the Estonian Biobank (Figure 4). Both self and informant data
provided robust evidence for a stronger N5: Impulsiveness‐BMI corre-
lation in participants with obesity. The C2: Order‐BMI correlation only
emerged in participants with obesity. Intriguingly, we found that the
Extraversion domain to have opposing effects: In participants with
BMI below 30, Extraversion has positive association with BMI,
whereas the effect was reversed in participants with obesity. This

FIGURE 2 I2 heterogeneity values. I2 characterizes the percentageof variation, which is attributable to effect‐size variation betweensamples rather than chance. Error bars denote 95% confidence
intervals. Black circles highlight traits where lower confidence interval(CI) did not touch 0. Numeric values are presented in Table S3
1126 VAINIK ET AL.
may be one explanation to the lack of linear association between
Extraversion and BMI at the meta‐analytic level. In females, BMI had
lower correlation with Extraversion and likely also with N5: Impulsive-
ness, when not accounting for education (Figure S71). We found no
effects for age on personality‐BMI relationship that would replicate
across self and informant levels.
3.3 | Domains and facets as predictors of BMI innew data
We then created DRS and FRS for BMI in the Estonian Biobank, apply-
ing them to both self‐report (DRSself and FRSself) and informant‐
reported (DRSinformant and FRSinformant) NEO PI‐3 personality trait
scores. We found that after adjusting for typical covariates, such as
age, age2, sex, and education, FRSself and FRSinformant explained
409% and 465% more variance in BMI than DRSself and DRSinformant
(see Table 2). Apart from age, the FRS outperformed other covariates,
such as age2 as sex and education, suggesting that facets offer an
incrementally detailed understanding of BMI. To probe, whether the
FRS results depended on the relatively large effect size of N5: Impul-
siveness, we also built FRS‐s excluding N5: Impulsiveness facet. These
FRS‐s still predicted 278% and 230% more variance in BMI than DRS‐
s (Table 2), suggesting that the cumulative small effects matter. With-
out controlling for education, the R2 of all personality scores increased
by 0.2% (Table S4).
As additional analysis, we entered DRS and FRS as predictors into
the same model to test the incremental utility of FRS over DRS. We
tested all four FRS‐s mentioned above, and they conferred substantial
incremental predictive value over DRS (Table 2). Intriguingly, the R2 of
FRS was even higher than in previous models with FRS without DRS.
However, it should be noted that the DRS and FRS are strongly corre-
lated (r≈ 0.90; VIF≈ 4.5) and the regression weights of DRS and FRS
became opposite of each other, suggesting difficulties in interpreting
such combined models.
4 | DISCUSSION
We conducted a meta‐analysis covering both the NEO PI‐R/3 person-
ality domains and facets associated with BMI, collating data from
14 848 participants. At the domain level, BMI was weakly positively
associated with Neuroticism and negatively with Conscientiousness.
At the facet level, we replicated and extended the small but consistent
effects of specific facets within each of the five domains. We also
found that sample characteristics, such as prevalence of obesity and
sex balance partly explained the heterogeneity in personality trait–
BMI associations between 11 samples and within a single sample.
Finally, we demonstrated that despite the small effect sizes of the
personality‐BMI associations, they can be used to predict BMI in
new data using the full version of NEO PI‐3.
The domain‐level associations of BMI with higher Neuroticism and
lower Conscientiousness may suggest a role of increased anxious
behaviour and decreased self‐control capabilities.3,4,6,7 However,
many details remain hidden in broad domain‐based findings. The
domain‐level effects were not mirrored by all facets within their
respective domains, suggesting that personality‐BMI associations
largely pertain to facet‐level traits.11 Therefore, interpreting the
effects of individual facets enables a more fine‐grained understanding
of personality‐BMI associations.

FIGURE 3 Meta‐regression slope estimatesfor personality‐BMI associations displayingheterogeneity in Figure 2. Slope can beinterpreted as change in effect size due to amoderator. Intercepts are not displayed. Errorbars denote 95% confidence intervals
FIGURE 4 Demographic variablesinteracting with trait‐BMI associations in theEstonian cohort. Leftmost panel displays thebaseline trait–BMI association afteraccounting for control variables (age, age2,education, and sex) in males with BMI < 30,and mean age. Other panels display thedifference in effect size evoked by eachmoderator. Age, BMI, and personality traitswere scaled. Error bars denote 95%confidence intervals. C2 = C2: Order,E = Extraversion; E3 = E3: Assertiveness;N5 = N5: Impulsiveness. BMI, body massindex
TABLE 2 Percent of variance (R2) in body mass index explained by control variables and personality risk scoresa
Model Variable Variable R2 2.5% CI 97.5% CI
Baseline multiple regression Age 16.84 14.71 19.17
Age2 0.99 0.52 1.63
Sex 0.83 0.39 1.50
Education 1.21 0.70 2.06
Baseline + domain risk score (DRS) DRSself 0.46 0.13 0.92
DRSinformant 0.37 0.08 0.86
Baseline + facet risk score (FRS) FRSself 2.34 1.50 3.23
FRSinformant 1.72 0.97 2.58
FRSself no N5 1.74 1.01 2.52
FRSinformant no N5 1.22 0.60 1.9
Baseline + DRS + FRS FRSself 3.87 2.88 5.00
FRSinformant 3.21 2.30 4.33
FRSself no N5 1.91 1.17 2.74
FRSinformant no N5 1.36 0.73 2.15
aBaseline model is a multiple regression model of covariates inserted together (age, age2, education, and sex). Total baseline model R2 = 19.87%, 95% CI,
17.8‐22.33. After that, each polytrait risk score was added as a fifth predictor. In the last four models, two polytrait risk scores were the fifth and sixth
variables, either only from self‐report or only from other report. For all regression models, P < 0.001 for the variables reported. Confidence intervals have
been bootstrapped 1000 times. Results without controlling for education are presented in Table S4.
VAINIK ET AL. 1127

1128 VAINIK ET AL.
Within Neuroticism, BMI associated foremost with higher N5:
Impulsiveness indexing inability to control cravings and urges. The
strongest effect size of N5: Impulsiveness is likely explained by the
facet having two items directly refer to overeating, (#111—“I tend to
eat too much of my favourite food” and #171—“Sometimes I am not
able to control my appetite,”11). Therefore, the facet seems to be index
uncontrolled eating, a behaviour already robustly associated with
BMI.54,55 There is some evidence that N5: Impulsiveness changes con-
currently with BMI changes,56 further highlighting a strong link
between them. At the same time, studies using other measures of
uncontrolled eating suggest that BMI and uncontrolled eating are
related but ultimately dissociable processes (reviewed in Vainik et al.55).
BMI also related positively to other facets of Neuroticism, such as
N2: Angry Hostility, capturing a tendency to experience anger, frustra-
tion, and bitterness, and N4: Self‐consciousness, representing feelings
of shame and embarrassment. These effects may reflect the negative
connotations of discrimination experienced by people with obesity.57
Causal designs, including Mendelian randomization and longitudinal
studies, suggest that increase in BMI could lead to lower well‐being
and higher depression58-60. However, stress levels may also predict
future BMI,61 suggesting a bidirectional association. We were
surprised not to see effects of N1: Anxiety, N3: Depression, and N6:
Vulnerability, which could have been expected from the known asso-
ciation of obesity and depression.62 Instead, obesity may predomi-
nantly be associated with more outward expression of negative affect.
Within Conscientiousness, higher BMI related negatively to
orderliness‐related facets, reflecting ability to plan and organize tasks
and activities.63,64 Facets supporting this conclusion are C2: Order,
indexing organized and methodological behaviour; C3: Dutifulness,
measuring adherence to ethical principles and obligations; and C6:
Deliberation, capturing thinking before acting. In addition, there was
a negative effect of C5: Self‐discipline, assessing the ability to com-
plete tasks. Given that losing weight is a difficult task, the Conscien-
tiousness facets may reflect troubles with adherence to weight loss
regimens in people with obesity. The importance of planning and orga-
nizing tasks conceptually supports the role that self‐control plays in
obesity, which has also been highlighted by research on executive
functions and prefrontal cortex.3,19,21,65 Scarce longitudinal evidence
has suggested that obesity could have bidirectional associations with
self‐control capabilities,8,65 while a Mendelian randomization study
suggested that higher education and cognitive ability could cause
lower BMI.66
The effect of domain‐level Extraversion on BMI was inconsistent,
as facets differed in the directions of their associations with BMI. On
the one hand, BMI related positively to E1: Warmth, indexing friendli-
ness and affectionate behaviour; to E3: Assertiveness, measuring dom-
inance, forceful actions, and social ascendance; and to E6: Positive
Emotions, where high scorers are cheerful and optimistic. These results
suggest that perhaps people with obesity are also more sensitive to
positive reinforcers. At the same time, high BMI related negatively to
E4: Activity, which captures tendencies to be active and in vigorous
movement, a result likely explained by morphometric constraints
resulting from high BMI or lack of exercise intersecting with BMI.
The unexpected moderation of Extraversion effects by obesity status
may be explained by the different direction of facets, or hint at a pos-
sible curvilinear association between reward sensitivity and BMI.67
Facets of the same domain differing in the directions of their correla-
tions with BMI highlight the value of more fine‐grained analyses.
Finally, specific facets appeared from Openness and Agreeableness
domains in relation to BMI. BMI associated negatively with two facets
belonging to the Politeness aspect of Agreeableness: A2: Straightfor-
wardness, representing frank, sincere, and ingenious social interaction;
and A4: Compliance, where high scorers avoid interpersonal conflict.
The Politeness aspect characterizes more cognitive or reasoned
respect for others' desires, as opposed to compassionate emotional
affiliation.64 Lack of such behaviour can be speculated to be another
response to the stigmatizing social experiences related to weight.
Within Openness, BMI related negatively to O4: Actions, capturing
willingness to try different activities, and to O6: Values, measuring
readiness to re‐examine social, political, and religious values. Higher
scores on Openness facets may protect from BMI by supporting eating
healthier diets.68-70
In case personality trait–BMI associations slightly varied from sam-
ple to sample, we found that the variation was partly explained by
general sample characteristics, such as percent of participants with
obesity and prevalence of females in the sample. Sex differences in
Extraversion‐BMI associations have been demonstrated previously7
and were found again in the current study. As novel findings, we
reported obesity status moderating the effects of N5: Impulsiveness,
C2: Order, and Extraversion. Therefore, the previously observed effect
size differences between samples attributed to culture7 may also be
attributed to differences in basic sample characteristics. In future,
these basic characteristics should be accounted for, before attributing
effect size differences to culture.
We were able to quantify the utility of facets over domains with the
poly‐trait risk score approach. Specifically, when the small effects of
multiple traits were aggregated, a facet‐based risk score outperformed
the domain‐based risk score in predictive power, either when the
scores were tested one by one or when used together in a regression
model. This is a direct support of the increased utility of using facets
when explaining outcomes.15-17 In the current analysis, FFM facets
accounted for five times as much variance in BMI as the broader
domains. Even when the N5: Impulsiveness facet tapping into uncon-
trolled eating11,54 was removed, the facet‐based risk scores were still
able to predict extra variance in BMI, above and beyond the domains.
Therefore, the personality‐BMI associations include a considerably
larger repertoire of behaviours than just uncontrolled eating.31
On a practical level, the facet‐BMI associations could provide
starting points for designing interventions for obesity, whereas the
ambiguous domain‐level associations would be far less informative
for this purpose. The large number facets highlights that increased
BMI is a complex phenotype with multiple associated mental
processes, and these processes could be targeted in an intervention.
For instance, weight‐loss interventions have designed based on cogni-
tive tests.71 Similarly, in the substance abuse domain, personality
trait–specific interventions have been developed.72

VAINIK ET AL. 1129
From a more theoretical perspective, the facet‐level personality
profile can be used to quantify the behavioural similarity that BMI
has with other phenotypes not necessarily measured in the same
sample. This can be achieved by comparing the similarity of current
meta‐analytic personality profile with the profile of other phenotypes
of interest. For instance, BMI has a moderate behavioural similarity
with both addictions, as well as with certain other psychiatric
conditions.31 Finally, the detailed personality profile can be used to
make better predictions of BMI in new samples using NEO PI‐R/3,
which may be useful for research purposes, such as trying to bring
together behavioural, brain, and genetic factors to explain obesity
(eg, Vainik et al21).
As a limitation, both the theoretical interpretations and predictive
ability are limited to concurrent BMI and not future BMI. Therefore,
the facets highlighted here outline the behavioural profile of BMI, but
do not offer evidence on the directionality of the association, that is,
whether personality traits lead to higher BMI, or vice versa. Few stud-
ies have published personality profiles for predicting variability and
change in BMI; these profiles look similar to the current results at
domain level5,7,61 but are different at the facet level.10 Due to limita-
tions of current data, the poly‐trait risk scores assume additive effects
in personality trait–BMI associations, as well as when aggregating
individual personality traits into a combined score. Possibly, the predic-
tion could be improved by integrating nonadditive effects into the
score. The current prediction accuracy prevents the use of the poly‐
trait risk scores for predicting individual BMI. This task is better
achieved by traditional measures, such as childhood obesity or parental
obesity73 when this information is available. The meta‐analytic profile
did not generalize well to the IPIP‐NEO or to the 100‐item Korean
version of NEO PI‐R. The lack of overlap may be explained by both
differences between personality questionnaires, as well as partly by
the small sample size of the IPIP‐NEO sample (n = 84). Therefore, the
IPIP‐NEO overlap should be studied further with larger samples.
Another limit of the current meta‐analysis pertains to the
moderator analysis: We had only 11 samples available for the
meta‐regression. At the same time, most of the meta‐regression
results replicated at individual‐level self‐ and informant‐derived
personality data, suggesting the effects are real. Otherwise, different
NEO PI‐R/3 samples were generally in high agreement about more
and less prominent personality traits, suggesting that the results hold
across multiple cultures, and can be used to predict BMI in an unseen
sample, with an effect size stronger than most control variables.
To conclude, the diverse set of narrower personality traits associ-
ated with BMI highlight that personality‐health associations may be
too complex for broad personality trait models such as the FFM. This
can be mitigated by more detailed descriptions of personality that can
be derived from facets or nuances,74 potentially increasing under-
standing and intervening on health differences.
ACKNOWLEDGEMENTS
Uku Vainik is supported by Estonian Research Council's Personal Post-
doctoral Research Funding project PUTJD654 and by Fonds de
recherche du Québec—Santé (FRQS) foreign postdoctoral training
award. Alain Dagher is supported by Canadian Institutes of Health
Research. Anu Realo, René Mõttus, and Uku Vainik were supported
by institutional research funding (IUT2‐13) from the Estonian Ministry
of Education and Science. Lucía Colodro‐Conde is supported by a
QIMR Berghofer Fellowship. The GEMINAKAR project was supported
by grants from the Danish Medical Research Fund, the Danish Diabe-
tes Association, the NOVO Foundation, the Danish Heart Foundation,
and Apotekerfonden. QIMR Berghofer data collection was supported
by the National Health and Medical Research Council (NHMRC, Aus-
tralia; grants 901061, 950998, and 241944). We are grateful to the
Estonian Genome Centre of the University of Tartu and its director,
Andres Metspalu, for help in collecting the data and the kind permis-
sion to access the data used in the current study.
CONFLICT OF INTEREST
No conflict of interest was declared.
ORCID
Uku Vainik https://orcid.org/0000-0002-9375-9520
REFERENCES
1. Abajobir AA, Abate KH, Abbafati C, et al. Global, regional, and national
comparative risk assessment of 84 behavioural, environmental and
occupational, and metabolic risks or clusters of risks, 1990‐2016: a sys-tematic analysis for the Global Burden of Disease Study 2016. The
Lancet. 2017;390:1345‐1422.
2. Angelantonio ED, Bhupathiraju SN, Wormser D, et al. Body‐mass
index and all‐cause mortality: individual‐participant‐data meta‐analysis of 239 prospective studies in four continents. The Lancet.
2016;388(10046):776‐786.
3. Emery RL, Levine MD. Questionnaire and behavioral task measures of
impulsivity are differentially associated with body mass index: a com-
prehensive meta‐analysis. Psychol Bull. 2017;143(8):868‐902.
4. Gerlach G, Herpertz S, Loeber S. Personality traits and obesity: a sys-
tematic review. Obes Rev. 2015;16(1):32‐63.
5. Jokela M, Hintsanen M, Hakulinen C, et al. Association of personality
with the development and persistence of obesity: a meta‐analysisbased on individual‐participant data. Obes Rev. 2013;14(4):315‐323.
6. Michaud A, Vainik U, García‐García I, Dagher A. Overlapping neural
endophenotypes in addiction and obesity. Front Endocrinol.
2017;8(127):1‐15.
7. Sutin AR, Terracciano A. Personality and body weight. Jpn J Personal.
2017;26(1):1‐11.
8. Vainik U, Dagher A, Dubé L, Fellows LK. Neurobehavioural correlates
of body mass index and eating behaviours in adults: a systematic
review. Neurosci Biobehav Rev. 2013;37(3):279‐299.
9. Ozer DJ, Benet‐Martínez V. Personality and the prediction of conse-
quential outcomes. Annu Rev Psychol. 2006;57(1):401‐421.
10. Sutin AR, Ferrucci L, Zonderman AB, Terracciano A. Personality and
obesity across the adult life span. J Pers Soc Psychol. 2011;
101(3):579‐592.
11. Vainik U, Mõttus R, Allik J, Esko T, Realo A. Are trait‐outcome associa-
tions caused by scales or particular items? Example analysis of
personality facets and BMI. Eur J Personal. 2015;29:688‐634.

1130 VAINIK ET AL.
12. Terracciano A, Sutin AR, McCrae RR, et al. Facets of personality linked
to underweight and overweight. Psychosom Med. 2009;71(6):682‐689.
13. Costa PT, McCrae RR. Revised NEO Personality Inventory (NEO‐PI‐R)and NEO Five‐Factor Inventory (NEOFFI)—Professional Manual. Odessa,
FL: Psychological Assessment Resources, Inc; 1992.
14. McCrae RR, Costa PT Jr, Martin TA. The NEO–PI–3: A More Readable
Revised NEO Personality Inventory. J Pers Assess. 2005;84:261‐270.
15. Judge TA, Rodell JB, Klinger RL, Simon LS, Crawford ER. Hierarchical
representations of the five‐factor model of personality in predicting
job performance: integrating three organizing frameworks with two
theoretical perspectives. J Appl Psychol. 2013;98(6):875‐925.
16. Costa PT Jr, McCrae RR. Domains and facets: hierarchical personality
assessment using the Revised NEO Personality Inventory. J Pers Assess.
1995;64:21‐50.
17. Mõttus R. Towards more rigorous personality trait–outcome research.
Eur J Personal. 2016;30(4):292‐303.
18. Meule A, Reichenberger J, Blechert J. Development and preliminary
validation of the Salzburg Emotional Eating Scale. Front Psychol.
2018;9(88):1‐10.
19. Yang Y, Shields GS, Guo C, Liu Y. Executive function performance in
obesity and overweight individuals: a meta‐analysis and review.
Neurosci Biobehav Rev. 2018;84:225‐244.
20. Mõttus R, Realo A, Vainik U, Allik J, EskoT. Educational attainment and
personality are genetically intertwined. Psychol Sci. 2017;28(11):
1631‐1639.
21. Vainik U, Baker TE, Dadar M, et al. Neurobehavioral correlates of obe-
sity are largely heritable. Proc Natl Acad Sci. 2018;115(37):9312‐9317.
22. Benning SD, Patrick CJ, Blonigen DM,Hicks BM, IaconoWG. Estimating
facets of psychopathy from normal personality traits: a step toward
community epidemiological investigations. Assessment. 2005;12(1):
3‐18.
23. Lee JJ, Wedow R, Okbay A, et al. Gene discovery and polygenic predic-
tion from a genome‐wide association study of educational attainment
in 1.1 million individuals. Nat Genet. 2018;50(8):1112‐1121.
24. Dudbridge F. Power and predictive accuracy of polygenic risk scores.
PLoS Genet. 2013;9(3):e1003348.
25. Goldberg L. A broad‐bandwidth, public‐domain, personality inventory
measuring the lower‐level facets of several Five‐Factor models.
In: Personality Psychology in Europe. Vol.7 Tilburg: Tilburg University
Press; 1999.
26. Terracciano A, Abdel‐Khalek AM, Ádám N, et al. National character
does not reflect mean personality trait levels in 49 cultures. Science.
2005;310(5745):96‐100.
27. Sutin AR, Rogers DL, Mercado A, et al. The association between per-
sonality traits and body mass index varies with nativity among
individuals of Mexican origin. Appetite. 2015;90:74‐79.
28. Shim U, Kim H‐N, Roh S‐J, et al. Personality traits and body mass index
in a Korean population. PLOS One. 2014;9(3):e90516.
29. Garrido SJ, Funes PN, Peñaloza Merlo ME, Cupani M. Personality traits
associated with eating disorders and obesity in young Argentineans.
Eat Weight Disord ‐ Stud Anorex Bulim Obes. 2018;23(5):571‐579.
30. Costa PT, McCrae RR. The NEO Personality Inventory: 3. Odessa FL
Psychol Assess Resour. 2010.
31. Vainik U, Misic B, Zeighami Y, Michaud A, Mõttus R, Dagher A. Obesity
has limited behavioural overlap with addiction and psychiatric pheno-
types. Resubmitted 2018.
32. Kim J. Personality traits and body weight: evidence using sibling com-
parisons. Soc Sci Med. 2016;163:54‐62.
33. Gillespie NA, Henders AK, Davenport TA, et al. The Brisbane Longitu-
dinal Twin Study: pathways to Cannabis use, abuse, and dependence
project—current status, preliminary results, and future directions. Twin
Res Hum Genet. 2013;16:21‐33.
34. Reiersen AM, Constantino JN, Grimmer M, Martin NG, Todd RD. Evi-
dence for shared genetic influences on self‐reported ADHD and
autistic symptoms in young adult Australian twins. Twin Res Hum Genet
off J Int Soc Twin Stud. 2008;11(06):579‐585.
35. Lynskey MT, Agrawal A, Henders A, Nelson EC, Madden PAF, Martin
NG. An Australian twin study of Cannabis and other illicit drug use
and misuse, and other psychopathology. Twin Res Hum Genet off J Int
Soc Twin Stud. 2012;15(05):631‐641.
36. Jang KL, Taylor S, Livesley WJ. The University of British Columbia twin
project: personality is something and personality does something. Twin
Res Hum Genet. 2006;9(06):739‐742.
37. Makransky G, Mortensen EL, Glas CAW. Improving personality facet
scores with multidimensional computer adaptive testing: an illustration
with the NEO PI‐R. Assessment. 2013;20(1):3‐13.
38. Kandler C, Riemann R, Spinath FM, Bleidorn W, Thiel W, Angleitner A.
The Bielefeld Longitudinal Study of Adult Twins (BiLSAT). Twin Res
Hum Genet. 2013;16:167‐172.
39. Ando J, Suzuki A, Yamagata S, et al. Genetic and environmental struc-
ture of Cloninger's temperament and character dimensions. J Pers
Disord. 2004;18(4):379‐393.
40. Schwarzer G. meta: general package for meta‐analysis. 2017.
41. Revelle W. psych: procedures for psychological, psychometric, and per-
sonality research. 2014.
42. Koo TK, Li MY. A guideline of selecting and reporting intraclass corre-
lation coefficients for reliability research. J Chiropr Med. 2016;15(2):
155‐163.
43. Higgins JPT. Green S. 9.6 investigating heterogeneity. In: Cochrane
Handbook for Systematic Reviews of Interventions. Chichester, England:
John Wiley & Sons; 2011.
44. Allik J, de Vries RE, Realo A. Why are moderators of self‐other agree-ment difficult to establish? J Res Personal. 2016;63:72‐83.
45. Johnson W, Kyvik KO, Skytthe A, Deary IJ, Sørensen TIA. Education
modifies genetic and environmental influences on BMI. PLOS One.
2011;6(1):e16290.
46. Barcellos SH, Carvalho LS, Turley P. Education can reduce health dif-
ferences related to genetic risk of obesity. Proc Natl Acad Sci.
2018;115(42):E9765‐E9772.
47. R Core Team. R: A Language and Environment for Statistical Computing.
Vienna, Austria: R Foundation for Statistical Computing; 2013.
48. Arnholt AT. BSDA: basic statistics and data analysis. 2012.
49. Re AD. Compute.es: compute effect sizes. 2014.
50. Wickham H, RStudio. tidyverse: easily install and load the “Tidyverse.”;2017.
51. Wilke CO, Wickham H. Cowplot: streamlined plot theme and plot
annotations for “ggplot2”. 2016.
52. Kuznetsova A, Brockhoff PB, Christensen RHB. lmerTest package:
tests in linear mixed effects models. J Stat Softw. 2017;82(13):1‐26.
53. Bates D, Mächler M, Bolker B, Walker S. Fitting linear mixed‐effectsmodels using lme4. J Stat Softw. 2015;67(1):1‐48.
54. Vainik U, Neseliler S, Konstabel K, Fellows LK, Dagher A. Eating traits
questionnaires as a continuum of a single concept. Uncontrolled eat-
ing. Appetite. 2015;90:229‐239.
55. Vainik U, García‐García I, Dagher A. Uncontrolled eating: a unifying
heritable trait linked with obesity, overeating, personality, and the
brain. Eur J Neurosci. 2019;1‐16.

VAINIK ET AL. 1131
56. Sutin AR, Costa PT Jr, Chan W, et al. I know not to, but I can't help it:
weight gain and changes in impulsivity‐related personality traits.
Psychol Sci. 2013;24(7):1323‐1328.
57. Collins J, Meng C, Eng A. Psychological impact of severe obesity. Curr
Obes Rep. 2016;5(4):435‐440.
58. Wootton RE, Lawn RB, Millard LAC, et al. Evaluation of the causal
effects between subjective wellbeing and cardiometabolic health:
Mendelian randomisation study. BMJ. 2018;362:k3788.
59. Knüppel A, Shipley MJ, Llewellyn CH, Brunner EJ. Weight change
increases the odds of psychological distress in middle age: bidirectional
analyses from the Whitehall II Study. Psychol Med undefined/ed.
2018:1‐10. https://www.cambridge.org/core/journals/psychological-
medicine/article/weight-change-increases-the-odds-of-psychological-
distress-in-middle-age-bidirectional-analyses-from-the-whitehall-ii-
study/C64A45538AA25A6373D29D4A627C8F75
60. van den Broek N, Treur JL, Larsen JK, Verhagen M, Verweij KJH, Vink
JM. Causal associations between body mass index and mental health: a
Mendelian randomisation study. J Epidemiol Community Health.
2018;72:708‐710.
61. Korkeila M, Kaprio J, Rissanen A, Koshenvuo M, Sörensen TI. Predic-
tors of major weight gain in adult Finns: stress, life satisfaction and
personality traits. Int J Obes Relat Metab Disord J Int Assoc Study Obes.
1998;22(10):949‐957.
62. Luppino F. Overweight, obesity, and depression: a systematic review
and meta‐analysis of longitudinal studies. Arch Gen Psychiatry.
2010;67(3):220‐229.
63. DeYoung CG, Quilty LC, Peterson JB. Between facets and domains: 10
aspects of the Big Five. J Pers Soc Psychol. 2007;93(5):880‐896.
64. Roberts BW, Chernyshenko OS, Stark S, Goldberg LR. The structure of
conscientiousness: an empirical investigation based on seven major
personality questionnaires. Pers Psychol. 2005;58(1):103‐139.
65. Smith E, Hay P, Campbell L, Trollor J. A review of the association
between obesity and cognitive function across the lifespan: implica-
tions for novel approaches to prevention and treatment. Obes Rev.
2011;12(9):740‐755.
66. Sanderson E, Davey Smith G, Windmeijer F, Bowden J. An
examination of multivariable Mendelian randomization in the single‐
sample and two‐sample summary data settings. Int J Epidemiol.
2018;1‐15.
67. Davis C, Fox J. Sensitivity to reward and body mass index (BMI):
evidence for a non‐linear relationship. Appetite. 2008;50(1):43‐49.
68. Lunn TE, Nowson CA, Worsley A, Torres SJ. Does personality affect
dietary intake? Nutrition. 2014;30(4):403‐409.
69. Mõttus R, McNeill G, Jia X, Craig LCA, Starr JM, Deary IJ. The associ-
ations between personality, diet and body mass index in older people.
Health Psychol. 2013;32(4):353‐360.
70. Mõttus R, Realo A, Allik J, Deary IJ, Esko T, Metspalu A. Personality
traits and eating habits in a large sample of Estonians. Health Psychol.
2012;31(6):806‐814.
71. Jansen A, Houben K, Roefs A. A cognitive profile of obesity and
its translation into new interventions. Front Psychol. 2015;
6(1807):1‐9.
72. Conrod PJ. Personality‐targeted interventions for substance use and
misuse. Curr Addict Rep. 2016;3(4):426‐436.
73. Loos RJF, Janssens ACJW. Predicting polygenic obesity using genetic
information. Cell Metab. 2017;25(3):535‐543.
74. Mõttus R, Sinick J, Terracciano A, et al. Personality characteristics
below facets: a replication and meta‐analysis of cross‐rater agreement,
rank‐order stability, heritability, and utility of personality nuances.
J Pers Soc Psychol. 2018;1‐16.
SUPPORTING INFORMATION
Additional supporting information may be found online in the
Supporting Information section at the end of the article.
How to cite this article: Vainik U, Dagher A, Realo A, et al.
Personality‐obesity associations are driven by narrow traits:
A meta‐analysis. Obesity Reviews. 2019;20:1121–1131.
https://doi.org/10.1111/obr.12856


![Associations of obesity with modifiable risk factors for ... · 8/3/2008 · Rheumatoid arthritis (RA) associates with increased risk for cardiovascular disease (CVD) [1]. This is](https://static.fdocuments.net/doc/165x107/6020afc37cf6ad74c34d593e/associations-of-obesity-with-modifiable-risk-factors-for-832008-rheumatoid.jpg)