Persistent spatial structuring of coastal ocean acidification ... - C...
7
1 SCIENTIFIC REPORTS | 7: 2526 | DOI:10.1038/s41598-017-02777-y www.nature.com/scientificreports Persistent spatial structuring of coastal ocean acidification in the California Current System F. Chan 1 , J. A. Barth 2 , C. A. Blanchette 3 , R. H. Byrne 4 , F. Chavez 5 , O. Cheriton 6 , R. A. Feely 7 , G. Friederich 5 , B. Gaylord 8,9 , T. Gouhier 10 , S. Hacker 1 , T. Hill 8,11 , G. Hofmann 12 , M. A. McManus 13 , B. A. Menge 1 , K. J. Nielsen 14 , A. Russell 11 , E. Sanford 8,9 , J. Sevadjian 5 & L. Washburn 15 The near-term progression of ocean acidification (OA) is projected to bring about sharp changes in the chemistry of coastal upwelling ecosystems. The distribution of OA exposure across these early- impact systems, however, is highly uncertain and limits our understanding of whether and how spatial management actions can be deployed to ameliorate future impacts. Through a novel coastal OA observing network, we have uncovered a remarkably persistent spatial mosaic in the penetration of acidified waters into ecologically-important nearshore habitats across 1,000 km of the California Current Large Marine Ecosystem. In the most severe exposure hotspots, suboptimal conditions for calcifying organisms encompassed up to 56% of the summer season, and were accompanied by some of the lowest and most variable pH environments known for the surface ocean. Persistent refuge areas were also found, highlighting new opportunities for local adaptation to address the global challenge of OA in productive coastal systems. Eastern boundary current upwelling systems such as the California Current Large Marine Ecosystem (CCLME) represent one of the ocean’s most productive biomes, sustaining one-fiſth of the world’s fisheries 1 . Broad-scale observations 2 , and models 3 have highlighted the biogeochemical sensitivity of the CCLME to the rapid progres- sion of ocean acidification (OA). is susceptibility reflects the central role of upwelling currents in connecting coastal waters with the dissolved inorganic carbon (DIC)-rich ocean interior, and the high potential for active car- bon remineralization over productive continental shelves. Against this naturally-elevated DIC baseline, present day anthropogenic CO 2 burdens upwards of 60 μmol kg −1 have already resulted in declines of up to 0.12 and 0.5 in pH and Ω arag , respectively 3, 4 . Within the CCLME, model and broad-scale cruise surveys have further identified the nearshore as the region most strongly affected by present, and likely future, expression of OA 2–4 and is where the most frequent occurrences of severe shell dissolution in planktonic pteropods can already be found 5 . e nearshore waters (within 10 km of coast) of the CCLME contain crucial but vulnerable ecological and fishery habitats, encompassing nearly all U. S. West Coast kelp forests and marine reserves, as well as biologi- cally diverse intertidal habitats where calcifying organisms oſten dominate ecological structure and function 6 . While science and management decisions such as the placement of marine reserves in the CCLME have been 1 Department of Integrative Biology, Oregon State University, Corvallis, OR, USA. 2 College of Earth, Ocean, and Atmospheric Sciences, Oregon State University, Corvallis, OR, USA. 3 Marine Science Institute, University of California Santa Barbara, Santa Barbara, CA, USA. 4 College of Marine Science, University of South Florida, St. Petersburg, FL, USA. 5 Monterey Bay Aquarium Research Institute, Moss Landing, CA, USA. 6 Pacific Coastal and Marine Science Center, United States Geological Survey, Santa Cruz, CA, USA. 7 Pacific Marine Environmental Laboratory, National Oceanic and Atmospheric Administration, Seattle, WA, USA. 8 Bodega Marine Laboratory, University of California Davis, Bodega Bay, CA, USA. 9 Department of Evolution and Ecology, University of California Davis, Davis, CA, USA. 10 Marine Science Center, Northeastern University, Nahant, MA, USA. 11 Department of Earth and Planetary Sciences, University of California Davis, Davis, CA, USA. 12 Department of Ecology, Evolution and Marine Biology, University of California Santa Barbara, Santa Barbara, CA, USA. 13 Department of Oceanography, University of Hawaii at Manoa, Honolulu, HI, USA. 14 Romberg Tiburon Center for Environmental Studies, San Francisco State University, Tiburon, CA, USA. 15 Marine Science Institute and Department of Geography, University of California Santa Barbara, Santa Barbara, CA, USA. Correspondence and requests for materials should be addressed to F.C. (email: chanft@science. oregonstate.edu) Received: 6 September 2016 Accepted: 19 April 2017 Published: xx xx xxxx OPEN
Transcript of Persistent spatial structuring of coastal ocean acidification ... - C...

1Scientific RepoRts | 7: 2526 | DOI:10.1038/s41598-017-02777-y
www.nature.com/scientificreports
Persistent spatial structuring of coastal ocean acidification in the California Current SystemF. Chan1, J. A. Barth2, C. A. Blanchette 3, R. H. Byrne4, F. Chavez5, O. Cheriton6, R. A. Feely7, G. Friederich5, B. Gaylord8,9, T. Gouhier10, S. Hacker1, T. Hill8,11, G. Hofmann12, M. A. McManus13, B. A. Menge1, K. J. Nielsen14, A. Russell 11, E. Sanford8,9, J. Sevadjian5 & L. Washburn15
The near-term progression of ocean acidification (OA) is projected to bring about sharp changes in the chemistry of coastal upwelling ecosystems. The distribution of OA exposure across these early-impact systems, however, is highly uncertain and limits our understanding of whether and how spatial management actions can be deployed to ameliorate future impacts. Through a novel coastal OA observing network, we have uncovered a remarkably persistent spatial mosaic in the penetration of acidified waters into ecologically-important nearshore habitats across 1,000 km of the California Current Large Marine Ecosystem. In the most severe exposure hotspots, suboptimal conditions for calcifying organisms encompassed up to 56% of the summer season, and were accompanied by some of the lowest and most variable pH environments known for the surface ocean. Persistent refuge areas were also found, highlighting new opportunities for local adaptation to address the global challenge of OA in productive coastal systems.
Eastern boundary current upwelling systems such as the California Current Large Marine Ecosystem (CCLME) represent one of the ocean’s most productive biomes, sustaining one-fifth of the world’s fisheries1. Broad-scale observations2, and models3 have highlighted the biogeochemical sensitivity of the CCLME to the rapid progres-sion of ocean acidification (OA). This susceptibility reflects the central role of upwelling currents in connecting coastal waters with the dissolved inorganic carbon (DIC)-rich ocean interior, and the high potential for active car-bon remineralization over productive continental shelves. Against this naturally-elevated DIC baseline, present day anthropogenic CO2 burdens upwards of 60 μmol kg−1 have already resulted in declines of up to 0.12 and 0.5 in pH and Ωarag, respectively3, 4. Within the CCLME, model and broad-scale cruise surveys have further identified the nearshore as the region most strongly affected by present, and likely future, expression of OA2–4 and is where the most frequent occurrences of severe shell dissolution in planktonic pteropods can already be found5.
The nearshore waters (within 10 km of coast) of the CCLME contain crucial but vulnerable ecological and fishery habitats, encompassing nearly all U. S. West Coast kelp forests and marine reserves, as well as biologi-cally diverse intertidal habitats where calcifying organisms often dominate ecological structure and function6. While science and management decisions such as the placement of marine reserves in the CCLME have been
1Department of Integrative Biology, Oregon State University, Corvallis, OR, USA. 2College of Earth, Ocean, and Atmospheric Sciences, Oregon State University, Corvallis, OR, USA. 3Marine Science Institute, University of California Santa Barbara, Santa Barbara, CA, USA. 4College of Marine Science, University of South Florida, St. Petersburg, FL, USA. 5Monterey Bay Aquarium Research Institute, Moss Landing, CA, USA. 6Pacific Coastal and Marine Science Center, United States Geological Survey, Santa Cruz, CA, USA. 7Pacific Marine Environmental Laboratory, National Oceanic and Atmospheric Administration, Seattle, WA, USA. 8Bodega Marine Laboratory, University of California Davis, Bodega Bay, CA, USA. 9Department of Evolution and Ecology, University of California Davis, Davis, CA, USA. 10Marine Science Center, Northeastern University, Nahant, MA, USA. 11Department of Earth and Planetary Sciences, University of California Davis, Davis, CA, USA. 12Department of Ecology, Evolution and Marine Biology, University of California Santa Barbara, Santa Barbara, CA, USA. 13Department of Oceanography, University of Hawaii at Manoa, Honolulu, HI, USA. 14Romberg Tiburon Center for Environmental Studies, San Francisco State University, Tiburon, CA, USA. 15Marine Science Institute and Department of Geography, University of California Santa Barbara, Santa Barbara, CA, USA. Correspondence and requests for materials should be addressed to F.C. (email: [email protected])
Received: 6 September 2016
Accepted: 19 April 2017
Published: xx xx xxxx
OPEN
www.nature.com/scientificreports/
2Scientific RepoRts | 7: 2526 | DOI:10.1038/s41598-017-02777-y
informed by important spatial patterning in ocean circulation, population connectivity, biodiversity, and climate vulnerability7–9, basic information on whether the CCLME faces uniform or heterogeneous exposure to the pro-gression of OA is lacking. For coastal systems most at risk from OA, this limitation impairs our understanding of how biological and socio-economic vulnerability10 are distributed, and whether spatial management tools can be applied to ameliorate local impacts of globally-driven changes in ocean chemistry11. To resolve this uncertainty, we implemented an ocean observing network consisting of custom-designed pH sensors deployed in rocky inter-tidal habitats (see supplementary materials for methods) to provide the first high-frequency, multi-year view of near-shore OA progression across 1,000 km of the CCLME.
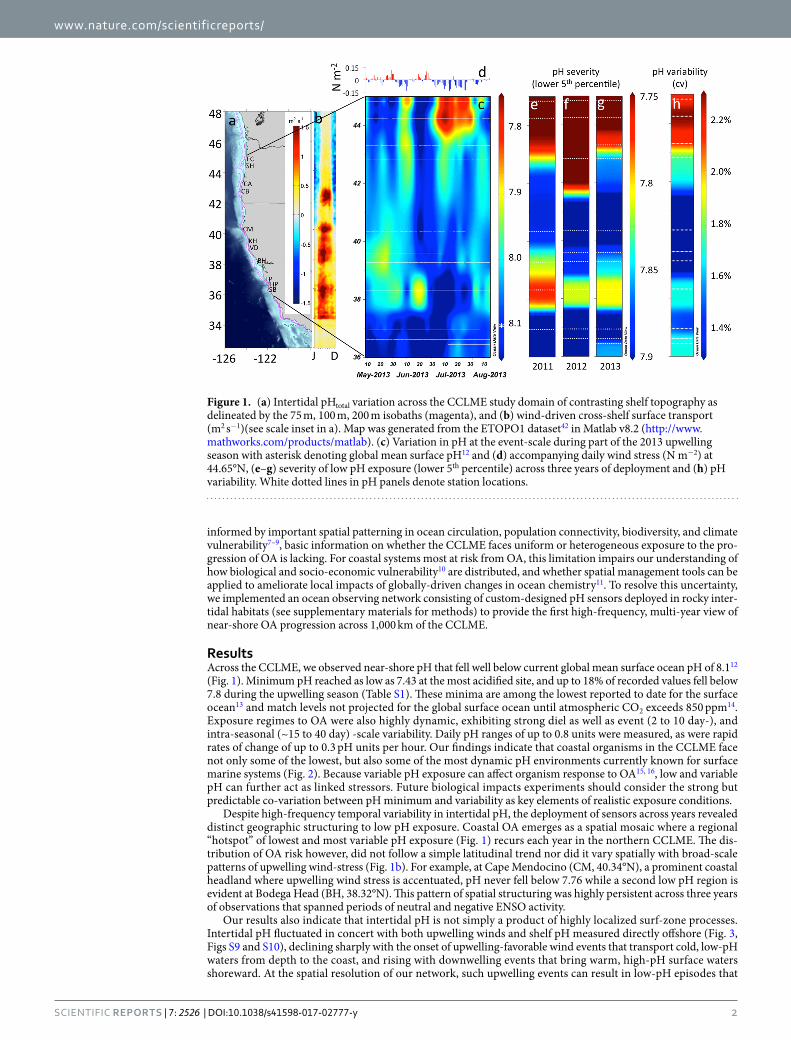
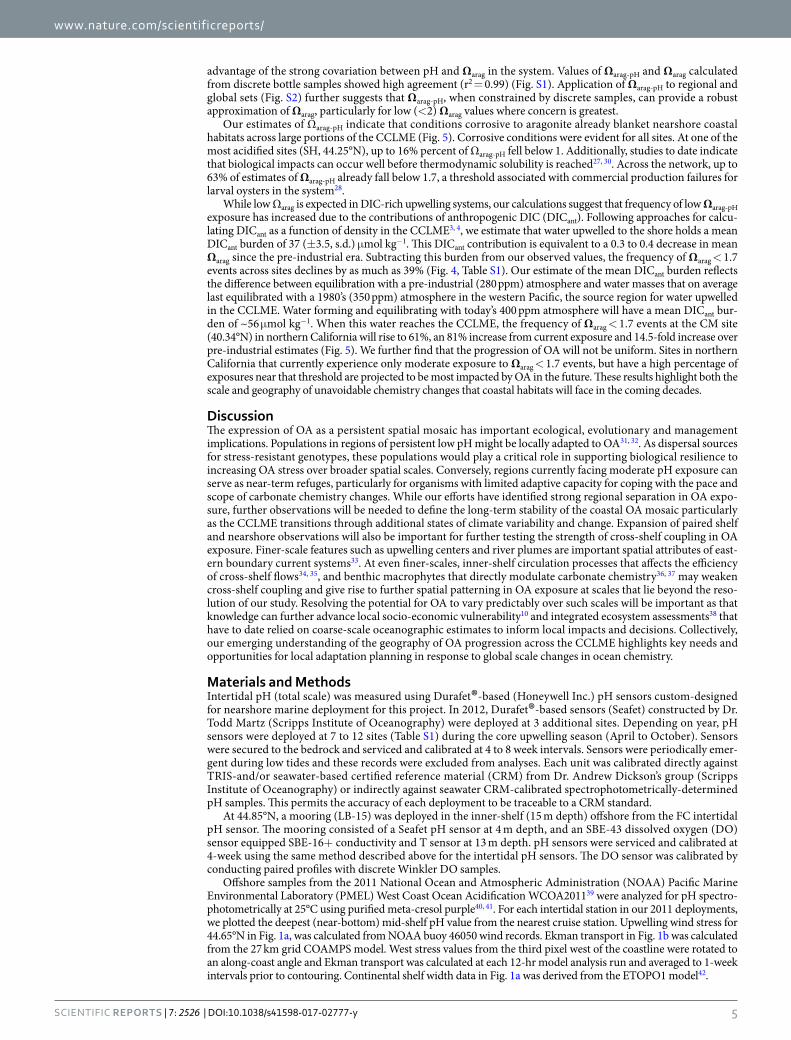
ResultsAcross the CCLME, we observed near-shore pH that fell well below current global mean surface ocean pH of 8.112 (Fig. 1). Minimum pH reached as low as 7.43 at the most acidified site, and up to 18% of recorded values fell below 7.8 during the upwelling season (Table S1). These minima are among the lowest reported to date for the surface ocean13 and match levels not projected for the global surface ocean until atmospheric CO2 exceeds 850 ppm14. Exposure regimes to OA were also highly dynamic, exhibiting strong diel as well as event (2 to 10 day-), and intra-seasonal (~15 to 40 day) -scale variability. Daily pH ranges of up to 0.8 units were measured, as were rapid rates of change of up to 0.3 pH units per hour. Our findings indicate that coastal organisms in the CCLME face not only some of the lowest, but also some of the most dynamic pH environments currently known for surface marine systems (Fig. 2). Because variable pH exposure can affect organism response to OA15, 16, low and variable pH can further act as linked stressors. Future biological impacts experiments should consider the strong but predictable co-variation between pH minimum and variability as key elements of realistic exposure conditions.
Despite high-frequency temporal variability in intertidal pH, the deployment of sensors across years revealed distinct geographic structuring to low pH exposure. Coastal OA emerges as a spatial mosaic where a regional “hotspot” of lowest and most variable pH exposure (Fig. 1) recurs each year in the northern CCLME. The dis-tribution of OA risk however, did not follow a simple latitudinal trend nor did it vary spatially with broad-scale patterns of upwelling wind-stress (Fig. 1b). For example, at Cape Mendocino (CM, 40.34°N), a prominent coastal headland where upwelling wind stress is accentuated, pH never fell below 7.76 while a second low pH region is evident at Bodega Head (BH, 38.32°N). This pattern of spatial structuring was highly persistent across three years of observations that spanned periods of neutral and negative ENSO activity.
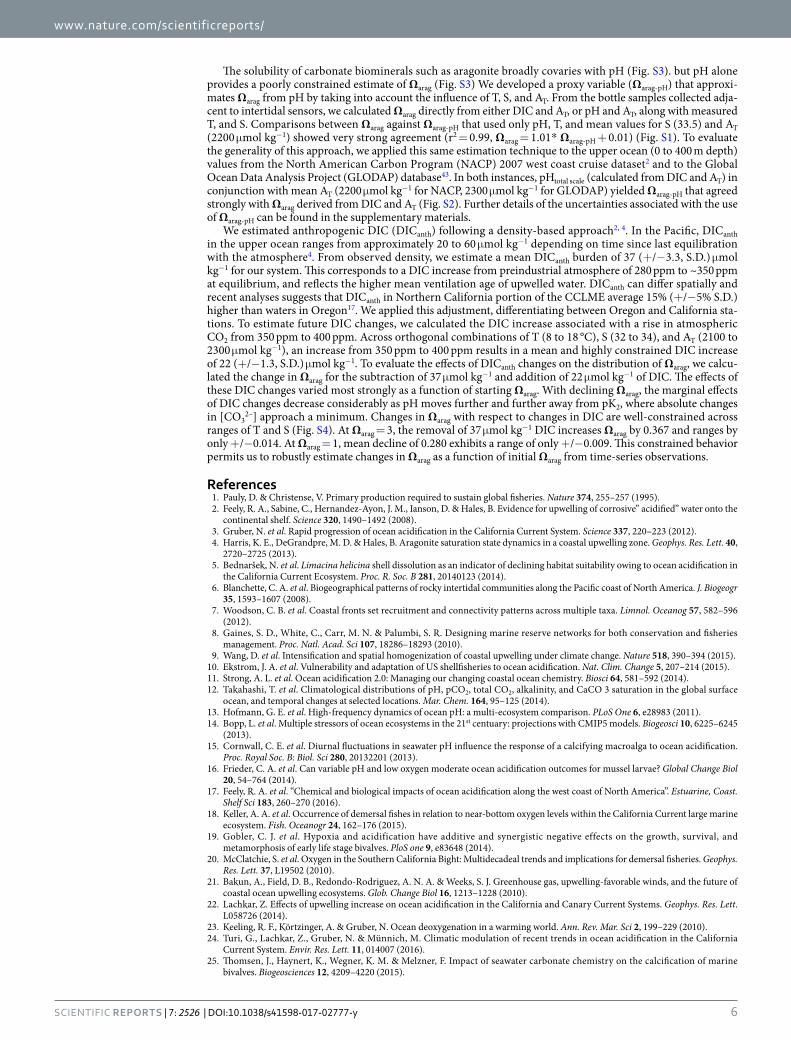
Our results also indicate that intertidal pH is not simply a product of highly localized surf-zone processes. Intertidal pH fluctuated in concert with both upwelling winds and shelf pH measured directly offshore (Fig. 3, Figs S9 and S10), declining sharply with the onset of upwelling-favorable wind events that transport cold, low-pH waters from depth to the coast, and rising with downwelling events that bring warm, high-pH surface waters shoreward. At the spatial resolution of our network, such upwelling events can result in low-pH episodes that
Figure 1. (a) Intertidal pHtotal variation across the CCLME study domain of contrasting shelf topography as delineated by the 75 m, 100 m, 200 m isobaths (magenta), and (b) wind-driven cross-shelf surface transport (m2 s−1)(see scale inset in a). Map was generated from the ETOPO1 dataset42 in Matlab v8.2 (http://www.mathworks.com/products/matlab). (c) Variation in pH at the event-scale during part of the 2013 upwelling season with asterisk denoting global mean surface pH12 and (d) accompanying daily wind stress (N m−2) at 44.65°N, (e–g) severity of low pH exposure (lower 5th percentile) across three years of deployment and (h) pH variability. White dotted lines in pH panels denote station locations.

www.nature.com/scientificreports/
3Scientific RepoRts | 7: 2526 | DOI:10.1038/s41598-017-02777-y
extend across 200 km of coastline (Fig. 1). In 2011, the passage of a NOAA OA survey cruise17 through the study region allowed us to further evaluate the broader-scale origin of the near-shore spatial pH mosaic. One-time ship-based pH profiles show a surprisingly strong correspondence between both the severity and frequency of low pH events encountered in the intertidal sensor network, and pH measured from continental shelf stations at depth (60–125 m depth) (Fig. 4, Fig. S8a). Correspondence between offshore surface pH values and variation in high pH events can also be seen (Fig. S8b). In conjunction with previously established distribution of carbonate chemistry changes offshore3, 5, our findings indicate that OA has already progressed to be a perturbation that extends across the continental shelf and into the land-sea interface of the CCLME (Fig. S9).
Low dissolved oxygen (DO) has documented impacts on marine life in the CCLME18, can accentuate the vul-nerability of organisms to OA19, and is a key issue of management concern20. We found that the most severe low pH events were consistently accompanied by the onset of hypoxia. Coastal organisms in the CCLME thus face an OA exposure regime that is not only highly temporally dynamic but also intimately tied to the co-occurrence of low DO stress. The progression of OA is intrinsically linked to the rate of ocean CO2 uptake1, 3. The coupling between surf-zone pH, atmospheric forcing, and shelf pH further suggests that climate-dependent processes such as intensification of upwelling wind stress21, 22 and ocean deoxygenation (when coupled to carbon remineraliza-tion)23 can modulate and potentially accelerate the rate of OA progression in the near-shore waters of eastern boundary current upwelling systems24.
Figure 2. Increase in pH variability (coefficient of variability) as a function of pH minimum across surface ocean datasets from present study (solid circles) and from a cross-biome survey13 (open circles) that includes representation from tropical, temperate, and polar surface ocean sites. Three sites that are strongly influenced by unique local conditions (an estuary, a volcanic CO2 vent and a groundwater discharge site) are excluded.
Figure 3. (a) 2013 wind forcing as indexed by along-shore wind stress at 44.65N, (b) intertidal pH (red) and inner-shelf pH (blue) at 44.25°N, (c) temperature (black) and dissolved oxygen (blue) from moorings deployed directly offshore (15 m water depth). Red line in (c) denotes hypoxia threshold of 65 μmol kg−1. Bold lines in (b,c) denote low-pass filtered (40 h window LOESS filter) time-series.

www.nature.com/scientificreports/
4Scientific RepoRts | 7: 2526 | DOI:10.1038/s41598-017-02777-y
While pH is a fundamental property of the carbonate system, OA can also affect organism performance through pCO2, HCO3
−, and/or CO32–dependent pathways25–27. In the CCLME, aragonite saturation state (Ωarag)
has emerged as a highly predictive parameter for linking carbonate chemistry change to biological impacts in a number of important taxa5, 27, 28. Calculation of Ωarag, however, requires at least one additional carbonate system parameter and ideally total alkalinity (AT) or DIC, as pH and pCO2 covary strongly. In-situ sensors for DIC or AT are not currently available for continuous surf-zone deployment and proxy approaches for estimating Ωarag from DO29 have not been verified for surface near-shore waters. We derived an estimate of Ωarag (Fig. 5, denoted as Ωarag-pH) using measured pH and temperature, together with mean values of salinity and alkalinity that takes
Figure 4. Correlation between point-in-time measurement of off-shore (water depth range of 60 to 125 m) near-bottom pH in 2011 from the (x-axis) and intertidal measurements of seasonal severity (lower 5th percentile, left y-axis) and frequency (% observations with pH < 7.8, denoted by symbol color and color bar) of low pH conditions. For station locations, refer to Table S1.
Figure 5. Changes in cumulative frequency of low aragonite saturation state events for three example sites (a–c) FC = Fogarty Creek, CM = Cape Mendocino, TP = Terrace Point) from pre-industrial (black), to present observations (blue), to future conditions (red). Black dotted lines represent ±3 s.d. window for estimates of pre-industrial states. Future conditions reflect the mean of an additional 22 μmol kg−1 of DIC that accompanies the arrival of water equilibrated with present-day 400 ppm atmosphere to the CCLME. Vertical lines in (a–c) denote Ωarag values of 1.7. Latitudinal patterns are shown for current lower 5th percentile Ωarag-pH (d), and projected past (e) present (f) and projected future (g) frequencies of Ωarag-pH ≤ 1.7, and frequency changes in Ωarag-pH ≤ 1.7 between the present and future projections (h).
www.nature.com/scientificreports/
5Scientific RepoRts | 7: 2526 | DOI:10.1038/s41598-017-02777-y
advantage of the strong covariation between pH and Ωarag in the system. Values of Ωarag-pH and Ωarag calculated from discrete bottle samples showed high agreement (r2 = 0.99) (Fig. S1). Application of Ωarag-pH to regional and global sets (Fig. S2) further suggests that Ωarag-pH, when constrained by discrete samples, can provide a robust approximation of Ωarag, particularly for low (<2) Ωarag values where concern is greatest.
Our estimates of Ωarag-pH indicate that conditions corrosive to aragonite already blanket nearshore coastal habitats across large portions of the CCLME (Fig. 5). Corrosive conditions were evident for all sites. At one of the most acidified sites (SH, 44.25°N), up to 16% percent of Ωarag-pH fell below 1. Additionally, studies to date indicate that biological impacts can occur well before thermodynamic solubility is reached27, 30. Across the network, up to 63% of estimates of Ωarag-pH already fall below 1.7, a threshold associated with commercial production failures for larval oysters in the system28.
While low Ωarag is expected in DIC-rich upwelling systems, our calculations suggest that frequency of low Ωarag-pH exposure has increased due to the contributions of anthropogenic DIC (DICant). Following approaches for calcu-lating DICant as a function of density in the CCLME3, 4, we estimate that water upwelled to the shore holds a mean DICant burden of 37 (±3.5, s.d.) μmol kg−1. This DICant contribution is equivalent to a 0.3 to 0.4 decrease in mean Ωarag since the pre-industrial era. Subtracting this burden from our observed values, the frequency of Ωarag < 1.7 events across sites declines by as much as 39% (Fig. 4, Table S1). Our estimate of the mean DICant burden reflects the difference between equilibration with a pre-industrial (280 ppm) atmosphere and water masses that on average last equilibrated with a 1980’s (350 ppm) atmosphere in the western Pacific, the source region for water upwelled in the CCLME. Water forming and equilibrating with today’s 400 ppm atmosphere will have a mean DICant bur-den of ~56 μmol kg−1. When this water reaches the CCLME, the frequency of Ωarag < 1.7 events at the CM site (40.34°N) in northern California will rise to 61%, an 81% increase from current exposure and 14.5-fold increase over pre-industrial estimates (Fig. 5). We further find that the progression of OA will not be uniform. Sites in northern California that currently experience only moderate exposure to Ωarag < 1.7 events, but have a high percentage of exposures near that threshold are projected to be most impacted by OA in the future. These results highlight both the scale and geography of unavoidable chemistry changes that coastal habitats will face in the coming decades.
DiscussionThe expression of OA as a persistent spatial mosaic has important ecological, evolutionary and management implications. Populations in regions of persistent low pH might be locally adapted to OA31, 32. As dispersal sources for stress-resistant genotypes, these populations would play a critical role in supporting biological resilience to increasing OA stress over broader spatial scales. Conversely, regions currently facing moderate pH exposure can serve as near-term refuges, particularly for organisms with limited adaptive capacity for coping with the pace and scope of carbonate chemistry changes. While our efforts have identified strong regional separation in OA expo-sure, further observations will be needed to define the long-term stability of the coastal OA mosaic particularly as the CCLME transitions through additional states of climate variability and change. Expansion of paired shelf and nearshore observations will also be important for further testing the strength of cross-shelf coupling in OA exposure. Finer-scale features such as upwelling centers and river plumes are important spatial attributes of east-ern boundary current systems33. At even finer-scales, inner-shelf circulation processes that affects the efficiency of cross-shelf flows34, 35, and benthic macrophytes that directly modulate carbonate chemistry36, 37 may weaken cross-shelf coupling and give rise to further spatial patterning in OA exposure at scales that lie beyond the reso-lution of our study. Resolving the potential for OA to vary predictably over such scales will be important as that knowledge can further advance local socio-economic vulnerability10 and integrated ecosystem assessments38 that have to date relied on coarse-scale oceanographic estimates to inform local impacts and decisions. Collectively, our emerging understanding of the geography of OA progression across the CCLME highlights key needs and opportunities for local adaptation planning in response to global scale changes in ocean chemistry.
Materials and MethodsIntertidal pH (total scale) was measured using Durafet®-based (Honeywell Inc.) pH sensors custom-designed for nearshore marine deployment for this project. In 2012, Durafet®-based sensors (Seafet) constructed by Dr. Todd Martz (Scripps Institute of Oceanography) were deployed at 3 additional sites. Depending on year, pH sensors were deployed at 7 to 12 sites (Table S1) during the core upwelling season (April to October). Sensors were secured to the bedrock and serviced and calibrated at 4 to 8 week intervals. Sensors were periodically emer-gent during low tides and these records were excluded from analyses. Each unit was calibrated directly against TRIS-and/or seawater-based certified reference material (CRM) from Dr. Andrew Dickson’s group (Scripps Institute of Oceanography) or indirectly against seawater CRM-calibrated spectrophotometrically-determined pH samples. This permits the accuracy of each deployment to be traceable to a CRM standard.
At 44.85°N, a mooring (LB-15) was deployed in the inner-shelf (15 m depth) offshore from the FC intertidal pH sensor. The mooring consisted of a Seafet pH sensor at 4 m depth, and an SBE-43 dissolved oxygen (DO) sensor equipped SBE-16+ conductivity and T sensor at 13 m depth. pH sensors were serviced and calibrated at 4-week using the same method described above for the intertidal pH sensors. The DO sensor was calibrated by conducting paired profiles with discrete Winkler DO samples.
Offshore samples from the 2011 National Ocean and Atmospheric Administration (NOAA) Pacific Marine Environmental Laboratory (PMEL) West Coast Ocean Acidification WCOA201139 were analyzed for pH spectro-photometrically at 25°C using purified meta-cresol purple40, 41. For each intertidal station in our 2011 deployments, we plotted the deepest (near-bottom) mid-shelf pH value from the nearest cruise station. Upwelling wind stress for 44.65°N in Fig. 1a, was calculated from NOAA buoy 46050 wind records. Ekman transport in Fig. 1b was calculated from the 27 km grid COAMPS model. West stress values from the third pixel west of the coastline were rotated to an along-coast angle and Ekman transport was calculated at each 12-hr model analysis run and averaged to 1-week intervals prior to contouring. Continental shelf width data in Fig. 1a was derived from the ETOPO1 model42.
www.nature.com/scientificreports/
6Scientific RepoRts | 7: 2526 | DOI:10.1038/s41598-017-02777-y
The solubility of carbonate biominerals such as aragonite broadly covaries with pH (Fig. S3). but pH alone provides a poorly constrained estimate of Ωarag (Fig. S3) We developed a proxy variable (Ωarag-pH) that approxi-mates Ωarag from pH by taking into account the influence of T, S, and AT. From the bottle samples collected adja-cent to intertidal sensors, we calculated Ωarag directly from either DIC and AT, or pH and AT, along with measured T, and S. Comparisons between Ωarag against Ωarag-pH that used only pH, T, and mean values for S (33.5) and AT (2200 μmol kg−1) showed very strong agreement (r2 = 0.99, Ωarag = 1.01* Ωarag-pH + 0.01) (Fig. S1). To evaluate the generality of this approach, we applied this same estimation technique to the upper ocean (0 to 400 m depth) values from the North American Carbon Program (NACP) 2007 west coast cruise dataset2 and to the Global Ocean Data Analysis Project (GLODAP) database43. In both instances, pHtotal scale (calculated from DIC and AT) in conjunction with mean AT (2200 μmol kg−1 for NACP, 2300 μmol kg−1 for GLODAP) yielded Ωarag-pH that agreed strongly with Ωarag derived from DIC and AT (Fig. S2). Further details of the uncertainties associated with the use of Ωarag-pH can be found in the supplementary materials.
We estimated anthropogenic DIC (DICanth) following a density-based approach2, 4. In the Pacific, DICanth in the upper ocean ranges from approximately 20 to 60 μmol kg−1 depending on time since last equilibration with the atmosphere4. From observed density, we estimate a mean DICanth burden of 37 (+/−3.3, S.D.) μmol kg−1 for our system. This corresponds to a DIC increase from preindustrial atmosphere of 280 ppm to ~350 ppm at equilibrium, and reflects the higher mean ventilation age of upwelled water. DICanth can differ spatially and recent analyses suggests that DICanth in Northern California portion of the CCLME average 15% (+/−5% S.D.) higher than waters in Oregon17. We applied this adjustment, differentiating between Oregon and California sta-tions. To estimate future DIC changes, we calculated the DIC increase associated with a rise in atmospheric CO2 from 350 ppm to 400 ppm. Across orthogonal combinations of T (8 to 18 °C), S (32 to 34), and AT (2100 to 2300 μmol kg−1), an increase from 350 ppm to 400 ppm results in a mean and highly constrained DIC increase of 22 (+/−1.3, S.D.) μmol kg−1. To evaluate the effects of DICanth changes on the distribution of Ωarag, we calcu-lated the change in Ωarag for the subtraction of 37 μmol kg−1 and addition of 22 μmol kg−1 of DIC. The effects of these DIC changes varied most strongly as a function of starting Ωarag. With declining Ωarag, the marginal effects of DIC changes decrease considerably as pH moves further and further away from pK2, where absolute changes in [CO3
2–] approach a minimum. Changes in Ωarag with respect to changes in DIC are well-constrained across ranges of T and S (Fig. S4). At Ωarag = 3, the removal of 37 μmol kg−1 DIC increases Ωarag by 0.367 and ranges by only +/−0.014. At Ωarag = 1, mean decline of 0.280 exhibits a range of only +/−0.009. This constrained behavior permits us to robustly estimate changes in Ωarag as a function of initial Ωarag from time-series observations.
References 1. Pauly, D. & Christense, V. Primary production required to sustain global fisheries. Nature 374, 255–257 (1995). 2. Feely, R. A., Sabine, C., Hernandez-Ayon, J. M., Ianson, D. & Hales, B. Evidence for upwelling of corrosive” acidified” water onto the
continental shelf. Science 320, 1490–1492 (2008). 3. Gruber, N. et al. Rapid progression of ocean acidification in the California Current System. Science 337, 220–223 (2012). 4. Harris, K. E., DeGrandpre, M. D. & Hales, B. Aragonite saturation state dynamics in a coastal upwelling zone. Geophys. Res. Lett. 40,
2720–2725 (2013). 5. Bednaršek, N. et al. Limacina helicina shell dissolution as an indicator of declining habitat suitability owing to ocean acidification in
the California Current Ecosystem. Proc. R. Soc. B 281, 20140123 (2014). 6. Blanchette, C. A. et al. Biogeographical patterns of rocky intertidal communities along the Pacific coast of North America. J. Biogeogr
35, 1593–1607 (2008). 7. Woodson, C. B. et al. Coastal fronts set recruitment and connectivity patterns across multiple taxa. Limnol. Oceanog 57, 582–596
(2012). 8. Gaines, S. D., White, C., Carr, M. N. & Palumbi, S. R. Designing marine reserve networks for both conservation and fisheries
management. Proc. Natl. Acad. Sci 107, 18286–18293 (2010). 9. Wang, D. et al. Intensification and spatial homogenization of coastal upwelling under climate change. Nature 518, 390–394 (2015). 10. Ekstrom, J. A. et al. Vulnerability and adaptation of US shellfisheries to ocean acidification. Nat. Clim. Change 5, 207–214 (2015). 11. Strong, A. L. et al. Ocean acidification 2.0: Managing our changing coastal ocean chemistry. Biosci 64, 581–592 (2014). 12. Takahashi, T. et al. Climatological distributions of pH, pCO2, total CO2, alkalinity, and CaCO 3 saturation in the global surface
ocean, and temporal changes at selected locations. Mar. Chem. 164, 95–125 (2014). 13. Hofmann, G. E. et al. High-frequency dynamics of ocean pH: a multi-ecosystem comparison. PLoS One 6, e28983 (2011). 14. Bopp, L. et al. Multiple stressors of ocean ecosystems in the 21st centuary: projections with CMIP5 models. Biogeosci 10, 6225–6245
(2013). 15. Cornwall, C. E. et al. Diurnal fluctuations in seawater pH influence the response of a calcifying macroalga to ocean acidification.
Proc. Royal Soc. B: Biol. Sci 280, 20132201 (2013). 16. Frieder, C. A. et al. Can variable pH and low oxygen moderate ocean acidification outcomes for mussel larvae? Global Change Biol
20, 54–764 (2014). 17. Feely, R. A. et al. “Chemical and biological impacts of ocean acidification along the west coast of North America”. Estuarine, Coast.
Shelf Sci 183, 260–270 (2016). 18. Keller, A. A. et al. Occurrence of demersal fishes in relation to near-bottom oxygen levels within the California Current large marine
ecosystem. Fish. Oceanogr 24, 162–176 (2015). 19. Gobler, C. J. et al. Hypoxia and acidification have additive and synergistic negative effects on the growth, survival, and
metamorphosis of early life stage bivalves. PloS one 9, e83648 (2014). 20. McClatchie, S. et al. Oxygen in the Southern California Bight: Multidecadeal trends and implications for demersal fisheries. Geophys.
Res. Lett. 37, L19502 (2010). 21. Bakun, A., Field, D. B., Redondo-Rodriguez, A. N. A. & Weeks, S. J. Greenhouse gas, upwelling‐favorable winds, and the future of
coastal ocean upwelling ecosystems. Glob. Change Biol 16, 1213–1228 (2010). 22. Lachkar, Z. Effects of upwelling increase on ocean acidification in the California and Canary Current Systems. Geophys. Res. Lett.
L058726 (2014). 23. Keeling, R. F., Körtzinger, A. & Gruber, N. Ocean deoxygenation in a warming world. Ann. Rev. Mar. Sci 2, 199–229 (2010). 24. Turi, G., Lachkar, Z., Gruber, N. & Münnich, M. Climatic modulation of recent trends in ocean acidification in the California
Current System. Envir. Res. Lett. 11, 014007 (2016). 25. Thomsen, J., Haynert, K., Wegner, K. M. & Melzner, F. Impact of seawater carbonate chemistry on the calcification of marine
bivalves. Biogeosciences 12, 4209–4220 (2015).

www.nature.com/scientificreports/
7Scientific RepoRts | 7: 2526 | DOI:10.1038/s41598-017-02777-y
26. Nilsson, G. E. et al. Near-future carbon dioxide levels alter fish behavior by interfering with neurotransmitter function. Nat. Clim. Change. 2, 201–204 (2012).
27. Waldbusser, G. G. et al. Saturation-state sensitivity of marine bivalve larvae to ocean acidification. Nat. Clim. Change 5, 273–280 (2015).
28. Barton, A., Hales, B., Waldbusser, G. G., Langdon, C. & Feely, R. A. The Pacific oyster, Crassostrea gigas, shows negative correlation to naturally elevated carbon dioxide levels: Implications for near-term ocean acidification effects. Limnol. Oceanogr. 57, 698–719 (2012).
29. Juranek, L. W. et al. A novel method for determination of aragonite saturation state on the continental shelf of central Oregon using multi‐parameter relationships with hydrographic data. Geophys. Res. Lett. 36, L040778 (2009).
30. Albright, R. et al. Reversal of ocean acidification enhances net coral reef calcification. Nature 531, 362–365 (2016). 31. Sanford, E. & Kelly, M. W. Local adaptation in marine invertebrates. Ann. Rev. Mar. Sci 3, 509–535 (2011). 32. Pespeni, M., Chan, F., Menge, B. A. & Palumbi, S. Signs of Adaptation to Local pH Conditions across an Environmental Mosaic in
the California Current Ecosystem. Integr. Comp. Biol. 53, 857–870 (2013). 33. Checkley, D. M. Jr & Barth, J. A. Patterns and processes in the California Current System. Prog. Oceanogr. 83, 49–64 (2009). 34. Lentz, S. J. & Fewings, M. R. The wind-and wave-driven inner-shelf circulation. Ann. Rev. Mar. Sci 4, 317–343 (2012). 35. Morgan, S. G. et al. Surfzone hydrodynamics as a key determinant of spatial variation in rocky intertidal communities. Proc. R. Soc.
B 283, 20161017 (2016). 36. Frieder, C. A., Nam, S. H., Martz, T. R. & Levin, L. A. High temporal and spatial variability of dissolved oxygen and pH in a
nearshore California kelp forest. Biogeosci 9, 3917–3930 (2012). 37. Krause-Jensen, D. et al. Long photoperiods sustain high pH in Arctic kelp forests. Sci. Adv 2, e1501938 (2016). 38. Marshall, K. M. et al. Risks of ocean acidification in the California Current food web and fisheries: ecosystem model projections.
Global Change Biol, doi:10.1111/gcb.13594 (2017). 39. Feely, R. A. et al. Carbon dioxide, hydrographic and chemical measurements onboard R/V Wecoma during the NOAA PMEL West
Coast Ocean Acidification Cruise WCOA2011 (August 12–30, 2011). Carbon Dioxide Information Analysis Center, Oak Ridge National Laboratory, US Department of Energy, Oak Ridge, Tennessee, doi:10.3334/CDIAC/OTG.COAST_WCOA2011 (2014).
40. Byrne, R. H. et al. Direct observations of basin‐wide acidification of the North Pacific Ocean. Geophys. Res. Lett. 37, doi:10.1029/2009GL040999 (2010).
41. Liu, X., Patsavas, M. C. & Byrne, R. H. Purification and characterization of meta-cresol purple for spectrophotometric seawater pH measurements. Env. Sci. Tech 45, 4862–4868 (2011).
42. Amante, C., Eakins, B. W. ETOPO1 1 Arc-Minute Global Relief Model: Procedures, Data Sources and Analysis. NOAA Technical Memorandum NESDIS NGDC-24. National Geophysical Data Center, NOAA, doi:10.7289/V5C8276M (2009).
43. Key, R. M. et al. A global ocean carbon climatology: Results from GLODAP. Global Biogeochem. Cycles 18, B002247 (2004).
AcknowledgementsThis is an outcome of the Ocean Margin Ecosystems Group for Acidification Studies (OMEGAS) consortium supported by the U.S. National Science Foundation (OCE-1041240, OCE-0927255, OCE-1061233). Additional funding was supplied by the David and Lucile Packard Foundation, Oregon Sea Grant and the NOAA Ocean Acidification Program. Data reported in this paper are accessible through the Biological and Chemical Oceanography Data Management Office (www.bco-dmo.org) and CDIAC. This is contribution 455 from the Partnership for Interdisciplinary Studies of Coastal Ocean program and contribution 4398 from the NOAA Pacific Marine Environmental Laboratory.
Author ContributionsF.C., J.A.B., C.A.B., F.C., G.F., B.G., M.A.M., B.A.M., A.R., E.S., L.W. conceived and planned the research. F.C., C.A.B., F.C., G.F., G.H., K.J.N., S.H., J.A.B., T.H., A.R. implemented the observation network. R.A.F. and R.H.B. provided additional data from ship-based observations. F.C., J.A.B., L.W., T. G., O.C., J.S., conducted the data analyses. All authors contributed to the writing of the manuscript.
Additional InformationSupplementary information accompanies this paper at doi:10.1038/s41598-017-02777-yCompeting Interests: The authors declare that they have no competing interests.Publisher's note: Springer Nature remains neutral with regard to jurisdictional claims in published maps and institutional affiliations.
Open Access This article is licensed under a Creative Commons Attribution 4.0 International License, which permits use, sharing, adaptation, distribution and reproduction in any medium or
format, as long as you give appropriate credit to the original author(s) and the source, provide a link to the Cre-ative Commons license, and indicate if changes were made. The images or other third party material in this article are included in the article’s Creative Commons license, unless indicated otherwise in a credit line to the material. If material is not included in the article’s Creative Commons license and your intended use is not per-mitted by statutory regulation or exceeds the permitted use, you will need to obtain permission directly from the copyright holder. To view a copy of this license, visit http://creativecommons.org/licenses/by/4.0/. © The Author(s) 2017