PERSI Choice 401(k) Plan - 95270-01 Investment Performance ... · 3,7 DODIX 0.43 / 0.43 01-03-1989...
2
Current performance may be lower or higher than performance data shown. Performance data quoted represents past performance and is not a guarantee or prediction of future results. For performance data current to the most recent month-end, please visit www.mypersi401k.com. Please consider the investment objectives, risks, fees and expenses carefully before investing. For this and other important information about investments offered through your Plan, you may obtain mutual fund prospectuses from your registered representative or Plan website. Read them carefully before investing. For additional fund information, please refer to the Fund Fact Sheet or Prospectus. Returns as of Month Ending 05/31/2018 Returns as of Quarter Ending 03/29/2018 Calendar Year Returns INVESTMENT OPTION Ticker Gross/Net Expense Ratio Inception Date 1 Month YTD 1 Year 3 Year 5 Year 10 Year/ Since Inception 3 Month 1 Year 3 Year 5 Year 10 Year/ Since Inception 2017 2016 2015 Balanced PERSI Total Return Fund 1 N/A 0.27 / 0.27 02-01-2001 0.60 8.69 9.21 6.88 7.96 6.00 -0.36 10.98 6.80 8.04 6.30 16.74 7.65 0.15 Calvert Balanced I 1,6,7 CBAIX 0.67 / 0.62 02-26-1999 1.63 0.78 7.61 4.95 7.49 6.13 -0.83 7.47 4.81 7.60 6.31 11.94 8.16 -2.43 Capital Preservation PERSI Short-Term Investment Portfolio N/A 0.11 / 0.11 06-21-2002 0.17 0.66 1.37 0.95 0.69 0.62 0.31 1.23 0.85 0.62 0.65 1.13 0.85 0.37 Bond U.S. Bond Market Index Fund 3 N/A 0.05 / 0.05 03-25-2009 0.71 -1.52 -0.44 1.31 1.92 3.54 -1.47 1.15 1.12 1.75 3.61 3.50 2.55 0.47 U.S. TIPS Index Fund 3 N/A 0.05 / 0.05 11-30-2009 0.42 -0.42 0.79 1.47 0.83 2.71 -0.79 0.98 1.30 0.02 2.72 3.08 4.69 -1.50 Dodge & Cox Income Fund 3,7 DODIX 0.43 / 0.43 01-03-1989 0.22 -1.12 0.58 2.34 2.76 4.76 -0.90 2.21 2.34 2.77 4.86 4.36 5.61 -0.59 Large Cap U.S Broad Market Equity Index Fund N/A 0.07 / 0.07 01-24-2011 2.81 2.53 15.01 10.70 12.85 12.84 -0.65 13.77 10.20 13.03 12.67 21.09 12.71 0.46 U.S. Large Cap Equity Index Fund N/A 0.05 / 0.05 10-16-2009 2.41 2.01 14.38 10.96 12.96 13.50 -0.77 13.98 10.76 13.29 13.41 21.82 11.94 1.36 Vanguard Growth & Income Adm 7 VGIAX 0.23 / 0.23 05-14-2001 2.80 2.54 15.41 11.03 13.20 8.76 -0.69 13.95 10.57 13.47 9.19 20.80 12.12 2.03 Mid Cap U.S. Small/Mid Cap Equity Index Fund 2 N/A 0.05 / 0.05 08-31-2011 4.79 5.13 18.36 9.58 12.03 14.28 0.09 13.06 7.88 11.67 13.81 18.07 15.89 -3.51 Small Cap T. Rowe Price Instl Small-Cap Stock 2,7 TRSSX 0.66 / 0.66 03-31-2000 5.34 7.25 19.62 11.75 12.92 12.42 1.94 13.59 9.25 12.48 12.87 15.45 19.00 N/A Specialty U.S. REIT Index Fund 4 N/A 0.10 / 0.10 12-31-2008 3.96 -2.28 2.47 4.45 6.87 12.98 -7.36 -3.63 0.56 5.83 12.58 3.78 6.57 3.85 International Equity International Equity Index Fund N/A 0.07 / 0.07 10-16-2009 -1.96 -1.14 8.34 4.63 6.40 5.86 -0.90 15.61 6.04 6.78 6.01 25.53 1.29 -0.69 PERSI Choice 401(k) Plan - 95270-01 Investment Performance as of 05/31/2018 Jun-13-2018 95270-01 - Investment Options at a Glance Page 1 of 2
Transcript of PERSI Choice 401(k) Plan - 95270-01 Investment Performance ... · 3,7 DODIX 0.43 / 0.43 01-03-1989...
Current performance may be lower or higher than performance data shown. Performance data quoted represents past performance and is not a guarantee or prediction of future results. For
performance data current to the most recent month-end, please visit www.mypersi401k.com.
Please consider the investment objectives, risks, fees and expenses carefully before investing. For this and other important information about investments offered through your Plan, you may obtain
mutual fund prospectuses from your registered representative or Plan website. Read them carefully before investing.
For additional fund information, please refer to the Fund Fact Sheet or Prospectus.
Returns as of Month Ending 05/31/2018 Returns as of Quarter Ending 03/29/2018 Calendar Year Returns
INVESTMENT OPTION TickerGross/Net
Expense RatioInception
Date1
Month YTD1
Year3
Year5
Year10 Year/ Since
Inception3
Month1
Year3
Year5
Year10 Year/ Since
Inception 2017 2016 2015
Balanced
PERSI Total Return Fund1 N/A 0.27 / 0.27 02-01-2001 0.60 8.69 9.21 6.88 7.96 6.00 -0.36 10.98 6.80 8.04 6.30 16.74 7.65 0.15
Calvert Balanced I1,6,7 CBAIX 0.67 / 0.62 02-26-1999 1.63 0.78 7.61 4.95 7.49 6.13 -0.83 7.47 4.81 7.60 6.31 11.94 8.16 -2.43
Capital Preservation
PERSI Short-Term Investment Portfolio N/A 0.11 / 0.11 06-21-2002 0.17 0.66 1.37 0.95 0.69 0.62 0.31 1.23 0.85 0.62 0.65 1.13 0.85 0.37
Bond
U.S. Bond Market Index Fund3 N/A 0.05 / 0.05 03-25-2009 0.71 -1.52 -0.44 1.31 1.92 3.54 -1.47 1.15 1.12 1.75 3.61 3.50 2.55 0.47
U.S. TIPS Index Fund3 N/A 0.05 / 0.05 11-30-2009 0.42 -0.42 0.79 1.47 0.83 2.71 -0.79 0.98 1.30 0.02 2.72 3.08 4.69 -1.50
Dodge & Cox Income Fund3,7 DODIX 0.43 / 0.43 01-03-1989 0.22 -1.12 0.58 2.34 2.76 4.76 -0.90 2.21 2.34 2.77 4.86 4.36 5.61 -0.59
Large Cap
U.S Broad Market Equity Index Fund N/A 0.07 / 0.07 01-24-2011 2.81 2.53 15.01 10.70 12.85 12.84 -0.65 13.77 10.20 13.03 12.67 21.09 12.71 0.46
U.S. Large Cap Equity Index Fund N/A 0.05 / 0.05 10-16-2009 2.41 2.01 14.38 10.96 12.96 13.50 -0.77 13.98 10.76 13.29 13.41 21.82 11.94 1.36
Vanguard Growth & Income Adm7 VGIAX 0.23 / 0.23 05-14-2001 2.80 2.54 15.41 11.03 13.20 8.76 -0.69 13.95 10.57 13.47 9.19 20.80 12.12 2.03
Mid Cap
U.S. Small/Mid Cap Equity Index Fund2 N/A 0.05 / 0.05 08-31-2011 4.79 5.13 18.36 9.58 12.03 14.28 0.09 13.06 7.88 11.67 13.81 18.07 15.89 -3.51
Small Cap
T. Rowe Price Instl Small-Cap Stock2,7 TRSSX 0.66 / 0.66 03-31-2000 5.34 7.25 19.62 11.75 12.92 12.42 1.94 13.59 9.25 12.48 12.87 15.45 19.00 N/A
Specialty
U.S. REIT Index Fund4 N/A 0.10 / 0.10 12-31-2008 3.96 -2.28 2.47 4.45 6.87 12.98 -7.36 -3.63 0.56 5.83 12.58 3.78 6.57 3.85
International Equity
International Equity Index Fund N/A 0.07 / 0.07 10-16-2009 -1.96 -1.14 8.34 4.63 6.40 5.86 -0.90 15.61 6.04 6.78 6.01 25.53 1.29 -0.69
PERSI Choice 401(k) Plan - 95270-01
Investment Performance as of 05/31/2018
Jun-13-2018 95270-01 - Investment Options at a Glance Page 1 of 2
Returns as of Month Ending 05/31/2018 Returns as of Quarter Ending 03/29/2018 Calendar Year Returns
INVESTMENT OPTION TickerGross/Net
Expense RatioInception
Date1
Month YTD1
Year3
Year5
Year10 Year/ Since
Inception3
Month1
Year3
Year5
Year10 Year/ Since
Inception 2017 2016 2015
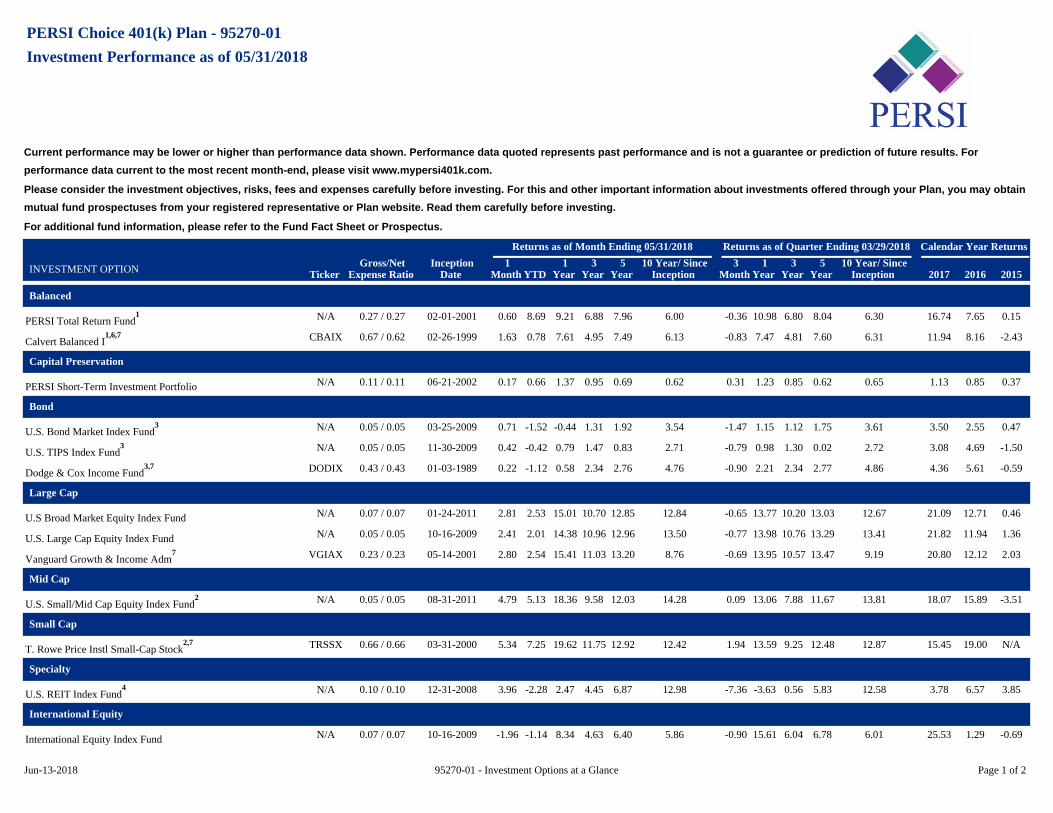
Emerging Markets Equity Index Fund N/A 0.09 / 0.09 08-15-2014 -3.48 -2.62 13.85 6.06 N/A 3.14 1.33 24.63 8.65 N/A 4.42 37.18 11.07 -15.08
Brandes International Equity R65,7 BIERX 0.92 / 0.82 02-01-2016 -4.29 1.09 6.02 3.82 6.62 1.92 2.66 12.27 5.79 7.84 2.95 15.27 8.35 N/A
These returns and fund operating expenses are expressed as percentages. 3, 5 and 10 Year/Since Inception returns shown are annualized. For 10 Year/Since Inception, if the fund was not in existence for 10 years, returns shown are since
inception. If the fund is less than one year old, returns are not annualized.
Funds may impose redemption fees and/or transfer restrictions if assets are held for less than the published holding period. For more information, see the fund's prospectus and/or disclosure documents.
Great-West Financial(R). Empower Retirement and Great-West Investments (TM) are the marketing names of Great-West Life & Annuity Insurance Company, Corporate Headquarters: Greenwood Village, CO; Great-West Life and Annuity
Insurance Company of New York, Home Office: New York, NY, and their subsidiaries and affiliates, including registered investment advisers Advised Assests Group, LLC and Great-West Capital Management, LLC
Expense ratios provided are the Funds' total annual operating expense ratios, gross of any fee waivers or expense reimbursement.
Plan logos are owned by the plan. All other logos, registered trademarks and service marks are owned by Great-West Life & Annuity Insurance Company.1Asset allocation and balanced investment options and models are subject to risks of the underlying investments, which can be a mix of stocks/stock funds and bonds/bond funds. For more information, see the prospectus and/or disclosure
documents.2Equity securities of small and mid-size companies may be more volatile than securities of larger, more established companies.
3Compared to more highly rated securities, high-yield bond investment options are subject to a greater risk, including the risk of default. A bond fund's yield, share price and total return change daily and are based on changes in interest rates,
market conditions, economic and political news and quality and maturity of its investments. In general, bond prices fall when interest rates rise and vice versa.4Specialty funds invest in a limited number of companies and are generally non-diversified. As a result, changes in market value of a singular issuer could cause greater volatility than with a more diversified fund.
5The Fund has a Contractual Expense Ratio Waiver in the amount of .1% which expires on 31-JAN-2019.
6The Fund has a Contractual Expense Ratio Waiver in the amount of .05% which expires on 31-JAN-2019.
7Although data is gathered from reliable sources, including but not limited to Morningstar, Inc., the completeness or accuracy of the data shown cannot be guaranteed. Where data obtained from Morningstar, (C)2017 Morningstar, Inc. All rights
reserved. The Data: (1) is the proprietary to Moringstar and/or its content providers; (2) may not be copied or distributed and (3) is not warranted to be accurate, complete or timely. Neither Morningstar nor its content providers are
responsible for any damages or losses arising from any use of this information. Past performance is no guarantee of future results.
PERSI Choice 401(k) Plan - 95270-01 (Continued)
Jun-13-2018 95270-01 - Investment Options at a Glance Page 2 of 2


![Untitled-2 [maxsealinc.com] · 2017. 11. 3. · 0.28 0.28 0.28 0.35 0.35 0.35 0.43 0.43 0.43 CONSTRUCTION FEATURES Integral leak path Stainless steel blow-out proof plate Stem Guide](https://static.fdocuments.net/doc/165x107/600db65fc1c46c5c17347775/untitled-2-2017-11-3-028-028-028-035-035-035-043-043-043-construction.jpg)


![1971-2018 1971-2006 Replace “0.57 [0.43 to 0.72]” with “0 ...](https://static.fdocuments.net/doc/165x107/6236c1aba5d92104cd5cc615/1971-2018-1971-2006-replace-057-043-to-072-with-0-.jpg)