Perpendicular-to-grain creep of Finnish softwoods in high ...
95
VTT PUBLICATIONS 301 Perpendicular-to-grain creep of Finnish softwoods in high temperature drying conditions Experiments and modelling in temperature range 95–125 °C Antti Hanhijärvi VTT Building Technology TECHNICAL RESEARCH CENTRE OF FINLAND ESPOO 1997
Transcript of Perpendicular-to-grain creep of Finnish softwoods in high ...

VTT PUBLICATIONS 301
Perpendicular-to-grain creepof Finnish softwoods in high
temperature drying conditionsExperiments and modelling
in temperature range 95–125 °C
Antti Hanhijärvi
VTT Building Technology
TECHNICAL RESEARCH CENTRE OF FINLANDESPOO 1997

ISBN 951–38–5041–2 (soft back ed.)ISSN 1235–0621 (soft back ed.)
ISBN 951–38–5042–0 (URL: http://www.inf.vtt.fi/pdf/)ISSN 1455–0849 (URL: http://www.inf.vtt.fi/pdf/)
Copyright © Valtion teknillinen tutkimuskeskus (VTT) 1997
JULKAISIJA – UTGIVARE – PUBLISHER
Valtion teknillinen tutkimuskeskus (VTT), Vuorimiehentie 5, PL 2000, 02044 VTTpuh. vaihde (09) 4561, faksi (09) 456 4374
Statens tekniska forskningscentral (VTT), Bergsmansvägen 5, PB 2000, 02044 VTTtel. växel (09) 4561, fax (09) 456 4374
Technical Research Centre of Finland (VTT), Vuorimiehentie 5, P.O.Box 2000, FIN–02044 VTT, Finlandphone internat. + 358 9 4561, fax + 358 9 456 4374
VTT Rakennustekniikka, Rakennusmateriaalit ja -tuotteet sekä puutekniikka,Puumiehenkuja 2 A, PL 1806, 02044 VTTpuh. vaihde (09) 4561, faksi (09) 456 7027
VTT Byggnadsteknik, Byggnadsmaterial och -produkter, träteknik,Träkarlsgränden 2 A, PB 1806, 02044 VTTtel. växel (09) 4561, fax (09) 456 7027
VTT Building Technology, Building Materials and Products, Wood Technology,Puumiehenkuja 2 A, P.O.Box 1806, FIN–02044 VTT, Finlandphone internat. + 358 9 4561, fax + 358 9 456 7027
Technical editing Leena Ukskoski
VTT OFFSETPAINO, ESPOO 1997

3
Hanhijärvi, Antti. Perpendicular-to-grain creep of Finnish softwoods in high temperaturedrying conditions. Experiments and modelling in temperature range 95 – 125 °C. Espoo1997, Technical Research Centre of Finland, VTT Publications 301. 94 p. + app. 176 p.
UDC 674.032:674.04:539.376Keywords softwoods, spruce wood, pine wood, creep properties, high temperature
tests, drying tests
ABSTRACT
This publication reports the results obtained in a project to clarify theperpendicular-to-grain mechanical properties of spruce (Picea abies) andpine (Pinus sylvestris) in high temperature drying conditions. The workconsisted of a literature review, an extensive experimental programme anddevelopment of a new constitutive model for the description of the creepbehaviour in the high temperature conditions. All these tasks aredocumented in this publication.
The experimental work consisted of tension creep experiments atconstant saturated (green) condition at constant temperatures 95, 110 and125°C and in drying conditions of maximum reached temperature 95, 110 or125°C. From these experiments a large amount of data was obtained aboutshrinkage, hygrothermal deformation, modulus of elasticity, viscoelasticcreep and mechano-sorptive creep. A limited strength test series was alsocarried out on spruce at 95 and 125°C.
For the use of the obtained knowledge in computational simulation ofdrying stresses a constitutive model of the creep behaviour was developedfor the high temperature conditions. The new model is based on linearshrinkage and on using the time–temperature–moisture-contentsuperposition principle for modelling elastic and viscoelastic strain. Formechano-sorptive creep a new type of model is introduced, where thedeveloping strain is partly recoverable and partly not.

4
PREFACE
This publication is a report of results obtained in the project ‘Hightemperature creep of wood’ conducted at VTT Building Technology in1994–1995. The project was financed by the Technology DevelopmentCentre (TEKES) and VTT, which is gratefully acknowledged. The projectwas Finnish contribution to the COST 508 Wood Mechanics action.
The project was lead by a directing board, whose members wereManaging Director Aarni Metsä (Finnish Wood Research Ltd.), Prof. MauriMäättänen (Helsinki University of Technology), Research Manager Olli-Pekka Nordlund (Technology Development Centre), Prof. Tero Paajanen(Helsinki University of Technology), Prof. Alpo Ranta-Maunus (VTT) andProf. Pertti Viitaniemi (VTT). The members are thanked for fruitful co-operation. In the actual research work, Prof. Ranta-Maunus acted as theresponsible director of the project and Dr. Antti Hanhijärvi as the projectmanager who conducted the main research work.
The author would also like to thank Mr. Erkki Järvinen for theindispensable help in building the regulation system for the drying conditiontest chamber. Mr. Rauno Vinttala and Mr. Mats Rundt are thanked for thecareful and painstaking work in building of the drying condition test set-upand the preparation of specimens as well as the performing the lengthyexperiments. Mr. Pentti Kankaanpää is thanked for careful execution of thesaturated condition experiments.
Thanks are also due to Casco Nobel company for providing thepolyurethane glue needed for the specimen preparation.
Antti Hanhijärvi

5
CONTENTS
ABSTRACT .................................................................................................. 3
PREFACE...................................................................................................... 4
LIST OF SYMBOLS..................................................................................... 7
1 INTRODUCTION..................................................................................... 9
2 REVIEW OF SOME PREVIOUS EXPERIMENTS ONPERPENDICULAR-TO-GRAIN PROPERTIES ....................................... 11
2.1 Experiments at VTT ........................................................................ 112.2 Other experiments in the literature.................................................. 12
2.2.1 Modulus of elasticity ........................................................... 122.2.2 Short term strength .............................................................. 132.2.3 Viscoelastic creep................................................................ 132.2.4 Mechano-sorptive creep ...................................................... 13
3 EXPERIMENTS...................................................................................... 153.1 Acquiring and preparation of specimens......................................... 153.2 Experimental programme................................................................ 193.3 Creep experiments in constant climate............................................ 19
3.3.1 Test apparatus...................................................................... 193.3.2 Loading................................................................................ 21
3.4 Creep experiments in drying conditions.......................................... 213.4.1 Test apparatus...................................................................... 213.4.2 Loading system and mounting of specimens....................... 243.4.3 Drying schedule and loading scheme .................................. 25
3.5 Achievement of measurements and processing of data................... 263.5.1 Experiments in constant conditions..................................... 263.5.2 Experiments in drying conditions........................................ 27
3.6 Results ............................................................................................. 303.6.1 Hygrothermal deformation .................................................. 303.6.2 Shrinkage............................................................................. 313.6.3 Modulus of elasticity ........................................................... 323.6.4 Viscoelastic creep................................................................ 373.6.5 Mechano-sorptive creep ...................................................... 553.6.6 Strength................................................................................ 78
4 MODELLING ......................................................................................... 814.1 Shrinkage and hygrothermal strain.................................................. 824.2 Elastic strain and viscoelastic creep ................................................ 834.3 Mechano-sorptive creep .................................................................. 844.4 Features and performance ............................................................... 89

6
5 CONCLUSIONS ..................................................................................... 91
REFERENCES ............................................................................................ 92
APPENDICES
A. List of tests, specimens and their propertiesB. Results of tests in the saturated condition set-upC. Results of tests in the drying condition chamber
Appendices of this publication are not included in the PDFversion.Please order the printed version to get the complete publication(http://www.inf.vtt.fi/pdf/publications/1998/)

7
LIST OF SYMBOLS
Latin
a shift factorair, a
ir,i parametersbir, b
ir,i parametersJ complianceJ0, Ji parametersJve,0 , J
ve,i limit compliances of Kelvin unitsJir, J
ir,i parametersJM master curve complianceJms, J
ms,i parameterskT, ku parametersm massm0 mass in the absolute dry conditionT temperatureTref reference temperaturet timeu moisture content (dry weight basis)uFS value of moisture content at the fiber saturation pointuref reference moisture contentû effective moisture content û = min (u, uFS)
Greek
α hygroexpansion coefficientβ hygrothermal coefficientβFS value of β at fiber saturation pointε strainεht hygrothermal strainεir, εir,i internal variablesεmax, εmax,i internal variablesεmin, εmin,i internal variablesεms mechano-sorptive strainεms,i strain of a mechano-sorptive creep model unitεs shrinkage strainεve viscoelastic strainεve,0, εve,i strains of Kelvin unitsσ stressτ time variableτi parametersτve,i retardation times of Kelvin unitsτms, τms,i parametersξ material time

8
Abbreviations
FSP fiber saturation pointHT high temperatureHTD high temperature dryingMOE modulus of elasticityms mechano-sorptiveve viscoelastic

9
1 INTRODUCTION
During the last c. five years a good competence in the computationalsimulation of kiln drying of wood has been obtained at VTT BuildingTechnology (Ranta-Maunus et al. 1995, Hukka 1996). Two computerprograms for the simulation of the moisture content and stress developmentin a drying piece of sawn timber have been developed: LAATUKAMARI,which simulates the drying process one-dimensionally for optimisationpurposes in industrial kilns, and PEO, which can simulate the cross-sectionof a drying piece of timber two-dimensionally for more research relatedpurposes. The two programs have been developed for temperatures usedconventionally in Finnish saw mills, up to about 80°C. The work introducedin this publication is a part of an attempt to widen the capability of thesimulations to higher temperatures, up to 125°C. Fig. 1 presents the overallplan for the development of high temperature drying technology at VTTBuilding Technology and the connection of this study to the other projects.
COST 508Wood Mechanics
IDS, IUFRO, Austria, France,Sweden
Internationalcooperation
Creep andstrengthmodel
T = 90–125°C
Fracturecriterion
Model ofheat andmoisturetransfer
Propertiesof end
products
Strategicfundamentalresearch
Simulation model ofhigh temperature drying
Measure-ment ofdryingquality
Appliedresearch
Productdevelopment
Type of results
Drying kilnsControl systems
Dryingschedules
Modificationschedules
Kiln dryingtechniques
Operationtechniques
New woodproducts
DEVELOPMENT OF HIGH TEMPERATURE DRYING TECHNOLOGY
Fig. 1. The overall plan for development of high-temperature dryingtechnology at VTT.
The plan for the present work consisted of two main efforts:1. An experimental part, which included a literature review of earlier
experiment results and an extensive programme of novelexperiments, in which the mechanical properties of the two main

10
Finnish softwoods would be investigated in directionsperpendicular to the grain.
2. Analysis of the obtained experimental data and conveyance of itinto a suitable mathematical model for application in the dryingsimulation programs.
The documentation of the work and results of these tasks are presented inthis publication in detail and in the order: 1) literature review 2) experi-mental work 3) analysis and 4) model.

11
2 REVIEW OF SOME PREVIOUS EXPERIMENTSON PERPENDICULAR-TO-GRAIN PROPERTIES
The mechanical properties of wood are not very well known at temperaturesrelevant in the high-temperature drying (HTD) process, viz. around 90–120°C. This applies especially to the time dependent phenomena, creep andlong-term strength (reduction of strength in prolonged loading); althoughthere are some publications concerning the instantaneous elastic andstrength properties as well as dynamic properties at these temperatures,hardly anything is available in the published literature touching the staticlong-term behaviour. And although the HTD process itself has caughtattention among researches, this has not lead to detailed studies of the basicmaterial properties of wood in these conditions. The lack of research on thelong-term material properties in HTD conditions can also be interpreted asan indication that experiments on these properties are still going on in theconventional drying temperature range, say 50–80°C, in which a certainincrease in research activity can be seen to have taken place during recentyears. So, the review presented here will contain sources mainly on shortterm properties in the conventional and HT conditions and long-termproperties in conventional drying conditions. The review is not exhaustive,but rather contains a list of sources that were found most useful during thisproject.
2.1 EXPERIMENTS AT VTT
The short term mechanical properties in the tangential direction of the threemost important Finnish wood species, Pinus sylvestris, Picea abies andBetula verrucosa, were investigated at VTT already in the 60’s (Siimes1967) in connection with the spread of kiln drying in Finland. The studymade under Siimes’ direction contains a comprehensive experimentalclarification of the tangential modulus of elasticity (MOE) and strength bothin tension and compression for a temperature range relevant in conventionalkiln drying. Experiments were made in compression and tension, attemperatures 20, 40, 60 and 80°C, moisture contents 4, 8, 12, 16 and 20%plus green (saturation) condition. Moreover, the specimens represented awide density range and results have been given for three density categories.Altogether, there are thus 144 cases for one species and one property(strength or MOE), which tells about the large extent of the work.
Due to the exhaustive quality of Siimes’ study it provides a good basisfor further studies on the mechanical properties in the perpendicular-to-grain directions. The results of Siimes are used in this work as a mainsource of reference and the relationships found by him between themechanical properties and different conditions can be utilised as givingmore confidence to results that exceed his range of conditions and that aremade with fewer specimens.
The research of the perpendicular-to-grain material properties inrelation to drying was started again at VTT in 1980’s under the managementof Prof. Alpo Ranta-Maunus. The newer research has concentrated on long-

12
term properties, foremost on creep. Before the present project, the work hasfocused on exploring the creep properties at conventional dryingtemperatures. Results of the newer research have been documented inreferences Kangas and Ranta-Maunus (1989), Kangas (1990), Ranta-Maunus (1992) and summarised by Ranta-Maunus (1993). A great deal ofexperience obtained in these preceding projects has been applied in thepresent project.
Kangas and Ranta-Maunus (1989) dealt with creep in constantmoisture content and changing moisture content as well as undertook someeffort in regard to long-term strength. The foremost outcome of the work isthe grasp of the relative importance of the moisture change induced creep,the mechano-sorptive effect in the perpendicular-to-grain directions in theconditions of drying. In the work of Kangas (1990) the creep of dryingwood is studied at temperatures 40, 60 and 80°C under tensile load. Thework masters in developing new experimental techniques and showsespecially the need for the reliable evaluation of the zero-load shrinkageduring a creep experiment. The work confirms the importance of themechano-sorptive effect and gives experimental data for its quantification inconventional drying conditions. As mentioned, both the above studies aresummarised in Ranta-Maunus (1993).
2.2 OTHER EXPERIMENTS IN THE LITERATURE
2.2.1 Modulus of elasticity
Of the different basic deformation properties the modulus of elasticity(MOE) along with shrinkage are the most studied ones. Even so, not manyreports have been published on the MOE of wood in directionsperpendicular to grain in the high temperature range, above 90°C.
The review of Gerhards (1982) on “Effect of moisture content andtemperature on the mechanical properties of wood: an analysis of immediateeffects” is a good overview of literature published on the moisture contentand temperature influence on both strength and MOE until the late 1970’s.It concerns all material directions of wood; and the test results by differentauthors on different species are gathered comprehensively and compared inregard to the effect of moisture content and temperature (the actual valuesof the results are not compared). Of the works on perpendicular-to-grainMOE that Gerhards mentions, only two contain results that are above 85°C(Byvshykh 1959, Okuyama et al. 1977). For temperature range 20–80°Cthere are more publications.
Okuyama et al. (1977) measured bending MOE for two SoutheastAsian hardwoods. The results are interesting in that the measurements weredone in the tangential and radial directions and in various angles betweenthem. Also, the temperature range is wide: 20–97°C.
Of other studies, the works of Salmén (1984) and Iida (1986) are ofinterest. Salmén measured the dynamic properties of spruce (Picea abies) inwet condition over temperature range 20–140°C. The dynamic

13
measurements are not directly comparable to the static results, but thestorage modulus provides a good reference value for the static MOE – thebetter the lower the frequency used in tests is. The lowest frequency inSalmén’s tests is 0.05 Hz corresponding half period length of 10 seconds,which is well comparable to the loading times in static tests.
Iida (1986) measured the perpendicular-to-grain MOE in bending inwater saturated condition for several species. The temperature range was10–95°C.
2.2.2 Short term strength
Gerhards’ (1982) review mentions three studies on perpendicular-to-grainstrength that reach above 85°C: Byvshykh (1959), Goulet (1960) andOkuyama et al. (1977). Studies below 80°C are again more numerous. Thework of Okuyama et al. is again interesting because strength has beenmeasured in different angles to the material directions.
The work of Koran (1979) on perpendicular-to-grain tension strengthof spruce is interesting as the temperature range is very wide, reaching up to250°C. Tests were made with saturated wood, saturated either in water orglycerine. Both tangential and radial directions are treated.
2.2.3 Viscoelastic creep
Not many references were found on the perpendicular-to-grain viscoelasticproperties of wood. Of the ones found the only static creep results thatextend to the high temperature range are the test results of Sawabe (1974)who describes an experiment on the creep of dry hinoki (Chamaecyparisobtusa Sieb.) in the temperature range 20–180°C. Also some experimentson dynamic viscoelastic properties touch the high temperature range:Salmén and Fellers (1982) and Salmén (1984) report dynamicmeasurements between 20 and 140°C.
Results of viscoelastic creep in the conventional drying temperaturerange are given in the works of Svensson (1995 and 1996) at twotemperatures (60 and 80°C) and two moisture contents. The work of Joyet(1992) is also interesting as it contains measurements at many moisturecontents, even if testing temperatures are near room temperature. Bothradial and tangential directions are treated.
2.2.4 Mechano-sorptive creep
No references could be found on the mechano-sorptive behaviour in thehigh temperature conditions. However, in the conventional dryingconditions results of quite a few recent studies are available.
Hisada (1986) performed on extensive study on the deformationbehaviour of makanba (Betula maximowicziana Reg.) and hinoki(Chamaecyparis obtusa Sieb.) specimens (tangential) during drying undervariable loads, including zero load. Drying conditions included constanttemperatures 20, 30, 50, 70 and 80°C. The experiments included different

14
loading schemes, in which the load was applied in the beginning of dryingand removed in the late part of it, or was applied only at different stages ofdrying. Measurements were also made on volumetric shrinkage, whichallows inference to be made on the interaction between the materialdirections in creep (Poisson effect type behaviour in creep).
Svensson’s (1995) results contain both drying strain measurementresults and restrained shrinkage force results, giving considerably betterpicture of the deformation behaviour than creep results alone. Temperaturesinclude 60 and 80°C.
The work of Joyet (1992) is directed to investigating creep in serviceconditions (~ room temperature) but provides very useful fundamentalinformation about the mechano-sorptive creep, especially concerning theeffect of many repeated moisture cycles.

15
3 EXPERIMENTS
In order to quantify the mechanical properties of wood for the simulation ofthe stress development during a high temperature drying process, a series ofexperiments was arranged in conditions that resemble the real dryingsituation as well as possible. Tests were made in tension both in constantwet condition and in drying condition, and for specimens of spruce (Piceaabies) and pine (Pinus sylvestris) wood.
3.1 ACQUIRING AND PREPARATION OF SPECIMENS
All the specimens were manufactured from three tree trunks, two spruceones and one pine trunk. The three trees had been grown at a location inNurmijärvi, near Helsinki, and were felled in autumn (October). Afterfelling the trunks, they were cut into logs, whose length was about 0.5–0.7m(Fig. 2). The two spruce trunks were labelled by the letters K and S and thepine trunk by the letter M. The logs cut out of them were numberedbeginning from the root. Altogether eighteen spruce logs – labelled K1–K12and S0–S5 – and nine pine logs – labelled M0–M8 – were acquired as rawmaterial for test specimens. The transportation of the logs to the laboratoryfacilities was done inside a plastic cover to avoid any drying. They werestored to wait for preparation of test specimens inside large closedcontainers, in which there was some water on the bottom to ensure moistconditions to prevent any drying.
16
Fig. 2. Cutting of 0.5–0.7 m long logs to be used as raw material for testspecimens. Two spruce trunks (K and S) and one pine trunk (M) were felledand cut into altogether 27 logs. In preparing the specimens, four narrowslices were cut out of the logs. Slices labelled A and B were cut fromopposite sides of the log to be further produced into tangential testspecimens whereas slices labelled C and D were cut across the middle ofthe log to be produced into radial specimens.
Specimens were prepared from the logs by cutting them first to fournarrow parallel-to-grain slices (Fig. 2). Two of them, which were cuttangentially to the growth rings at two opposite sides of the log, werefurther produced into tangential specimens. The other two, which were cutacross the middle of the log, were further produced into radial specimens.The tangential slices were marked by the letters A and B and the radial onesby the letters C and D.
These slices were glued along their long edges to auxiliary slices ofequal thickness but whose grain direction was at 90° angle (Fig. 3). Thiswas done in order to enable force transmission to the test specimens bylongitudinal parts in the ends of the ready-made specimens. The slicescontaining the actual test material were cut to be defect-free, i.e. knots andother defects were avoided as well as possible. The auxiliary slices wereobtained from the same logs from the left-over parts. The gluing was doneby a finger joint type assembly using one component polyurethane adhesive(which was supplied by Casco-Nobel company), which is hardened bycontact with moisture. The needed moisture for the adhesive to harden wasprovided by the natural water contained in the wood as it was in an undriedstate. During the preparation process the specimens were not allowed to dry

17
at any stage (they were kept inside plastic cover and in a refrigerator), butremained wet until they were taken to the test chamber. The only time theywere dried just slightly was before the gluing, when the finger jointedsurfaces were dried by a hot-air-blower. This was done cautiously so thatonly the very surface was affected to allow the adhesive to attach. Thus thedrying that the specimens suffered during the creep experiments was thefirst one. The method of preparing perpendicular-to-grain tension specimenfor tension in this manner has originally been developed by Kangas (1990)in an earlier study of the transverse creep of at conventional dryingtemperatures.
The preliminary plates obtained by the gluing were cut into four creepspecimens (Fig. 3). Each of them was denoted by a four character label, inwhich the first two characters signify the log, from which it is taken, and thethird character the slice and the forth character is for numbering of thespecimens. In some cases, viz. logs from the trunk S, even more than fourcreep specimens were obtained from the preliminary plates.
Fig. 3. Preparation of the test specimens. Each preliminary slice was gluedalong the two long edges unto two auxiliary slices (L) by a finger joint typeassembly using one component polyurethane adhesive. The thus obtainedplate was sawn into four creep test specimens, which were denoted by afour character label. The first two characters signify the log, where it istaken from, the third character the preliminary slice label and the fourcharacter is for the numbering of the individual specimens. Also, anadditional specimen to be used as a weighing specimen was sawn beside thecreep specimens. It was denoted simply by a three character label, whichwas the same as the three first characters of the creep specimens. In somecases even more than four creep specimens were sawn from the preliminaryplates.

18
Also, an additional specimen to be used as a moisture contentmonitoring specimen (by continuous measurement of its weight changes)was sawn beside the creep specimens. It was denoted simply by a threecharacter label, which was the same as the three first characters of the creepspecimens. Its ends were sealed by moisture penetration blocking substanceto make its moisture transfer properties to resemble those of the creepspecimens.
The dimensions of the final specimens were (Fig. 3): cross-section20mm × 30mm, where the shorter dimension is along the R- (tangentialspecimens) or T-direction (radial specimens) and the longer one along thelongitudinal direction; measurement length (i.e. the length of the T- or R-direction middle part) 59mm. Displacement transducers were attached ontwo sides of the specimens onto the longitudinal end-piece, Fig 4.
Fig. 4. Displacementtransducers wereattached on twosides of thespecimen, becauseuneven shrinkagecauses the speci-men to warp duringthe test.

19
3.2 EXPERIMENTAL PROGRAMME
Creep experiments at conventional drying temperatures have shown that themechano-sorptive creep – creep induced by simultaneous mechanicalloading and moisture content changes – has a strong effect on the totalamount of perpendicular-to-grain deformation during drying (Kangas andRanta-Maunus 1989, Ranta-Maunus 1993, Svensson 1996). Thus mainemphasis in this work was laid on the effect of moisture content changesand different temperature levels.
The experimental programme consisted of two main creep experimentseries. 1) Creep experiments of wet (green condition) wood in watersaturated condition in a hot water/steam bath inside a pressurised cylinder attemperatures 95°C, 110°C and 125°C. And 2) creep experiments of dryingwood in a test chamber, where the humidity and temperature werecontrolled to simulate real drying conditions. Although the main purpose ofthese experiments was to measure the amount of creep deformation duringdifferent conditions, a great deal of additional information was alsogathered concerning shrinkage, hygrothermal deformation, elastic propertiesand strength.
3.3 CREEP EXPERIMENTS IN CONSTANT CLIMATE
Almost all constant climate creep experiments were made for specimens ingreen condition, i.e. the specimens were not allowed to dry below fibersaturation at any state before or during the experiment. The decision to usethe saturated condition was made primarily because viscoelastic creep is themost substantial for wet wood and because saturated conditions are easy tomaintain by a water/steam bath.
There was also a small amount of constant climate creep tests forspecimens, whose moisture content was taken below fiber saturation beforeloading. These experiments were made using the test chamber and set-upbuilt for tests in drying conditions, which is to be introduced later.
3.3.1 Test apparatus
The creep experiments for saturated wood were made using a materialtesting machine to produce the desired loading, and a water/steamcirculation system combined with a pressurised test cylinder to produce thedesired temperature and saturation conditions. During the experiment thetested specimen was in a hot water/steam bath inside the test cylinder. Thecapacity for pressure development in the system permits testing attemperatures above 100°C. The apparatus is originally developed byViitaniemi and Pennanen (1993) and is illustrated schematically in Fig. 5.
In this apparatus, water is heated in the pressure vessel, whosetemperature is regulated by a control unit, that uses a temperature sensorinside the vessel. Steam/hot water is circulated between the pressure vesseland the test cylinder by an electric pump. Due to heat loss in the circulation,the temperature in the pressure vessel must be kept a few degrees higher

20
than the required temperature in the test cylinder. The temperature inside thetest cylinder can be checked by a manually operated thermometer, whosesensor is inside the cylinder. The cylinder can be put temporarily out ofcirculation by directing the flow through a short-cut circuit in order to put inthe specimen. After being mounted in the cylinder, the specimen is heatedby the circulating steam/water.
Fig. 5. Schematic illustration of the experimental set-up for creep tests inthe saturated condition. Steam/water is circulated between a pressure vesseland a pressurised test cylinder, in which the specimen is kept during thetest. Water/steam is heated in the pressure vessel, in which the temperatureis controlled by a control unit. Due to heat loss in the circulation, thetemperature in the pressure vessel must be kept a few degrees higher thanthe desired temperature in the test cylinder, which can be checked by amanually operated thermometer, whose sensor is inside the cylinder. Thecylinder can be put temporarily out of circuit by directing the flow througha short-cut circuit in order to enable mounting of a new specimen.
The load is measured using a load cell that is mounted as a part of theforce transmitting mechanism. The deformation is measured by adisplacement transducer, which is attached to the main body of the materialtesting machine and whose measurement tip to the piston.
The fact that the measurement of displacements was not done directlyfrom the specimen but outside the pressure cylinder from the piston causeserror to the displacement measurements. The error is induced by thecompliance of the force transmitting system and the yielding of the doweljoint used in the attachment of the specimen. The error induced by thecompliance of the force transmission is by nature instantaneous but partlyirrecoverable, whereas the error caused by the yielding of the joint is alsotime-dependent (the joint may creep). These errors were compensated by a

21
time-dependent correction, which was determined by performing some testsin conditions similar to the actual tests for a few specimens that wereotherwise similar to the actual test specimens but which were whollylongitudinal.
3.3.2 Loading
The test set-up allows testing of only one specimen at a time. The testedspecimen was first allowed to heat up in the hot bath for at least 20 min.After that, in order to remove any free motion, the test was started by raisingthe load slowly to a small value, which corresponds to 0.015 MPa stress.Then, the actual loading to the desired full load was done. In many cases,the full load was first kept on for c. 10 min but then lowered down to avalue of 1/10 of the full load to be kept there for c. 10 min and then raisedagain to the full load. But in about as many tests, this early recovery periodwas omitted. The length of the actual long loading period ranged from fewhours to c. 24 hours. In many cases, there was also a final recovery periodwith 1/10 load lasting for a few hours. All load raises and drops (except thestarting slow removal of the free motion) were done in c. 10 s.
3.4 CREEP EXPERIMENTS IN DRYING CONDITIONS
The creep experiment series in drying conditions was considered as themost important part in the experimental programme of this project, becauseof the significance of the mechano-sorptive effect. It was also given themost effort. For the purpose of performing creep experiments for dryingwood in conditions that resemble the conditions inside a drying kiln, alaboratory scale drying test chamber was built. In fact the constructedapparatus allows laboratory scale simulation of kiln drying conditions forsmall creep specimens under tensile load.
3.4.1 Test apparatus
The base of the apparatus is an aluminium frame box, the test chamber(inside dimensions roughly: height 0.5m, width 1.5m, depth 1m), which isinsulated by rock wool. Photographs of the chamber are provided in Figs. 6and 7. The front wall of the chamber is removable and it serves as theaccess panel for the mounting of specimens, etc. The chamber is equippedwith a temperature and humidity regulating system. The function of thesystem is illustrated in the schematic diagram given in Fig 8 and theplacement of the different components in Fig. 9. The regulated variablesinside the chamber are the dry bulb temperature (i.e. the air temperature)and the wet bulb temperature (which is equivalent to regulating thehumidity). The basic idea of the temperature and humidity control is thesame as in the experiments of Kangas (1990), but numerous modificationshave been incorporated.

22
Fig. 6. Test chamber for conducting creep experiments in dryingconditions.
Fig. 7. A detail of the inside of the test chamber.

23
The temperature inside the chamber is regulated by switching on or offan electric heater when necessary; the control is implemented by anelectronic temperature controller, which obtains the measurement signalfrom a temperature sensor inside the chamber. The regulation of thehumidity (i.e. the wet bulb temperature) is basically achieved by heating orcooling water in an open basin inside the chamber. The temperature of thewater controls the amount of evaporation on the water surface, which inturn controls the humidity of the air. The water is heated, when necessary,by an electric heater inside the basin and cooled, when necessary, by lettingcold water in from the water supply. The regulation is again done using anelectronic temperature controller, which obtains the measurement signalfrom a wet bulb temperature sensor. The water level in the basin iscontrolled by level controllers, which either drain water out through thebottom of the basin or let pre-heated water in the basin.
Fig. 8. Schematic view of the function of the experimental set-up for creeptests in drying conditions.
24
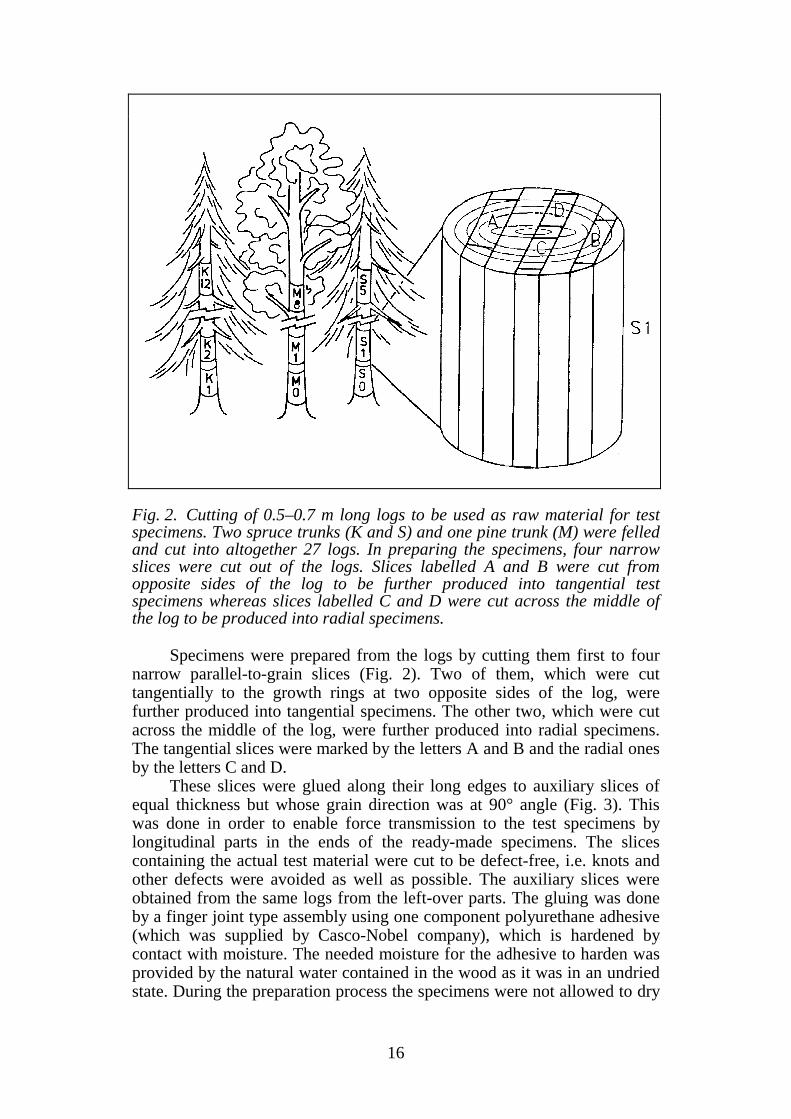
Fig. 9. Schematic view of the test chamber seen from the top and placing ofthe specimens and temperature sensors. The fan is of centrifugal type,which is used for example in convection ovens. The radiation shield and theadditional partitioning plate near the left side of the chamber extend inheight from the floor of the chamber up to its ceiling and they are used todirect the air flow in order to enable the centrifugal fan idea to work better.The arrows show air flow and the figures show the measured air velocities(m/s) inside the test chamber.
3.4.2 Loading system and mounting of specimens
The loading of tension specimens is implemented by weights and lever armslocated outside the chamber. The force is transmitted by pull rods that gothrough small holes in the ceiling of the chamber. The chamber can at atime take four tension specimens for creep measurement and four zero-load‘dummy’ specimens for measurement of free shrinkage. In addition, it canemploy two balance specimens for continuous weighing for the purpose ofmoisture content monitoring. One test series thus contains four creep-specimen–dummy pairs and two moisture content specimens.
The drying condition tests were arranged so that all specimens used inany one test were taken from a single log, from the two slices that were ofthe same material direction. The specimens to each loaded position and thedummy position next to it were always selected to be adjacently cut ones.The sustaining to this arrangement of adjacent creep and zero-loadspecimen pairs was chosen, because it was judged to give the best reliabilityin measurement of the difference between the loaded and zero-loadbehaviour.

25
3.4.3 Drying schedule and loading scheme
The regulation of the conditions (wet and dry bulb temperature) variedbetween tests, but followed a certain basic scheme. In most experiments thedrying schedule was according to the pattern described in the following andshown examplewise in Fig. 10.
Fig. 10. Example of the evolution of a creep test in drying conditions. Thedrying schedule consists of a heating period (0–2h), an initial drying period(2–30h), during which the specimens are brought to a moisture contentlevel close to FSP, loading at c. 28h, the actual drying period below FSP(30–64h) and final cooling (64–72h). Note the deformation behaviour of thespecimens during the heating and few hours after, which shows thehygrothermal phenomenon. ‘Dummy’ means a zero-load specimen tocontrol free shrinkage.
Each test started with a heating period of 2 hours, during which thetemperature was raised from room temperature to 95°C. The schedulecontinued then with an initial drying period of c. 28 h, during which thedrying power (difference of the dry and wet temperature) was first high butwas diminished gradually, so that during the last 8 h of this period the wetbulb temperature was kept as close to the dry bulb temperature as theequipment was able to perform. The intention for this initial drying periodwas that the specimens, whose moisture content is initially high above thefibre saturation point (FSP), are brought to moisture content level close toFSP for loading. The purpose of the moist period is that the moisturecontent distribution in the specimens has time to even up. About 2 h before
T110K4
-0.08
-0.06
-0.04
-0.02
0
0.02
0.04
0 10 20 30 40 50 60 70Time [h]
Str
ain
[–]
30
40
50
60
70
80
90
100
110
Tem
pera
ture
[ºC
]
Dry bulb temp.
Wet bulb temp.
Spec. 1, K5A1, 0.05MPa
Spec. 2, K5A3, 0.1MPa
Spec. 3, K5B1, 0.1MPa
Specimen 4, K5A3, 0.2MPa
Dummy 4, K5B4
Dummy 3, K5B2
Dummy 1, K5A2
Loading

26
the end of this period (i.e. c. 28 h after start of the experiment) thespecimens are loaded.
After the initial drying period the actual drying below FSP is startedand shrinkage is assumed to begin. In most tests, drying was done first to anintermediate level, followed by some re-moistening before a final dryingperiod down to a moisture content of 2–5%. But in order to investigate theeffect of different moisture-change patterns there were also some tests inwhich the drying was completely monotonous and some tests in which therewere many drying-moistening cycles before the final drying.
In all tests the initial drying period was done at 95°C, but drying belowFSP varied between tests so that the maximum temperature reached duringthe test was either 95, 110 or 125°C. For tests at 95° the temperature couldbe kept constant and the humidity control done merely by the wet bulbtemperature value, whereas in tests with maximum temperature 110 or125°C the humidity regulation had to be realised partly by the dry bulbtemperature and thus the test temperature was not constant. In most teststhere was also a final cooling period, during which the temperature wastaken down to near room temperature in a controlled manner. After the testthe final moisture content and density of the specimens were measured byweighing and oven-drying method.
Loading was done simultaneously for all specimens by letting pressureair out of a tube, which when inflated supports the lever arms that producethe load. The period of load increase from zero to full load took c. 10 s.Constant load was used, i.e. the load was kept on unchanged until the end,but in many tests the load was temporarily removed for a few minutes inorder to study the value of the modulus of elasticity at given conditionsduring the test. Also, to study the creep recovery properties, load was insome tests removed for a longer period of time.
3.5 ACHIEVEMENT OF MEASUREMENTS AND PROCESSINGOF DATA
The experiments yielded a large amount of raw data, which required muchprocessing before being easily comprehensible. The achievement of the testconditions, quality of the obtained measurement data and the way the datawas processed are cursorily described before going on into the final results.
3.5.1 Experiments in constant conditions
A list of all successful experiments in the constant wet condition set-up isgiven as part of Appendix A (altogether 34 specimens). In these tests thetemperature inside the test cylinder varied a little and the achieved accuracyis estimated to be c. ±2°C, which is based on sample measurements made bya manually operated temperature sensor inside the cylinder. The accuracywas probably somewhat better for most of the time.
As was mentioned in the introduction of the experimental set-up, thedisplacement measurements were not made directly from the specimen,which was inside the pressurised test cylinder, but from the testing machine

27
piston. Thus the measured displacements contain error that is induced by thecompliance of the test machine and the yielding of the dowel joint by whichthe specimen is attached. These errors were compensated by a time-dependent correction, which was based on similar tests on specimens thatwere purely longitudinal. The compliance curve obtained from thesesubsidiary experiments was subtracted from the actual measured complianceof the perpendicular-to-grain specimens to obtain the ‘true’ compliance.However, as it turned out that the correction compliance to be subtractedcomprised a fairly large proportion of total measured displacement (c. 50%for radial specimens, c. 30% for tangential specimens) and the measuredcorrection compliances also showed scatter, it is assumed that some error(scatter) may be left in the final results despite the correction.
The specimens were allowed to heat for 20 min before loading, whichshould be enough to reach equilibrium with the temperature of thewater/steam bath. However, as the hygrothermal deformation may occur asdelayed, it is not known whether it has had some effect on the measuredstrains. The results have not been corrected for the possible effect ofhygrothermal deformation.
The modulus of elasticity was determined for each specimen from thecompliance value at 1 min after loading.
3.5.2 Experiments in drying conditions
Altogether 45 tests were made in the drying condition chamber. They wereidentified by a letter–number combination, such as T110K3, where thenumber after T denotes the maximum temperature reached during the testand K plus the second number is a sequential label. A list of all test seriesand specimens is given in Appendix A. Because of simultaneous testmethod development and starting troubles with the moisture control system,the specimens in the first tests did not dry as was intended but remained wetfor long. Thus, in fact, the very first tests did not yield drying conditionresults but instead constant wet condition creep curves, which are valuableresults, too. Also, some later experiments yielded constant wet conditionresults, because of deficiencies in the drying of specimens due to variablereasons. In some tests the fan did not work and in many ‘successful’ teststhe period from loading to the beginning shrinkage is long enough to givean idea of the constant condition response. Some tests were alsointentionally made in moist conditions to yield wet condition results.
Overall, after the starting hardships the climate control system workedwell. The regulation of both the dry bulb temperature and the wet bulbtemperature functioned with good accuracy most of the time. In some teststhere are departures, peaks or oscillation, from the control curve, the causeof which is not known, possibly an interference from outside source.
Also the measurement of displacements functioned well. This type ofmeasurement requires that there are two transducers measuring onespecimen, because in practise there is always some uneven shrinkagecausing warping, so that the employment of the average of thedisplacements measured on two sides is necessary. Unfortunately, twodisplacement transducers broke down during the experimental programme

28
and the number of specimens had to be reduced. This was done by removingone dummy position from service. However, the principle of havingadjacently cut creep-specimen–dummy pairs needed not to be violated,because one dummy could serve as the zero-load control for the two creepspecimens cut along its sides.
Moisture content measurements were not quite as successful. Theweight drop measurement itself functioned well: although the swingingmotion of the hanging specimens due to air circulation causes oscillations,the weight changes are detectable. However, the initial moisture contentvalues calculated backwards based on the final dry weight and the measuredweight drop are too high. The cause for this is that other constituents thanwater are extracted from wood in the high temperature conditions. Anotherpotential cause for inaccuracy is that water, which possibly condenses onthe specimen and on the suspension wire, may alter the result. Nevertheless,the weight drop measurements do give good qualitative information of themoisture content changes, although moisture content values based on themshould not be taken as absolutely exact.
The displacement measurements of each creep and zero-load specimenwere processed by taking the average of the transducer readings measuringon the two sides and transforming it to strain and compliance values.
Initial MOE values were determined based on compliance values at 1min after first loading. Similarly, the MOE values at the subsequentunloading-loading sequences later during the course of the experiment weredetermined based on the compliance change at 1 min after unloading.
The time-dependent compliances of loaded specimens were calculatedby determining an estimate for their zero-load behaviours and subtractingthose from the measured strains under load. For each creep specimen, theestimated zero-load behaviour was based on its matched dummy pair,whose origin had been adjacent to the creep specimen. The basic idea in theestimation was that the shrinkage behaviour of the loaded specimen and itsdummy is the same, so that if there is enough time for them to dry and themoisture content to reach equilibrium, their shrinkages will be equal. Theestimated zero-load behaviour was determined as a new curve which beforeloading moment follows the measured strain of the creep specimen but afterloading gradually begins to approach the measured strain curve of thedummy and reaches it at the first equilibrium moisture level during drying.An example of the estimation procedure is shown in Fig. 11. In some rarecases, when it was clearly seen that the above procedure would not give thebest result, the estimated zero-load behaviour after loading was assumed tofollow directly the length changes of the dummy.

29
Fig. 11. An example of the estimation of the zero-load shrinkage behaviourfor a loaded creep specimen based on the measurement of the shrinkage ofa dummy specimen, which has been cut adjacent to the creep specimen. Theestimation is based on the idea that if there is enough time for bothspecimens to dry and their moisture contents to reach equilibrium, theirshrinkages will be equal.
The laborious procedure of producing matched creep-specimen–dummy pairs and of estimating the zero-load shrinkage in the rathercomplicated manner was made as an attempt to ensure best possibleaccuracy in final compliance results. The fundamental cause for the need ofcareful matching is of course that the zero-load and non-zero-loadbehaviour cannot be measured on the same specimen (any drying fromgreen permanently changes the properties). However, even if the specimensand their dummies were well matched, their shrinkages may have beendifferent due to the inevitable variability of wood material. This causesscatter of the final compliance curves, which seems to not be completelyavoidable; but with results from a sufficient number of pairs the averageresult should be reliable.
Besides the errors caused by the difference of the final shrinkagevalues of the specimen and its dummy, there can be errors caused bydifferences in their drying speeds and consequent shrinkage rates. Contraryto the above, these effects can be corrected in the final compliance curves.The shrinkage rate difference, which could also be described as a ‘phaseshift’ between the shrinkages, induces a ‘mountain’ or a ‘valley’ onto thecompliance curve during a rapid shrinkage period. These errors can beeasily detected and corrected as is shown in Fig. 12.
T125K1
-0.06
-0.05
-0.04
-0.03
-0.02
-0.01
0.00
0.01
0 10 20 30 40 50 60 70
Time [h]
Str
ain
[–]
Specimen, M6B1, 0.096MPa
Dummy, M6B2
Assumed zero-load behaviourof the creep specimen

30
Fig. 12. Example of the error in the compliance caused by the differencebetween the shrinkage rates of the creep specimen and its dummy. Thisdifference induces a ‘mountain’ or a ‘valley’ onto the compliance curvedepending on whether the dummy or the specimen shrinks faster. The errorcan be easily corrected (dotted lines).
3.6 RESULTS
All results are given in Appendices B and C in such a form that thebehaviour of each specimen is distinguishable. In the following, the resultsare gathered for better evaluation.
3.6.1 Hygrothermal deformation
As can be seen in Fig. 10 and in the figures of Appendix C, an interestingfeature in the results of drying condition tests is the behaviour of thespecimens during the heating period and few hours after it. Namely,tangential specimens swell during the heating but radial specimens shrink(the specimens in Fig. 10 are tangential). This is a manifestation of thehygrothermal deformation phenomenon, which occurs when wet wood isheated (e.g. Kubler 1973). It seems that for most radial specimens thehygrothermal shrinkage occurs until the heating period is finished and doesnot continue much afterwards, whereas for tangential specimens swellingmay continue few hours after the heating is finished. It is possible to
T95K15
-0.08-0.06-0.04-0.02
00.020.040.060.080.1
0.120.140.160.180.2
-0.07-0.06-0.05-0.04-0.03-0.02-0.0100.01
Zero-load shrinkage strain [–]
Com
plia
nce
[1/M
Pa]
K11 A1 0.046 MPa
K11 B1 0.096 MPa

31
estimate the magnitude of the hygrothermal strain based on the experiments,but it should be noted that since the heating is made in air true shrinkagemay affect the results. According to the measurements, on heating to 95°Cthe hygrothermal strain is c. 0.8% (swelling) in tangential direction and –0.3% (shrinkage) in radial direction. These results are in good agreementwith earlier findings (Kubler 1973).
3.6.2 Shrinkage
Shrinkage was studied using the measurements on the dummy specimens inthe drying condition tests. Based on shrinkage at the end of the final dryingperiod (before cooling), an estimated shrinkage value on drying from greencondition at room temperature to 0% MC at the final temperature wascalculated. This value, which includes the effect of hygrothermaldeformation is plotted against density in Figs. 13 and 14. The dependence ofshrinkage on density is clearly seen for the radial shrinkage but is not asclear for tangential shrinkage. This may be caused by the fact that perfectlytangentially directed specimens are much more difficult to manufacture thanradially directed ones, and consequently tangential results contain morescatter.
Fig. 13. Dependence of tangential shrinkage on density. Shrinkage (whichincludes the hygrothermal effect) to 0% MC has been calculated based onshrinkage after the final drying but before cooling. The temperature values110 and 125°C indicate the maximum temperature during the experimentand thus a substantial part of the shrinkage has actually occurred at lowertemperature.
Tangential shrinkage
-0.11
-0.1
-0.09
-0.08
-0.07
-0.06
-0.05
360 400 440 480 520 560 600
Density [kg/m3]
Shr
inka
ge s
trai
n to
0%
MC
[–]
Spruce S, 95°C
Spruce K, 95°C
Spruce K, max 110°C
Spruce K, max 125°C
Pine M, max 110°C
Pine M, max 125°C

32
Fig. 14. Dependence of radial shrinkage on density. Shrinkage (whichincludes the hygrothermal effect) to 0% MC has been calculated based onshrinkage after the final drying but before cooling. The temperature values110 and 125°C indicate the maximum temperature during the experimentand thus a substantial part of the shrinkage has actually occurred at lowertemperature.
3.6.3 Modulus of elasticity
The results from both drying condition and wet condition tests were used tostudy the modulus of elasticity (MOE). The dependence of the MOE onmoisture content and temperature are the most interesting aspects.
Based on the drying condition tests, the modulus of elasticity is plottedagainst moisture content for tangential and radial specimens of Spruce K at95°C in Figs. 15 and 16, respectively. Each point represents onemeasurement and points joined with lines represent measurements on asingle specimen. The many measurements on a single specimen are basedon the first loading (~ saturated condition) and subsequent unloading–loading sequences in different conditions during the course of the dryingcondition test. Similar graphs for Pine M are given in Figs 17 and 18. Theresults show the huge effect of moisture content on the MOE.
In Figs. 19 and 20 the effect of temperature on the tangential MOE inwet condition is shown for spruce and pine, respectively. For comparison,the measurements of static MOE over the temperature range 20–80°C bySiimes (1967, Picea abies and Pinus sylvestris) are shown as well as themeasurement of dynamic MOE at 20–140°C by Salmén (1984, Picea abies).The new results show a very consistent continuation to the earlier results.
Radial shrinkage
-0.055
-0.05
-0.045
-0.04
-0.035
-0.03
-0.025
-0.02
380 420 460 500 540 580 620Density [kg/m3]
Shr
inka
ge s
trai
n to
0%
MC
[–]
Spruce S, 95°C
Spruce K, 95°C
Spruce K, max 110°C
Spruce K, max 125°C
Pine M, 95°C
Pine M, max 110°C
Pine M, max 125°C

33
Fig. 15. Modulus of elasticity against moisture content for tangentialspecimens of Spruce K at 95°C. Each point represents one measurement;points joined with lines represent measurements on a single specimen atfirst loading and subsequent unloading-reloading sequences during thecourse of the experiments. Values have been determined corresponding tocompliance change at 1 min after load change.
Fig. 16. Modulus of elasticity against moisture content for radialspecimens of Spruce K at 95°C. See note in the caption of Fig. 15.
Spruce K, tangential, 95°C
0
50
100
150
200
250
300
350
400
0 0.05 0.1 0.15 0.2 0.25
Moisture content [–]
Mod
ulus
of e
last
icity
[MP
a]
Spruce K, radial, 95°C
0
100
200
300
400
500600
700
800
900
1000
0 0.05 0.1 0.15 0.2 0.25
Moisture content [–]
Mod
ulus
of e
last
icity
[MP
a]

34
Fig. 17. Modulus of elasticity against moisture content for tangentialspecimens of Pine M at 95°C. See note in the caption of Fig. 15.
Fig. 18. Modulus of elasticity against moisture content for radialspecimens of Pine M at 95°C. See note in the caption of Fig. 15.
Pine M, tangential, 95°C
0
50
100
150
200
250
300
350
400
0 0.05 0.1 0.15 0.2 0.25
Moisture content [–]
Mod
ulus
of e
last
icity
[MP
a]
Pine M, radial, 95°C
0
100
200
300
400
500
600
700
800
0 0.05 0.1 0.15 0.2 0.25
Moisture content [–]
Mod
ulus
of e
last
icity
[MP
a]

35
Fig. 19. The effect of temperature on tangential MOE in wet condition forspruce (New, Picea abies). For comparison, the measurements done earlierat VTT on static MOE in temperature range 20–80°C (Siimes 1967, Piceaabies) are shown as well as the measurements on dynamic MOE at 20–140°C by Salmén (1984, Picea abies).
Modulus of elasticity, Spruce, FSP
0
50
100
150
200
250
300
350
20 40 60 80 100 120 140
Temperature [ºC]
Mod
ulus
of e
last
icity
[MP
a] Salmén, cross-direction, dynamic f = 0.05Hz
Siimes, tangential, static
400, 450 and 510 kg/m3
New, tangential, 350–470 kg/m3

36
Fig. 20. The effect of temperature on tangential MOE in wet condition forpine (New, Pinus sylvestris). For comparison, the measurements doneearlier at VTT on static MOE in temperature range 20–80°C (Siimes 1967,Pinus sylvestris) are shown. Experimental point denoted by the asterisk (* )is based on only two specimens.
Modulus of elasticity, Pine, FSP
0
50
100
150
200
250
300
20 40 60 80 100 120 140
Temperature [ºC]
Mod
ulus
of e
last
icity
[MP
a]
Siimes, tangential
430, 490 and 610 kg/m3
New, tangential
460–590 kg/m3

37
3.6.4 Viscoelastic creep
Of the constant wet condition viscoelastic creep tests, the ones of Spruce Sspecimens were the most successful. Their compliances in wet condition at95 and 125°C are shown in Figs. 21 and 22. The 95°C curves have beenextracted from tests both in the hot water/steam bath condition and in moistcondition in the drying test chamber. The latter ones have been correctedagainst possible effect of hygrothermal strain based on zero load dummyspecimens in the same tests, but no correction was possible to do for the testmade in the hot bath as there were no comparison specimens. The curvesshow clearly the increase of the creep rate due to temperature raise.
For the two other trunks there were fewer results and they showedmore scatter, but the appearance is quite similar to the Spruce S results. Thecompliances for Spruce K are shown in Figs. 23 and 24 and for Pine M inFigs. 25 and 26. The greater scatter of the results is assumed to be due toerror, which remains in the results after correction for the machine anddowel joint compliances. Apparently, for some reason, there has been morevariability in the compliance of the dowel joints in Spruce K and Pine Mspecimens than Spruce S specimens, which causes more scatter in theresults (the correction was the same for all specimens). However, if enoughresults are available, the average is assumed to be quite reliable even forSpruce K and Pine M. Mathematical creep curves were determined for thewet condition in the different cases by graphical estimation; and they arealso shown in Figs. 21–26.
There was also one test made in the drying test chamber, in whichconstant condition below FSP, viz. about 18% moisture content, wasmaintained after loading. This test was made with Spruce S and the resultsare shown in Fig. 27.

Fig. 21. Compliance in wet condition creep tests drawn against log10-time for tangential Spruce Sspecimens at temperatures 95 and 125°C, stress 0.046–0.2 MPa. In most tests the load was removed forfew hours before the end of the experiment to investigate recovery.
Spruce S, tangential, 95 & 125°C
0
0.05
0.1
0.15
0.2
0.25
1 10 100 1000 10000 100000 1000000
Time [s]
Com
plia
nce
[1/M
Pa]
125°C
95°C

Fig. 22. Compliance in wet condition creep tests drawn against log10-time for radial Spruce Sspecimens at temperatures 95 and 125°C, stress 0.096–0.4 MPa. In most tests the load was removed forfew hours before the end of the experiment to investigate recovery. In some cases there was a shortrecovery period even earlier during the experiment.
Spruce S, radial, 95 & 125°C
0
0.01
0.02
0.03
0.04
0.05
0.06
0.07
1 10 100 1000 10000 100000 1000000
Time [s]
Com
plia
nce
[1/M
Pa]
125°C
95°C

Fig. 23. Compliance in wet condition creep tests drawn against log10-time for tangential Spruce Kspecimens at temperatures 95 and 110°C, stress 0.046–0.296 MPa. In most tests the load was removedfor few hours before the end of the experiment to investigate recovery. In some cases there was a shortrecovery period even earlier during the experiment.
Spruce K, tangential, 95 & 110°C
0
0.02
0.04
0.06
0.08
0.1
0.12
0.14
0.16
1 10 100 1000 10000 100000
Time [s]
Com
plia
nce
[1/M
Pa]
110°C
95°C

Fig. 24. Compliance in wet condition creep tests drawn against log10-time for radial Spruce Kspecimens at temperatures 95 and 125°C, stress 0.096–0.496 MPa. In most tests the load was removedfor few hours before the end of the experiment to investigate recovery. In some cases there was a shortrecovery period even earlier during the experiment.
Spruce K, radial, 95 & 125°C
0
0.01
0.02
0.03
0.04
0.05
0.06
0.07
1 10 100 1000 10000 100000 1000000
Time [s]
Com
plia
nce
[1/M
Pa]
125°C
95°C

Fig. 25. Compliance in wet condition creep tests drawn against log10-time for tangential Pine Mspecimens at temperatures 95 and 125°C, stress 0.021–0.3 MPa. In most tests the load was removed forfew hours before the end of the experiment to investigate recovery. In some cases there was a shortrecovery period even earlier during the experiment.
Pine M, tangential, 95 & 125°C
0
0.05
0.1
0.15
0.2
0.25
1 10 100 1000 10000 100000
Time [s]
Com
plia
nce
[1/M
Pa] 125°C
Other curves: 95°C

Fig. 26. Compliance in wet condition creep tests drawn against log10-time for radial Pine M specimensat temperatures 95, 110 and 125°C, stress 0.096–0.496 MPa. In most tests the load was removed forfew hours before the end of the experiment to investigate recovery. In some cases there was a shortrecovery period even earlier during the experiment.
Pine M, Radial, 95, 110 & 125°C
0
0.01
0.02
0.03
0.04
0.05
0.06
0.07
0.08
0.09
1 10 100 1000 10000 100000
Time [s]
Com
plia
nce
[1/M
Pa]
125°C
Other curves: 95°C
110°C

44
Fig. 27. Compliance in constant condition creep tests at approximately18% moisture content and 95°C drawn against log10-time for tangentialSpruce S specimens, stress 0.046–0.196 MPa.
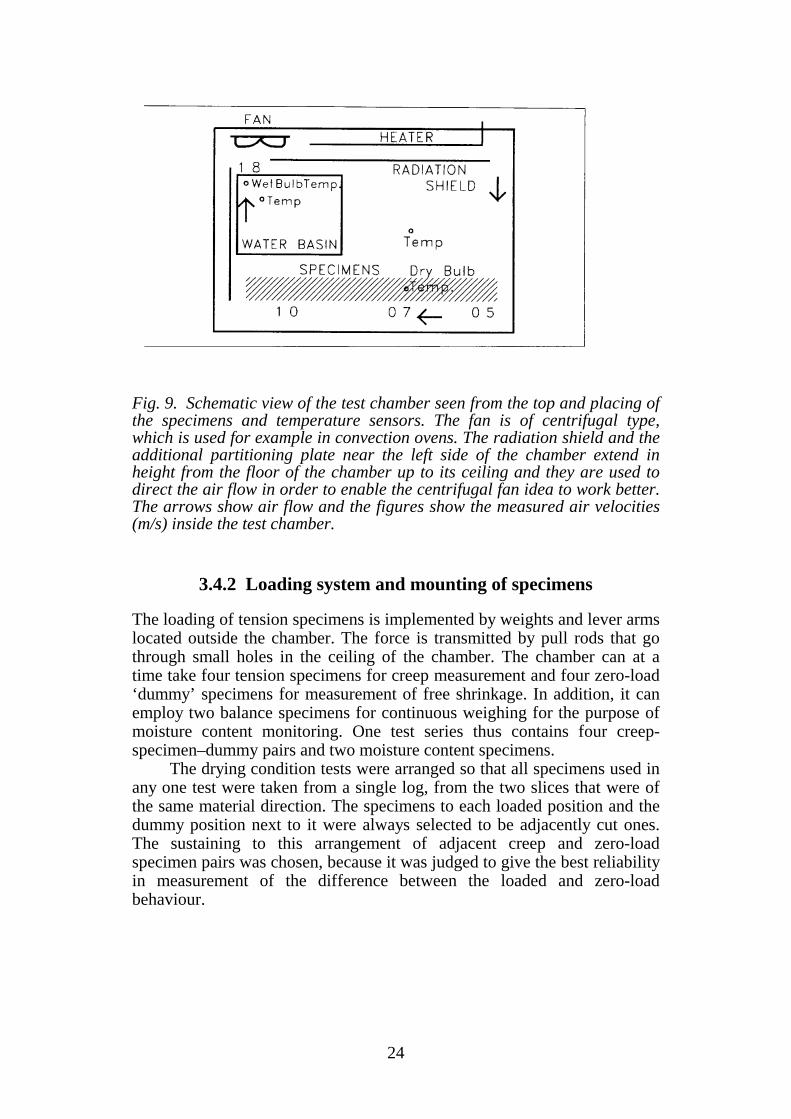
To compare the constant condition results with other researchers’results and to test the applicability of the time–temperature–moisture-content superposition principle, the fitted creep curves were plotted withcreep results of Joyet (1992) and Svensson (1996) and short term (MOE)results of Siimes (1967) and of this work. Joyet’s test conditions were 30°Cwith several moisture contents below FSP, and Svensson’s 60 and 80°Cwith two moisture contents below FSP. Both Joyet’s and Svensson’s resultsare for pine species, viz. Maritime pine (Pinus pinaster) and Scots pine(Pinus sylvestris), respectively. Siimes results are at four temperatures andseveral moisture contents for both Finnish spruce (Picea abies) and pine(Pinus sylvestris). All test results have been shifted according to the time–temperature–moisture-content superposition principle with (arbitrarilychosen) reference conditions Tref = 100°C and uref = 0.15. The short term(MOE) results were utilised assuming the short term compliance tocorrespond to the response at 1 min.
The shifted compliances Jshifted have been obtained from the measuredcompliances Jmeasured according to a combined temperature–moisture-content shift:
Spruce S, tangential, 95°C, 18%
0
0.01
0.02
0.03
0.04
0.05
0.06
1 10 100 1000 10000 100000
Time [s]
Com
plia
nce
[1/M
Pa]

45
( ) ( )J t a J tshifted measuredlog log10 10− = (1)
into which time t must be inserted as a dimensionless value (given inconsistent units, of course). a is a combined temperature–moisture-contentshift factor:
( ) ( )a k T T k u uT u= − + −ref ref (2)
Values for the constants kT and ku were determined separately for spruceand pine and they are given in Table 1.
Table 1. The values of the parameters kT and ku for spruce and pine.
Spruce PinekT 0.11 °C–1 0.095 °C–1
ku 43 43
Figs. 28–35 show the results of the comparisons. All results are fairlywell shifted to form continuous chains, but the fits are not very good for thelower ends of the creep curves. Master curves were fitted along the chainsand they are shown in Figs. 28–35 also. Anticipating the comingformulation of a creep model, the mathematical form of the Master curvesJM(t) was constructed as a series of Kelvin unit compliances:
( )( )J J J ti ii
M = + − −=∑0
1
211 exp τ
(3)
where Ji’s and τi’s are the constants of the fit. Their values are given fortangential deformation of spruce and pine in Table 2. For radial deformationthese constant were determined based on the tangential ones by keeping thevalues of the τi’s unchanged and multiplying all the Ji values by a singlefactor, which was 0.36 for spruce and 0.50 for pine. It should be noted thatone cannot use the Ji values to make comparison between the creepsusceptibility of spruce and pine, because the kT values for the two speciesare different.

46
Table 2. Parameters for the master curve fit for tangential deformation ofspruce (density 450kg/m3) and pine (density 490kg/m3) in constantconditions. Reference temperature 100°C and reference moisture content0.15. It should be noted that one cannot use the Ji values to makecomparison between the creep susceptibility of the two species, becausetheir kT values are different.
i τi [h] SpruceJi [1/MPa]
PineJi [1/MPa]
0 – 0.002 0.00181 10-14 0.00016 0.000082 10-13 0.00017 0.00013 10-12 0.00018 0.000154 10-11 0.0002 0.000185 10-10 0.00024 0.000226 10-9 0.0003 0.000287 10-8 0.0004 0.000358 10-7 0.00052 0.000429 10-6 0.00065 0.000510 10-5 0.00085 0.000611 10-4 0.0012 0.000912 10-3 0.002 0.001813 10-2 0.0035 0.002614 10-1 0.0055 0.004515 100 0.008 0.006516 101 0.01 0.00917 102 0.013 0.01518 103 0.018 0.0219 104 0.038 0.0720 105 0.06 0.1521 106 0.12 0.25

Fig. 28. Comparison of the constant condition test results of tangential spruce to Siimes’ (1967) resultswith a test of the applicability of the time–temperature–moisture-content superposition principle.
Spruce, tangential
0
0.05
0.1
0.15
0.2
0.25
-16 -14 -12 -10 -8 -6 -4 -2 0 2 4 6
Log10(Time/h)
Com
plia
nce
[1/M
Pa]
MasterSpruce S, 125°C, FSPSpruce S, 95°C, FSPSpruce K, 95°C, FSPSpruce S, 95°C, 18%Spruce K (MOE values); 95°C; 5, 12, 15% & FSPSiimes (MOE tests); 80°C; 4, 8, 12, 16, 20% & FSPSiimes (MOE tests); 60°C; 4, 8, 12, 16, 20% & FSPSiimes (MOE tests); 40°C; 4, 8, 12, 16, 20% & FSPSiimes (MOE tests); 20°C; 4, 8, 12, 16, 20% & FSP
Reference temperature 100°CReference moisture content 0.15

Fig. 29. A detail of the lower end of Fig. 28.
Spruce, tangential
0
0.002
0.004
0.006
0.008
0.01
0.012
0.014
0.016
0.018
0.02
-16 -14 -12 -10 -8 -6 -4 -2 0 2
Log10(Time/h)
Com
plia
nce
[1/M
Pa]
MasterSpruce S, 95°C, 18%Spruce K (MOE values); 95°C; 5, 12, 15%Siimes (MOE tests); 80°C; 4, 8, 12, 16, 20% & FSPSiimes (MOE tests); 60°C; 4, 8, 12, 16, 20% & FSPSiimes (MOE tests); 40°C; 4, 8, 12, 16, 20% & FSPSiimes (MOE tests); 20°C; 4, 8, 12, 16, 20% & FSP
Reference temperature 100°CReference moisture content 0.15

Fig. 30. Comparison of the constant condition test results of radial spruce with a test of theapplicability of the time–temperature–moisture-content superposition principle.
Spruce, radial
0
0.01
0.02
0.03
0.04
0.05
0.06
0.07
-14 -12 -10 -8 -6 -4 -2 0 2 4 6
Log10(Time/h)
Com
plia
nce
[1/M
Pa]
Master
Spruce S, 125°C, FSPSpruce S, 95°C, FSP
Spruce K, 125°C, FSPSpruce K, 95°C, FSP
Spruce K (MOE values); 95°C; 5, 12, 15% & FSP
Reference temperature 100°C,Reference moisture content 15%

Fig. 31. A detail of the lower end of Fig. 30.
Spruce, radial
0
0.002
0.004
0.006
0.008
0.01
0.012
0.014
0.016
0.018
0.02
-14 -12 -10 -8 -6 -4 -2 0 2 4
Log10(Time/h)
Com
plia
nce
[1/M
Pa]
Master
Spruce S, 125°C, FSP
Spruce S, 95°C, FSPSpruce K, 125°C, FSP
Spruce K, 95°C, FSP
Spruce K (MOE values); 95°C; 5, 12, 15% & FSP
Reference temperature 100°C,Reference moisture content 15%

Fig. 32. Comparison of the constant wet condition test results of tangential pine to Svensson’s (1996)and Siimes’ (1967) results with a test of the applicability of the time–temperature–moisture-contentsuperposition principle.
Pine, tangential
0
0.05
0.1
0.15
0.2
0.25
-16 -14 -12 -10 -8 -6 -4 -2 0 2 4 6
Log10(Time/h)
Com
plia
nce
[1/M
Pa]
MasterPine M, 125°C, FSPPine M, 95°C, FSPSvensson, 80°C, 17%Svensson, 80°C, 11%Svensson, 60°C, 19%Svensson, 60°C, 12%Pine M (MOE values); 95°C; 12, 15% & FSPSiimes (MOE tests); 80°C; 4, 8, 12, 16, 20% & FSPSiimes (MOE tests); 60°C; 4, 8, 12, 16, 20% & FSPSiimes (MOE tests); 40°C; 4, 8, 12, 16, 20% & FSPSiimes (MOE tests); 20°C; 4, 8, 12, 16, 20% & FSP
Reference temperature 100°CReference moisture content 0.15
Fig. 33. A detail of the lower end of Fig. 32 with addition of Joyet’s (1992) results.
Pine, tangential
0
0.002
0.004
0.006
0.008
0.01
0.012
0.014
0.016
0.018
0.02
-16 -14 -12 -10 -8 -6 -4 -2 0 2
Log10(Time/h)
Com
plia
nce
[1/M
Pa]
MasterSvensson, 80°C, 17%Svensson, 80°C, 11%Svensson, 60°C, 19%Svensson, 60°C, 12%Pine M (MOE values); 95°C; 12, 15%Siimes (MOE tests); 80°C; 4, 8, 12, 16, 20% & FSPSiimes (MOE tests); 60°C; 4, 8, 12, 16, 20% & FSPSiimes (MOE tests); 40°C; 4, 8, 12, 16, 20% & FSPSiimes (MOE tests); 20°C; 4, 8, 12, 16, 20% & FSPJoyet, 30°C, 19%Joyet, 30°C, 19%Joyet, 30°C, 15%Joyet, 30°C, 15%Joyet, 30°C, 13%Joyet, 30°C, 6.5%Joyet, 30°C, 6%
Reference temperature 100°CReference moisture content 0.15
Joyet, Maritime pine, bending

Fig. 34. Comparison of the constant condition test results of radial pine with a test of the applicabilityof the time–temperature–moisture-content superposition principle.
Pine, radial
0
0.005
0.01
0.015
0.02
0.025
0.03
0.035
0.04
0.045
0.05
-14 -12 -10 -8 -6 -4 -2 0 2 4 6
Log10(Time/h)
Com
plia
nce
[1/M
Pa]
MasterPine M, 95°C, FSP
Pine M (MOE values); 95°C; 5, 12, 15% & FSP
Reference temperature 100°CReference moisture content 0.15

Fig. 35. A detail of the lower end of Fig. 34 with addition of Joyet’s (1992) results.
Pine, radial
0
0.002
0.004
0.006
0.008
0.01
0.012
0.014
-14 -12 -10 -8 -6 -4 -2 0 2
Log10(Time/h)
Com
plia
nce
[1/M
Pa]
MasterPine M (MOE values); 95°C; 5, 12, 15% & FSPJoyet, 40°C, 19%Joyet, 30°C, 19%Joyet, 30°C, 19%Joyet, 30°C, 15%Joyet, 30°C, 15%Joyet, 30°C, 13%Joyet, 30°C, 13%Joyet, 30°C, 6.5%Joyet, 30°C, 6%Joyet, 25°C, 19%
Reference temperature 100°CReference moisture content 0.15
Joyet, Maritime pine, bending

55
3.6.5 Mechano-sorptive creep
Mårtensson (1994) and Svensson (1994) have introduced the approach ofpresenting creep curves obtained in drying condition tests as drawn againstzero-load shrinkage measured in the same test rather than moisture contentor moisture content change. Their approach is advantageous for at least tworeasons: because shrinkage is easier to measure than moisture content, andbecause we do not need to make any assumptions of when the moisturecontent comes below the fiber saturation point (we can directly observe thebeginning of the shrinkage). Furthermore, shrinkage measurement itselfcorrects possible influence of uneven moisture content distribution withinthe specimens, because (at least nearly) the same moisture contentdistribution is present in the zero-load shrinkage specimens as is in theloaded creep specimen. The approach is also supported by more theoreticalaspects, if the findings of Hunt (1986) concerning the correlation of theamount of longitudinal mechano-sorptive creep to longitudinalhygroexpansion hold also for the transverse directions. The same concernsthe presumption of the phenomenological connection between mechano-sorptive creep and hygroexpansion in general (Hanhijärvi 1995). On theother hand, if and when the amount of shrinkage can be considered linearlyproportional to moisture content change below fiber saturation, the twoapproaches are principally equivalent. Because of these advantages, theresults of the creep tests in drying conditions are presented againstcorresponding zero-load shrinkage strain.
The results of all specimens are given in Appendix C as unprocessedstrain measurement vs. time plots and compliance vs. zero-load shrinkageplots. These latter ones are also gathered into Figs. 36–49, as groupedaccording to the different trunks and the maximum temperature valuesreached during test. For clarity of Figs. 36–49, the disturbing effect hasbeen corrected which is caused by the ‘phase shift’ between the drying ofthe creep specimen and its dummy. The correction is done whenever it hasbeen considered to be possible and to make the figures clearer. Wheneverthe correction has been done the corrected range is plotted with dashed line.(In Appendix C no such corrections have been made.)
Figs. 36–49 contain also estimated curves for combined elastic–viscoelastic compliance and average total compliance. The elastic-viscoelastic compliances have been determined using the Master curve, Eq.(3) for constant load case. The average total compliance curves aregraphical estimations (not any calculated means) based on all results in theproper direction. For instance, the estimated total compliances for tangentialcases have been estimated based on all tangential test results, and not onthe results in a single figure only. Similarly, estimated total radialcompliances are based on all radial results. Furthermore, the average totalcompliances have been assessed assuming monotonous drying and constantload, which was not the case in most tests. Estimation for the averagemechano-sorptive compliance can be obtained as the difference of the twocurves.

56
All cases show clearly that the elastic-viscoelastic compliance curveslevel so that they are practically horizontal after loading and someviscoelastic creep during early drying. Thus, the slope of the totalcompliance curve after the early drying is a good estimate of the mechano-sorptive creep development.

57
Fig. 36. Compliance vs. zero-load shrinkage strain for tangential Spruce Kspecimens in the tests at 95°C. The estimated magnitude of the elastic–viscoelastic compliance in the test conditions is also plotted as well as theestimated average total compliance, which is based on all tangential results(not only the ones in this figure).
Spruce K, tangential, 95°C
0
0.02
0.04
0.06
0.08
0.1
0.12
0.14
0.16
0.18
-0.09-0.08-0.07-0.06-0.05-0.04-0.03-0.02-0.0100.01
Zero-load shrinkage strain [–]
Com
plia
nce
[1/M
Pa]
K4 A1K4 A3K4 B1K4 B3K10 A1K10 B1K10 B3K11 A1K11 B1K11 B3Estd. ve-compl.Estd. aver. tot. compl.

58
Fig. 37. Compliance vs. zero-load shrinkage strain for tangential Spruce Kspecimens in the tests with maximum temperature 110°C. The estimatedmagnitude of the elastic–viscoelastic compliance in the test conditions isalso plotted as well as the estimated average total compliance, which isbased on all tangential results (not only the ones in this figure).
Spruce K, tangential, 95 → 110°C
0
0.02
0.04
0.06
0.08
0.1
0.12
0.14
0.16
0.18
0.2
-0.08-0.07-0.06-0.05-0.04-0.03-0.02-0.0100.01
Zero-load shrinkage strain [–]
Com
plia
nce
[1/M
Pa]
K5 A3K5 B1K5 B3K6 A1K6 A3K6 B3Estd. ve-compl.Estd. aver. tot. compl.
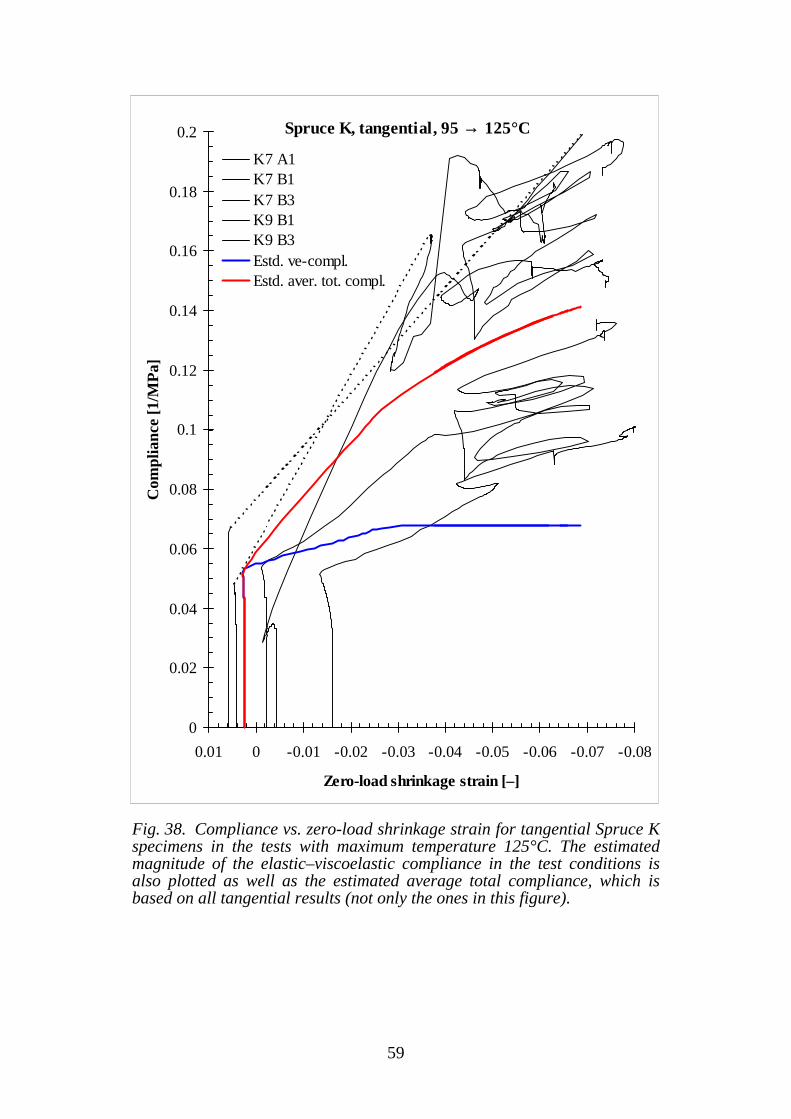
59
Fig. 38. Compliance vs. zero-load shrinkage strain for tangential Spruce Kspecimens in the tests with maximum temperature 125°C. The estimatedmagnitude of the elastic–viscoelastic compliance in the test conditions isalso plotted as well as the estimated average total compliance, which isbased on all tangential results (not only the ones in this figure).
Spruce K, tangential, 95 → 125°C
0
0.02
0.04
0.06
0.08
0.1
0.12
0.14
0.16
0.18
0.2
-0.08-0.07-0.06-0.05-0.04-0.03-0.02-0.0100.01
Zero-load shrinkage strain [–]
Com
plia
nce
[1/M
Pa]
K7 A1K7 B1K7 B3K9 B1K9 B3Estd. ve-compl.Estd. aver. tot. compl.

60
Fig. 39. Compliance vs. zero-load shrinkage strain for tangential Spruce Sspecimens in the tests at 95°C. The estimated magnitude of the elastic–viscoelastic compliance in the test conditions is also plotted as well as theestimated average total compliance, which is based on all tangential results(not only the ones in this figure).
Spruce S, tangential, 95°C
0
0.02
0.04
0.06
0.08
0.1
0.12
0.14
0.16
0.18
0.2
-0.09-0.08-0.07-0.06-0.05-0.04-0.03-0.02-0.010
Zero-load shrinkage strain [–]
Com
plia
nce
[1/M
Pa]
S3 A1S3 A3S3 B1S3 B3S4 A1S4 A3S4 B1S4 B3Estd. ve-compl.Estd. aver. tot. compl.

61
Fig. 40. Compliance vs. zero-load shrinkage strain for tangential Pine Mspecimens in the tests at 95°C. The estimated magnitude of the elastic–viscoelastic compliance in the test conditions is also plotted as well as theestimated average total compliance, which is based on all tangential results(not only the ones in this figure).
Pine M, tangential, 95°C
0
0.02
0.04
0.06
0.08
0.1
0.12
0.14
0.16
0.18
0.2
-0.06-0.05-0.04-0.03-0.02-0.0100.01
Zero-load shrinkage strain [–]
Com
plia
nce
[1/M
Pa]
M8 A1Estd. ve-compl.Estd. aver. tot. compl.

62
Fig. 41. Compliance vs. zero-load shrinkage strain for tangential Pine Mspecimens in the tests with maximum temperature 110°C. The estimatedmagnitude of the elastic–viscoelastic compliance in the test conditions isalso plotted as well as the estimated average total compliance, which isbased on all tangential results (not only the ones in this figure).
Pine M, tangential, 95 → 110°C
0
0.02
0.04
0.06
0.08
0.1
0.12
0.14
0.16
0.18
0.2
-0.07-0.06-0.05-0.04-0.03-0.02-0.0100.01
Zero-load shrinkage strain [–]
Com
plia
nce
[1/M
Pa]
M4 A1M4 A3M4 B1M5 A1Estd. ve-compl.Estd. aver. tot. compl.

63
Fig. 42. Compliance vs. zero-load shrinkage strain for tangential Pine Mspecimens in the tests with maximum temperature 125°C. The estimatedmagnitude of the elastic–viscoelastic compliance in the test conditions isalso plotted as well as the estimated average total compliance, which isbased on all tangential results (not only the ones in this figure).
Pine M, tangential, 95 → 125°C
0
0.02
0.04
0.06
0.08
0.1
0.12
0.14
0.16
0.18
0.2
-0.08-0.07-0.06-0.05-0.04-0.03-0.02-0.0100.01
Zero-load shrinkage strain [–]
Com
plia
nce
[1/M
Pa]
M6 A1M6 B1M0 A1M0 B1M0 B3Estd. ve-compl.Estd. aver. tot. compl.

64
Fig. 43. Compliance vs. zero-load shrinkage strain for radial Spruce Kspecimens in the tests at 95°C. The estimated magnitude of the elastic–viscoelastic compliance in the test conditions is also plotted as well as theestimated average total compliance, which is based on all radial results(not only the ones in this figure).
Spruce K, radial, 95°C
0
0.01
0.02
0.03
0.04
0.05
0.06
0.07
0.08
0.09
0.1
-0.05-0.04-0.03-0.02-0.010
Zero-load shrinkage strain [–]
Com
plia
nce
[1/M
Pa]
K2 C1 K2 C3K2 D1 K2 D3K3 C1 K3 C3K3 D1 K3 D3K8 C1 K8 C3K8 D3 K10 C1K10 C3 K10 D1K10 D3 K11 D1K11 D3 Estd. ve-compl.Estd. aver. tot. compl.

65
Fig. 44. Compliance vs. zero-load shrinkage strain for radial Spruce Kspecimens in the tests with maximum temperature 110°C. The estimatedmagnitude of the elastic–viscoelastic compliance in the test conditions isalso plotted as well as the estimated average total compliance, which isbased on all radial results (not only the ones in this figure).
Spruce K, radial, 95 → 110°C
0
0.01
0.02
0.03
0.04
0.05
0.06
0.07
0.08
0.09
0.1
-0.04-0.03-0.02-0.010
Zero-load shrinkage strain [–]
Com
plia
nce
[1/M
Pa]
K4 C1K4 D1K4 D3K5 C1K5 D1K5 D3K6 C1K6 D3Estd. ve-compl.Estd. aver. tot. compl.

66
Fig. 45. Compliance vs. zero-load shrinkage strain for radial Spruce Kspecimens in the tests with maximum temperature 125°C. The estimatedmagnitude of the elastic–viscoelastic compliance in the test conditions isalso plotted as well as the estimated average total compliance, which isbased on all radial results (not only the ones in this figure).
Spruce K, radial, 95 → 125°C
0
0.01
0.02
0.03
0.04
0.05
0.06
0.07
0.08
0.09
0.1
-0.04-0.035-0.03-0.025-0.02-0.015-0.01-0.0050
Zero-load shrinkage strain [–]
Com
plia
nce
[1/M
Pa]
K9 C1K9 C3K9 D1K9 D3Estd. ve-compl.Estd. aver. tot. compl.

67
Fig. 46. Compliance vs. zero-load shrinkage strain for radial Spruce Sspecimens in the tests at 95°C. The estimated magnitude of the elastic–viscoelastic compliance in the test conditions is also plotted as well as theestimated average total compliance, which is based on all radial results(not only the ones in this figure).
Spruce S, radial, 95°C
0
0.01
0.02
0.03
0.04
0.05
0.06
0.07
0.08
0.09
0.1
-0.03-0.02-0.010
Zero-load shrinkage strain [–]
Com
plia
nce
[1/M
Pa]
S3 C1S3 C3S3 D1S3 D3S4 C1S4 C3S4 D1S4 D3Estd. ve-compl.Estd. aver. tot. compl.

68
Fig. 47. Compliance vs. zero-load shrinkage strain for radial Pine Mspecimens in the tests at 95°C. The estimated magnitude of the elastic–viscoelastic compliance in the test conditions is also plotted as well as theestimated average total compliance, which is based on all radial results(not only the ones in this figure).
Pine M, radial, 95°C
0
0.01
0.02
0.03
0.04
0.05
0.06
0.07
0.08
0.09
0.1
-0.04-0.03-0.02-0.010
Zero-load shrinkage strain [–]
Com
plia
nce
[1/M
Pa]
M8 C1M8 C3M8 D1Estd. ve-compl.Estd. aver. tot. compl.

69
Fig. 48. Compliance vs. zero-load shrinkage strain for radial Pine Mspecimens in the tests with maximum temperature 110°C. The estimatedmagnitude of the elastic–viscoelastic compliance in the test conditions isalso plotted as well as the estimated average total compliance, which isbased on all radial results (not only the ones in this figure).
Pine M, radial, 95 → 110°C
0
0.01
0.02
0.03
0.04
0.05
0.06
0.07
0.08
0.09
0.1
-0.04-0.03-0.02-0.010
Zero-load shrinkage strain [–]
Com
plia
nce
[1/M
Pa]
M5 C1M5 D1M5 D3Estd. ve-compl.Estd. aver. tot. compl

70
Fig. 49. Compliance vs. zero-load shrinkage strain for radial Pine Mspecimens in the tests with maximum temperature 125°C. The estimatedmagnitude of the elastic–viscoelastic compliance in the test conditions isalso plotted as well as the estimated average total compliance, which isbased on all radial results (not only the ones in this figure).
Pine M, radial, 95 → 125°C
0
0.01
0.02
0.03
0.04
0.05
0.06
0.07
0.08
0.09
0.1
-0.05-0.04-0.03-0.02-0.010
Zero-load shrinkage strain [–]
Com
plia
nce
[1/M
Pa]
M0 C1M0 C3M0 D3Estd. ve-complEstd. aver. tot. compl.

71
Magnitude of mechano-sorptive creep
The compliance results in Figs. 36–49 show very large scatter. Apparently,this is mostly due to the analysis procedure, in which the difference of thetotal strain and the shrinkage strain is taken. This difference is verysensitive to error in determining the zero-load shrinkage. And due to naturalvariability there is always some difference between the shrinkage of thecreep specimen and its dummy, even if they were chosen to match well.Another cause for the large scatter is the fairly low stress level that asignificant portion of the specimens was loaded to. Low stress level makesthe results more susceptible to error in estimation of the zero-loadbehaviour. Nevertheless, as the number of tested specimens was quite highthe average response can be fairly confidently obtained.
The results did not give reason to determine the mechano-sorptivecompliance separately for spruce and pine as their responses seem to be ofapproximately equal magnitude. However, if the scatter was not as large,the possible difference between the two species might be more detectable.
Also, any possible effect of temperature was not directly detectablefrom these new results, but this is understandable since in the tests withmaximum temperature 110°C and 125°C a large part of the drying tookplace at a much lower temperature level. The magnitude of the mechano-sorptive creep compliance at 95°C was estimated based on Figs. 36–49 tobe:
( ) ( )Jms,T s s,loading s s,loading MPa= − − − −
12 6
12. ε ε ε ε (4)
( ) ( )Jms,R s s,loading s s,loading MPa= − − − −
12 12
12. ε ε ε ε (5)
where the subscripts T and R refer to tangential and radial directions. εs isthe zero-load shrinkage strain and εs,loading is its value at the time ofloading. The compliance magnitudes have been determined for continuousloading and monotonous drying at 95°C.
To get a better picture of the effect of temperature and to quantify themechano-sorptive creep as function of temperature, the estimated averagetotal compliance in the tangential direction was plotted with otherresearchers’ results. For this, the results from Hisada (1986), Wu and Milota(1995), Svensson (1996) and Kangas (1990) along with the new one aregathered into Fig. 50. Kangas’ results were slightly re-processed and anestimated average compliance was determined in the same manner as above.Fig. 50 indicates that temperature has an effect on the amount of mechano-sorptive creep. Based on the slope of the compliance curves (after loadingand initial deformation), the dependence of mechano-sorptive creepmagnitude was estimated as function of temperature, Fig. 51. The mechano-sorptive creep magnitude as function of temperature was also numericallymodelled, by writing the magnitude of the mechano-sorptive creepdevelopment as relative to that at 95°C:

72
( )( ) ( ) ( )J T
J CC T C C T Cms
ms 951 0 014 95 0 00007 951 2 2
°= + ° − ° + ° − °− −. . (6)
Although this equation is based on experiments at temperatures 20–95°C, itis assumed that its application range can be extended somewhat above95°C.

73
Fig. 50. Effect of temperature on tangential compliance during dryingshowing results from several researchers. Hisada’s (1986) results [*) zero-load shrinkage estimated by the author] are on hinoki (Chamaecyparisobtusa). Wu and Milota’s (1995) results are on Douglas fir (Pseudotsugamenziesii). Svensson’s (1996) and Kangas’ (1990) results are on Scots pine(Pinus sylvestris). Note that the curve of the new results begins at a positiveshrinkage strain value due to the hygrothermal effect.
-0.07-0.06-0.05-0.04-0.03-0.02-0.0100.01
Zero-load shrinkage strain [–]
Com
plia
nce
[1/M
Pa]
0
0.01
0.02
0.03
0.04
0.05
0.06
0.07
0.08
0.09
Hisada, 20°C, 1.92MPaHisada, 30°C, 0.48MPaHisada, 50°C, 0.34MPa (*Hisada, 70°C, 0.21MPa (*Hisada, 80°C, 0.15MPaSvensson, 60°C, 0.8MPaSvensson, 60°C, 0.8MPaSvensson, 80°C, 0.4MPaSvensson, 80°C, 0.4MPaWu & Milota, 65.6°C, 0.827MPaKangas, 60°CKangas, 80°CNew, 95°C

74
Fig. 51. Estimated magnitude of the mechano-sorptive creep developmentat different temperatures relative to its magnitude at 95°C. Theexperimental points are based on estimation of curve slopes in Fig. 50.
Effect of moisture cycling on mechano-sorptive creep
One important aspect in the quantification of the mechano-sorptive effect isthe effect of repeated moisture cycles. This feature was investigated in thelate part of the experimental programme by performing experiments thatconsisted either of a single monotonous drying or of several drying-moistening cycles (Appendix C, T95K19–T95K23). Fig. 52 shows anexample of the resulting compliance curve of both drying schedule types.The curves are chosen so that they resemble each other as much as possibleexcept the presence or lack of the moisture cycles. The curves indicate thatthere is some more creep development due to the moisture cycles but theeffect is not very strong.
0
0.1
0.2
0.3
0.4
0.5
0.6
0.7
0.8
0.9
1
0 20 40 60 80 100
Temperature [°C]
Rel
ativ
e m
agni
tude
of m
s-cr
eep
Estd. based on tests
Model

75
Fig. 52. Effect of moisture cycling on mechano-sorptive creep development.Comparison between two specimens that underwent a monotonous dryingor a drying with moisture cycles.
Spruce S, radial, 95°C
0
0.01
0.02
0.03
0.04
-0.03-0.02-0.010
Zero-load shrinkage strain [–]
Com
plia
nce
[1/M
Pa]
S3 D3
S4 D3
Stress = 0.396 MPa

76
Recoverability of mechano-sorptive creep
Another interesting aspect of the mechano-sorptive creep in conjunctionwith drying is the recoverability. In Kangas’ (1990) experiments it wasfound that mechano-sorptive creep is largely recoverable during re-wetting.In the present project, recovery was investigated in a test in which the loadwas removed at about halfway of the drying. The results are shown inAppendix C, T95K19. In Fig. 53, the compliance of two specimens iscompared; the first one of them had the load on through the wholeexperiment, whereas the second one had the load removed at halfway.Except the load history, the specimens have been chosen to show a verysimilar response. It can be seen that the recovery is very little if muchanything during drying. This is a somewhat surprising result, because veryoften it has been assumed that mechano-sorptive creep is recoverable by anymoisture change regardless of its direction.

77
Fig. 53. Test of recoverability of mechano-sorptive creep if load is removedat about halfway of drying. The two specimens have been chosen toresemble each other as much as possible in the response except that theother one had the load on through the whole experiment and the other onehad it removed at about halfway.
Spruce S, tangential, 95°C
0
0.02
0.04
0.06
0.08
0.1
0.12
0.14
0.16
-0.09-0.08-0.07-0.06-0.05-0.04-0.03-0.02-0.010
Zero-load shrinkage strain [–]
Com
plia
nce
[1/M
Pa]
S1 B3S4 B3
Stress = 0.196 MPa

78
3.6.6 Strength
As an extra extension to the constant wet condition creep tests a verylimited strength test series was carried out. The test set-up and conditionswere the same as for the creep tests, i.e. hot steam/water bath attemperatures 95 and 125°C. The specimens were of Spruce S only. Thespecimens were slightly modified for the strength tests by cutting a roundwaisting along the two edges of the specimen middle parts, so that thesmallest cross-section area at the middle of the specimens was 20 mm ×21.5 mm. The strength tests were carried out in just the same way as theconstant wet condition creep tests, only that, at loading, the load increasewas continued until failure.
The results of the strength test of individual specimens are gathered inTable 3. Not all specimens failed “properly” at the middle part, but in quitea few specimens the fracture surface passes at least partly along the gluedjoint. All radial specimens failed at least somewhat “improperly”. This is nosurprise, since the specimens used were just modified creep specimens andnot designed for strength tests. Nevertheless, a preliminary idea of thestrength can be obtained from the results for the tangential direction but theresults for the radial direction are doubtful. The tangential results show afairly consistent continuation of the strength test results of Siimes (1967) onspruce (Picea abies) as shown in Fig. 54. Koran’s (1979) results on Blackspruce (Picea mariana) have also been included.

79
Table 3. Strength test results. The results should be considered aspreliminary, because so many specimens failed at the glued joint; this holdsespecially for the radial results.
Speci-men
Specimendirection
Tempe-rature[°C]
Max.force[kN]
Failureremark
(†
Strength[MPa]
Averageall
Averagenon-
joint (‡S0A4 Tangential 95 0.348 0.810S1A5 Tangential 95 0.388 0.902S3A7 Tangential 95 0.283 ** 0.658S3B7 Tangential 95 0.321 * 0.747S4B5 Tangential 95 0.317 ** 0.737
Tangential 95 0.771 0.856S1C3 Radial 95 0.599 * 1.393S1D1 Radial 95 0.682 ** 1.587S1D3 Radial 95 0.529 ** 1.230S4C4 Radial 95 0.496 ** 1.153
Radial 95 1.341 –S1A6 Tangential 125 0.268 0.624S3A8 Tangential 125 0.205 ** 0.477S3B8 Tangential 125 0.215 0.500S4A4 Tangential 125 0.214 ** 0.497S4B6 Tangential 125 0.205 0.476S5A6 Tangential 125 0.245 ** 0.569
Tangential 125 0.524 0.534S1C4 Radial 125 0.488 1.135S1D2 Radial 125 0.598 1.390S3C4 Radial 125 0.549 ** 1.277S5C4 Radial 125 0.295 ** 0.686
Radial 125 1.122 1.263†) ** – Failure occurred at the joint
* – Failure occurred partly at the joint‡) Average of failures that occurred outside the joint.

80
Fig. 54. Tangential strength of spruce wood in saturated condition asfunction of temperature. Even if the sample size is very small, the newresults (Picea abies) show a reasonably consistent continuation of theresults of Siimes (1967, Picea abies). Koran’s (1979) results on Blackspruce (Picea mariana) are also shown for reference.
Tangential strength, spruce, FSP
0
0.5
1
1.5
2
2.5
3
3.5
4
-60 -40 -20 0 20 40 60 80 100 120 140 160 180 200
Temperature [ºC]
Str
engt
h [M
Pa]
Koran,glycerine
Koran, water saturated
Siimes, tangential, green
400, 450, 510 kg/m3
New, green, ~400kg/m3

81
4 MODELLING
The final goal of the work was to be able to model the stress and straindevelopment during drying using numerical simulation. Therefore, for usein simulation programs, a constitutive model of the mechanical behaviour ofwood in the high temperature drying conditions was constructed, whichwould conform as closely as possible with the obtained experimentalresults.
Based on test results and on demands set by simulation performance,the following presumptions were taken as the basis of modelling:
– the model should be kept simple and linear for fast simulationcapability,
– shrinkage is linear with moisture content below fiber saturation,– no categorisation is made between elastic and viscoelastic
strains, but these two are considered jointly under viscoelasticlabel,
– time–temperature–moisture-content equivalence principle is usedin modelling viscoelastic creep,
– mechano-sorptive creep is assumed to be closely related toshrinkage,
– a fairly large fraction of the mechano-sorptive creep isirrecoverable, unless the direction of the stress is reversed.
– cycling moisture content (repeated drying and wetting periods)does not induce much additional creep compared to monotonousdrying.
It should be noted that the assumptions concerning the character of themechano-sorptive creep were adopted especially keeping in mind the hightemperature conditions (90–125°C). The model was created separately fortangential deformation and radial deformation and any coupling effectsbetween them were not considered in this work.
The model is based on the commonly used idea that the strain isseparable into parts which, when summed together yield the total strain:
ε ε ε ε ε= + + +s ht ve ms (7)
where ε is the total strain, εs is the hygroexpansion (shrinkage) strain, εht isthe hygrothermal strain, εve is the combined elastic-viscoelastic strain andεms is the mechano-sorptive strain.
Assumption of the separability of the different strain terms, Eq. (7), orholding to linear modelling, are not necessarily correct from the theoreticalpoint of view (Hanhijärvi 1995), but were adopted here because of thesimplicity they bring to the modelling. In the following an evolution law isdeveloped for all strain terms to actualise the model.

82
4.1 SHRINKAGE AND HYGROTHERMAL STRAIN
In order to facilitate the expressions needed for describing shrinkage andcreep in function of moisture content, an “effective moisture content” û isdefined as
( )� min ,u u u= FS (8)
where u is the moisture content of wood calculated on the dry weight basis[u = (m-m0)/m0, m = mass, m0 = mass at absolute dry condition]. uFSdenotes the value of u at fiber saturation point (it is considered as a functionof temperature).
The assumption of linear shrinkage with moisture content change isexpressed as function of the effective moisture content:
d duε αs = � (9)
where εs is the hygroexpansion strain and α the hygroexpansion coefficient,which obtains differents value for radial and tangential cases and whichmay be a function of specific gravity and temperature. In the perpendicular-to-grain directions the linear shrinkage assumption is well supported byexperiment results except maybe the very beginning of shrinkage aroundFSP.
The hygrothermal deformation was modelled assuming that it isproportional to the temperature rise, but it begins only when temperatureexceeds 60°C and ceases to develop after temperature has reached 120°C.Also, it takes place only when the temperatures between 60°C and 120 °Care reached for the first time during the drying and is irrecoverable. Withthese assumptions:
d dT T T T
d
ε βε
HT MAX
HT
when and C C
otherwise
= ≥ ≤ ≤=
,
,
60 120
0
$ $
(10)
where εht is the hygrothermal strain, T the temperature and β thehygrothermal coefficient, which is of course different in the radial andtangential directions. TMAX is the maximum temperature which theconsidered material particle has reached during the drying. Anotherassumption was that hygrothermal deformation occurs in full measure onlyif the moisture content is at fiber saturation or above. No hygrothermaldeformation is developed if the moisture content is less than fiber saturationpoint minus 10%. These assumptions can be modelled by making βmoisture content dependent:
( )β β=
− +
FS
FSmax� .
.,
u u 01
010
(11)

83
where βFS is the value of β at FSP. Based on the experiment results, thevalues 0.00023 °C-1 and –0.000086 °C-1 can be obtained for βFS in thetangential and radial directions, respectively.
It should be noted that the above modelling of the hygrothermal strainassumes that is occurs immediately with temperature rise. This is not in fullagreement with the test results introduced earlier since especially in case oftangential specimens the hygrothermal strain development seems tocontinue even after the end of heating. However, since the hygrothermaldeformation is a rather unexplored topic, no dependence on time wasapplied to it.
4.2 ELASTIC STRAIN AND VISCOELASTIC CREEP
The separation of the elastic and viscoelastic strain from experiment resultsis indefinite. By theoretical definition, the elastic strain is that part of thestrain, which is completely recoverable and occurs immediately at loading.Its recovery occurs also immediately at unloading. On the other hand,viscoelastic strain is also recoverable, but occurs as delayed, only afterloading. The recovery of viscoelastic deformation also takes place as adelayed phenomenon. However, in real experiments, the separation of thesetwo is impossible because viscoelastic phenomena occur very fast — evenin high frequency excitation, time-dependent phenomena have beenrecorded (Launay 1987, referred to in Huet 1988) and no load can beapplied in ‘zero time’. Normally, in interpretation of test results, theproblem is avoided by some practical way, assuming an instant afterloading, at which the strain is defined as ‘elastic’, e.g. one minute afterloading. From the practical point of view this approach is very useful. Fromthe modelling point of view it contains the problem that the thus defined‘elastic’ deformation always includes some viscoelastic, time-dependentpart. If this definition of ‘elastic’ deformation as the deformation at a certaininstant after loading is applied in different conditions, the fraction of thestrain that is not truly elastic but time-dependent, viscoelastic may varyconsiderably.
This problem is troublesome in conjunction with the use of theprinciple of time-temperature equivalence in the modelling of viscoelasticcreep. This principle suggests, in short, that the effect of temperature on theviscoelastic creep amount can be modelled by defining a ‘material time’,which is the real time multiplied with a temperature dependent coefficient.At the reference temperature this coefficient equals 1 and the material timeis the real time; at temperatures higher than that the coefficient obtains avalue over 1 and material time ‘passes’ faster than real time. At lowertemperatures than the reference temperature, on the other hand, thecoefficient is less than 1 and the material time ‘passes’ slower than realtime. The time-temperature equivalence principle states that the viscoelasticcreep at different temperatures is taken into account by merely replacing thereal time with the material time in the viscoelastic creep model applicable atthe reference temperature. Now, if the immediate elastic deformation is

84
defined in different conditions as the deformation value at, say, 1 min afterloading and as it inevitably contains some viscoelastic deformation, the useof the time-temperature equivalence principle becomes obscure. Thus, inconjunction with the time-temperature equivalence principle, the elasticstrain should be determined as consistent to the definition of viscoelasticcreep.
Due to this obscurity in the separation of elastic deformation from theviscoelastic creep, the following approach was chosen in this work: it wasresolved that all immediate elastic and time-dependent viscoelasticdeformation can be dealt under the concept of viscoelastic strain. Thisassumption was used in conjunction with adopting the time–temperature–moisture-content equivalence.
The modelling was done by a series of rheological units of the Kelvintype, i.e. the generalised Kelvin material, as was earlier anticipated in theanalysis of results. 22 units are used which obey the following equations:
ε σ
ε σ ετ
ξ
0 0
1 2 21
ve ve
veve ve
ve
=
= − =
J
dJ
d iii i
i
, , ...(12)
where σ is the stress, εve,i ’s are the strains of the units, Jve,i ’s are theirlimit compliances and τve,i ’s their retardation times. dξ is the material timedifferential. The equation governing the unit 0 resembles the normaldefinition of elastic behaviour, but it should not be considered as elasticbehaviour, but rather to be understood as a Kelvin unit, whose retardationtime is so small that, in any condition, it reaches the limit compliance in atime which is shorter than the shortest time period that can come intoconsideration. The values of the Jve,i ’s and τve,i ’s have already been givenin Table 2.
The material time differential is, according to the time–temperature–moisture-content superposition principle:
( )d a T u dtξ = , (13)
where dt is the time differential. a is the shift factor, whose value is definedin Eq. (2).
4.3 MECHANO-SORPTIVE CREEP
The previous modelling of mechano-sorptive creep in conjunction withdrying has been based on analogy to Maxwell or Kelvin type viscoelasticmodels (a review of models of mechano-sorptive creep can be found in ref.Hanhijärvi 1995), so that for use in modelling the mechano-sorptive creepthe time differential dt has been replaced by the absolute value of themoisture content change |du|. These mechano-sorptive models repeat theproperties of their viscoelastic predecessors, when the effect of time is
85
assumed to be replaced by the cumulative amount of moisture contentchange in any direction, drying or wetting or alternating drying–wettingcycles. Under constant load, the “mechano-sorptive Maxwell model”produces linear creep development as function of cumulative moisturechange with no recovery, even if load is removed and moisture changecontinues. “The mechano-sorptive Kelvin model” produces slowing creeprate as cumulative moisture content change increases and exhibits completerecovery, if load is removed and moisture change continues enough. Bothmodels show a linear response with respect to stress.
Neither one of these models nor a combination of them was found tobe satisfactory for modelling the behaviour found in the experiments. Theexperiments showed that large proportion of the developed mechano-sorptive creep does not recover, even if the load is removed and dryingcontinues. However, based on earlier results at lower temperature levels(Kangas 1990), it was concluded that mechano-sorptive creep developed inpredominantly drying condition is recoverable at least to some extent duringwetting after removal of load. Furthermore, moisture cycling does notincrease creep in proportion to the amount of cumulative moisture change.It was concluded that the elementary mechano-sorptive Maxwell and Kelvinmodels or their combination is too simple to produce a satisfactory result ina wide range of conditions. Also, the type of modelling, in which differentvalues are assigned for the mechano-sorptive creep development dependingwhether de- or adsorption occurs, was rejected, because it may causeproblems in case the state of stress alternates with same rhythm as thedirection of the moisture content change. For longitudinal creep, a non-linear model has been suggested by the author (Hanhijärvi 1995), that candescribe the apparent irrecoverability, even if it shows slowing creep rate asfunction of cumulative moisture change. However, the applicability of anon-linear model to drying simulation was not attempted, because itrequires an iterative solution algorithm and thus would be computationallytoo slow for fast enough simulation.
Instead, a new model was developed which maintains computationalsimplicity and incorporates the experimentally discovered recovery andother properties. The development was based on the mechano-sorptiveKelvin-type model and to the idea that irrecoverable creep develops inproportion to the total creep. The development was built on expressingmechano-sorptive creep development on shrinkage development, orprecisely speaking the absolute value of the shrinkage strain differential|dεs| as has been done by Mårtensson and Svensson (1996). This is forconvenience of the consistency with the analysis of experiment results.Exactly same model could be obtained also in the more traditional way byexpressing the mechano-sorptive creep development in terms of the absolutevalue of effective moisture content change |dû|, because of the linearrelationship between these two, Eq. (9).
The apparent recovery in adsorption was modelled by introducing adependence of compliance on shrinkage – or equivalently it could bedescribed as dependence on moisture content.

86
The expression of mechano-sorptive strain rate in the new modelresembles that of the Kelvin type model, but now a new variable“irrecoverable mechano-sorptive strain” εir is introduced:
( )d dms
ms ms ir
mssε
σ ε ετ
ε=− −J (14)
Jms and τms correspond to the usual two parameters of the Kelvin model.The evolution of εir is defined in a four-branched equation:
( )
( )
if d
d
if d and d
d
if d and d
d d
if d and d
d d
ms
ir
ms min ms ms
ir
ms ms ms
ir ir ms ms max ir ir irir ir
ms ms ms
ir ir ms ms min ir ir irir ir
ε σε
ε σ ε ε ε εε
ε σ ε ε ε
ε ε ε ε σ εσ εσ
ε σ ε ε ε
ε ε ε ε σ ε σ εσ
≤=
> ≤ + ≤=
> + >
= + − −−
> + <
= + − − −
0
0
0
0
0
0
:
:
:
sgn min ,
:
sgn min ,
max
max
min
a J bJ
a J bJ
(15)
where the quantities εmin and εmax are defined:
if
if
ms ir
max ms
ms ir
max ir
ε ε
ε ε τ ε
ε εε ε
τ
≥
=
<=
→ −
:
max lim ( ),
:
maxt
(16)
and
if
if
ms ir
min ms
ms ir
min ir
ε ε
ε ε τ ε
ε εε ε
τ
≤
=
>=
→ −
:
min lim ( ),
:
mint
(17)
air and bir as well as Jir are additional model parameters.For the Eqs. (14) – (17) to be well-defined, an initial condition must be
defined for the variables εms, εir, εmin and εmax. The natural initial conditionfor simulation of drying is that before the beginning of consideration (e.g.before felling) all of them obtain the value zero:

87
ε ε ε εms ir max min when= = = = ≤0 0t t (18)
where t0 is the time at the beginning of consideration.To take into account the recovery during adsorption Jms and Jir are
made dependent on the amount of shrinkage (or equivalently, this could beexpressed by making them dependent on moisture content).
The definition of εir, εmax and εmin may seem awkward at first sight, sosome comments on the purpose of these variables may be necessary. The“irrecoverable mechano-sorptive strain” εir is the part of the mechano-sorptive strain that is not recoverable unless the direction of the acting stresschanges. It modifies the “internal equilibrium state” of the Kelvin model inEq. (14). The evolution of εir is defined in the four-branched Eq. (15):
– the first branch governs the case of recovery of εms, when thestress is zero or dεms occurs in different direction than the stressacts: dεir = 0.
– the second branch governs the case after temporary recovery,when εms + dεms is still in an area where no irrecoverable strainoccurs: dεir = 0.
– the third branch governs the case of increasing εms undertensile stress: dεir is non-zero; the first factors (air and theabsolute value expression) on the right side make it proportionalto dεms; the sgn-function gives it the correct sign; and the lastfactor is used to regulate its growth in a similar manner as in theKelvin model (Jir defines the limit compliance of εir; bir is usedfor limiting the change rate of εir).
– the fourth branch governs the case of compression anddecreasing εms and is symmetrical to the third branch.
εmax and εmin are variables, which are used to define the limit valuesfor εms, outside which it must move in order to produce irrecoverable creepεir. εmax and εmin are needed for proper treatment of reversing stress, e.g.change from tension to compression. Their evolution laws, Eqs. (16) and(17), are such that εmax and εmin follow either one of the values of εms or εiror remain at a previous maximum or minimum value of εms. Their evolutionis schematically illustrated in Fig. 55.

88
Fig. 55. Schematic illustration of the evolution of εmax and εmin as functionof εms and εir.
It should be noted that εir, εmax and εmin are internal variables, whichdescribe the state of the material due to previous loading and straininghistory, but which are not directly related to any measurable orimmeasurable quantity within the material. Their definition is made in arather crude way, which is due to the striving for a simple model.
The suitability of the model can be improved if several units governedby Eqs. (14) – (17) are put in series; the total mechano-sorptive strain isthen the sum of the units. In this work three units were used, the totalmechano-sorptive strain is then obtained:
ε εmsms=
=∑ ii 1
3 (19)
where εms,i ’s are the strain values of the three individual units. Each unit isgoverned by a separate set of equations similar to Eqs. (14) – (17) but obtainseparate parameters, which can be noted by Jms,i , τms,i , J
ir,i , air,i and bir,i ,
i = 1…3. The internal variables are also independent for each unit and canbe noted by εir,i , εmax,i and εmin,i , i = 1…3.
In Table 4, a set of model parameter values is given, which weredetermined based on the obtained experimental results. This set is intended
Zero-load shrinkage strain
Str
ain
ems
eir
emax
emin
εms
εir
εmax
εmin

89
for the temperature 95°C and the effect of temperature can be incorporatedwith the help of Eq. (6) (i.e. the values of the Jms,i ’s and Jir,i ’s are madetemperature dependent as Eq. (6) shows).
Table 4. Model parameter values for the mechano-sorptive creep model.
Direc-tion
i Jms,i [MPa-1]
τms,i [–]
Jir,i [MPa-1]
air,i [MPa]
bir,i [MPa-1]
1 0.003-0.03εs 0.005 0.003-0.09εs 150 1Tang. 2 0.008-0.04εs 0.015 0.008-0.12εs 150 1
3 0.014-0.05εs 0.045 0.014-0.15εs 150 11 0.0015-0.03εs 0.0025 0.0015-0.09εs 150 1
Radial 2 0.005-0.04εs 0.0075 0.005-0.12εs 150 13 0.008-0.05εs 0.0225 0.008-0.15εs 150 1
4.4 FEATURES AND PERFORMANCE
The most important features for a constitutive model for use in dryingsimulation are the prediction accuracy, of course, the wide application rangeand simplicity for fast calculation.
Except mechano-sorptive strain model, the model parameters weregiven values directly from the experiment results, so the model responseautomatically fits the results. The mechano-sorptive creep model parameterswere also adjusted to fit the experiment results. The performance of themechano-sorptive creep model with these parameters is demonstrated indifferent situations in Fig. 56. It can be seen that the model is capable offollowing the observed compliance magnitude very well. It also follows theresults well in other features, viz. the effect of moisture cycling andrecovery.
The application range of the model is intended to be quite large (~ 20–125°C, ~ 4%–FSP, length of application time depends on conditions). It ismainly determined by the range and duration of the experiments to which itsparameter values have been fitted, which can also be used for the estimationof its applicability to a certain application. It should be noted that the modeldevelopment has been made in conjunction with the high temperaturedrying conditions and more attention has been paid to the model accuracy inthese conditions; the low temperature prediction may not be so accurate.
The model can be characterised as a simple one except maybe the factthat 22 serial units are used in the modelling of the viscoelastic creep. Theyare needed in order to cover reasonably well the wide range of moisturecontents and temperatures. Fortunately, from the computational point ofview, the high number of units requires only somewhat more computermemory and a little more computation time, but no time-consumingiteration is needed. Furthermore, for particular applications, the model canbe easily simplified by reducing the number of serial units. If moist and hotconditions are considered only, the number of units can be reduced by

90
adding the values of the Jve,i ’s in the lower end to Jve,0 . Or, if dry and coolconditions are considered, the higher end units can simply be dropped out.Of course, the length of loading time also affects how many units will beneeded.
The application of the model into numerical calculation isstraightforward, if the explicit, Euler-forward, procedure is followed.Neither should any impenetrable obstacles occur when implicit methods areused, although the author has not tried the use of any implicit methods inconjunction with the mechano-sorptive model.
Altogether, the developed model meets the requirements set by theapplicability to simulation.
Fig. 56. Performance of the mechano-sorptive creep model in differentsituations. All cases have been calculated at constant stress 1 MPa andusing the Euler forward algorithm with maximum zero-load shrinkagestrain step value 0.0003.
Tangential
0
0.02
0.04
0.06
0.08
0.1
-0.08-0.07-0.06-0.05-0.04-0.03-0.02-0.010
Zero-load shrinkage strain [–]
Mec
hano
-sor
ptiv
e co
mpl
ianc
e [1
/MP
a] Experimental compl.Monotonous dryingDrying with one cycleMoisture cyclesCyclic dryingCyclic drying, irrecov. part

91
5 CONCLUSIONS
High temperature drying is a promising technique for faster and higherquality drying process than drying at the conventional kiln temperatures.The potential of the use of higher temperatures is well credible based on theresults of this work, which show clearly the greater deformation capacity(compliance) of wood in this temperature range (90–125°C) than at theconventional drying temperatures (60–80°C). This is seen for instance as thedecrease of the modulus of elasticity with increasing temperature, Figs. 19and 20. Greater deformation capacity means that drying stresses can be keptlower. On the other hand, the strength of wood drops with increasingtemperature, but the effect of increased compliance is apparently greaterallowing faster drying at higher temperatures.
The substantial development of the high temperature drying techniquerequires the optimisation of schedules, which must be done for all differenttypes of sawn timber raw material and different conditions. If the dryingprocess can be computationally simulated, this process becomesconsiderably easier. So far, the simulation has not been possible due to lackof knowledge about the material properties in the high temperature range.The experimental results and modelling achievements provide an adequatebase for the simulation with regard to mechanical properties. Of course, fora functioning simulation the moisture transfer properties must also bemastered.
The experiments carried out in this work cover a wide section aboutthe knowledge of mechanical properties needed for the simulation of dryingstresses. The weakest part at this point is the quantification of thesusceptibility to checking – strength and its dependence on the duration ofthe acting stresses, which is an important future research need. Also, thedifference between compression and tension creep behaviour is animportant aspect into which this work has not been able to pay anyattention. It is to be hoped that lively research activity can be continued inthe future for better understanding of the phenomena during the dryingprocess.

92
REFERENCES
Byvshykh, M. D. 1959. Influence of temperature and moisture content ofwood on its elastic properties. Derev. Prom., vol. 8, no. 2, pp. 13–15. (InRussian.)
Gerhards, C. 1982. Effect of moisture content and temperature on themechanical properties of wood: an analysis of immediate effects. Wood andFiber, vol. 14, no. 1, pp. 4-36.
Goulet, M. 1960. Dependence of transverse tensile strength of oak, beechand spruce on moisture content and temperature within the range of 0° to100°C. Holz als Roh- und Werkstoff, vol. 18, no. 9, pp. 325–331. (InGerman.)
Hanhijärvi, A. 1995. Modelling of creep deformation mechanisms in wood.Espoo: Technical Research Centre of Finland (VTT). 143 p. + app. 3 p.(VTT Publications 231.) ISBN 951-38-4769-1
Hisada, T. 1986. Creep and set behaviour of wood related to kiln drying.Bull. For. & For. Prod. Res. Inst., vol. 7, no. 335, pp. 31–130. (In Japanese.)
Huet, C. 1988. Modelizing the kinetics of the thermo-hygro-viscoelasticbehaviour of wood in constant climatic conditions. In: Itani, R. Y. (Ed.)Proceedings of the 1988 International Conference on Timber Engineering,Seattle 19–22 Sep. 1988. Madison, Wisconsin: Forest Products ResearchSociety. Pp. 395–401. ISBN 0-935018-41-7
Hukka A. 1996. A simulation program for optimisation of mediumtemperature drying on an industrial scale. 5th International IUFRO WoodDrying Conference, Quebec City, Canada, 13–17 August 1996.
Hunt, D. G. 1986. The mechano-sorptive creep susceptibility of twosoftwoods and its relation to some other materials properties. Journal ofMaterials Science, vol. 21, pp. 2088–2096.
Iida, I. 1986. The thermal softening of green wood evaluated by its Young’smodulus in bending. Mokuzai Gakkaishi, vol. 32, pp. 472–477.
Joyet, P. 1992. Comportement differe du materiau bois dans le plantransverse sous des conditions hydriques evolutives. L’Université BordeauxI. (Doctoral dissertation no. 812.) 132 p. + app. 31 p. (In French.)
Kangas, J. 1990. Sahatavaran kuivauksen laadun parantaminen.Virumiskokeiden raportti 1990. (Improvement of the quality of timberdrying. Report of creep experiments 1990). Unpublished report. VTTLaboratory of Structural Engineering. 35 p. + app. 16 p.

93
Kangas, J. & Ranta-Maunus, A. 1989. Havupuun viruminen syitä vastaankohtisuorissa suunnissa. (The creep of softwood in directions perpendicularto the grain.) Espoo: Technical Research Centre of Finland. 60 p. + app. 15p. (Technical Research Centre of Finland, Research Notes 969.) ISBN 951-38-3418-2
Koran, Z. 1979. Tensile properties of spruce under different conditions.Wood and Fiber, vol. 11, pp. 38–49
Kubler, H. 1973. Role of moisture in hygrothermal recovery of wood. WoodScience, vol. 5, no. 3, pp. 198–204.
Launay, J. 1987. Mesure des constantes élastiques d'un épicéa pargoniométrie ultrasonore. Rapport ESEM pour le CTBA, Contrat deprogramme M.R.E.S.
Mårtensson, A. 1994. Stress development in drying timber, a theoreticaldescription. In: Haslett, A. N. and Laytner, F. Proceedings of the 4thIUFRO Wood Drying Conference, Rotorua, New Zealand, 9–13 Aug. 1994.New Zealand Forest Research Institute. Pp. 173–180. ISBN 0-477-01730-4
Mårtensson, A. & Svensson, S. 1995. Stress–strain relationship of dryingwood. In: Svensson, S. Hygro-mechanical behaviour of drying wood. Lund:Lund Institute of Technology, Department of Structural Engineering.(Report TVBK-1010.) ISSN 0349-4969 (Article to be published also inJournal of Materials in Civil Engineering.)
Okuyama, T., Suzuki, S. & Terazawa S. 1977. Effect of temperature onorthotropic properties of wood. I. On the transverse anisotropy in bending.Mokuzai Gakkaishi, vol. 23, pp. 609–616. (In Japanese.)
Ranta-Maunus, A. 1992. Determination of drying stresses in wood whenshrinkage is prevented: Test method and modelling. In: Vanek, M. (Ed.)Proceedings of the 3rd IUFRO Conference on Wood Drying, Vienna,Austria, 18–21 Aug. 1992. International Union of Forestry ResearchOrganisations (IUFRO). Pp. 139–144. ISBN 3-900962-08-1
Ranta-Maunus, A. 1993. Rheological behaviour of wood in directionsperpendicular to the grain. Materials and Structures, vol. 26, pp. 362–369.
Ranta-Maunus, A., Forsén, H., Hanhijärvi, A., Hukka, A. & Partanen, J.1995. Sahatavaran kuivauksen simulointi (Simulation of sawn timberdrying). Espoo: VTT (Technical Research Centre of Finland). 62 p. + app.50 p. (VTT Julkaisuja 805.) ISBN 951-38-4514-1 (In Finnish.)
Salmén, L. 1984. Viscoelastic properties of in situ lignin under water-saturated conditions. Journal of Materials Science, vol. 19, pp. 3090–3096.

94
Salmén, N. L. & Fellers, C. 1982. The fundamentals of energy consumptionduring viscoelastic and plastic deformation of wood. Transactions of theTechnical Section, A Journal of Pulp and Paper Science, vol. 8, no. 4, pp.TR93–99.
Sawabe, O. 1974. Studies on the thermal softening of wood. III. Effects ofthe temperature on the bending creep of dry Hinoki wood. MokuzaiGakkaishi, vol. 20, no. 11, pp. 517–522.
Siimes, F. E. 1967. The effect of specific gravity, moisture content,temperature and heating time on the tension and compression strength andelasticity properties perpendicular to the grain of Finnish pine spruce andbirch wood and the significance of these factors on the checking of timberat kiln drying. Helsinki: The State Institute for Technical Research, Finland.(Publication 84.)
Svensson, S. 1994. Elementary tensile tests in a controlled climate. In:Haslett, A. N. and Laytner, F. Proceedings of the 4th IUFRO Wood DryingConference, Rotorua, New Zealand, 9–13 Aug. 1994. New Zealand ForestResearch Institute. Pp. 195–202. ISBN 0-477-01730-4
Svensson, S. 1995. Strain and shrinkage force in wood under kiln dryingconditions I. Measuring strain and shrinkage under controlled climateconditions. Equipment and preliminary results. Holzforschung, vol. 49, no.4, pp. 363–368.
Svensson, S. 1996. Strain and shrinkage force in wood under kiln dryingconditions II. Strain, shrinkage and stress measurements under controlledclimate conditions. Holzforschung, vol. 50, no. 5, pp. 463–469.
Viitaniemi, P. & Pennanen, J. 1993. Softening of wood with moisture andheat. In: Birkinshaw, C., Morlier, P. & Seoane, I. (Eds.) Proceedings of theCOST508 Wood Mechanics Workshop on Wood Plasticity and Damage,Limerick, Ireland. Commission of the European Communities. Pp. 155–162.
Wu, Q. & Milota, M. R. 1995. Rheological behavior of Douglas-firperpendicular to the grain at elevated temperatures. Wood and FiberScience, vol. 27, no. 3, pp. 285–295.

APPENDIX
C1
Appendices of this publication are not included in the PDF version.Please order the printed version to get the complete publication(http://www.inf.vtt.fi/pdf/publications/1998/)