Permex Petroleum Limited Partnership – Producing Oil and ... · Permex Petroleum Limited...
20
Siddharth Rajeev, B.Tech, MBA, CFA Analyst October 27, 2015 2015 Fundamental Research Corp. “10+ Years of Bringing Undiscovered Investment Opportunities to the Forefront “ www.researchfrc.com PLEASE READ THE IMPORTANT DISCLOSURES AT THE BACK OF THIS REPORT Permex Petroleum Limited Partnership – Producing Oil and Gas Projects in North America - Update Sector/Industry: Junior Oil and Gas www.energyresourcescorp.ca Issuer Permex Petroleum Limited Partnership Offering Memorandum Date 10-May-15 Securities Offered LP Units Offering No min / Max of $20M Unit Price $1,000 Minimum Subscription $10,000 Sales Commissions up to 8% Expected Return for Investors Preferred return of 8% p.a. + 50% of profits above the preferred return (monthly distributions) Auditor Smythe Ratcliffe LLP Management Fee + Performance Bonus GP Structure Expense Fee of 5% of gross proceeds (paid upfront) / Management Fee 0.5% of NAV (paid monthly) + 50% profit sharing above preferred return paid annually Legal Lawson Lundell LLP Offering Summary *all the figures in the report are in C$ unless otherwise specified FRC Rating Expected Return N/A Rating 3 Risk 4 *see back of report for rating definitions Highlights We initiated coverage on Permex Petroleum Limited Partnership (“Permex”, “LP”) on December 11, 2013. This update report highlights the key development since then. The LP’s strategy remains the same, which is to hold a medium risk portfolio of producing oil and gas projects, with potential for enhancement of production through development & optimization, and midstream facilities, such as natural gas pipelines. To date, according to management, the LP has raised $3.5 million by issuing 350 LP units. In 2015, the LP began acquiring several leases in North Central Texas, having combined production of approximately 41 boepd. They are also in the process of acquiring another project that is currently producing 30 bopd. Management of the LP is now focused on raising sufficient funds to acquire the Amwes project for US$5 million. The payment deadline is December 2015. Management indicates that they have a term payment plan in place to hold the project. The Amwes project covers over 30,600 acres of developed and undeveloped oil and gas leases in seven Kentucky counties, and one county in Tennessee. The project has 164 wells, of which, 112 are currently producing at approximately 120 boepd net (25% oil). In addition to production revenues, the project also has 48 miles of gathering systems, two compressor stations, and infrastructure/equipment in place such as drilling rigs, vehicles, tanks, tractors, etc. Through this infrastructure, the project generates revenues from third-parties for using its pipelines for gas transportation, and by providing services to third-party oil and gas companies. In May 2015, the LP completed a $0.50 million @ 8% p.a. secured debenture financing from a private investor. We are maintaining our overall rating of 3 and risk rating of 4.
Transcript of Permex Petroleum Limited Partnership – Producing Oil and ... · Permex Petroleum Limited...

Siddharth Rajeev, B.Tech, MBA, CFA Analyst
October 27, 2015
2015 Fundamental Research Corp. “10+ Years of Bringing Undiscovered Investment Opportunities to the Forefront “ www.researchfrc.com
PLEASE READ THE IMPORTANT DISCLOSURES AT THE BACK OF THIS REPORT
Permex Petroleum Limited Partnership – Producing Oil and Gas Projects in North America - Update
Sector/Industry: Junior Oil and Gas www.energyresourcescorp.ca
IssuerPermex Petroleum Limited
Partnership
Offering Memorandum Date 10-May-15
Securities Offered LP Units
Offering No min / Max of $20M
Unit Price $1,000
Minimum Subscription $10,000
Sales Commissions up to 8%
Expected Return for Investors
Preferred return of 8% p.a.
+ 50% of profits above the
preferred return (monthly
distributions)
Auditor Smythe Ratcliffe LLP
Management Fee + Performance Bonus
GP Structure Expense Fee
of 5% of gross proceeds
(paid upfront) /
Management Fee 0.5% of
NAV (paid monthly) +
50% profit sharing above
preferred return paid
annually
Legal Lawson Lundell LLP
Offering Summary
*all the figures in the report are in C$ unless otherwise specified
FRC Rating
Expected Return N/A
Rating 3
Risk 4
*see back of report for rating definitions
Highlights
� We initiated coverage on Permex Petroleum Limited Partnership (“Permex”, “LP”) on December 11, 2013. This update report highlights the key development since then.
� The LP’s strategy remains the same, which is to hold a medium risk portfolio of producing oil and gas projects, with potential for enhancement of production through development & optimization, and midstream facilities, such as natural gas pipelines.
� To date, according to management, the LP has raised $3.5 million by
issuing 350 LP units. � In 2015, the LP began acquiring several leases in North Central
Texas, having combined production of approximately 41 boepd. They are also in the process of acquiring another project that is currently producing 30 bopd.
� Management of the LP is now focused on raising sufficient funds to acquire the Amwes project for US$5 million. The payment deadline is December 2015. Management indicates that they have a term payment plan in place to hold the project.
� The Amwes project covers over 30,600 acres of developed and
undeveloped oil and gas leases in seven Kentucky counties, and one county in Tennessee. The project has 164 wells, of which, 112 are currently producing at approximately 120 boepd net (25% oil). In addition to production revenues, the project also has 48 miles of gathering systems, two compressor stations, and infrastructure/equipment in place such as drilling rigs, vehicles, tanks, tractors, etc. Through this infrastructure, the project generates revenues from third-parties for using its pipelines for gas transportation, and by providing services to third-party oil and gas companies.
� In May 2015, the LP completed a $0.50 million @ 8% p.a. secured debenture financing from a private investor.
� We are maintaining our overall rating of 3 and risk rating of 4.

Page 2
2015 Fundamental Research Corp. “10+ Years of Bringing Undiscovered Investment Opportunities to the Forefront “ www.researchfrc.com
PLEASE READ THE IMPORTANT DISCLOSURES AT THE BACK OF THIS REPORT
Overview
Permex Petroleum Limited Partnership was formed with the strategy to hold a medium risk portfolio of producing oil and gas projects with potential for production growth. At the time of our initiating report, the LP had signed option agreements to acquire two projects - the Amwes project in Kentucky and the Reef project in Ontario. Since then, management has terminated the option agreement to acquire the Reef project, which we believe was a prudent decision. We had mentioned in our initiating report that the Reef project, being highly capital intensive, would significantly increase the risk profile of the LP’s portfolio. The option agreement to acquire the Amwes project is still active. The acquisition price of the project is US$5 million. Management has been successful in extending the payment deadline to December 2015. If the LP is unable to raise sufficient capital for this acquisition by December 2015, management expects to acquire an interest in the project with available funds. To date, the LP has raised $3.5 million by issuing 350 LP units. Management believes if they are able to raise the maximum offering of $20 million, they will be able to assemble a portfolio of oil and gas projects with combined production of over 600 boepd. The LP is managed by Vancouver based private oil and gas company, N.A Energy Resources Corporation (“Manager”), which was formed in 2010. The manager also manages another fund, Kentucky Petroleum LP, which has oil projects in Kentucky and Tennessee. Kentucky Petroleum LP was formed in October 2010, and has raised $10 million to date. There has not been any significant change in the management team since our initiating report. Key members of the team are listed below:
� Mehran Ehsan - President, Chief Executive Officer, Treasurer and Director
� Barry Whelan, P.Geo - Chief Operating Officer, Director
� Wayne Needoba, Managing Director
� Dale Lee, Reservoir Advisor
� Aaron Triplett, Controller The General Partner of this LP is a wholly owned subsidiary of the Manager, and the Manager was wholly-owned by Mr. Mehran Ehsan at the time of the OM. Management has indicated that the Manager is currently owned by Mehran Ehsan, Barry Whelan and Wayne Needoba. Management uses various drillers and completion companies such as BB&D Well Services, United Well Services, Wingrove Well Services and Eagle Well Services, a subsidiary of Western Energy Services (TSX: WRG), for drilling and other field related services.

Page 3
2015 Fundamental Research Corp. “10+ Years of Bringing Undiscovered Investment Opportunities to the Forefront “ www.researchfrc.com
PLEASE READ THE IMPORTANT DISCLOSURES AT THE BACK OF THIS REPORT
Amwes,
Kentucky
Ownership: In September 2013, the General Partner of the LP entered into an option agreement to acquire a 100% WI (Net Revenue Interest – 87.50%), and all related assets (including pipelines, offices, and equipment) of the Amwes project for $5 million. The GP paid an option fee of $15k. The original option expired in March 2014. An extension clause allowed the GP to extend the deadline to November 2014 with a $10k payment. This deadline was subsequently extended to March 2015, and then to the current deadline of December 2015. The GP has so far paid $500,000 to the seller. In our discussions with management, it was indicated that the seller has been supportive and not seeking other potential buyers, because their intention is to keep this family run business local and keep all field staff in place, which the GP has agreed to do. Project Overview: The Amwes project, which has been in production since 2002, covers over 30,600 acres of developed and undeveloped oil and gas leases in seven Kentucky counties (Knox, Leslie, Bell, Harlan, Whitley, Laurel, and McCreary), and one Tennessee county (Claiborne). Chesapeake Energy (NYSE: CHK) holds significant acreage in the area. The project has 164 wells, 48 miles of gathering systems, two compressor stations, and infrastructure/equipment in place such as drilling rigs, vehicles, tanks, tractors, etc. The properties are located in Eastern Kentucky in the Appalachian Basin, and Utica Shale play. The maps below show the location of the projects:

Page 4
2015 Fundamental Research Corp. “10+ Years of Bringing Undiscovered Investment Opportunities to the Forefront “ www.researchfrc.com
PLEASE READ THE IMPORTANT DISCLOSURES AT THE BACK OF THIS REPORT
Rock formations in the Appalachian Basin range from Pennsylvanian to Pre-Cambrian. The surface topography consists of hilly, and mountainous terrain, with steep slopes and stream valleys. The primary prospective formations in the basin are listed below: The Knox formation, at depths of 3,400 – 3,600 ft, has been an oil producer with associated gas. Knox reservoirs are salt water driven. Knox has potentially two productive pay zones. Typical Knox wells produce for 20+ years at an average production of 20-30 boepd (20 bpd + 100 mcfpd).
Another prospective zone is the Mississippian age Big Lime formation, which has been producing oil and gas throughout eastern Kentucky. Two pay zones have been identified in this formation. A tertiary target is the Corniferous formation; this formation has been a large producer, most notably in the Big Sinking Oil field, which the US Geological Survey classifies as a giant oil field.
As per management, oil produced from the Amwes project is mostly light/sweet, with
wells averaging depths of 3,200 – 3,900 feet. Of the 164 wells, 112 are currently producing (52 wells shut-in) at approximately 120 boepd net (25% oil). The table below shows the production history of Amwes. Production dropped drastically in 2013 because the current operators were focused on expanding their transportation and operating revenues described below.

Page 5
2015 Fundamental Research Corp. “10+ Years of Bringing Undiscovered Investment Opportunities to the Forefront “ www.researchfrc.com
PLEASE READ THE IMPORTANT DISCLOSURES AT THE BACK OF THIS REPORT
AmWes Exploration, LLC and Affiliated
Companies2009 2010 2011 2012 2013
Net Production (boepd) 69 40 47 80 46
Oil 2,139 2,956 4,992 5,124 3,830
Gas 22,875 11,735 11,992 23,996 12,781
% Oil 9% 20% 29% 18% 23% According to management, some of the wells have been shut-in due to high gas association, and no oil. They were shut-in when gas prices dropped below US$2.50 / mcf. The other wells were shut in as they require further work to commercialize. Management estimates the total budget to bring 50 shut-in wells into production is approximately $2 million, or $40,000 per well, which we feel is reasonable. In addition to production revenues, the project also generates revenues through the following: � providing services to third-party oil and gas companies (through drilling rigs,
recompletion rigs, water trucks, etc owned by the project), termed as ‘Operating Fees’ in the table below.
� from third-parties for using its pipelines for gas transportation, termed as ‘Transportation Revenues’ in the table below. According to management, senior producers such as Chesapeake and Magnum Hunter Resources Corporation (NYSE: MHR) use the project’s pipelines.
The revenues from transportation and operating fees, in 2014, were about $784,000. The total capacity of the pipelines is approximately 870 boepd; the current usage is 280 boepd according to management. Therefore, the project has significant potential for generating additional revenues from its pipelines. All of the above mentioned information, relating to revenues and production history, were provided by Amwes to the LP’s management. Management will have to confirm the above mentioned figures prior to the acquisition.
Reserve and NAV Estimate: There is no independent technical evaluation done on the project. The following table presents management’s internal evaluations as of December 2014.

Page 6
2015 Fundamental Research Corp. “10+ Years of Bringing Undiscovered Investment Opportunities to the Forefront “ www.researchfrc.com
PLEASE READ THE IMPORTANT DISCLOSURES AT THE BACK OF THIS REPORT
Texas
Acquisitions
Reserves (boe) NPV @ 0% NPV @ 10% NPV @ 0% NPV @ 10%
Oil 62,000 $4.48 $2.42 $3.18 $1.72
Gas 412,167 $9.88 $5.17 $7.02 $3.67
$14.37 $7.59 $10.20 $5.39
Pipeline Revenue $24.30 $8.90 $17.26 $6.32
Operating Revenues $7.25 $2.66 $5.15 $1.89
Total $45.92 $19.14 $32.60 $13.59
US$, millions
Proved Producing (20 years of production)
Based on 20 years of production, management estimates 62,000 bbl of oil and 412,167 boe of gas as recoverable reserves. Their after-tax Net Present Value (“NPV”) @ 10%
estimate is $13.59 million, much higher than the $5 million acquisition price. Oil prices used in the analysis were US$60/ bbl in year 1, increasing to US$78 /bbl by year 10. Gas prices increase from US$3.30 / mcf in year 1, to US$4.31 / mcf in year 10.
Plans after takeover: Management’s plans to - a) bring 50 shut in wells into production (total budget of $2 million), b) develop new wells (targets are yet to be identified), c) increase pipeline contracts/revenues, and d) increase third party operating revenues Management also indicated to us that they have begun implementing a strategy to potentially divest all the wells, while keeping the pipelines and related infrastructure. In this scenario, the wells sold will need to pay the LP to transport the produced gas, implying additional revenues.
We have maintained our outlook on the project. We continue to believe this transaction
gives the LP an opportunity to take over a low to medium risk cash-flowing project,
with the potential for increased production through development, at a reasonable
valuation.
The following table summarizes the LP’s completed acquisitions in 2015.

Page 7
2015 Fundamental Research Corp. “10+ Years of Bringing Undiscovered Investment Opportunities to the Forefront “ www.researchfrc.com
PLEASE READ THE IMPORTANT DISCLOSURES AT THE BACK OF THIS REPORT
Project Location AcreageNo. of Producing
Wells
Working
Interest
Acquired
in
McAdams LeaseCallahan County,
West Texas 460 acres
1 producing well
(3 boepd)100% Apr-15
Leigh/Hamilton
Leases
Young County,
West Texas 168 acres
2 producing
wells (9 boepd)100% May-15
PittcockStonewall County,
Texas
4 producing
wells (10 boepd)100% Jun-15
Peavy / Rhodes /
Nash
Young County
and Jack County
Texas
520 acres approx. 18 boepd 100% Aug-15
� The McAdams lease, acquired in April 2015 for US$43k, has one producing well (3 boepd - 50% oil). The acquisition price reflects a multiple of US$14,333 per daily production. This well has been producing since 1998. The LP is evaluating the possibility of re-entering two PDNP (Proven Developed Non-Producing) wells located on the property for a total estimated cost of $70,000.
� The Leigh / Hamilton Leases, acquired in May 2015, have two producing wells (9 bopd - 100% oil). According to management, the acquisition price reflects a multiple of US$22,222 per daily production. As with the McAdams lease, management is evaluating the possibility of re-entering several suspended PDNP wells on the property for an estimated cost of $38,000 per well. The LP has acquired a 100% WI (85% NRI) in the Hamilton lease, and a 100% WI (81% NRI) in the Leigh lease.
� The Pittcock Lease currently produces 10 bopd (100% oil) from 4 wells. The lease is
located in Stonewall County, part of District 7B in the State of Texas in the Permian Basin. The lease has 5 PDNP wells, 1 SWD well and 1 WSW. Management is implementing a waterflood EOR (enhanced oil recovery) technique on the fields, expected to finish by January 2016. The last waterflood on this field was done in 1987, which increased production from 22 bopd to 241 bopd. According to management, the acquisition price reflects a valuation multiple of $36,000 per flowing barrel.
� The Peavy is currently producing 8 boepd (70% oil) from 3 wells. There are a total of 8
remaining PDNP, and 1 SWD wells on the lease. Management has identified a potential brand new zone in the wells at 1,650 feet, with a pay of 38 feet. According to management, the acquisition price reflects a valuation multiple of $37,500 per flowing barrel.

Page 8
2015 Fundamental Research Corp. “10+ Years of Bringing Undiscovered Investment Opportunities to the Forefront “ www.researchfrc.com
PLEASE READ THE IMPORTANT DISCLOSURES AT THE BACK OF THIS REPORT
Farmout
agreement with
Kentucky LP
Oil and Gas
Outlook
In June 2014, the LP entered into an agreement with Kentucky Petroleum, wherein Permex received the right to drill and develop a well (the D.House Well) on the House #1 Lease for US$50k. The lease is located in the Raccoon Mountain oil fields in Laurel County, Kentucky, and covers 125 acres. Kentucky Petroleum is a related issuer of the LP. As per the agreement, the LP also has the option to drill and complete another 10 wells on the lease for a total payment of USD$500,000. The lease will expire if Kentucky Petroleum does not place the D.House Well in production by April 2016. The LP drilled the D.House Well in July 2014, to a total depth of 4,194 feet, terminating in the Knox formation. The well is currently suspended as they evaluate cost-effective gas pipelines in the area to bring the well on stream. We believe the recent oil price drop is associated with three factors – a strong US$, the buildup of oil inventory over the past year, and OPEC’s (Organization of the Petroleum Exporting Countries) decision to not cut production / supply. Historically, OPEC has reduced supply to keep prices from dropping too low. However, they were reluctant to do so this time primarily due to the emergence of U.S. shale oil production in the past few years (see chart below).
OPEC countries are highly reliant on oil revenues. The following chart shows how much oil contributes to their Gross Domestic Product (GDP). More than 50% of the GDP of Kuwait and Libya comes from oil. Oil accounts for more than 40% of Saudi Arabia’s GDP. Despite their high reliance, the main reason why we believe OPEC has decided not to cut supply is to maintain their global market share, so that they can continue to dominate the oil industry.

Page 9
2015 Fundamental Research Corp. “10+ Years of Bringing Undiscovered Investment Opportunities to the Forefront “ www.researchfrc.com
PLEASE READ THE IMPORTANT DISCLOSURES AT THE BACK OF THIS REPORT
Source: CNBC / World Bank
The following chart shows that production costs are much higher in regions outside the Middle East.

Page 10
2015 Fundamental Research Corp. “10+ Years of Bringing Undiscovered Investment Opportunities to the Forefront “ www.researchfrc.com
PLEASE READ THE IMPORTANT DISCLOSURES AT THE BACK OF THIS REPORT
If oil is not above US$50 – US$60 per barrel, we estimate a significant portion of U.S. shale development production/development will need to be suspended. Since shale oil production accounts for almost 50% of U.S. production (3 - 4 million barrels a day), we may see a major decline in oil production if oil prices remains low. We believe that if the price of oil is not above US$60 – US$70 per barrel, a significant portion of global production/development will be suspended. Exploration and development spending will drop drastically. At the same time, as per the Energy Information Administration, the global demand for oil is expected to grow at 1.1% p.a. We also believe that OPEC may be prompted to reduce their supply as we estimate that if they cut supply, the upside from oil prices will more than offset the decline in production, resulting in stronger revenues for its members. The consensus oil and gas price forecasts through 2025 are shown below:
Oil (WTI Cushing Oklahoma)
Source: GLJ and Sproule
Based on consensus forecasts, WTI price is expected to increase from US$52.5/bbl in 2016, to US$89.5/bbl by 2025.

Page 11
2015 Fundamental Research Corp. “10+ Years of Bringing Undiscovered Investment Opportunities to the Forefront “ www.researchfrc.com
PLEASE READ THE IMPORTANT DISCLOSURES AT THE BACK OF THIS REPORT
Deal Structure
Natural Gas (Henry Hub - US$/mmbtu)
Source: GLJ and Sproule
Based on consensus forecasts, the henry hub spot price is expected to increase from US$3.05/mmbtu in 2016, to US$5.00/bbl by 2025.
The following chart shows the structure of the offering:

Page 12
2015 Fundamental Research Corp. “10+ Years of Bringing Undiscovered Investment Opportunities to the Forefront “ www.researchfrc.com
PLEASE READ THE IMPORTANT DISCLOSURES AT THE BACK OF THIS REPORT
The assets will be held in the Permex Petroleum Limited Partnership. The partnership will be managed by the general partner – Permex Petroleum Operating Ltd., who will assume full responsibility for the day-to-day management of the projects, and has unlimited liability. At the time of the OM, the general partner was wholly-owned subsidiary of N.A Energy Resources Corp., which was wholly owned by Mehran Ehsan. Management has indicated to us that N.A Energy Resources Corp. is now wholly owned by Mehran Ehsan, Barry Whelan and Wayne Needoba. Investors can also purchase shares of N.A. Energy Resources Investment Corp. (“ERIC”). ERIC uses the funds from investors to purchase LP units of Permex Petroleum LP. An investment in ERIC may be eligible for registered plans. Cash Distributions - Depending on the availability of cash, management expects to pay out monthly cash distributions to investors at a preferred return of 8% p.a. All amounts above the 8% p.a. mark are split between investors and the general partner on a 50:50 basis. Preferred returns will be paid until the end of the seventh year, or until investors receive 100% of their capital, whichever comes earlier (then 50/50).
The following table shows the gross and net proceeds:
Source of Funds
Amount to be raised by this Offering $20,000,000
Selling commissions and fees -$1,600,000
Estimated Offering costs (e.g. legal, accounting, audit) -$1,000,000
Available funds $17,400,000
Use of Funds
Purchase of Oil and Gas Properties $10,245,072
Amwes Option Agreement $6,059,500
Fees payable for extension of the Amwes Option Agreement $145,428
Location payment in connection with the Farm-Out Agreement $50,000
Option to develop 10 additional locations in connection with the
Farm-Out Agreement$500,000
Working Capital $400,000
Total $17,400,000

Page 13
2015 Fundamental Research Corp. “10+ Years of Bringing Undiscovered Investment Opportunities to the Forefront “ www.researchfrc.com
PLEASE READ THE IMPORTANT DISCLOSURES AT THE BACK OF THIS REPORT
Financial
Statements
Sales fees – up to 8% of the gross proceeds.
Management Fee / Performance Bonus: Management receives the following fees:
• Upfront fee of 5% of the gross proceeds raised. As per the OM, these funds will be used to cover legal, accounting and annual audits, and meet ongoing G&A expenses.
• Management receives 0.5% of the fair market value (Net Asset Value) of the assets under management, paid monthly. The fair market value will be determined by the GP every year. This fee will only be paid once the LP is cash flow positive.
• Management will also receive a 50% share of any amount above the 8% preferred return.
Redemption: Redemptions are not allowed in the first year. Redemptions between year one and two will have 15% taken off the fair value of the units. Redemptions between year two and three will have 10% taken off the fair value. Also, the LP has no obligation to redeem more than 5% of the total units in a year. The LP has listed its units on the TSX Private Markets, which may increase investors’ options to liquidate their investment. Secured Debenture Financing: In May 2015, the LP issued secured debentures to a private investor (undisclosed party) for $500,000. The debentures have an interest rate of 8% compounded annually, and are repayable on May 1, 2017. The LP may repay the amount any time prior to the maturity date without penalty. However, the lender may demand earlier repayment on or after May 1, 2016, on not less than 30 days notice. The investor also receives a security interest in the oil and gas properties acquired using the funds, and an annual royalty fee of 3% of the production revenues from those properties.
As shown below, the LP reported a net loss of $27k in 2013, $236k in 2014, and $45k in Q1-2015.

Page 14
2015 Fundamental Research Corp. “10+ Years of Bringing Undiscovered Investment Opportunities to the Forefront “ www.researchfrc.com
PLEASE READ THE IMPORTANT DISCLOSURES AT THE BACK OF THIS REPORT
The LP’s cash flow statements are shown below. As shown, the LP raised net proceeds from issuing LP units of $13k in 2013, $543k in 2014, and $56k in Q1-2015. The LP spent $336k (capex) in 2014.

Page 15
2015 Fundamental Research Corp. “10+ Years of Bringing Undiscovered Investment Opportunities to the Forefront “ www.researchfrc.com
PLEASE READ THE IMPORTANT DISCLOSURES AT THE BACK OF THIS REPORT
At the end of Q1-2015, the LP had $18k in cash. The total capital raised from investors was $699,000 as of the end of Q1. The LP also had $47k in related party debt.

Page 16
2015 Fundamental Research Corp. “10+ Years of Bringing Undiscovered Investment Opportunities to the Forefront “ www.researchfrc.com
PLEASE READ THE IMPORTANT DISCLOSURES AT THE BACK OF THIS REPORT
Financial
Analysis and
Projections
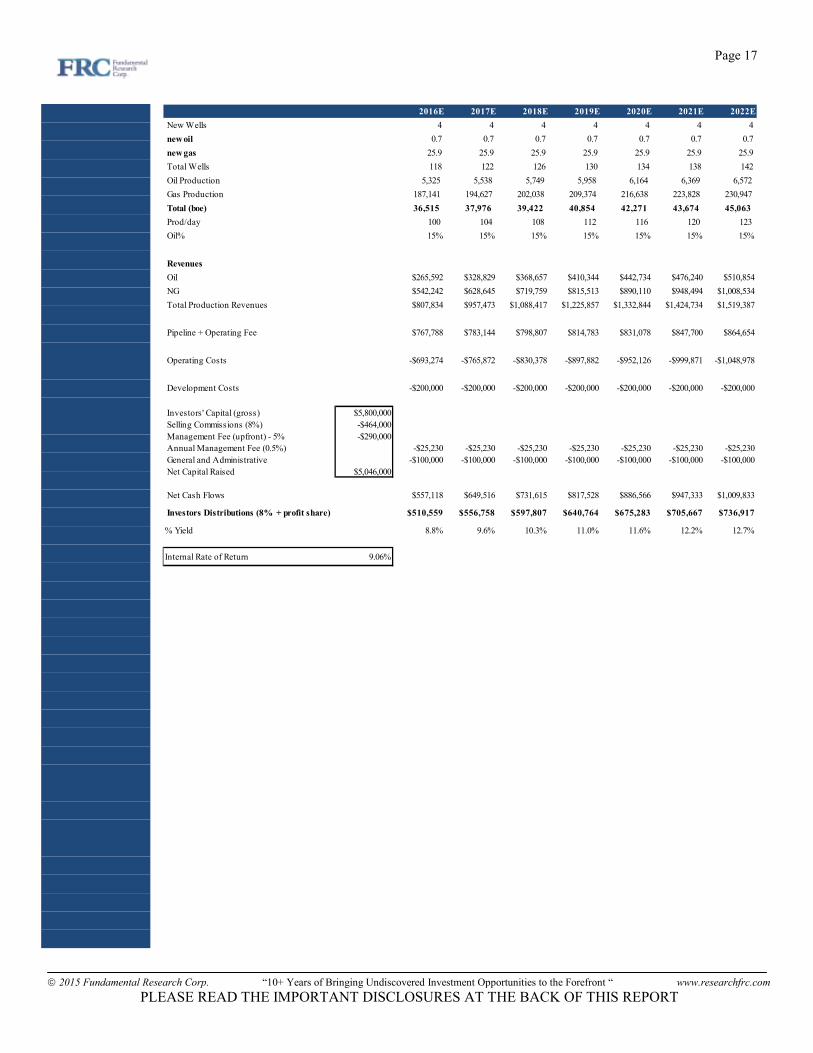
Subsequent to the quarter end, according to management, the LP raised $2,810,000 by issuing 2,810 units. The LP currently has 3,510 units outstanding for total invested capital of $3,510,000. Our financial projections are based on the assumption that the LP acquires Amwes. Except for the revised commodity prices (discussed above), we have maintained most of the significant inputs. The following assumptions were used in our projections:
� four wells per year of Amwes are put back into production; � cost per well - $50k; � the percentage of oil production is maintained at 15% of total production; � for conservatism, we have not assumed any new wells; � operating cost of 44% of revenues (historical average); � pipeline + operating fee increases at 2% p.a.; � 15 year production life � cash flow projections are in US$
The expected Internal Rate of Return (IRR) for investors (just from Amwes) is 9.06%. The following tables show our cash flow projections.
Page 17
2015 Fundamental Research Corp. “10+ Years of Bringing Undiscovered Investment Opportunities to the Forefront “ www.researchfrc.com
PLEASE READ THE IMPORTANT DISCLOSURES AT THE BACK OF THIS REPORT
2016E 2017E 2018E 2019E 2020E 2021E 2022E
New Wells 4 4 4 4 4 4 4
new oil 0.7 0.7 0.7 0.7 0.7 0.7 0.7
new gas 25.9 25.9 25.9 25.9 25.9 25.9 25.9
Total Wells 118 122 126 130 134 138 142
Oil Production 5,325 5,538 5,749 5,958 6,164 6,369 6,572
Gas Production 187,141 194,627 202,038 209,374 216,638 223,828 230,947
Total (boe) 36,515 37,976 39,422 40,854 42,271 43,674 45,063
Prod/day 100 104 108 112 116 120 123
Oil% 15% 15% 15% 15% 15% 15% 15%
Revenues
Oil $265,592 $328,829 $368,657 $410,344 $442,734 $476,240 $510,854
NG $542,242 $628,645 $719,759 $815,513 $890,110 $948,494 $1,008,534
Total Production Revenues $807,834 $957,473 $1,088,417 $1,225,857 $1,332,844 $1,424,734 $1,519,387
Pipeline + Operating Fee $767,788 $783,144 $798,807 $814,783 $831,078 $847,700 $864,654
Operating Costs -$693,274 -$765,872 -$830,378 -$897,882 -$952,126 -$999,871 -$1,048,978
Development Costs -$200,000 -$200,000 -$200,000 -$200,000 -$200,000 -$200,000 -$200,000
Investors' Capital (gross) $5,800,000
Selling Commissions (8%) -$464,000
Management Fee (upfront) - 5% -$290,000
Annual Management Fee (0.5%) -$25,230 -$25,230 -$25,230 -$25,230 -$25,230 -$25,230 -$25,230
General and Administrative -$100,000 -$100,000 -$100,000 -$100,000 -$100,000 -$100,000 -$100,000
Net Capital Raised $5,046,000
Net Cash Flows $557,118 $649,516 $731,615 $817,528 $886,566 $947,333 $1,009,833
Investors Distributions (8% + profit share) $510,559 $556,758 $597,807 $640,764 $675,283 $705,667 $736,917
% Yield 8.8% 9.6% 10.3% 11.0% 11.6% 12.2% 12.7%
Internal Rate of Return 9.06%

Page 18
2015 Fundamental Research Corp. “10+ Years of Bringing Undiscovered Investment Opportunities to the Forefront “ www.researchfrc.com
PLEASE READ THE IMPORTANT DISCLOSURES AT THE BACK OF THIS REPORT
2023E 2024E 2025E 2026E 2027E 2028E 2029E 2030E
New Wells 4 4 3 - - - -
new oil 0.7 0.7 0.6 - - - - -
new gas 25.9 25.9 19.4 - - - - -
Total Wells 146 150 153 153 153 153 153 153
Oil Production 6,772 6,971 7,101 7,030 6,959 6,890 6,821 6,753
Gas Production 237,995 244,972 249,540 247,045 244,574 242,128 239,707 237,310
Total (boe) 46,438 47,799 48,691 48,204 47,722 47,245 46,772 46,304
Prod/day 127 131 133 132 131 129 128 127
Oil% 15% 15% 15% 15% 15% 15% 15% 15%
Revenues
Oil $546,563 $582,134 $607,814 $616,779 $625,877 $635,109 $644,476 $653,982
NG $1,070,218 $1,142,843 $1,193,258 $1,210,859 $1,228,719 $1,246,842 $1,265,233 $1,283,896
Total Production Revenues $1,616,781 $1,724,977 $1,801,072 $1,827,638 $1,854,596 $1,881,951 $1,909,710 $1,937,878
Pipeline + Operating Fee $881,947 $899,586 $917,578 $935,929 $954,648 $973,741 $993,216 $1,013,080
Operating Costs -$1,099,440 -$1,154,808 -$1,196,206 -$1,215,970 -$1,236,067 -$1,256,504 -$1,277,287 -$1,298,421
Development Costs -$200,000 -$200,000 -$150,000 $0 $0 $0 $0 $0
Investors' Capital (gross)
Selling Commissions (8%)
Management Fee (upfront) - 5%
Annual Management Fee (0.5%) -$25,230 -$25,230 -$25,230 -$25,230 -$25,230 -$25,230 -$25,230 -$25,230
General and Administrative -$100,000 -$100,000 -$100,000 -$100,000 -$100,000 -$100,000 -$100,000 -$100,000
Net Capital Raised
Net Cash Flows $1,074,058 $1,144,525 $1,247,214 $1,422,368 $1,447,946 $1,473,957 $1,500,408 $1,527,306
Investors Distributions (8% + profit share) $769,029 $804,263 $855,607 $943,184 $955,973 $968,979 $982,204 $995,653
% Yield 13.3% 13.9% 14.8% 16.3% 16.5% 16.7% 16.9% 17.2% The sensitivity of the IRR to commodity prices is shown below:
9.1% -30% -20% -10% 0% 10% 20% 30%
-30% 6.46% 6.77% 7.09% 7.39% 7.68% 7.97% 8.25%
-20% 7.08% 7.39% 7.68% 7.96% 8.24% 8.52% 8.80%
-10% 7.67% 7.95% 8.24% 8.51% 8.79% 9.06% 9.33%
0% 8.23% 8.51% 8.78% 9.06% 9.33% 9.59% 9.86%
10% 8.77% 9.05% 9.32% 9.59% 9.85% 10.11% 10.37%
20% 9.31% 9.58% 9.84% 10.11% 10.37% 10.62% 10.88%
30% 9.84% 10.10% 10.36% 10.62% 10.87% 11.12% 11.38%
Oil Prices
� 0% indicates our base-case assumptions � 10% indicates a 10% change in our base-case assumptions

Page 19
2015 Fundamental Research Corp. “10+ Years of Bringing Undiscovered Investment Opportunities to the Forefront “ www.researchfrc.com
PLEASE READ THE IMPORTANT DISCLOSURES AT THE BACK OF THIS REPORT
Risks
Rating
The following are the key risks associated with this offering:
• Revenues and profitability of the company depend heavily on future oil and natural gas prices.
• The strength of the portfolio will depend heavily on the ability to acquire and develop attractive projects.
• Production and development risks.
• The LP has yet to complete the Amwes acquisition.
• Our cash flow projections are highly sensitive to our production assumptions.
• The LP has to significantly increase production from current levels in order to realize the true potential of the identified projects.
• There is no independent reserve report on the Amwes project.
• As the LP intends to hold projects in the U.S., investors will be exposed to exchange rate risks. The currently weak C$ makes acquisitions in the US more expensive. Annual yields for investors will be impacted if the C$ strengthens over time.
• Redemption options are limited. However, the LP has recently listed their units on the TSX Private Markets.
We are maintaining our overall rating of 3, with a risk rating of 4, with the assumption that management will be able to follow through with the Amwes acquisition.
FRC Rating
Expected Return N/A
Rating 3
Risk 4

Page 20
2015 Fundamental Research Corp. “10+ Years of Bringing Undiscovered Investment Opportunities to the Forefront “ www.researchfrc.com
PLEASE READ THE IMPORTANT DISCLOSURES AT THE BACK OF THIS REPORT
Fundamental Research Corp. Rating Scale:
Rating – 1: Excellent Return to Risk Ratio Rating – 2: Very Good Return to Risk Ratio Rating – 3: Good Return to Risk Ratio Rating – 4: Average Return to Risk Ratio Rating – 5: Weak Return to Risk Ratio Rating – 6: Very Weak Return to Risk Ratio
Rating – 7: Poor Return to Risk Ratio A “+” indicates the rating is in the top third of the category, A “-“ indicates the lower third and no “+” or “-“ indicates the middle third of the category.
Fundamental Research Corp. Risk Rating Scale:
1 (Low Risk) 2 (Below Average Risk) 3 (Average Risk) 4 (Speculative) 5 (Highly Speculative)
Rating - 1 0% Risk - 1 0%
Rating - 2 24% Risk - 2 3%
Rating - 3 48% Risk - 3 31%
Rating - 4 10% Risk - 4 42%
Rating - 5 5% Risk - 5 10%
Rating - 6 1% Suspended 13%
Rating - 7 0%
Suspended 12%
FRC Distribution of Ratings
Disclaimers and Disclosure
The opinions expressed in this report are the true opinions of the analyst about this company and industry. Any “forward looking statements” are our best estimates and opinions based upon information that was provided and that we believe to be correct, but we have not independently verified with respect to truth or correctness. There is no guarantee that our forecasts will materialize. Actual results will likely vary. The analyst and Fundamental Research Corp. “FRC” does not own any shares of the subject company, does not make a market or offer shares for sale of the subject company, and does not have any investment banking business with the subject company. Fees have been paid by the issuer to FRC to issue this report. The purpose of the fee is to subsidize the high costs of research and monitoring. FRC takes steps to ensure independence including setting fees in advance and utilizing analysts who must abide by CFA Institute Code of Ethics and Standards of Professional Conduct. Additionally, analysts may not trade in any security under coverage. Our full editorial control of all research, timing of release of the
reports, and release of liability for negative reports are protected contractually. Distribution procedure: our reports are distributed first to our web-based subscribers on the date shown on this report then made available to delayed access users through various other channels for a limited time. To subscribe for real-time access to research, visit http://www.researchfrc.com/subscription.htm for subscription options. This report contains "forward looking" statements. Forward-looking statements regarding the Company and/or stock’s performance inherently involve risks and uncertainties that could cause actual results to differ from such forward-looking statements. Factors that would cause or contribute to such differences include, but are not limited to, continued acceptance of the Company's products/services in the marketplace; acceptance in the marketplace of the Company's new product lines/services; competitive factors; new product/service introductions by others; technological changes; dependence on suppliers; systematic market risks and other risks discussed in the Company's periodic report filings, including interim reports, annual reports, and annual information forms filed with the various securities regulators. By making these forward looking statements, Fundamental Research Corp. and the analyst/author of this report undertakes no obligation to update these statements for revisions or changes after the date of this report. A report initiating coverage will most often be updated quarterly while a report issuing a rating may have no further or less frequent updates because the subject company is likely to be in earlier stages where nothing material may occur quarter to quarter. Fundamental Research Corp DOES NOT MAKE ANY WARRANTIES, EXPRESSED OR IMPLIED, AS TO RESULTS TO BE OBTAINED FROM USING THIS INFORMATION AND
MAKES NO EXPRESS OR IMPLIED WARRANTIES OR FITNESS FOR A PARTICULAR USE. ANYONE USING THIS REPORT ASSUMES FULL RESPONSIBILITY FOR WHATEVER RESULTS THEY OBTAIN FROM WHATEVER USE THE INFORMATION WAS PUT TO. ALWAYS TALK TO YOUR FINANCIAL ADVISOR BEFORE YOU INVEST. WHETHER A STOCK SHOULD BE INCLUDED IN A PORTFOLIO DEPENDS ON ONE’S RISK TOLERANCE, OBJECTIVES, SITUATION, RETURN ON OTHER ASSETS, ETC. ONLY YOUR INVESTMENT ADVISOR WHO KNOWS YOUR UNIQUE CIRCUMSTANCES CAN MAKE A PROPER RECOMMENDATION AS TO THE MERIT OF ANY PARTICULAR SECURITY FOR INCLUSION IN YOUR PORTFOLIO. This REPORT is solely for informative purposes and is not a solicitation or an offer to buy or sell any security. It is not intended as being a complete description of the company, industry, securities or developments referred to in the material. Any forecasts contained in this report were independently prepared unless otherwise stated, and HAVE NOT BEEN endorsed by the Management of the company which is the subject of this report. Additional information is available upon request. THIS REPORT IS COPYRIGHT. YOU MAY NOT REDISTRIBUTE THIS REPORT WITHOUT OUR PERMISSION. Please give proper credit, including citing Fundamental Research Corp and/or the analyst, when quoting information from this report. The information contained in this report is intended to be viewed only in jurisdictions where it may be legally viewed and is not intended for use by any person or entity in any jurisdiction where such use would be contrary to local regulations or which would require any registration requirement within such jurisdiction