peripheral lung cancer and pulmonary inammatory Using CT ...
14
Page 1/14 Using CT texture analysis to differentiate between peripheral lung cancer and pulmonary inammatory pseudotumor Chenlu Liu University of South China Changsheng Ma Shandong Tumor Hospital and Institute Jinghao Duan Shandong Tumor Hospital and Institute Qingtao Qiu Shandong Tumor Hospital and Institute Yanluan Guo Shandong Tumor Hospital and Institute Zhenhua Zhang University of South China Yong Yin ( [email protected] ) Department of Radiotherapy, Shandong Cancer Hospital and Institute, Shandong First Medical University and Shandong Academy of Medical Sciences, Jinan 250117, Shandong Province, China Research article Keywords: radiomics features, peripheral lung cancer, PET/CT, pulmonary inammatory pseudotumor Posted Date: March 31st, 2020 DOI: https://doi.org/10.21203/rs.3.rs-20139/v1 License: This work is licensed under a Creative Commons Attribution 4.0 International License. Read Full License Version of Record: A version of this preprint was published on July 6th, 2020. See the published version at https://doi.org/10.1186/s12880-020-00475-2.
Transcript of peripheral lung cancer and pulmonary inammatory Using CT ...

Page 1/14
Using CT texture analysis to differentiate betweenperipheral lung cancer and pulmonary in�ammatorypseudotumorChenlu Liu
University of South ChinaChangsheng Ma
Shandong Tumor Hospital and InstituteJinghao Duan
Shandong Tumor Hospital and InstituteQingtao Qiu
Shandong Tumor Hospital and InstituteYanluan Guo
Shandong Tumor Hospital and InstituteZhenhua Zhang
University of South ChinaYong Yin ( [email protected] )
Department of Radiotherapy, Shandong Cancer Hospital and Institute, Shandong First MedicalUniversity and Shandong Academy of Medical Sciences, Jinan 250117, Shandong Province, China
Research article
Keywords: radiomics features, peripheral lung cancer, PET/CT, pulmonary in�ammatory pseudotumor
Posted Date: March 31st, 2020
DOI: https://doi.org/10.21203/rs.3.rs-20139/v1
License: This work is licensed under a Creative Commons Attribution 4.0 International License. Read Full License
Version of Record: A version of this preprint was published on July 6th, 2020. See the published versionat https://doi.org/10.1186/s12880-020-00475-2.

Page 2/14
AbstractBackground: Pulmonary in�ammatory pseudotumor (PIPT) usually presents as solitary peripheral well-de�ned nodules or masses, and CT features are complex and changeable, which are often confused withperipheral lung cancer. This study is to distinguish peripheral lung cancer and PIPT using CT-radiomicsfeatures extracted from PET/CT images.
Methods: In this study, the standard 18F-�uorodeoxyglucose positron emission tomography/ computedtomography (18 F-FDG PET/CT) images of 21 patients with pulmonary in�ammatory pseudotumor(PIPT) and 21 patients with peripheral lung cancer were retrospectively collected. The dataset was usedto extract CT-radiomics features from regions of interest (ROI), Using, then, statistical methods to screenCT-radiomics features, which could distinguish peripheral lung cancer and PIPT. And the ability ofradiomics features distinguished peripheral lung cancer and PIPT was estimated by receiver operatingcharacteristic (ROC) curves, and compared by Delong test.
Results: A total of 435 radiomics features were extracted, of which 23 could difference betweenperipheral lung cancer and PIPT. these features were seen in 16 of 330 Gray-Level Co-occurrence Matrixfeatures, 1 of 49 Intensity Histogram features, 1 of 5 Neighbor Intensity Difference features, 5 of 18Shape features. area under the curve (AUC) of these features were 0.731 0.075, 0.717, 0.737, 0.748 0.038,respectively. The P values of statistical differences among ROC were 0.0499 (F11, F23), 0.0472 (F12,F13) and 0.0250 (F13, Mean4). The discrimination ability of forming new features(Parent Feature) afteraveraging the features extracted at different angles and distances was moderate compared to theprevious features(Child features).
Conclusions: Radiomics features extracted from non-contrast CT based on PET/CT images can helpdistinguish peripheral lung cancer and PIPT.
BackgroundLung cancer is the world's leading cause of cancer-related deaths and a highly malignant tumor[1, 2],According to the location of the tumor, lung cancer can be divided into peripheral lung cancer and centrallung cancer, and more than 70% of all lung cancers are peripheral lung cancer[3]. lung cancer can bedivided into adenocarcinoma, squamous cell carcinoma, small cell lung cancer and large cell lung cancerdepending on the histological and cytological types of tumors. In recent years, with the improvement ofthe level of cancer diagnosis and treatment[4], the mortality rate of lung cancer has been on a downwardtrend, but lung cancer is still the leading cause of death[5]. About 70% of the patients with lung cancer arein the advanced stage at the time of initial diagnosis[6], and even some patients have already hadmetastasis, and if patients with lung cancer can be accurately diagnosed and undergo early surgery, the10-year survival rate can reach 88%[7]. thus, the early diagnosis and timely treatment of patients withlung cancer are very important [8].
Page 3/14
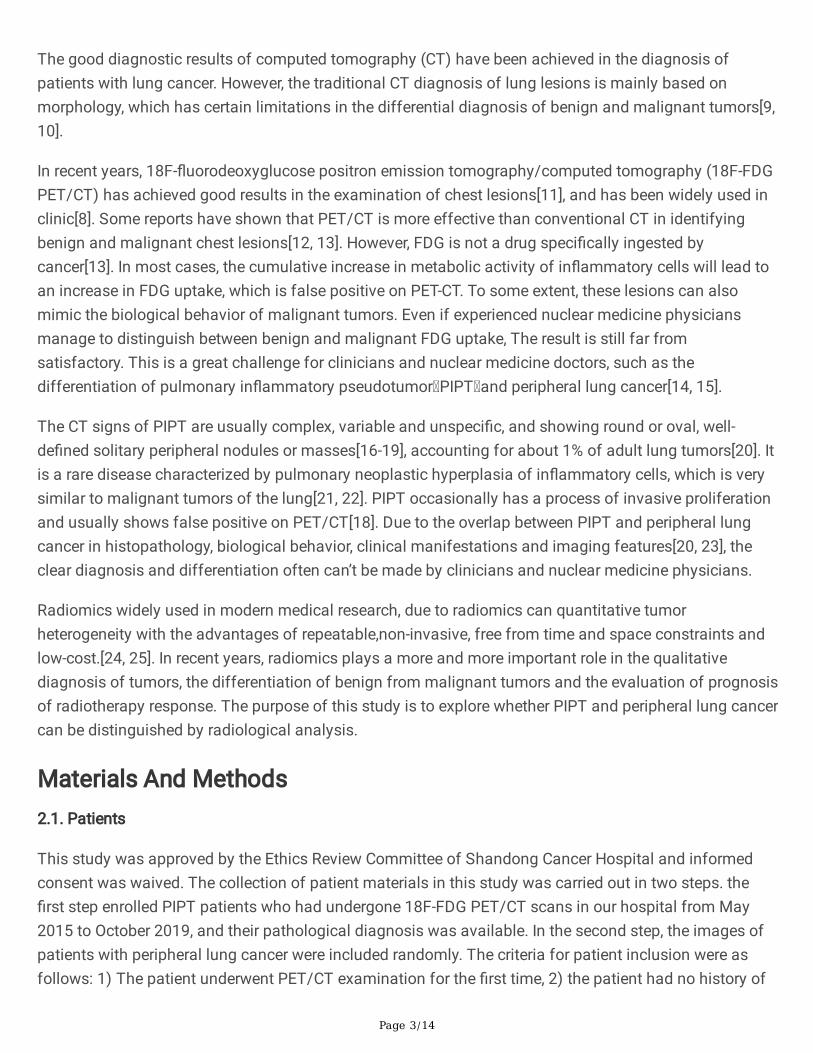
The good diagnostic results of computed tomography (CT) have been achieved in the diagnosis ofpatients with lung cancer. However, the traditional CT diagnosis of lung lesions is mainly based onmorphology, which has certain limitations in the differential diagnosis of benign and malignant tumors[9,10].
In recent years, 18F-�uorodeoxyglucose positron emission tomography/computed tomography (18F-FDGPET/CT) has achieved good results in the examination of chest lesions[11], and has been widely used inclinic[8]. Some reports have shown that PET/CT is more effective than conventional CT in identifyingbenign and malignant chest lesions[12, 13]. However, FDG is not a drug speci�cally ingested bycancer[13]. In most cases, the cumulative increase in metabolic activity of in�ammatory cells will lead toan increase in FDG uptake, which is false positive on PET-CT. To some extent, these lesions can alsomimic the biological behavior of malignant tumors. Even if experienced nuclear medicine physiciansmanage to distinguish between benign and malignant FDG uptake, The result is still far fromsatisfactory. This is a great challenge for clinicians and nuclear medicine doctors, such as thedifferentiation of pulmonary in�ammatory pseudotumor PIPT and peripheral lung cancer[14, 15].
The CT signs of PIPT are usually complex, variable and unspeci�c, and showing round or oval, well-de�ned solitary peripheral nodules or masses[16-19], accounting for about 1% of adult lung tumors[20]. Itis a rare disease characterized by pulmonary neoplastic hyperplasia of in�ammatory cells, which is verysimilar to malignant tumors of the lung[21, 22]. PIPT occasionally has a process of invasive proliferationand usually shows false positive on PET/CT[18]. Due to the overlap between PIPT and peripheral lungcancer in histopathology, biological behavior, clinical manifestations and imaging features[20, 23], theclear diagnosis and differentiation often can’t be made by clinicians and nuclear medicine physicians.
Radiomics widely used in modern medical research, due to radiomics can quantitative tumorheterogeneity with the advantages of repeatable,non-invasive, free from time and space constraints andlow-cost.[24, 25]. In recent years, radiomics plays a more and more important role in the qualitativediagnosis of tumors, the differentiation of benign from malignant tumors and the evaluation of prognosisof radiotherapy response. The purpose of this study is to explore whether PIPT and peripheral lung cancercan be distinguished by radiological analysis.
Materials And Methods2.1. Patients
This study was approved by the Ethics Review Committee of Shandong Cancer Hospital and informedconsent was waived. The collection of patient materials in this study was carried out in two steps. the�rst step enrolled PIPT patients who had undergone 18F-FDG PET/CT scans in our hospital from May2015 to October 2019, and their pathological diagnosis was available. In the second step, the images ofpatients with peripheral lung cancer were included randomly. The criteria for patient inclusion were asfollows: 1) The patient underwent PET/CT examination for the �rst time, 2) the patient had no history of

Page 4/14
diabetes, 3) the maximum diameter of the lesion was not less than 1.5 cm, 4) the patient had completeclinical materials and pathological reports, 5) standardized uptake value of lesions 2.5.
2.2. Patient images acquisition
The 18F-FDG PET/CT images of all patients were obtained by the same hybrid PEC/CT scanner (PhilipsHealthcare, Cleveland, OH). The patient fasted for more than 6 hours, and blood glucose level of patientwas normal before the scan. PET/CT scans were completed 60 minutes after intravenous injection of18F-FDG at 4.4 MBq/kg. After attenuation correction and iterative reconstruction, the PET image is usedfor multi-plane and multi-image imaging, and the image is fused with the CT image. The initial CT imageacquisition was conducted with slice thickness 2 mm (120KVp, 206 mA), and reconstructed to a 512 ×512 matrix (voxels size, 1.17 × 1.17 × 5mm3). Then, the obtained image data can be viewed in coronal,sagittal and axial planes using image workstation.
2.3. Region of interests (ROI) segmentation
The total process of image segmentation was completed by three experienced doctors. First, all theimage data were imported into the MIM software (Cleveland, OH), and the total process of imagesegmentation was completed by three experienced radiologist. ROI was manually delineated by aradiologist with 15 years of experience on the MIM software and supervised by another nuclear medicinephysician with 20 years of experience, a clinical chest doctor with 20 years of experience to examine andcorrect all the delineated images, While the three senior doctors were working, they were unable to accessall patient-related medical information.
2.4. Extraction of radiomics features
All radiomics feature were automatically using imaging Biomarker Explorer (IBEX) software(MDAnderson Cancer Center, TX, USA), which is an open infrastructure software platform that �exiblysupports common radiomics work�ow tasks such as multimodality image data import and review,development of feature extraction algorithms, model validation, and consistent data sharing amongmultiple institutions[26]. In addition, we named the features with different names under the same matrixas parent features, and the features with the same name extracted from different angles and differentdistances as child features, in other words, we did not average the feature values of the same name fromthe same matrix extracted from different angles and distances.
2.5. Statistical analysis
The Mann-Whitney U test[27] was performed to analyze the differences between PIPT and peripheral lungcancer, this process of statistical analysis was implemented on Matlab (version 2014b,www.mathworks.com). Radiomics features that can distinguish between peripheral lung cancer and PIPTwere obtained using logistic regression analysis on Medcalc (version 18.2.1, http://www.medcalc.org).The diagnostic performance of radiomics feature was illustrated by the receiver operating characteristic
Page 5/14
curve (ROC) with indices of area under the curve (AUC), sensitivity and speci�city, and compared byDelong test. The criterion value distinguished peripheral lung cancer and PIPT was determined by themaximum of the Youden index[28] (calculating the sum of speci�city and sensitivity at all possiblethresholds, then subtracting one), P-value <0.05 was considered statistically signi�cant. In addition, weaverage the feature values of the same name extracted from different angles and distances as newfeatures and observe their diagnostic capabilities.
Results3.1. Patient characteristics
A total of 21 PIPT patients were enrolled in this study, including 15 males and 6 females (maximum age74 years, minimum age 44 years, median age 58 years). In the second step, 21 patients with peripherallung cancer were randomly collected, including 13 males and 8 females (maximum age 78 years,minimum age 44 years, median age 67 years). 14 were diagnosed with adenocarcinoma, 6 withsquamous cell carcinoma and 1 with atypical carcinoid
3.2. Feature results
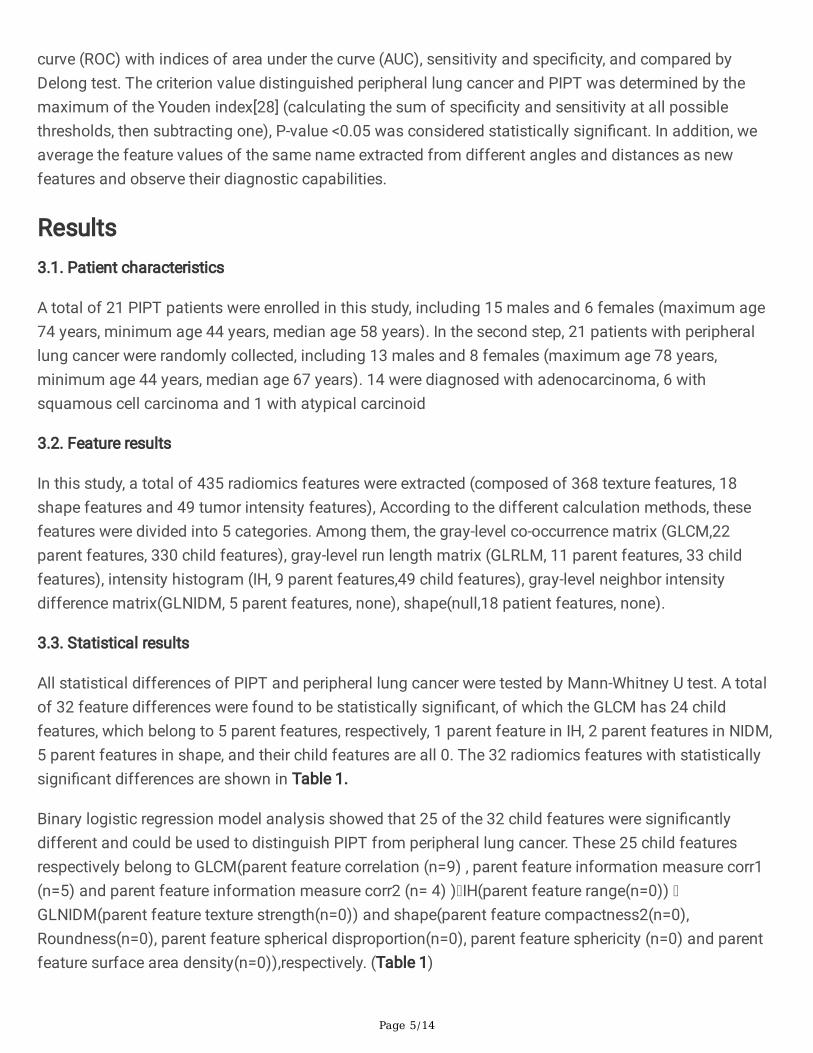
In this study, a total of 435 radiomics features were extracted (composed of 368 texture features, 18shape features and 49 tumor intensity features), According to the different calculation methods, thesefeatures were divided into 5 categories. Among them, the gray-level co-occurrence matrix (GLCM,22parent features, 330 child features), gray-level run length matrix (GLRLM, 11 parent features, 33 childfeatures), intensity histogram (IH, 9 parent features,49 child features), gray-level neighbor intensitydifference matrix(GLNIDM, 5 parent features, none), shape(null,18 patient features, none).
3.3. Statistical results
All statistical differences of PIPT and peripheral lung cancer were tested by Mann-Whitney U test. A totalof 32 feature differences were found to be statistically signi�cant, of which the GLCM has 24 childfeatures, which belong to 5 parent features, respectively, 1 parent feature in IH, 2 parent features in NIDM,5 parent features in shape, and their child features are all 0. The 32 radiomics features with statisticallysigni�cant differences are shown in Table 1.
Binary logistic regression model analysis showed that 25 of the 32 child features were signi�cantlydifferent and could be used to distinguish PIPT from peripheral lung cancer. These 25 child featuresrespectively belong to GLCM(parent feature correlation (n=9) , parent feature information measure corr1(n=5) and parent feature information measure corr2 (n= 4) ) IH(parent feature range(n=0)) GLNIDM(parent feature texture strength(n=0)) and shape(parent feature compactness2(n=0),Roundness(n=0), parent feature spherical disproportion(n=0), parent feature sphericity (n=0) and parentfeature surface area density(n=0)),respectively. (Table 1)

Page 6/14
Table 1 Feature parameters differentiating between pulmonary in�ammatory pseudotumor and peripherallung cancer
Category Parent Feature Child Feature P1 value P2 value
GLCM
Cluster Prominence 135-1Cluster Prominence 0.0325 0.2731Correlation 333-1 Correlation 0.0111 0.0002
333-4 Correlation 0.0497 0.003545-1 Correlation 0.0128 0.000745-4 Correlation 0.0020 0.002145-7 Correlation 0.0025 0.007990-1 Correlation 0.0018 0.000190-4 Correlation 0.0028 0.001490-7 Correlation 0.0086 0.0010135-7 Correlation 0.0265 0.0368
Information Measure Corr1 333-1 Information Measure Corr1 0.0268 0.0042333-4 Information Measure Corr1 0.0157 0.06040-1 Information Measure Corr1 0.0128 0.038445-1 Information Measure Corr1 2.97E-5 0.000990-1 Information Measure Corr1 5.7E-5 0.000190-4 Information Measure Corr1 0.0489 0.1070135-1 Information Measure Corr1 0.0137 0.0079
Information Measure Corr2 333-1 Information Measure Corr2 0.0442 0.0070333-4 Information Measure Corr2 0.0442 0.09550-1 Information Measure Corr2 0.0497 0.097845-1 Information Measure Corr2 0.0020 0.018490-1 Information Measure Corr2 0.0083 0.0065135-1 Information Measure Corr2 0.0168 0.0273
Inverse Diff Moment Norm 135-7 Inverse Diff moment Norm 0.0391 0.2151IH Range None 0.0169 0.0116GLNIDM Complexity None 0.0268 0.0595
Texture Strength None 0.0089 0.0289SHAPE Compactness2 None 0.0017 0.0027
Roundness None 0.0083 0.0051Spherical Disproportion None 0.0017 0.0010Sphericity None 0.0017 0.0014
Surface Area Density None 0.0207 0.0443
Note: gray-level co-occurrence matrix, GLCM; Intensity Histogram, IH; neighbor intensity differencematrix, GLNIDM; number1-number2-feature (angle,number1; distance,number2); the signi�cantdifference index of Mann-Whitney U test; P1 value; the signi�cant difference index of Binary logisticregression, P2 value; indicates a signi�cant difference (p<0.05).
ROC curves of 25 features were performed to evaluate the ability of features differentiating peripherallung cancer from PIPT. The curves (AUC < 0.7) was abandoned in this study, because of its limiteddiscriminant ability. Finally, A total of 23 ROC curves of features were obtained in this study. In addition,we calculated the average value of the features at the same angle and different distance and drew ROCcurves, which were curve Mean1 and Mean2. we also calculated the average value of the features atdifferent angles and different distances and the drew of ROC curves were curve mean3, mean4, mean5,respectively. The P-values of statistical differences among ROC were 0.0499 (F11, F23), 0.0472 (F12,F13) and 0.0250 (F13, Mean4), and the others were 0.5908 0.2803. All ROC curves are shown in Figure1.

Page 7/14
At the same time, we calculate the AUC, sensitivity, truncated value, speci�city and Youden index. Forfeatures with discriminating ability and features after averaging the feature values, we calculated theirinterquartile range (IQR) and median values, respectively. The speci�c values of all statistical parametersdifferentiating between peripheral lung cancer and PIPT are shown in Table. 2.
Table. 2 Statistical parameters differentiating between peripheral lung cancer and pulmonaryin�ammatory pseudotumor
Feature Peripheral Lung Cancer PIPT AUC Sensitivity % Speci�city % Truncated-Value Younden-Index
IQR median IQR median
F1 0.0429 0.7334 0.0874 0.7913 0.730 80.95 76.19 0.7657 0.5714
F2 0.1056 0.6783 0.1218 0.7846 0.726 80.95 66.67 0.7401 0.4762
F3 0.1399 0.0738 0.1480 0.2719 0.800 90.00 70.59 0.2047 0.6059
F4 0.1889 -0.0284 0.2054 0.1434 0.806 88.89 68.75 0.0246 0.5764
F5 0.0682 0.7960 0.0773 0.8801 0.782 90.48 71.43 0.8629 0.6190
F6 0.1965 0.2102 0.1405 0.3946 0.774 90.48 65.00 0.3589 0.5548
F7 0.1370 0.0223 0.1438 0.1954 0.754 84.21 72.22 0.1234 0.5643
F8 0.1467 -0.0576 0.2119 0.410 0.718 73.68 76.47 -0.0316 0.5015
Mean1 0.1500 0.2280 0.1403 0.4112 0.800 95.24 71.43 0.3512 0.6667
Mean2 0.1377 0.3465 0.2000 0.5030 0.728 85.71 66.67 0.4526 0.5238
Mean3 0.1264 0.2513 0.1745 0.3979 0.744 85.71 71.43 0.3100 0.5714
F9 0.0436 -0.2981 0.0790 -0.3183 0.701 93.48 47.62 -0.3395 0.4762
F10 0.0436 -0.3821 0.1112 -0.4560 0.726 95.24 57.14 -0.4461 0.5238
F11 0.0409 -0.2944 0.1154 0.3496 0.878 80.95 90.48 -0.3106 0.7143
F12 0.0506 -0.3605 0.0892 -0.4266 0.864 71.43 100.00 -0.3813 0.7143
F13 0.0389 -0.2849 0.1490 -0.3602 0.723 95.24 52,38 -0.3602 0.4762
Mean4 0.0263 -0.3250 0.0788 -0.3887 0.837 90.48 66.67 -0.3597 0.5714
F14 0.0428 0.8997 0.0692 0.9302 0.780 85.71 66.67 0.9175 0.5238
F15 0.0190 0.9330 0.0450 0.9623 0.739 85.71 66.71 0.9567 0.5238
F16 0.0378 0.8930 0.0788 0.9202 0.717 71.43 71.43 0.8975 0.4286
Mean5 0.0244 0.9065 0.0625 0.9419 0.751 85.71 61.91 0.9252 0.4762
F17 115 346 189 494 0.717 76.19 71.43 400.0000 0.4762
F18 24.4979 30.8545 123.2077 101.5105 0.737 76.19 80.95 42.1144 0.5714
F19 0.1460 0.5928 0.4127 0.2817 0.785 95.24 71.43 0.3259 0.6667
F20 0.1063 0.3569 0.2001 0.2136 0.739 85.71 57.14 0.2454 0.4286
F21 0.0953 1.1904 0.5439 1.5253 0.785 95.24 71.43 1.3783 0.6667
F22 0.0680 0.8400 0.2671 0.6556 0.785 95.24 71.43 0.6882 0.6667
F23 1.7698 2.9145 5.3141 4.5316 0.710 66.67 76.19 2.9718 0.4286
Note: F1-333-1 Correlation; F2-45-1 Correlation; F3-45-4 Correlation; F4-45-7 Correlation; F5-90-1Correlation;F6-90-4 Correlation; F7-90-7 Correlation; F8-135-7 Correlation; F9-333-1 InformationMeasure Corr1; F10-0-1 Information- Measure Corr1; F11-45-1 Information Measure Corr1; F12-90-1Information Measure Corr1; F13-135-1 Information Measure Corr1; F14-45-1 Information MeasureCorr2; F15-90-1 Information Measure Corr2; F16-135-1 Information Measure Corr2; F17-range; F18-Texture Strength; F19-Compactness2; F20-Roundness; F21-Spherical Disproportion; F22-Sphericity;F23-Surface Area Density; Mean1- Mean(F2+…+F4); Mean2- Mean(F5+…+F7); Mean3- Mean(F2+…+F9); Mean4- Mean(F9+…+F13); Mean5- Mean(F14+…+F16); IQR- indicates interquartile range
Discussion

Page 8/14
The results of this study show that there is a statistically signi�cant difference between the texturefeatures extracted from patients with peripheral lung cancer and those from patients with PIPT. Weassume that this statistically signi�cant difference between peripheral lung cancer and PIPT in this studymay be related to the pathological microstructure differences between the two tissue types.Adenocarcinoma may consist partly cubic tumor cells and partly of columnar[29]. The pathology ofprimary lung adenocarcinoma is mostly papillary type, others are solid, lepidic, acinar, and micropapillarysubtypes., which is often diagnosed as a mixture of multiple subtypes[30]. The pathological subtypes oflung squamous cell carcinoma include small cell, clear cell, basaloid and papillary subtypes[6, 31], inwhich papillary squamous cell carcinoma is usually characterized by exogenous endobronchialgrowth[32]. The histological types of small cell carcinoma are oat, intermediate and mixed subtype[6]. Onpathological smears, most of the cancer cells are quasi-round or fusiform, with few cytoplasm and nakednuclei, which are very similar to lymphoma cells, and there are often mixed non-nucleated necrotic cells orextensive necrotic areas[6]. Large cell cancer cells often show sheets and nests distribution. this kind ofcancer cells has rich cytoplasm, vesicular nuclei and prominent nucleoli[6, 33]. The histological structureof PIPT is complex and often accompanied by a mixture of different numbers of cells. The main celltypes of PIPT are spindle cells (myo�broblasts and �broblasts) and chronic in�ammatory cells(especially plasma cells, lymphocytes and macrophages)[17, 34, 35]. The histology of PIPT can bedivided into three types: (1) �brous histiocytic type characterized by fusiform myo�broblasts and mostcommon (2) under the microscope, most of the patients with organized pneumonia are foam cells,eosinophils and multinucleated cells (3) Lymphocyte type is dominated by lymphocytes and plasmacells, which is the most rare type[18, 36, 37].
The slight difference in pathology between peripheral lung cancer and pulmonary in�ammatorypseudotumor may be re�ected in the attenuation of CT. Correlation is a value between 0 (uncorrelated)and 1 (perfectly correlated) showing the linear dependency of gray level values to their respective voxelsin the GLCM[38], Information Measure Corr1 and Information Measure Corr2 are two features thatassessing the correlation between the probability distributions of two voxels (quantifying the complexityof the texture)[38, 39]. The median values of Correlation(F1- Mean3) Information Measure Corr1(F9-Mean4) and Information Measure Corr2(F14-Mean5) of PIPT in this study are mostly higher than that ofperipheral lung cancer, which may be related to the distribution of in�ammatory cells in PIPT. The speci�cdifferences of the value of different features have been shown in Table 2. Related reports show thatmyo�broblasts and histiocytes play a dominant role in PIPT and are arranged in spirals or �akes[18, 36].This may be because PIPT necrosis is relatively less than lung cancer[9, 40, 41] Lung cancer tissue growsrapidly and is prone to focal necrosis, which may lead to the larger values of Range(F17) and TextureStrength(F18) of PIPT compared with that of lung cancer. In this study, the shape features Compactness2Spherical Disproportion and Spherical are the quanti�cation of tumor roundness, and there is a certain
correlation between these three features in the de�nition of features. In this study, the ROC curves ofthese three features(F19, F21,F22) coincide, which also con�rms this fact. This may be that most of theperipheral lung cancer is spherical, and most of the PIPT are located in the lower lobe of the lung and areround or oval in shape[17, 20]. Although the morphological features of peripheral lung cancer and

Page 9/14
pulmonary in�ammatory pseudotumor are highly similar, the probability of occurrence of the sameimaging features may be different in the cohort of patients[36, 42]. this may be an important reason whymost of the differences between peripheral lung cancer and PIPT in this study belong to shape features.
In addition, in this study, we found that the features extracted from different angles and distances had nospecial advantage in distinguishing peripheral lung cancer from PIPT. On the contrary, the featuresextracted from different angles and different distances have higher discriminating ability and thecharacteristics after calculating the average value, such as 45-7 Correlation (F4), 45-1 InformationMeasure Corr1 (F11), 90-1 Information Measure Corr1 (F14). This may be related to the directionality ofthe microstructure of the lung in space.
Using texture features to distinguish benign and malignant tissues has been reported in many articles.Tsai et al.[43] reported that the use of texture features can well distinguish nasopharyngeal carcinomafrom normal nasopharyngeal tissue, and the statistical difference in texture features betweennasopharyngeal carcinoma and normal nasopharyngeal tissue may be related to the loss of stripestructure in normal nasopharyngeal tissue. and this �nding had been con�rmed on MRI images. Alilou etal.[44] had shown that lung adenocarcinoma and granuloma can be diagnosed shape-based features(sphericity and roughness), and the two lesions were di�cult to distinguish pathologically. these reportsgive great inspiration to the development of our study.
There are many limitations to our research. First of all, the number of patients is small, due to therelatively low incidence of PIPT, to a certain extent, it limits our collection of relevant medical images. Inaddition, this study lacks directly related pathological experimental tissue specimens, so that we can notdirectly con�rm our �ndings, and the hypothesis of related problems can only be based on previousreports. Finally, all the medical images in this study are obtained from the same PET/CT model. Whetherthe images between different PET/CT model can get the same conclusion, we still need further research.In the following research, we will expand the sample size as much as possible and apply machinelearning and deep learning methods to further study to verify our �ndings.
ConclusionsThere were signi�cant differences in radiological characteristics between peripheral lung cancer and PIPT,among which Information Measure Corr1 features(F11,F12) showed the highest ability to distinguishperipheral lung cancer from PIPT.
Abbreviations18F-�uorodeoxyglucose positron emission tomography/computed tomography, 18F-FDG PET/CT;pulmonary in�ammatory pseudotumor, PIPT; regions of interest, ROI; receiver operating characteristic,ROC; area under the curve, AUC; Gray-Level Run Length Matrix, GLRLM; Gray-Level Co-occurrence Matrix,

Page 10/14
GLCM; Intensity Histogram, IH; Gray-level Neighbor Intensity Difference Matrix, GLNIDM; indicatesinterquartile range, IQR
DeclarationsAcknowledgements
Not applicable
Authors' contributions
Chenlu Liu and Changsheng Ma contribute to conception and design, Yanruan Guo, and Jinghao Duandraft the manuscript. Qingtao Qiu contribute to acquire, analyze and interpret data. YongYin contribute toacquire data and enhance its intellectual content. All authors read and approved the �nal manuscript.
Ethics approval and consent to participate
The study was approved by the Research Ethics Committee of Shandong Cancer Hospital and Institute,Shandong First Medical University and Shandong Academy of Medical Sciences. All of the patients in thepresent study provided informed written consent for their participation and in our research. Ethicalpermission was also provided for the study.
Funding
This work is supported by National Nature Science Foundation of China (81974467). The Natural ScienceFoundation of Shandong Province (ZR2019MH136). The Key Research and Development Project ofShandong Province (2018GSF118006). The authors would like to thank the editor and reviewers for theirinsightful suggestions, which helped improve the manuscript.
Availability of data and materials
The datasets used and analyzed during the current study are available from the corresponding author onreasonable request.
Consent for publication
Not applicable
Competing interests
None
References1. Alberg AJ, Samet JM: Epidemiology of Lung Cancer. Chest 2003, 123(1, Supplement):21S-49S.

Page 11/14
2. Ganeshan B, Panayiotou E, Burnand K, Dizdarevic S, Miles K: Tumour heterogeneity in non-small celllung carcinoma assessed by CT texture analysis: a potential marker of survival. Eur Radiol 2012,22(4):796-802.
3. Akata S, Yoshimura M, Nishio R, Park J, Saito K, Uchida O, Ohira T, Kato H, Okada S, Kakizaki D: High-resolution computed tomographic �ndings of small peripherally located squamous cell carcinoma.Clinical Imaging 2008, 32(4):259-263.
4. Stinchcombe TE, Socinski MA: Current Treatments for Advanced Stage Non–Small Cell Lung Cancer.Proceedings of the American Thoracic Society 2009, 6(2):233-241.
5. Siegel RL, Miller KD, Jemal A: Cancer statistics, 2020. CA: A Cancer Journal for Clinicians 2020,70(1):7-30.
�. Travis WD: Pathology of Lung Cancer. Clinics in Chest Medicine 2011, 32(4):669-692.
7. Mazzone P, Obuchowski N, Mekhail T, Meziane M, Ahmad M: Lung cancer screening: is it time for achange in policy? Cleve Clin J Med 2007, 74(6):441-448.
�. Feng M, Yang X, Ma Q, He Y: Retrospective analysis for the false positive diagnosis of PET-CT scanin lung cancer patients. Medicine (Baltimore) 2017, 96(42):e7415-e7415.
9. Li CR, Li YZ, Li YM, Zheng YS: Dynamic and contrast enhanced CT imaging of lung carcinoma,pulmonary tuberculoma, and in�ammatory pseudotumor. Eur Rev Med Pharmacol Sci 2017,21(7):1588-1592.
10. Way T, Chan H-P, Hadjiiski L, Sahiner B, Chughtai A, Song TK, Poopat C, Stojanovska J, Frank L, AttiliA: Computer-Aided Diagnosis of Lung Nodules on CT Scans:: ROC Study of Its Effect onRadiologists' Performance. Academic radiology 2010, 17(3):323-332.
11. Tateishi U, Nishihara H, Tsukamoto E, Morikawa T, Tamaki N, Miyasaka K: Lung tumors evaluatedwith FDG-PET and dynamic CT: the relationship between vascular density and glucose metabolism.J Comput Assist Tomogr 2002, 26(2):185-190.
12. Kostakoglu L, Agress H, Goldsmith SJ: Clinical Role of FDG PET in Evaluation of Cancer Patients.RadioGraphics 2003, 23(2):315-340.
13. Chang JM, Lee HJ, Goo JM, Lee H-Y, Lee JJ, Chung J-K, Im J-G: False Positive and False NegativeFDG-PET Scans in Various Thoracic Diseases. Korean J Radiol 2006, 7(1):57-69.
14. Rosenbaum SJ, Lind T, Antoch G, Bockisch A: False-Positive FDG PET Uptake−the Role of PET/CT.Eur Radiol 2006, 16(5):1054-1065.
15. Asad S, Aquino SL, Piyavisetpat N, Fischman AJ: False-Positive FDG Positron Emission TomographyUptake in Nonmalignant Chest Abnormalities. Am J Roentgenol 2004, 182(4):983-989.
1�. Harada T, Watanabe K, Iwasaki A, Shirakusa T, Iwasaki H, Yosida M: [Four cases of in�ammatorypseudotumor]. Nihon Kokyuki Gakkai Zasshi 2003, 41(6):402-406.
17. Huellner MW, Schwizer B, Burger I, Fengels I, Schläpfer R, Bussmann C, Strobel K: In�ammatorypseudotumor of the lung with high FDG uptake. Clin Nucl Med 2010, 35(9):722-723.

Page 12/14
1�. Agrons GA, Rosado-de-Christenson ML, Kirejczyk WM, Conran RM, Stocker JT: Pulmonaryin�ammatory pseudotumor: radiologic features. Radiology 1998, 206(2):511-518.
19. Laufer L, Cohen Z, Mares AJ, Maor E, Hirsch M: Pulmonary plasma-cell granuloma. PediatricRadiology 1990, 20(4):289-290.
20. Sagar AES, Jimenez CA, Shannon VR: Clinical and Histopathologic Correlates and ManagementStrategies for In�ammatory Myo�broblastic tumor of the lung. A case series and review of theliterature. Med Oncol 2018, 35(7):102.
21. Basu S, Utpat K, Joshi J: 18F-FDG PET/CT Imaging Features of IgG4-Related PulmonaryIn�ammatory Pseudotumor at Initial Diagnosis and During Early Treatment Monitoring. Journal ofNuclear Medicine Technology 2016, 44(3):207-209.
22. Patnana M, Sevrukov AB, Elsayes KM, Viswanathan C, Lubner M, Menias CO: In�ammatoryPseudotumor: The Great Mimicker. Am J Roentgenol 2012, 198(3):W217-W227.
23. Wang XL, Shan W: Application of dynamic CT to identify lung cancer, pulmonary tuberculosis, andpulmonary in�ammatory pseudotumor. Eur Rev Med Pharmacol Sci 2017, 21(21):4804-4809.
24. Coroller TP, Grossmann P, Hou Y, Rios Velazquez E, Leijenaar RTH, Hermann G, Lambin P, Haibe-KainsB, Mak RH, Aerts HJWL: CT-based radiomic signature predicts distant metastasis in lungadenocarcinoma. Radiotherapy and Oncology 2015, 114(3):345-350.
25. Leijenaar RTH, Carvalho S, Velazquez ER, van Elmpt WJC, Parmar C, Hoekstra OS, Hoekstra CJ,Boellaard R, Dekker ALAJ, Gillies RJ et al: Stability of FDG-PET Radiomics features: An integratedanalysis of test-retest and inter-observer variability. Acta Oncologica 2013, 52(7):1391-1397.
2�. Zhang L, Fried DV, Fave XJ, Hunter LA, Yang J, Court LE: IBEX: an open infrastructure softwareplatform to facilitate collaborative work in radiomics. Med Phys 2015, 42(3):1341-1353.
27. Mann HB, Whitney DR: On a Test of Whether one of Two Random Variables is Stochastically Largerthan the Other. The Annals of Mathematical Statistics 1947, 18(1):50-60.
2�. Youden WJ: Index for rating diagnostic tests. Cancer 1950, 3(1):32-35.
29. Edwards A: Tumours of the lung. British Journal of Surgery 2005, 26:166-192.
30. Casteillo F, Guy J-B, Dal-Col P, Karpathiou G, Pommier B, Bayle-Bleuez S, Fournel P, Vassal F, Forest F:Pathologic Subtypes of Lung Adenocarcinoma Brain Metastasis Is a Strong Predictor of SurvivalAfter Resection. Am J Surg Pathol 2018, 42(12):1701-1707.
31. Churg A, Johnston WH, Stulbarg M: Small cell squamous and mixed small cell squamous--small cellanaplastic carcinomas of the lung. Am J Surg Pathol 1980, 4(3):255-263.
32. Dulmet-Brender E, Jaubert F, Huchon G: Exophytic endobronchial epidermoid carcinoma. Cancer1986, 57(7):1358-1364.
33. Travis WD, Brambilla E, Müller-Hermelink HK, Harris CC: Pathology and genetics of tumours of thelung, pleura, thymus and heart (WHO classi�cation of tumours). In.: Lyon: IARC Press; 2004.
34. Berardi RS, Lee SS, Chen HP, Stines GJ: INFLAMMATORY PSEUDOTUMORS OF THE LUNG. 1983.
Page 13/14
35. Matsubara O, Tan-Liu NS, Kenney RM, Mark EJ: In�ammatory pseudotumors of the lung: Progressionfrom organizing pneumonia to �brous histiocytoma or to plasma cell granuloma in 32 cases. HumanPathology 1988, 19(7):807-814.
3�. Schlimper C, Sommer T, Flacke S, Wolff M, Schild H, Kreft B: Radiologische Befunde beiin�ammatorischen Pseudotumoren. In: Rofo-Fortschr Rontg: 2005: © Georg Thieme Verlag KGStuttgart· New York; 2005: 1506-1512.
37. Co�n CM, Watterson J, Priest JR, Dehner LP: Extrapulmonary in�ammatory myo�broblastic tumor(in�ammatory pseudotumor). A clinicopathologic and immunohistochemical study of 84 cases. AmJ Surg Pathol 1995, 19(8):859-872.
3�. Haralick RM, Shanmugam K, Dinstein IH: Textural features for image classi�cation. IEEETransactions on systems, man, and cybernetics 1973(6):610-621.
39. Linfoot EH: An informational measure of correlation. Information and control 1957, 1(1):85-89.
40. Zennaro H, Laurent F, Vergier B, Rauturier J, Airaud J, Jougon J, Drouillard J: In�ammatorymyo�broblastic tumor of the lung (in�ammatory pseudotumor): uncommon cause of solitarypulmonary nodule. Eur Radiol 1999, 9(6):1205-1207.
41. Hammas N, Chbani L, Rami M, Boubbou M, Benmiloud S, Bouabdellah Y, Tizniti S, Hida M, Amarti A:A rare tumor of the lung: in�ammatory myo�broblastic tumor. Diagnostic pathology 2012, 7(1):83.
42. Ebara K, Takashima S, Jiang B, Numasaki H, Fujino M, Tomita Y, Nakanishi K, Higashiyama M:Pleural invasion by peripheral lung cancer: prediction with three-dimensional CT. Academic radiology2015, 22(3):310-319.
43. Tsai A, Buch K, Fujita A, Qureshi MM, Kuno H, Chapman MN, Li B, Oda M, Truong MT, Sakai O: UsingCT texture analysis to differentiate between nasopharyngeal carcinoma and age-matched adenoidcontrols. Eur J Radiol 2018, 108:208-214.
44. Alilou M, Beig N, Orooji M, Rajiah P, Velcheti V, Rakshit S, Reddy N, Yang M, Jacono F, Gilkeson RC: Anintegrated segmentation and shape‐based classi�cation scheme for distinguishingadenocarcinomas from granulomas on lung CT. Med Phys 2017, 44(7):3556-3569.
Figures
Figure 1

Page 14/14
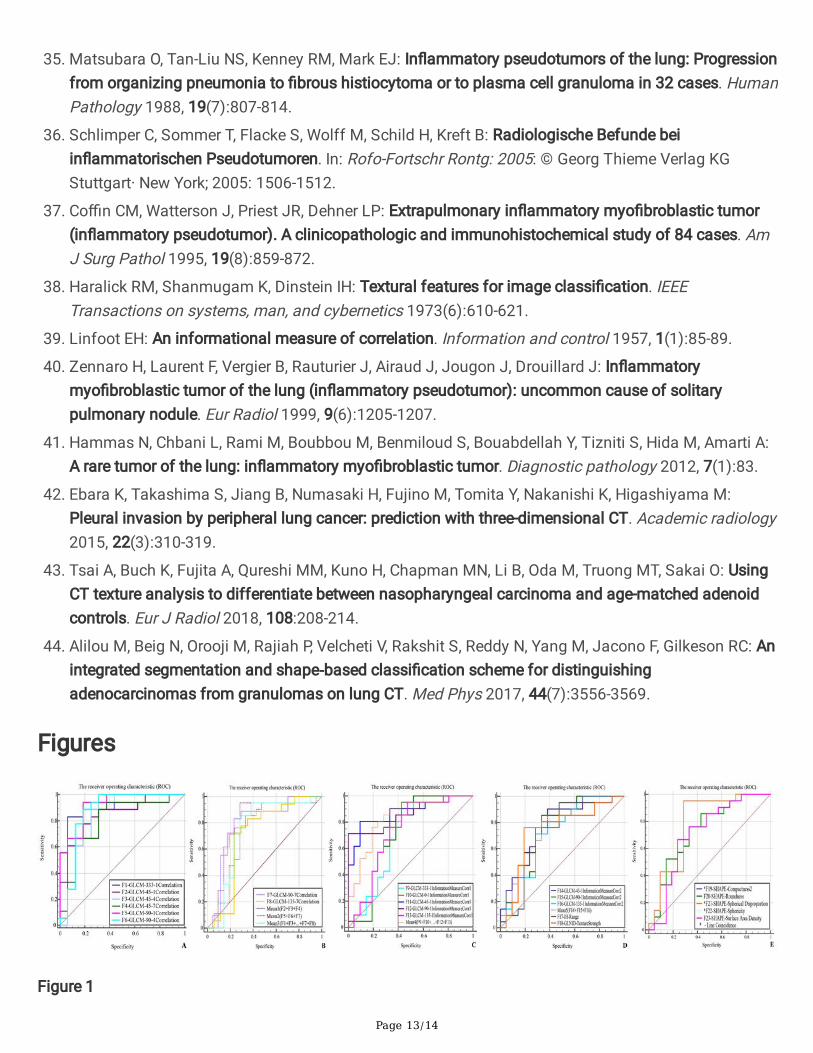
(A) ROC curves of six features of GLCM(Correlation, F1-F6) obtained from different angles and distances .(B) For the ROC curves of two features in GLCM(Correlation, F7-F8), the Mean1 ROC curve of the averagevalue of the features Correlation, F2+ F3+ F4 was obtained for different distances at an angle of 45degrees. the Mean2 ROC curve of the average value of the features Correlation, F5+ F6+ F7 was obtainedfor different distances at an angle of 90 degrees. the Mean3 ROC curve of the average value of features(Correlation, F1+…+F8) was obtained at different angles and distances. (C) The ROC curves of �vefeatures of CLCM(Information Measure Corr1, F9-F13) obtained from different angles and differentdistances. the Mean4 ROC curve of the average value of features (Correlation, F9+…+F13) was obtainedat different angles and distances. (D) The ROC curves of three features of CLCM(Information MeasureCorr2, F14-F16) obtained from different angles and different distances. the Mean5 ROC curve of theaverage value of features (Information Measure Corr2, F14+…+F16) was obtained at different angles anddistances. The two ROC curves belong to the matrix IH(F17) and GLNID(F18) respectively. (E) Five ROCcurves belonging to shape are extracted from different angles and distances, of which three curvescoincide.