PERIODICAL FOR MINING, METALLURGY AND · PDF filePERIODICAL FOR MINING, METALLURGY AND GEOLOGY...
124
RMZ-M&G, Vol. 58, No. 3 pp. 241–356 (2011) Ljubljana, September 2011 ISSN 1408-7073 PERIODICAL FOR MINING, METALLURGY AND GEOLOGY RMZ – MATERIALI IN GEOOKOLJE REVIJA ZA RUDARSTVO, METALURGIJO IN GEOLOGIJO
Transcript of PERIODICAL FOR MINING, METALLURGY AND · PDF filePERIODICAL FOR MINING, METALLURGY AND GEOLOGY...
RMZ-M&G, Vol. 58, No. 3 pp. 241–356 (2011)Ljubljana, September 2011
ISSN 1408-7073
PERIODICAL FOR MINING, METALLURGY AND GEOLOGY
RMZ – MATERIALI IN GEOOKOLJEREVIJA ZA RUDARSTVO, METALURGIJO IN GEOLOGIJO
II Historical Review
RMZ-M&G 2011, 58
Historical Rewiev
More than 80 years have passed since in 1919 the University Ljubljana in Slovenia was founded. Technical fields were joint in the School of Engineering that included the Geo logic and Mining Division while the Metallurgy Division was established in 1939 only. Today the Departments of Geology, Mining and Geotechnology, Materials and Metallurgy are part of the Faculty of Natural Sciences and Engineering, University of Ljubljana.
Before War II the members of the Mining Section together with the Association of Yugoslav Mining and Metallurgy Engineers began to publish the summaries of their research and studies in their technical periodical Rudarski zbornik (Mining Proceedings). Three volumes of Rudarski zbornik (1937, 1938 and 1939) were published. The War interrupted the publi cation and not untill 1952 the first number of the new journal Rudarsko-metalurški zbornik - RMZ (Mining and Metallurgy Quarterly) has been published by the Division of Mining and Metallurgy, University of Ljubljana. Later the journal has been regularly published quarterly by the Departments of Geology, Mining and Geotechnology, Materials and Metal lurgy, and the Institute for Mining, Geotechnology and Environment.
On the meeting of the Advisory and the Editorial Board on May 22nd 1998 Rudarsko-metalurški zbornik has been renamed into “RMZ - Materials and Geoenvironment (RMZ -Materiali in Geookolje)” or shortly RMZ - M&G.
RMZ - M&G is managed by an international advisory and editorial board and is exchanged with other world-known periodicals. All the papers are reviewed by the corresponding pro fessionals and experts.
RMZ - M&G is the only scientific and professional periodical in Slovenia, which is pub-lished in the same form nearly 50 years. It incorporates the scientific and professional topics in geology, mining, and geotechnology, in materials and in metallurgy.
The wide range of topics inside the geosciences are wellcome to be published in the RMZ -Materials and Geoenvironment. Research results in geology, hydrogeology, mining, geotechnology, materials, metallurgy, natural and antropogenic pollution of environment, biogeochemistry are proposed fields of work which the journal will handle. RMZ - M&G is co-issued and co-financed by the Faculty of Natural Sciences and Engineering Ljubljana, and the Institute for Mining, Geotechnology and Environment Ljubljana. In addition it is financially supported also by the Ministry of Higher Education, Science and Technology of Republic of Slovenia.
Editor in chief
IIITable of Contents – Kazalo
RMZ-M&G 2011, 58
Table of Contents – Kazalo
Original Scientific Papers – Izvirni znanstveni članki
The effect of defects on tensile strength of the continuous steel casting products 241
Vpliv napak na natezno trdnost kontinuirno ulitih jeklenih proizvodovGojić, M., Lazić, L., Kožuh, S., KoSec, L.
An analysis of the quasi-chemical model of a ternary solution: On the counting of pairs 253
Analiza kvazikemičnega modela ternarne raztopine: O štetju parovchen, j.
Finite element solution strategy to analyze heterogeneous structures 259Strategija analize heterogenih struktur z metodo končnih elementovLaMut, M.
Tracing coalbed gas dynamics and origin of gases in advancement of the working faces at mining areas Preloge and Pesje, Velenje Basin 273
Spremljanje sestave premogovega plina in izor plinov z napredovanjem čela delovišč na pridobivalnih (rudarskih) območjih jam Preloge in Pesje, Velenjski bazenKanduč, t., žuLa, j. zavšeK, S.
Sediment transport and sedimentation in a coastal ecosystem – a case study 289Sedimentni transport in sedimentacija v priobalnem ekosistemu - zgled študijePurandara, B. K., venKateSh, B., chouBey, v. K.
Integrated remote sensing and GIS approach to groundwater potential assessment in the basement terrain of Ekiti area southwestern Nigeria 303
Povezava daljinskega ugotavljanja in GIS za oceno potenciala podtalnice v kristalinični podlagi območja Ekiti v jugozahodni NigerijitaLaBi, a. o., tijani, M. n.

IV Table of Contents – Kazalo
RMZ-M&G 2011, 58
Preliminary notes – Predhodna objava
Influence of the heat treatment and extrusion process on the mechanical and microstructural properties of the AISi1MgMn Alloy 329
Vpliv toplotne obdelave in postopka iztiskanja na mehanske in mikrostrukturne lastnosti zlitine AISi1MgMnSteinacher, M., draGojević, v., SMoLej, a.
Event notes – Novice
Petdeset let delovanja Metalurškega instituta “Kemal Kapetanović” v Zenici 339
KoSec, B., riMac, M.
Author`s Index, Vol. 58, No. 3 342
Instructions to Authors 343
Template 351
241RMZ – Materials and Geoenvironment, Vol. 58, No. 3, pp. 241–252, 2011
Original scientific paper
The effect of defects on tensile strength of the continuous steel casting products
Vpliv napak na natezno trdnost kontinuirno ulitih jeklenih proizvodov
MirKo Gojić1,*, LadiSLav Lazić1, StjePan Kožuh1, LadiSLav KoSec2
1University of Zagreb, Faculty of Metallurgy, Aleja narodnih heroja 3, 44103 Sisak, Croatia
2University of Ljubljana, Faculty of Natural Sciences and Engineering, Aškerčeva 12, 1000 Ljubljana, Slovenia
*Corresponding author. E-mail: [email protected]
Received: May 23, 2011 Accepted: October 6, 2011
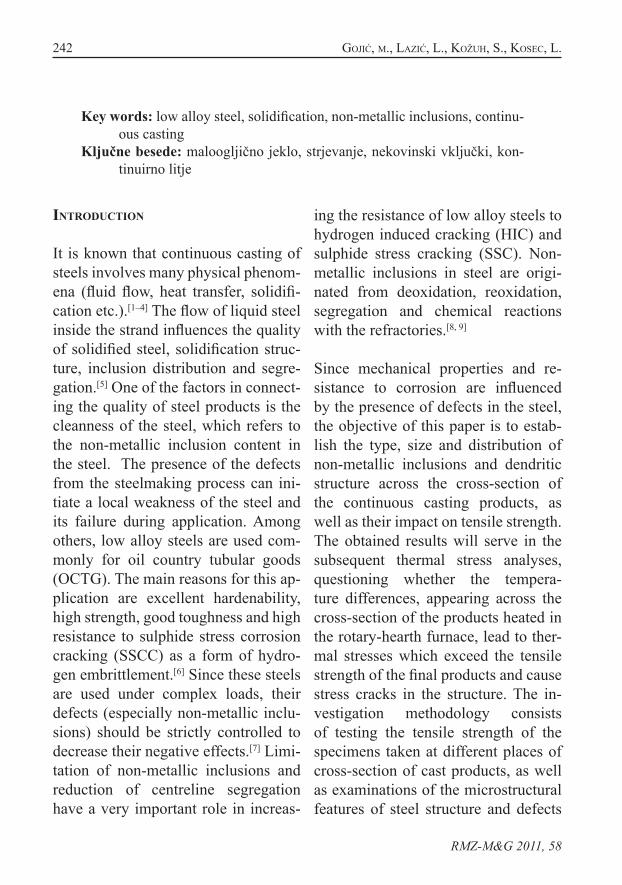
Abstract: The goal of this paper is to determine the influence of defects on tensile strength of continuous casting steel products made from low alloy Mn-V steel. The microstructure was determined by optical microscopy and scanning electron microscopy. The composition of non-metallic inclusions were determined by energy dispersive X-ray spectroscopy. The microstructural analysis has shown that there are significant differences between the microstructure near the surface and in the central zone of the round cross-section. It was found that a significant decrease in tensile strength can be correlated the presence of alumina and sulphide inclusions as well as dendritic structure.
Povzetek: Namen članka je določiti vpliv napak na natezno trdnost konti-nuirno ulitih jeklenih proizvodov, izdelanih iz Mn-V maloogljičnega jekla. Mikrostruktura je bila analizirana z optičnim mikroskopom in vrstičnim elektronskim mikroskopom. Kemična sestava nekovinskih vključkov je bila opredeljena z energijsko disperzijsko spektroskopijo rentgenskih žarkov. Mikrostrukturna analiza je pokazala občutno razli-ko med mikrostrukturo blizu površine in tisto v centralni coni prečnega prereza. Ugotovili smo, da je občuten padec natezne trdnosti v korelaci-ji s prisotnostjo aluminatnih in sulfidnih nekovinskih vključkov in tudi z dendritsko strukturo.
242 Gojić, M., Lazić, L., Kožuh, S., KoSec, L.
RMZ-M&G 2011, 58
Key words: low alloy steel, solidification, non-metallic inclusions, continu-ous casting
Ključne besede: maloogljično jeklo, strjevanje, nekovinski vključki, kon-tinuirno litje
Introduction
It is known that continuous casting of steels involves many physical phenom-ena (fluid flow, heat transfer, solidifi-cation etc.).[1–4] The flow of liquid steel inside the strand influences the quality of solidified steel, solidification struc-ture, inclusion distribution and segre-gation.[5] One of the factors in connect-ing the quality of steel products is the cleanness of the steel, which refers to the non-metallic inclusion content in the steel. The presence of the defects from the steelmaking process can ini-tiate a local weakness of the steel and its failure during application. Among others, low alloy steels are used com-monly for oil country tubular goods (OCTG). The main reasons for this ap-plication are excellent hardenability, high strength, good toughness and high resistance to sulphide stress corrosion cracking (SSCC) as a form of hydro-gen embrittlement.[6] Since these steels are used under complex loads, their defects (especially non-metallic inclu-sions) should be strictly controlled to decrease their negative effects.[7] Limi-tation of non-metallic inclusions and reduction of centreline segregation have a very important role in increas-
ing the resistance of low alloy steels to hydrogen induced cracking (HIC) and sulphide stress cracking (SSC). Non-metallic inclusions in steel are origi-nated from deoxidation, reoxidation, segregation and chemical reactions with the refractories.[8, 9]
Since mechanical properties and re-sistance to corrosion are influenced by the presence of defects in the steel, the objective of this paper is to estab-lish the type, size and distribution of non-metallic inclusions and dendritic structure across the cross-section of the continuous casting products, as well as their impact on tensile strength. The obtained results will serve in the subsequent thermal stress analyses, questioning whether the tempera-ture differences, appearing across the cross-section of the products heated in the rotary-hearth furnace, lead to ther-mal stresses which exceed the tensile strength of the final products and cause stress cracks in the structure. The in-vestigation methodology consists of testing the tensile strength of the specimens taken at different places of cross-section of cast products, as well as examinations of the microstructural features of steel structure and defects
243The effect of defects on tensile strength of the continuous steel casting products
RMZ-M&G 2011, 58
on the tested tensile specimens using optical microscope (OM) and scanning electron microscope (SEM) methods, respectively.
Materials and methods
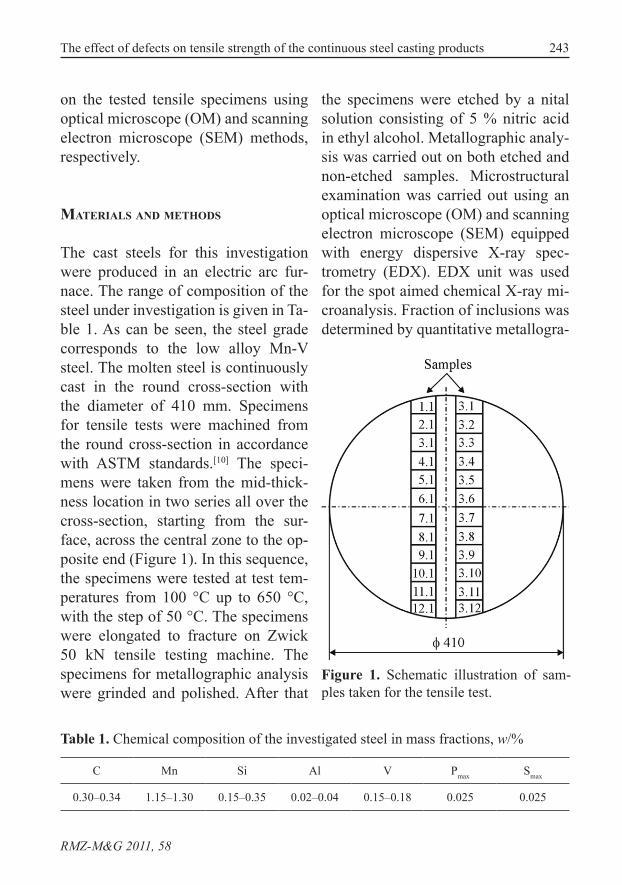
The cast steels for this investigation were produced in an electric arc fur-nace. The range of composition of the steel under investigation is given in Ta-ble 1. As can be seen, the steel grade corresponds to the low alloy Mn-V steel. The molten steel is continuously cast in the round cross-section with the diameter of 410 mm. Specimens for tensile tests were machined from the round cross-section in accordance with ASTM standards.[10] The speci-mens were taken from the mid-thick-ness location in two series all over the cross-section, starting from the sur-face, across the central zone to the op-posite end (Figure 1). In this sequence, the specimens were tested at test tem-peratures from 100 °C up to 650 °C, with the step of 50 °C. The specimens were elongated to fracture on Zwick 50 kN tensile testing machine. The specimens for metallographic analysis were grinded and polished. After that
the specimens were etched by a nital solution consisting of 5 % nitric acid in ethyl alcohol. Metallographic analy-sis was carried out on both etched and non-etched samples. Microstructural examination was carried out using an optical microscope (OM) and scanning electron microscope (SEM) equipped with energy dispersive X-ray spec-trometry (EDX). EDX unit was used for the spot aimed chemical X-ray mi-croanalysis. Fraction of inclusions was determined by quantitative metallogra-
Table 1. Chemical composition of the investigated steel in mass fractions, w/%
C Mn Si Al V Pmax Smax
0.30–0.34 1.15–1.30 0.15–0.35 0.02–0.04 0.15–0.18 0.025 0.025
Figure 1. Schematic illustration of sam-ples taken for the tensile test.
244 Gojić, M., Lazić, L., Kožuh, S., KoSec, L.
RMZ-M&G 2011, 58
phy method using optical microscopy Olympus BX61. There measurements were made on specimens from the outer and inner regions. Fractographic analysis of tensile test specimens after fracture was carried out using SEM.
Results and discussion
In order to remove the flawed layer produced by polishing and in order to
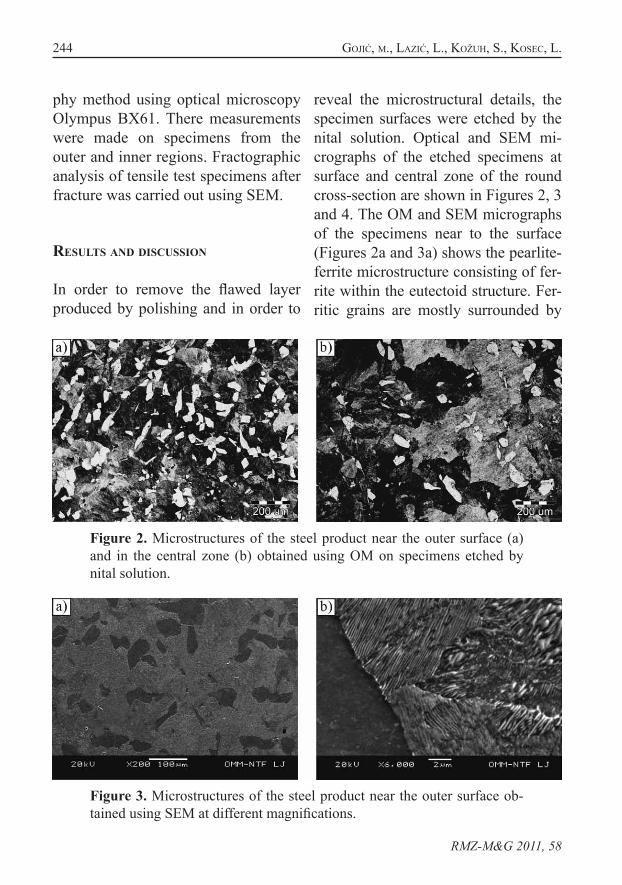
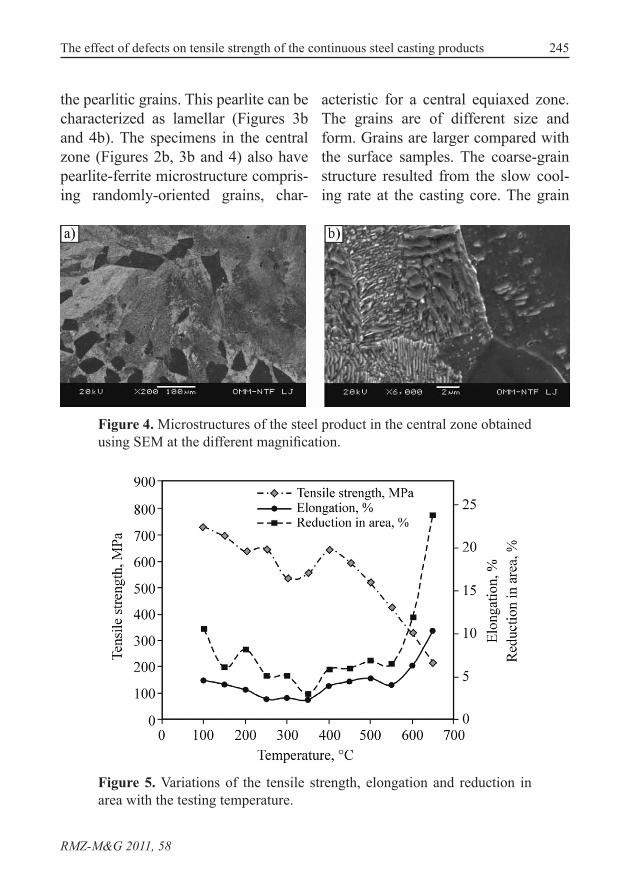
reveal the microstructural details, the specimen surfaces were etched by the nital solution. Optical and SEM mi-crographs of the etched specimens at surface and central zone of the round cross-section are shown in Figures 2, 3 and 4. The OM and SEM micrographs of the specimens near to the surface (Figures 2a and 3a) shows the pearlite-ferrite microstructure consisting of fer-rite within the eutectoid structure. Fer-ritic grains are mostly surrounded by
Figure 3. Microstructures of the steel product near the outer surface ob-tained using SEM at different magnifications.
Figure 2. Microstructures of the steel product near the outer surface (a) and in the central zone (b) obtained using OM on specimens etched by nital solution.
245The effect of defects on tensile strength of the continuous steel casting products
RMZ-M&G 2011, 58
Figure 4. Microstructures of the steel product in the central zone obtained using SEM at the different magnification.
the pearlitic grains. This pearlite can be characterized as lamellar (Figures 3b and 4b). The specimens in the central zone (Figures 2b, 3b and 4) also have pearlite-ferrite microstructure compris-ing randomly-oriented grains, char-
acteristic for a central equiaxed zone. The grains are of different size and form. Grains are larger compared with the surface samples. The coarse-grain structure resulted from the slow cool-ing rate at the casting core. The grain
Figure 5. Variations of the tensile strength, elongation and reduction in area with the testing temperature.
246 Gojić, M., Lazić, L., Kožuh, S., KoSec, L.
RMZ-M&G 2011, 58
Figure 6. Microstructures of the steel product near the outer surface (a) and in the central zone (b) obtained using OM on non-etched specimens.
Figure 7. Microstructures of the steel product at the ferrite/pearlite inter-face obtained using SEM (a) and elemental maps for aluminium (b), man-ganese (c) and sulphur (d).
247The effect of defects on tensile strength of the continuous steel casting products
RMZ-M&G 2011, 58
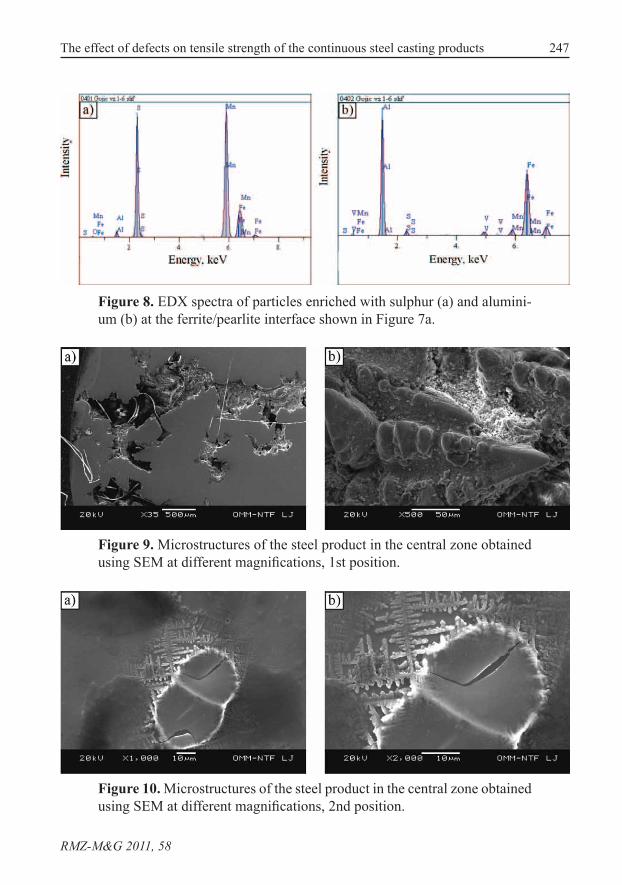
Figure 8. EDX spectra of particles enriched with sulphur (a) and alumini-um (b) at the ferrite/pearlite interface shown in Figure 7a.
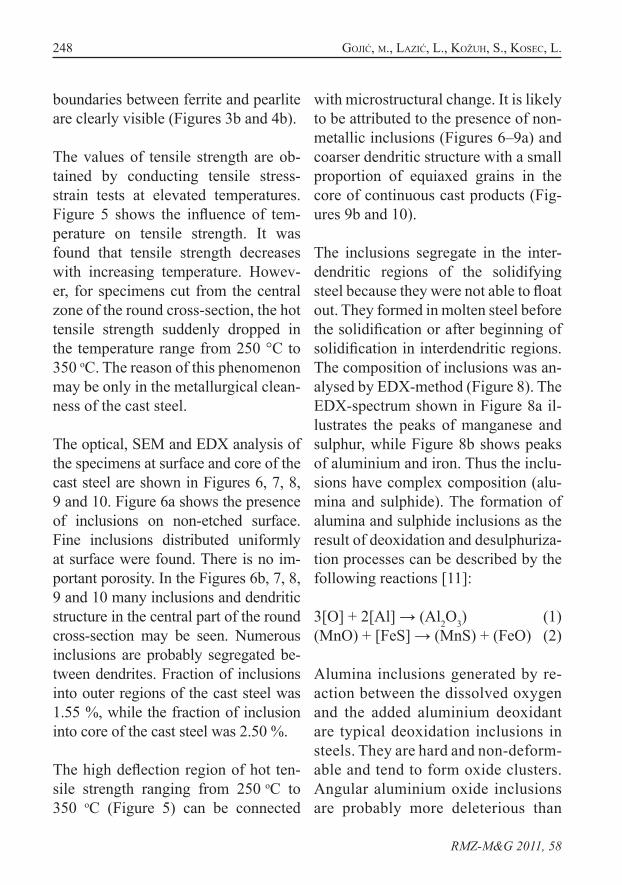
Figure 9. Microstructures of the steel product in the central zone obtained using SEM at different magnifications, 1st position.
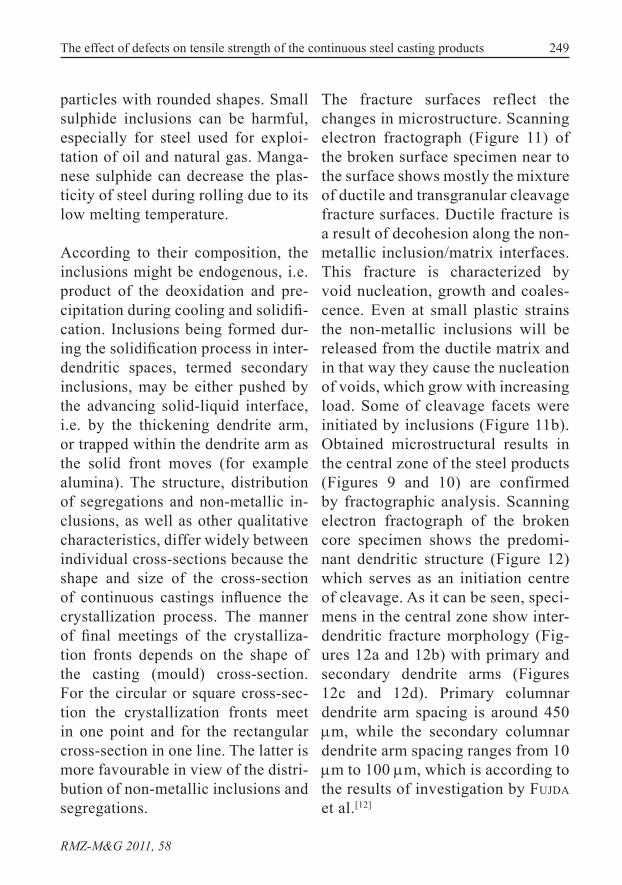
Figure 10. Microstructures of the steel product in the central zone obtained using SEM at different magnifications, 2nd position.
248 Gojić, M., Lazić, L., Kožuh, S., KoSec, L.
RMZ-M&G 2011, 58
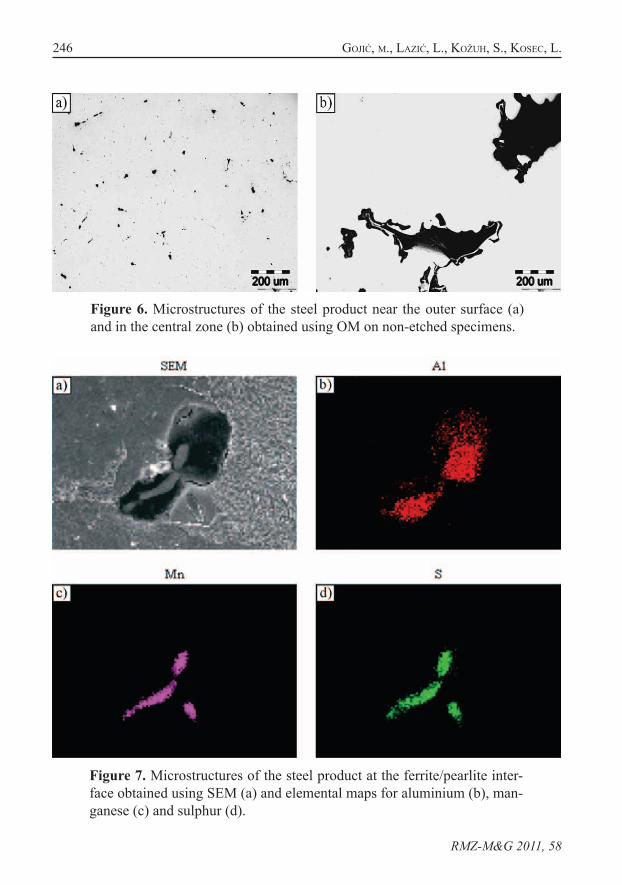
boundaries between ferrite and pearlite are clearly visible (Figures 3b and 4b). The values of tensile strength are ob-tained by conducting tensile stress-strain tests at elevated temperatures. Figure 5 shows the influence of tem-perature on tensile strength. It was found that tensile strength decreases with increasing temperature. Howev-er, for specimens cut from the central zone of the round cross-section, the hot tensile strength suddenly dropped in the temperature range from 250 °C to 350 oC. The reason of this phenomenon may be only in the metallurgical clean-ness of the cast steel. The optical, SEM and EDX analysis of the specimens at surface and core of the cast steel are shown in Figures 6, 7, 8, 9 and 10. Figure 6a shows the presence of inclusions on non-etched surface. Fine inclusions distributed uniformly at surface were found. There is no im-portant porosity. In the Figures 6b, 7, 8, 9 and 10 many inclusions and dendritic structure in the central part of the round cross-section may be seen. Numerous inclusions are probably segregated be-tween dendrites. Fraction of inclusions into outer regions of the cast steel was 1.55 %, while the fraction of inclusion into core of the cast steel was 2.50 %.
The high deflection region of hot ten-sile strength ranging from 250 oC to 350 oC (Figure 5) can be connected
with microstructural change. It is likely to be attributed to the presence of non-metallic inclusions (Figures 6–9a) and coarser dendritic structure with a small proportion of equiaxed grains in the core of continuous cast products (Fig-ures 9b and 10).
The inclusions segregate in the inter-dendritic regions of the solidifying steel because they were not able to float out. They formed in molten steel before the solidification or after beginning of solidification in interdendritic regions. The composition of inclusions was an-alysed by EDX-method (Figure 8). The EDX-spectrum shown in Figure 8a il-lustrates the peaks of manganese and sulphur, while Figure 8b shows peaks of aluminium and iron. Thus the inclu-sions have complex composition (alu-mina and sulphide). The formation of alumina and sulphide inclusions as the result of deoxidation and desulphuriza-tion processes can be described by the following reactions [11]:
3[O] + 2[Al] → (Al2O3) (1)(MnO) + [FeS] → (MnS) + (FeO) (2)
Alumina inclusions generated by re-action between the dissolved oxygen and the added aluminium deoxidant are typical deoxidation inclusions in steels. They are hard and non-deform-able and tend to form oxide clusters. Angular aluminium oxide inclusions are probably more deleterious than
249The effect of defects on tensile strength of the continuous steel casting products
RMZ-M&G 2011, 58
particles with rounded shapes. Small sulphide inclusions can be harmful, especially for steel used for exploi-tation of oil and natural gas. Manga-nese sulphide can decrease the plas-ticity of steel during rolling due to its low melting temperature.
According to their composition, the inclusions might be endogenous, i.e. product of the deoxidation and pre-cipitation during cooling and solidifi-cation. Inclusions being formed dur-ing the solidification process in inter-dendritic spaces, termed secondary inclusions, may be either pushed by the advancing solid-liquid interface, i.e. by the thickening dendrite arm, or trapped within the dendrite arm as the solid front moves (for example alumina). The structure, distribution of segregations and non-metallic in-clusions, as well as other qualitative characteristics, differ widely between individual cross-sections because the shape and size of the cross-section of continuous castings influence the crystallization process. The manner of final meetings of the crystalliza-tion fronts depends on the shape of the casting (mould) cross-section. For the circular or square cross-sec-tion the crystallization fronts meet in one point and for the rectangular cross-section in one line. The latter is more favourable in view of the distri-bution of non-metallic inclusions and segregations.
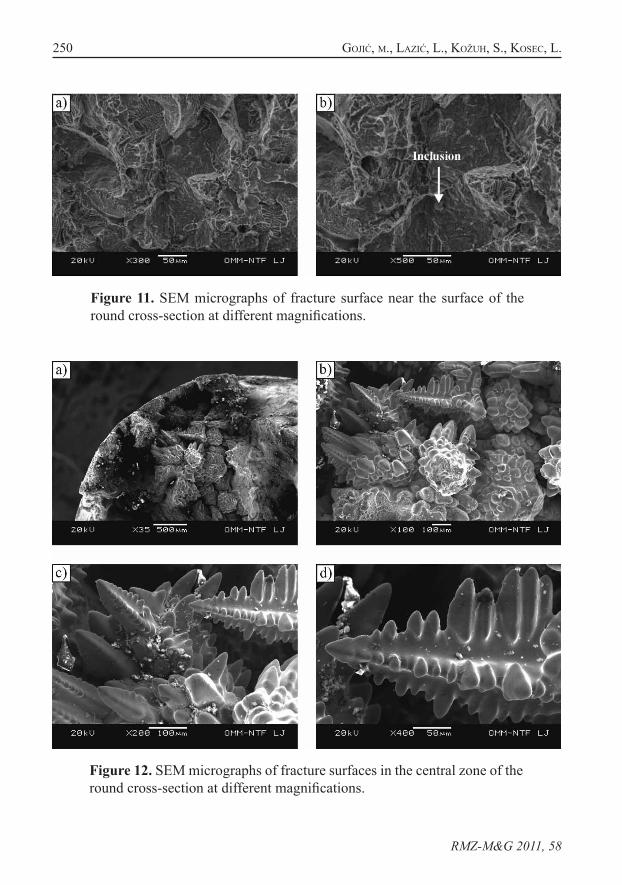
The fracture surfaces reflect the changes in microstructure. Scanning electron fractograph (Figure 11) of the broken surface specimen near to the surface shows mostly the mixture of ductile and transgranular cleavage fracture surfaces. Ductile fracture is a result of decohesion along the non-metallic inclusion/matrix interfaces. This fracture is characterized by void nucleation, growth and coales-cence. Even at small plastic strains the non-metallic inclusions will be released from the ductile matrix and in that way they cause the nucleation of voids, which grow with increasing load. Some of cleavage facets were initiated by inclusions (Figure 11b). Obtained microstructural results in the central zone of the steel products (Figures 9 and 10) are confirmed by fractographic analysis. Scanning electron fractograph of the broken core specimen shows the predomi-nant dendritic structure (Figure 12) which serves as an initiation centre of cleavage. As it can be seen, speci-mens in the central zone show inter-dendritic fracture morphology (Fig-ures 12a and 12b) with primary and secondary dendrite arms (Figures 12c and 12d). Primary columnar dendrite arm spacing is around 450 µm, while the secondary columnar dendrite arm spacing ranges from 10 µm to 100 µm, which is according to the results of investigation by Fujda et al.[12]
250 Gojić, M., Lazić, L., Kožuh, S., KoSec, L.
RMZ-M&G 2011, 58
Figure 11. SEM micrographs of fracture surface near the surface of the round cross-section at different magnifications.
Figure 12. SEM micrographs of fracture surfaces in the central zone of the round cross-section at different magnifications.
251The effect of defects on tensile strength of the continuous steel casting products
RMZ-M&G 2011, 58
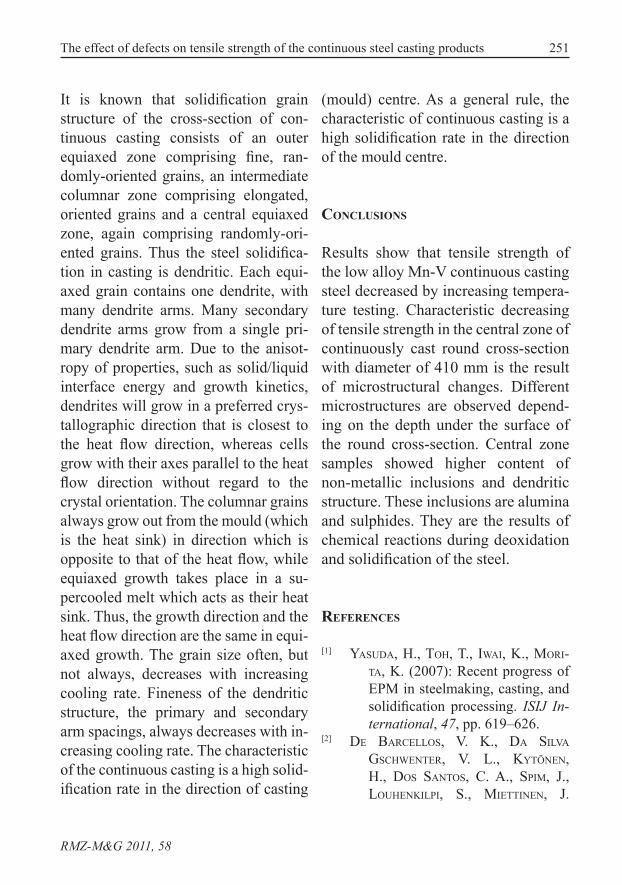
It is known that solidification grain structure of the cross-section of con-tinuous casting consists of an outer equiaxed zone comprising fine, ran-domly-oriented grains, an intermediate columnar zone comprising elongated, oriented grains and a central equiaxed zone, again comprising randomly-ori-ented grains. Thus the steel solidifica-tion in casting is dendritic. Each equi-axed grain contains one dendrite, with many dendrite arms. Many secondary dendrite arms grow from a single pri-mary dendrite arm. Due to the anisot-ropy of properties, such as solid/liquid interface energy and growth kinetics, dendrites will grow in a preferred crys-tallographic direction that is closest to the heat flow direction, whereas cells grow with their axes parallel to the heat flow direction without regard to the crystal orientation. The columnar grains always grow out from the mould (which is the heat sink) in direction which is opposite to that of the heat flow, while equiaxed growth takes place in a su-percooled melt which acts as their heat sink. Thus, the growth direction and the heat flow direction are the same in equi-axed growth. The grain size often, but not always, decreases with increasing cooling rate. Fineness of the dendritic structure, the primary and secondary arm spacings, always decreases with in-creasing cooling rate. The characteristic of the continuous casting is a high solid-ification rate in the direction of casting
(mould) centre. As a general rule, the characteristic of continuous casting is a high solidification rate in the direction of the mould centre.
Conclusions
Results show that tensile strength of the low alloy Mn-V continuous casting steel decreased by increasing tempera-ture testing. Characteristic decreasing of tensile strength in the central zone of continuously cast round cross-section with diameter of 410 mm is the result of microstructural changes. Different microstructures are observed depend-ing on the depth under the surface of the round cross-section. Central zone samples showed higher content of non-metallic inclusions and dendritic structure. These inclusions are alumina and sulphides. They are the results of chemical reactions during deoxidation and solidification of the steel.
References
[1] YaSuda, h., toh, t., iwai, K., Mori-ta, K. (2007): Recent progress of EPM in steelmaking, casting, and solidification processing. ISIJ In-ternational, 47, pp. 619–626.
[2] de BarceLLoS, v. K., da SiLva GSchwenter, v. L., Kytönen, h., doS SantoS, c. a., SPiM, j., LouhenKiLPi, S., Miettinen, j.
252 Gojić, M., Lazić, L., Kožuh, S., KoSec, L.
RMZ-M&G 2011, 58
(2010): Modelling of Heat Trans-fer, Dendrite Microstructure and Grain Size in Continuous Casting of Steels. Steel Research Int., 81, pp. 461–471.
[3] KitaMura, S. (2010): Importance of Kinetic Model in the Analysis of Steelmaking Reactions. Steel Re-search Int., 81, pp. 766–771.
[4] doMitner, j., Kharicha, a., GraSSer, M., LudwiG, a. (2010): Recon-struction of Three-Dimensional Dendritic Structures Based on the Investigation of Microsegregation Patterns. Steel Research Int., 81, pp. 644–651.
[5] JavureK, M., Barna, M., rocKen-SchauB, K., Lechner, M. (2008): Flow Modelling in Continuous Casting of Round Bloom Strands with Electromagnetical Stirring. Steel Research Int., 79, pp. 617–626.
[6] Gojić, M., KoSec, B., anžeL, i., Ko-Sec, L., PreLošćan, a. (2007): Hardenability of steels for oil in-dustry. Journal of Achievement in Materials and Manufacturing En-gineering, 23, pp. 23–26.
[7] Gojić, M., KoSec, L., MatKović, P. (2003): Embrittlement damage of low alloy Mn-V steel.Engineering Failure Analysis, 10, pp. 93–102.
[8] ThunMan, M., Sichen, d. (2008): Ori-gins of Non-metallic Inclusions and their Chemical Development during Ladle Treatment. Steel Re-search Int., 79, pp. 124–132.
[9] PfeiLer, c., thoMaS, B. G., wu, M., LudwiG, a., Kharicha, a. (2008): Solidification and Particle Entrap-ment during Continuous Casting of Steel. Steel Research Int., 79, pp. 599–607.
[10] ASTM, A370-94. Standard test meth-od and definitions for mechani-cal properties of steel products, ASME, New York, 1994.
[11] Gojić, M., Kožuh, S., KoSec, B. (2010): SEM and EDX analysis of continuous casting of steel. Acta Metallurgica Slovaca Conference-special issue, 15, pp. 235–237.
[12] Fujda, M., LonGauerová, M. (2006): Morphology of fine surface cracks on low carbon steel CC slab en-riched by copper. Acta Metallur-gica Slovaca, 12, pp. 243–249.
253
Original scientific paper
RMZ – Materials and Geoenvironment, Vol. 58, No. 3, pp. 253–258, 2011
An analysis of the quasi-chemical model of a ternary solution: On the counting of pairs
Analiza kvazikemičnega modela ternarne raztopine: O štetju parov
jiawen chen1, *
1University of Cambridge, Materials Science and Metallurgy, Cambridge CB2 3QZ, U. K.
*Corresponding author. E-mail: [email protected]
Received: September 5, 2011 Accepted: September 6, 2011
Abstract: The quasi-chemical model of a ternary solid solution was pro-posed in 1971 by Alex and McLellan. The model begins with the counting of different kinds of pairs between nearest atoms in a ternary crystal. The formulae of two pairs used in the model has been shown to be incorrect. A solution is suggested. A new quasi-chemical model of the solid solution developed from this work can be useful in physi-cal metallurgy.
Izvleček: Kvazikemični model ternarne trdne raztopine sta predlagala Alex in McLellan leta 1971. Začne se s štetjem različnih vrst parov med najbližjimi atomi v ternarnem kristalu. Prikazana je nepravilna for-mulacija dveh parov, uporabljenih v modelu, in predlagana pravilna rešitev. Nov kvazikemični model za trdne raztopine, razvit v tem delu, je lahko uporaben v fizikalni metalurgiji.
Key words: theory; statistical mechanics; ferritic steelsKljučne besede: teorija, statistična mehanika, feritna jekla
introduction
A statistical treatment of ternary met-als, e.g. Fe-Mn(Cr,Al)-C(N,H) or Nb-
Ti(V,Mo,Zr,Ta)-O(C,N), can yield thermodynamic properties which could be diffcult to obtain experimentally. As an example, the carbon-carbon interac-
254 chen, j.
RMZ-M&G 2011, 58
tion energy in the ferrite phase in steel can be calculated by fitting the experi-mentally determined Gibbs free energy to a function deduced from a simple quasi-chemical model.[1, 2] Many re-cent publications[3, 4] use data that are derived from the quasi-chemical model of a ternary system proposed by ALex & McLeLLan.[5] The current work dem-onstrates a fundamental problem in the model and suggests a solution, which will lead to a correct quasi-chemical model of the ternary system.
A solid phase of two or more kinds of atoms is a solid solution. The forces between the atoms in solid solution are short-ranged. Guggenheim showed that the second nearest neighbour inter-action energy is negligible, if it varies as r–6.[6] Most solution models consider only the nearest neighbour interactions.
The energy of a solid solution is the sum of the interaction energy of all kinds of pairs. Let us consider a binary model containing A and B atoms, and we in-terchange an A atom and a B atom on any two sites. Whatever the initial ar-rangement around the two sites, if the number of A-A pairs increases or de-creases by N, then the number of B-B pairs will change by the same amount N, and the number of A-B pairs will change by –2N. Therefore, the proper-ties of the solid solution depends only on the change of combined energyN(eAA + eBB – 2eAB)
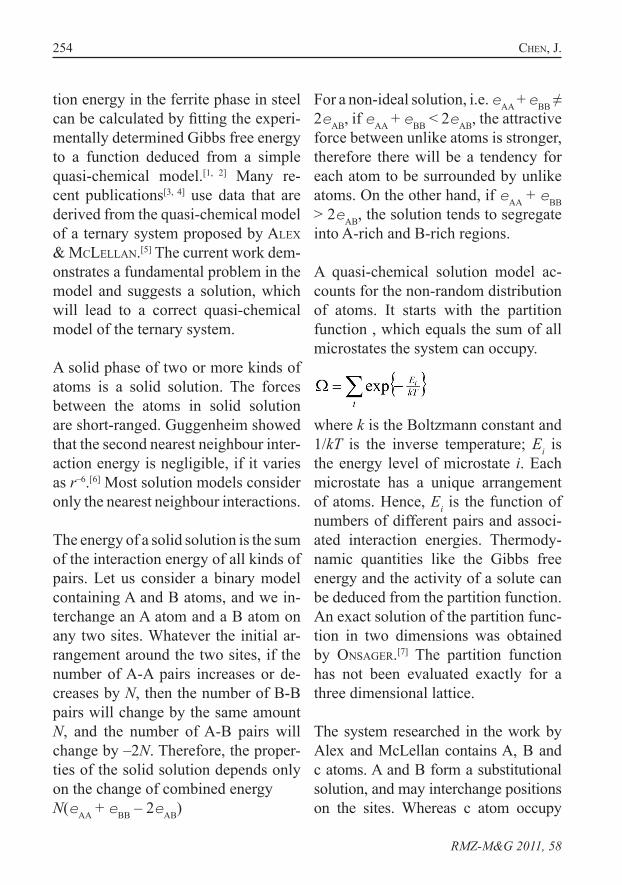
For a non-ideal solution, i.e. eAA + eBB ≠ 2eAB, if eAA + eBB < 2eAB, the attractive force between unlike atoms is stronger, therefore there will be a tendency for each atom to be surrounded by unlike atoms. On the other hand, if eAA + eBB > 2eAB, the solution tends to segregate into A-rich and B-rich regions.
A quasi-chemical solution model ac-counts for the non-random distribution of atoms. It starts with the partition function , which equals the sum of all microstates the system can occupy.
where k is the Boltzmann constant and 1/kT is the inverse temperature; Ei is the energy level of microstate i. Each microstate has a unique arrangement of atoms. Hence, Ei is the function of numbers of different pairs and associ-ated interaction energies. Thermody-namic quantities like the Gibbs free energy and the activity of a solute can be deduced from the partition function. An exact solution of the partition func-tion in two dimensions was obtained by onSaGer.[7] The partition function has not been evaluated exactly for a three dimensional lattice.
The system researched in the work by Alex and McLellan contains A, B and c atoms. A and B form a substitutional solution, and may interchange positions on the sites. Whereas c atom occupy
255An analysis of the quasi-chemical model of a ternary solution: On the counting of pairs
RMZ-M&G 2011, 58
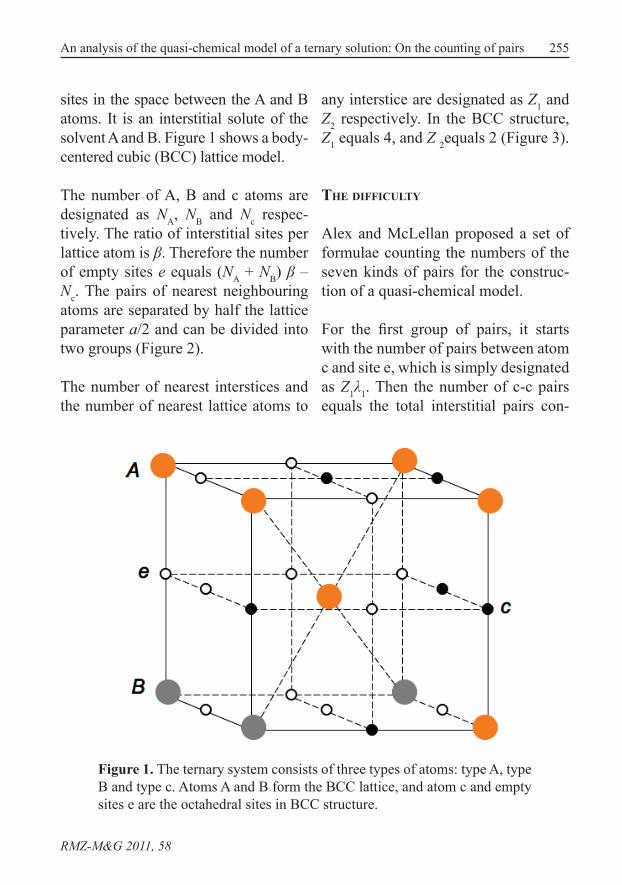
sites in the space between the A and B atoms. It is an interstitial solute of the solvent A and B. Figure 1 shows a body-centered cubic (BCC) lattice model.
The number of A, B and c atoms are designated as NA, NB and Nc respec-tively. The ratio of interstitial sites per lattice atom is β. Therefore the number of empty sites e equals (NA + NB) β – Nc. The pairs of nearest neighbouring atoms are separated by half the lattice parameter a/2 and can be divided into two groups (Figure 2).
The number of nearest interstices and the number of nearest lattice atoms to
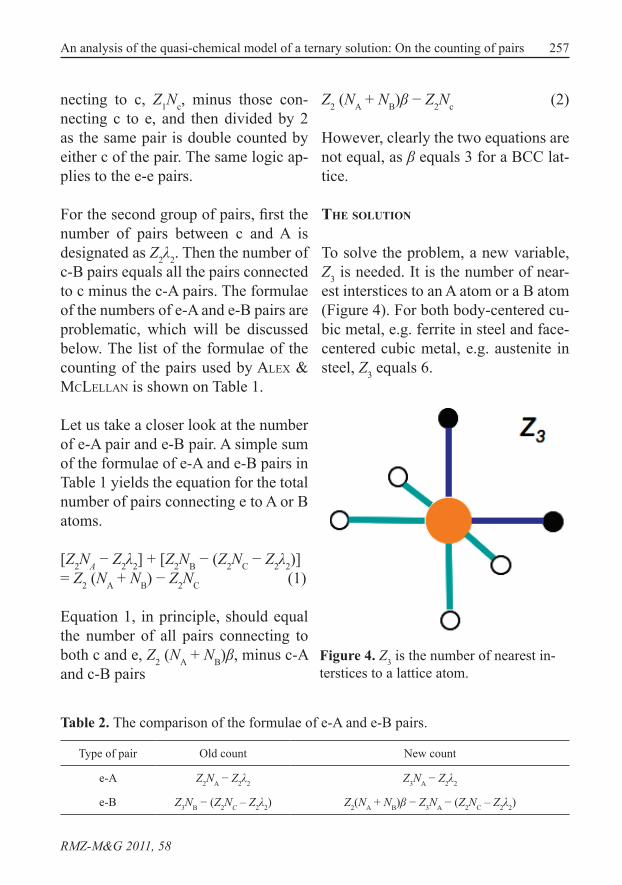
any interstice are designated as Z1 and Z2 respectively. In the BCC structure, Z1 equals 4, and Z 2equals 2 (Figure 3).
the difficulty
Alex and McLellan proposed a set of formulae counting the numbers of the seven kinds of pairs for the construc-tion of a quasi-chemical model.
For the first group of pairs, it starts with the number of pairs between atom c and site e, which is simply designated as Z1λ1. Then the number of c-c pairs equals the total interstitial pairs con-
Figure 1. The ternary system consists of three types of atoms: type A, type B and type c. Atoms A and B form the BCC lattice, and atom c and empty sites e are the octahedral sites in BCC structure.
256 chen, j.
RMZ-M&G 2011, 58
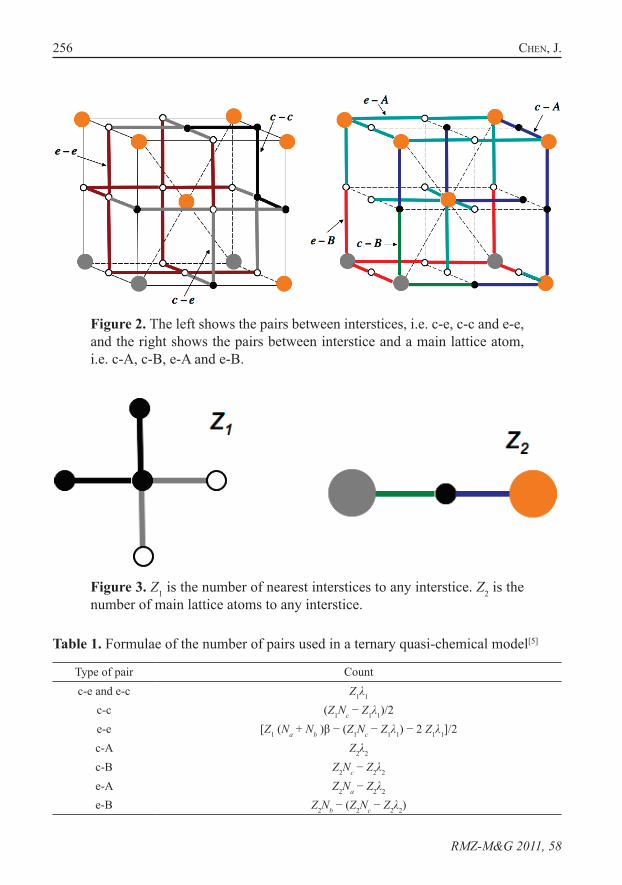
Figure 2. The left shows the pairs between interstices, i.e. c-e, c-c and e-e, and the right shows the pairs between interstice and a main lattice atom, i.e. c-A, c-B, e-A and e-B.
Figure 3. Z1 is the number of nearest interstices to any interstice. Z2 is the number of main lattice atoms to any interstice.
Table 1. Formulae of the number of pairs used in a ternary quasi-chemical model[5]
Type of pair Countc-e and e-c Z1λ1
c-c (Z1Nc − Z1λ1)/2e-e [Z1 (Na + Nb )β − (Z1Nc − Z1λ1) − 2 Z1λ1]/2c-A Z2λ2
c-B Z2Nc − Z2λ2
e-A Z2Na − Z2λ2
e-B Z2Nb − (Z2Nc − Z2λ2)
257An analysis of the quasi-chemical model of a ternary solution: On the counting of pairs
RMZ-M&G 2011, 58
necting to c, Z1Nc, minus those con-necting c to e, and then divided by 2 as the same pair is double counted by either c of the pair. The same logic ap-plies to the e-e pairs.
For the second group of pairs, first the number of pairs between c and A is designated as Z2λ2. Then the number of c-B pairs equals all the pairs connected to c minus the c-A pairs. The formulae of the numbers of e-A and e-B pairs are problematic, which will be discussed below. The list of the formulae of the counting of the pairs used by aLex & McLeLLan is shown on Table 1.
Let us take a closer look at the number of e-A pair and e-B pair. A simple sum of the formulae of e-A and e-B pairs in Table 1 yields the equation for the total number of pairs connecting e to A or B atoms.
[Z2NA − Z2λ2] + [Z2NB − (Z2NC − Z2λ2)] = Z2 (NA + NB) − Z2NC (1)
Equation 1, in principle, should equal the number of all pairs connecting to both c and e, Z2 (NA + NB)β, minus c-A and c-B pairs
Z2 (NA + NB)β − Z2Nc (2)
However, clearly the two equations are not equal, as β equals 3 for a BCC lat-tice.
the solution
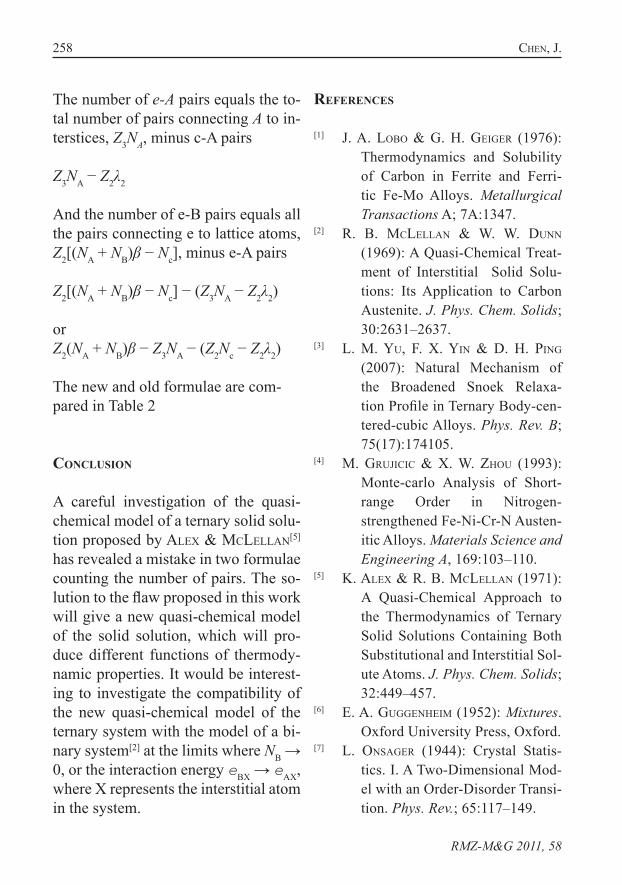
To solve the problem, a new variable, Z3 is needed. It is the number of near-est interstices to an A atom or a B atom (Figure 4). For both body-centered cu-bic metal, e.g. ferrite in steel and face-centered cubic metal, e.g. austenite in steel, Z3 equals 6.
Figure 4. Z3 is the number of nearest in-terstices to a lattice atom.
Table 2. The comparison of the formulae of e-A and e-B pairs.
Type of pair Old count New count
e-A Z2NA − Z2λ2 Z3NA − Z2λ2
e-B Z3NB − (Z2NC – Z2λ2) Z2(NA + NB)β − Z3NA − (Z2NC – Z2λ2)
258 chen, j.
RMZ-M&G 2011, 58
The number of e-A pairs equals the to-tal number of pairs connecting A to in-terstices, Z3NA, minus c-A pairs
Z3NA − Z2λ2
And the number of e-B pairs equals all the pairs connecting e to lattice atoms, Z2[(NA + NB)β − Nc], minus e-A pairs
Z2[(NA + NB)β − Nc] − (Z3NA − Z2λ2)
orZ2(NA + NB)β − Z3NA − (Z2Nc − Z2λ2)
The new and old formulae are com-pared in Table 2
conclusion
A careful investigation of the quasi-chemical model of a ternary solid solu-tion proposed by aLex & McLeLLan[5] has revealed a mistake in two formulae counting the number of pairs. The so-lution to the flaw proposed in this work will give a new quasi-chemical model of the solid solution, which will pro-duce different functions of thermody-namic properties. It would be interest-ing to investigate the compatibility of the new quasi-chemical model of the ternary system with the model of a bi-nary system[2] at the limits where NB → 0, or the interaction energy eBX → eAX, where X represents the interstitial atom in the system.
references
[1] j. a. LoBo & G. h. GeiGer (1976): Thermodynamics and Solubility of Carbon in Ferrite and Ferri-tic Fe-Mo Alloys. Metallurgical Transactions A; 7A:1347.
[2] r. B. McLeLLan & w. w. dunn (1969): A Quasi-Chemical Treat-ment of Interstitial Solid Solu-tions: Its Application to Carbon Austenite. J. Phys. Chem. Solids; 30:2631–2637.
[3] L. M. yu, f. x. yin & d. h. PinG (2007): Natural Mechanism of the Broadened Snoek Relaxa-tion Profile in Ternary Body-cen-tered-cubic Alloys. Phys. Rev. B; 75(17):174105.
[4] M. Grujicic & x. w. zhou (1993): Monte-carlo Analysis of Short-range Order in Nitrogen- strengthened Fe-Ni-Cr-N Austen-itic Alloys. Materials Science and Engineering A, 169:103–110.
[5] K. aLex & r. B. McLeLLan (1971): A Quasi-Chemical Approach to the Thermodynamics of Ternary Solid Solutions Containing Both Substitutional and Interstitial Sol-ute Atoms. J. Phys. Chem. Solids; 32:449–457.
[6] e. a. GuGGenheiM (1952): Mixtures. Oxford University Press, Oxford.
[7] L. onSaGer (1944): Crystal Statis-tics. I. A Two-Dimensional Mod-el with an Order-Disorder Transi-tion. Phys. Rev.; 65:117–149.
259
Original scientific paper
RMZ – Materials and Geoenvironment, Vol. 58, No. 3, pp. 259–272, 2011
Finite element solution strategy to analyze heterogeneous structures
Strategija analize heterogenih struktur z metodo končnih elementov
Martin LaMut
1CO Vesolje-SI, Aškerčeva 12, 1000 Ljubljana, Slovenia
*Corresponding author. E-mail: [email protected]
Received: September 19, 2011 Accepted: November 2, 2011
Abstract: In this contribution a general strategy for solving a coupled mi-cro-macro problems is presented which enables analyses of modern heterogeneous materials. It provides an efficient problem solving tool to structures with complex microstructures, used in a demand-ing structural components. The method uses a nested finite element solution strategy called multilevel finite element approach-ML-FEM. Within the ML-FEM framework one conducts an embedded micro-scale computation in order to obtain quantities required at the mac-roscopic level. The application of ML-FEM circumvents the need to construct an explicit macroscale constitution formulation, considering increased computational costs. Increased computation is linked to de-tailed microscopic analysis for which the statistical representative volume element-RVE is needed. RVE will be derived based on the convergence criterion. In this work a general method for calcu-lation of the consistent macroscopic stiffness matrix via sensitivity analysis of a micro level is shown. As an example the proposed meth-od is applied on a simple test specimen under compression consisting microstructures with porosities and stiff inclusions.
Povzetek: V tem delu je bila razvita splošna strategija za reševanje vezanih mikro-makro sodobnih heterogenih materialov. Strategija je učinko-vito orodje pri reševanju problemov s kompleksno mikrostrukturo, uporabljeno v zahtevnih inženirskih komponentah. Strategija upo-rablja večnivojski način reševanja problemov, kjer na mikroskopski in makroskopski ravni poteka analiza z metodo končnih elementov
260 LaMut, M.
RMZ-M&G 2011, 58
(ML-FEM). Pri tej metodi reševanja makroskopska konstitutivna zveza ni več potrebna, saj je le-ta na račun povečanega računskega časa pridobljena z natančno mikroskopsko analizo. Ta je izvedena na statističnem reprezentativnem volumnu (RVE), katerega velikost do-ločimo s konvergenčnim merilom. Metoda je splošen način reševanja makroskopske togostne matrike preko občutljivostne analize mikro-skopskega nivoja. Lastnosti metode so bile preizkušene na enostav-nem tlačnem preizkusu za porozno mikrostrukturo in mikrostrukturo s togimi vključki.
Keywords: Heterogeneous materials, multiscale analysis, macroscopic tan-gent computation, sensitivity analysis
Ključne besede: heterogeni materiali, mikro-makro analize, makroskopska togost, občutljivostna analiza
introduction
Heterogeneous materials used in engi-neering sciences have physical prop-erties that vary throughout their mi-crostructures. Heterogeneities, such as inclusions, pores, fibers and grain boundaries, have a significant impact on the observed macroscopic behavior of multi-phase materials. In engineer-ing some typical examples are metal alloy systems, various composites, po-rous and cracked structures, polymeric blends and polycrystalline materials.
To describe the macroscopic overall characteristics of heterogeneous struc-tures is a vital problem in many engi-neering applications. The ability to con-vey information across length scales is essential for a better understanding of the sources of physical behavior observed on higher scales. Using mi-
cromechanical models of the micro-structural elements, homogenization techniques allow an efficient and cor-rect transfer of microscale information to the macroscale analysis. The funda-mental methodology of homogeniza-tion is the characterization of the mac-roscopic behavior of the heterogeneous material by appropriately identifying and testing a statistically representa-tive micromechanical sample. Once an appropriate sample is identified it can be used in the multiscale analysis methodology. The most straightfor-ward way is to use the multilevel finite element method ML-FEM[1–5]. When analyses at both levels are made in the context of FEM, it can be referred to as the FE2 method[6, 7]. The application of ML-FEM circumvents the need to construct an explicit macroscale con-stitution formulation, though at an in-creased computational cost. The con-
261Finite element solution strategy to analyze heterogeneous structures
RMZ-M&G 2011, 58
nique based on a sensitivity analysis of a microscopic level will be presented.
methods
Numerical RVE sizeIn order to estimate the effective prop-erties of heterogeneous material, most of the micro-macro methods assume the existence of a micromechanical sample that is statistically representa-tive of the microstructural features. The usual approach[8] is to determine a relation between averages, E*, defined through . Here σ and ε are the stress and strain fields within a statistically representative volume element. The RVE is considered both smaller enough than the macro scale media and bigger enough than the het-erogeneities on the micro scale, with-out introducing non-existing properties (e.g. anisotropy).
In this contribution, macroscopically isotropic materials are considered, therefore the two linear elastic con-stants (bulk and shear moduli) describ-ing the form of E*can be computed us-ing:
(1.1)
stitutive equations are written only on microscopic scale and homogenisation and localization equations are used to compute the macroscopic strains and stresses knowing the mechanical state at microscopic level.
By analyzing the engineering structure, the point of interest is usually localized in the so called critical region, where detailed analyses are needed. So to fur-ther increase the efficiency of the com-putation the structure can be divided into subdomains, critical region and the rest of the structure. In the critical region an embedded ML-FEM compu-tation is conducted, while elsewhere a classical homogenization technique is used. In either case a statistical mi-cromechanical model or representative volume element (RVE) will be needed.
The purpose of this contribution is mainly two fold. First, the statisti-cal RVE size will be derived based on convergence criterion of the several parameters being monitored. The sec-ond purpose of this work tackles the efficiency of multilevel computation. Since a conventional way of macro-scopic tangent computation in a con-densation procedure, necessitate the computation of a Shur complement. It inflicts for increasingly complex microstructure higher memory alloca-tion demands that may not be met by today’s computers. Therefore, as an al-ternative, a tangent computation tech-
262 LaMut, M.
RMZ-M&G 2011, 58
where σ’ and ε’ denotes the deviatoric part. Macroscopically isotropic het-erogeneous structure is achieved by random particle distribution at the mi-croscale. Therefore, for a given sample size, multiple distributions of parti-cles are possible. In order to capture a statistical measure of the range of re-sponses from different distributions, a simple averaging of three samples per RVE size was used.
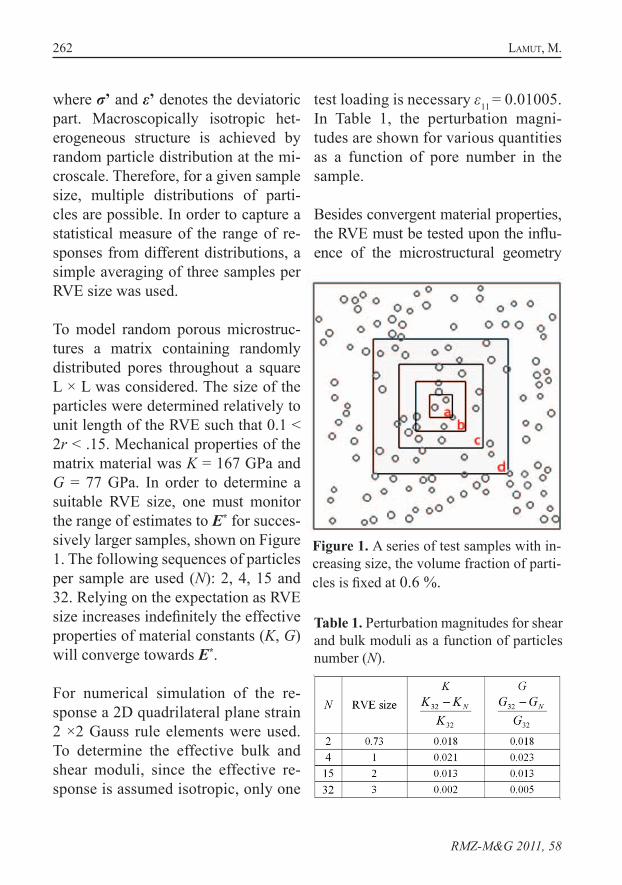
To model random porous microstruc-tures a matrix containing randomly distributed pores throughout a square L × L was considered. The size of the particles were determined relatively to unit length of the RVE such that 0.1 < 2r < .15. Mechanical properties of the matrix material was K = 167 GPa and G = 77 GPa. In order to determine a suitable RVE size, one must monitor the range of estimates to E* for succes-sively larger samples, shown on Figure 1. The following sequences of particles per sample are used (N): 2, 4, 15 and 32. Relying on the expectation as RVE size increases indefinitely the effective properties of material constants (K, G) will converge towards E*.
For numerical simulation of the re-sponse a 2D quadrilateral plane strain 2 ×2 Gauss rule elements were used. To determine the effective bulk and shear moduli, since the effective re-sponse is assumed isotropic, only one
test loading is necessary ε11 = 0.01005. In Table 1, the perturbation magni-tudes are shown for various quantities as a function of pore number in the sample.
Besides convergent material properties, the RVE must be tested upon the influ-ence of the microstructural geometry
Figure 1. A series of test samples with in-creasing size, the volume fraction of parti-cles is fixed at 0.6 %.
Table 1. Perturbation magnitudes for shear and bulk moduli as a function of particles number (N).
263Finite element solution strategy to analyze heterogeneous structures
RMZ-M&G 2011, 58
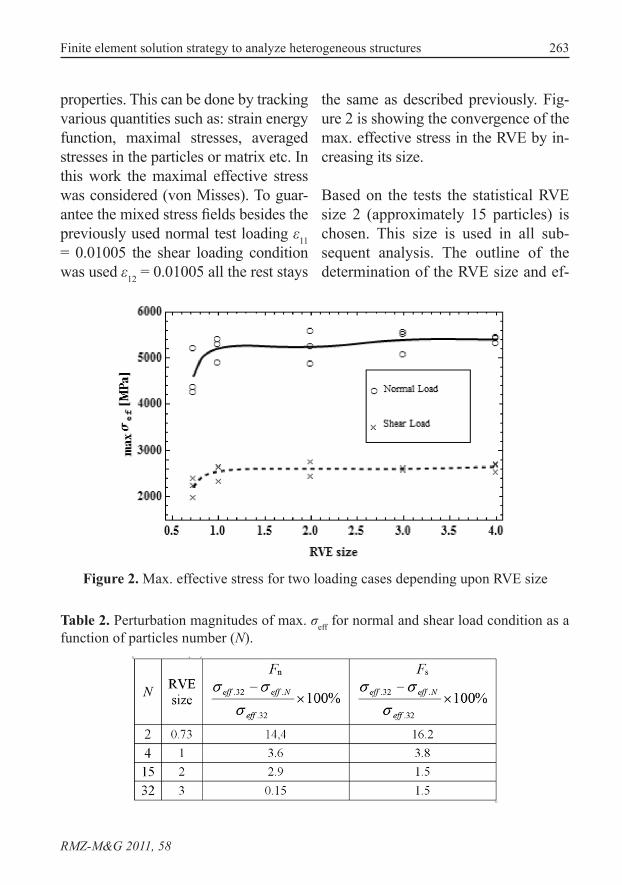
properties. This can be done by tracking various quantities such as: strain energy function, maximal stresses, averaged stresses in the particles or matrix etc. In this work the maximal effective stress was considered (von Misses). To guar-antee the mixed stress fields besides the previously used normal test loading ε11 = 0.01005 the shear loading condition was used ε12 = 0.01005 all the rest stays
the same as described previously. Fig-ure 2 is showing the convergence of the max. effective stress in the RVE by in-creasing its size.
Based on the tests the statistical RVE size 2 (approximately 15 particles) is chosen. This size is used in all sub-sequent analysis. The outline of the determination of the RVE size and ef-
Figure 2. Max. effective stress for two loading cases depending upon RVE size
Table 2. Perturbation magnitudes of max. σeff for normal and shear load condition as a function of particles number (N).
264 LaMut, M.
RMZ-M&G 2011, 58
fective material constants are made for particles representing voids. The same procedures are used to determine the size and effective material constants also for microstructure with stiff inclu-sions. All the values are given in the Results & discussion section.
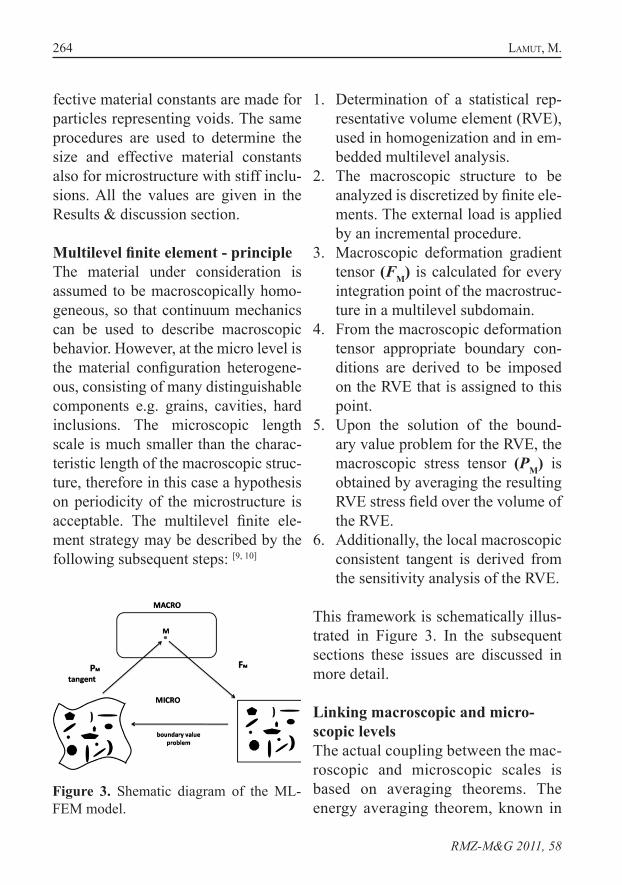
Multilevel finite element - principleThe material under consideration is assumed to be macroscopically homo-geneous, so that continuum mechanics can be used to describe macroscopic behavior. However, at the micro level is the material configuration heterogene-ous, consisting of many distinguishable components e.g. grains, cavities, hard inclusions. The microscopic length scale is much smaller than the charac-teristic length of the macroscopic struc-ture, therefore in this case a hypothesis on periodicity of the microstructure is acceptable. The multilevel finite ele-ment strategy may be described by the following subsequent steps: [9, 10]
1. Determination of a statistical rep-resentative volume element (RVE), used in homogenization and in em-bedded multilevel analysis.
2. The macroscopic structure to be analyzed is discretized by finite ele-ments. The external load is applied by an incremental procedure.
3. Macroscopic deformation gradient tensor (FM) is calculated for every integration point of the macrostruc-ture in a multilevel subdomain.
4. From the macroscopic deformation tensor appropriate boundary con-ditions are derived to be imposed on the RVE that is assigned to this point.
5. Upon the solution of the bound-ary value problem for the RVE, the macroscopic stress tensor (PM) is obtained by averaging the resulting RVE stress field over the volume of the RVE.
6. Additionally, the local macroscopic consistent tangent is derived from the sensitivity analysis of the RVE.
This framework is schematically illus-trated in Figure 3. In the subsequent sections these issues are discussed in more detail.
Linking macroscopic and micro-scopic levelsThe actual coupling between the mac-roscopic and microscopic scales is based on averaging theorems. The energy averaging theorem, known in
Figure 3. Shematic diagram of the ML-FEM model.

265Finite element solution strategy to analyze heterogeneous structures
RMZ-M&G 2011, 58
the literature as the Hill condition or macrohomogeneity condition[11, 12], requires that the macroscopic vol-ume average of the variation of work performed on the RVE is equal to the local variation of the work on the macroscale. Formulated in terms of a deformation gradient tensor and the first Piola-Kirchhoff stress tensor, the work criterion in differential form is written:
(2.1)
In words, this equality states that in the transition from the microscopic scale to the macroscopic scale, energy is conserved.
It is well known that this criterion is not satisfied for arbitrary boundary conditions (BC) applied to the RVE. Classically three types of RVE bound-ary conditions are used, i.e. prescribed displacements, prescribed tractions and prescribed periodicity. Periodicity here is referring on an assumption on global periodicity of the microstructure, sug-gesting that the whole macroscopic
specimen consists of spatially repeated unit cells. Among them the periodic BCs show a more reasonable estima-tion of the effective properties. This was supported and justified by numbers of authors[13–16]. The periodicity condi-tions for the microstructural RVE are written in a general format as:
(2.2)
where x and X represents the actual
and initial position vector and p the boundary traction of the RVE. In the equation (2.1) the macroscopic first Pi-ola-Kirchhoff stress tensor (PM) and the macroscopic deformation gradient ten-sor (FM) are the fundamental kinetical and kinematical measures which are de-fined in terms of the volume average of their microscopic counterparts. Every time that the work criterion is satisfied, the volume average of the macroscopic above mentioned measures can be ob-tained through the knowledge of bound-ary information only.
(2.3)
(2.4)
266 LaMut, M.
RMZ-M&G 2011, 58
Here, VRVE is undeformed RVE, Pm and Fm are microscopic stress tensor and deformation gradient tensor, re-spectively, Γ represents the bound-
ary of the RVE, while N represents the normal vector to the surface of RVE.
Macroscopic tangent computation In the realization of the multilevel FEM approach, the macroscopic con-stitutive formulation is not explicitly obtained from the experimental data. Instead, the needed stiffness matrix at every macroscopic integration point has to be determined directly from the numerical relation of the macroscopic stress (PM) and macroscopic deforma-tion gradient (FM) at that point[15, 17,
18]. The weak form of the macroscale problem in the absence of body forces and acceleration can be written in vari-ational form as:
(2.5)
To solve the macroscopic primal problem within ML-FEM setting, at i-th iteration step of a standard New-ton-Raphson solution scheme, the following linearization needs to be computed.
The macrolevel element tangent stiff-ness matrix and the residual force vec-tor can be obtained with the knowl-edge of the stress (PM) and macro-scopic tangent ( MM F/P ∂∂ ) obtained from the RVE analysis, since FM is ex-plicit function of node displacements. The (PM) can be obtained directly from RVE analysis by using averag-ing theorem equation (2.4), while for the determination of the macroscopic tangent a RVE sensitivity analysis is performed. For the sensitivity prob-lem[19] the residuals and the vector of unknowns are defined as a function of sensitivity parameters, which are in this case the elements of tensor (FM). The sensitivity problem can then be obtained from the primal problem by differentiating the response functional and the residuals with respect to mac-roscopic deformation gradient (FM), and the following system on the mi-crolevel has to be solved:
(2.7)
where, Ψm represents response func-tional on the microlevel, a is a set of unknowns (displacements), while ϕ represents arbitrary sensitivity param-eter in our case FM.
(2.6)
267Finite element solution strategy to analyze heterogeneous structures
RMZ-M&G 2011, 58
With the assembling of the macroscop-ic stiffness matrix is the problem on the macro level fully described and can be solved to produce an update of the macroscopic displacement field.
Remark 1: for consistency the particu-lar type of BC employed for the comp. of K must match the type of BC em-ployed in the computation of P.
results & discussion
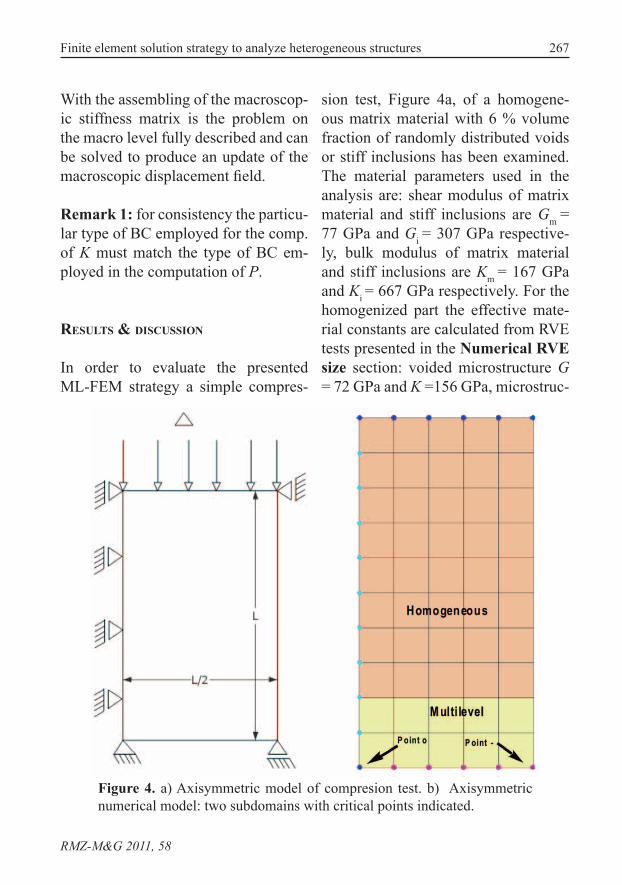
In order to evaluate the presented ML-FEM strategy a simple compres-
sion test, Figure 4a, of a homogene-ous matrix material with 6 % volume fraction of randomly distributed voids or stiff inclusions has been examined. The material parameters used in the analysis are: shear modulus of matrix material and stiff inclusions are Gm = 77 GPa and Gi = 307 GPa respective-ly, bulk modulus of matrix material and stiff inclusions are Km = 167 GPa and Ki = 667 GPa respectively. For the homogenized part the effective mate-rial constants are calculated from RVE tests presented in the Numerical RVE size section: voided microstructure G = 72 GPa and K =156 GPa, microstruc-
Figure 4. a) Axisymmetric model of compresion test. b) Axisymmetric numerical model: two subdomains with critical points indicated.
268 LaMut, M.
RMZ-M&G 2011, 58
ture with stiff inclusions G = 90 GPa and K = 194 GPa. On the macroscopic level a 2D quadrilateral plane strain 2 × 2 Gauss rule elements were used. Load was applied incrementally: load displacements Δ = 1 unit relative to L. The multilevel algorithm has been implemented into computer program AceFEM[20], where a special macro-scopic element can be readily defined in open source code.
Figure 4b shows a discretized numeri-cal model where the homogenized and multilevel subdomains are clearly in-dicated. In the later, two critical points are marked where a detailed RVE anal-ysis has been done. From Figure 4b a
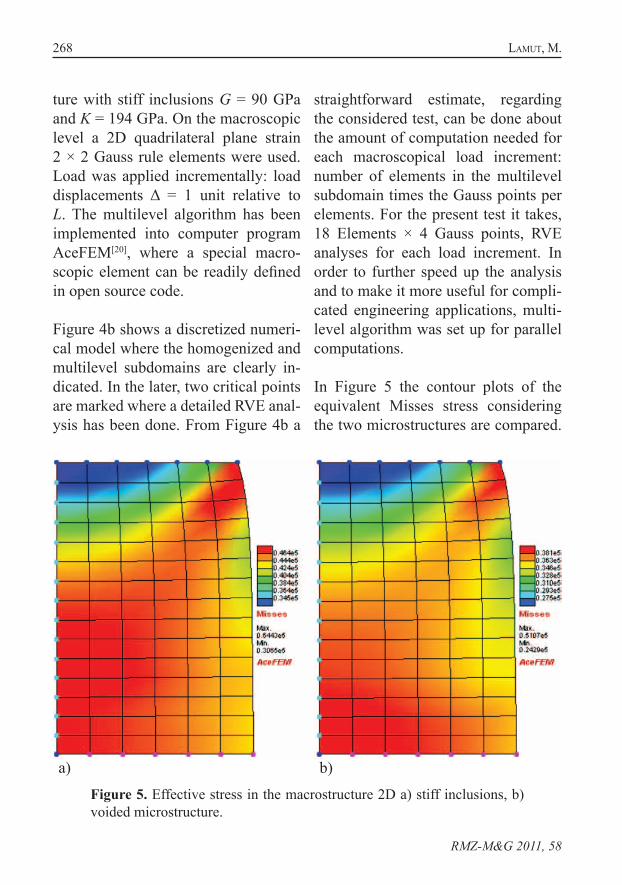
straightforward estimate, regarding the considered test, can be done about the amount of computation needed for each macroscopical load increment: number of elements in the multilevel subdomain times the Gauss points per elements. For the present test it takes, 18 Elements × 4 Gauss points, RVE analyses for each load increment. In order to further speed up the analysis and to make it more useful for compli-cated engineering applications, multi-level algorithm was set up for parallel computations.
In Figure 5 the contour plots of the equivalent Misses stress considering the two microstructures are compared.
Figure 5. Effective stress in the macrostructure 2D a) stiff inclusions, b) voided microstructure.
a) b)
269Finite element solution strategy to analyze heterogeneous structures
RMZ-M&G 2011, 58
As expected the microstructure with stiff inclusions produces higher stress-es but the interesting point is that the contour plots are not the same which would be the case for completely ho-mogenized structure. The influence of more realistic model on the micro-scopic level is clearly visible even in a simple case considered.
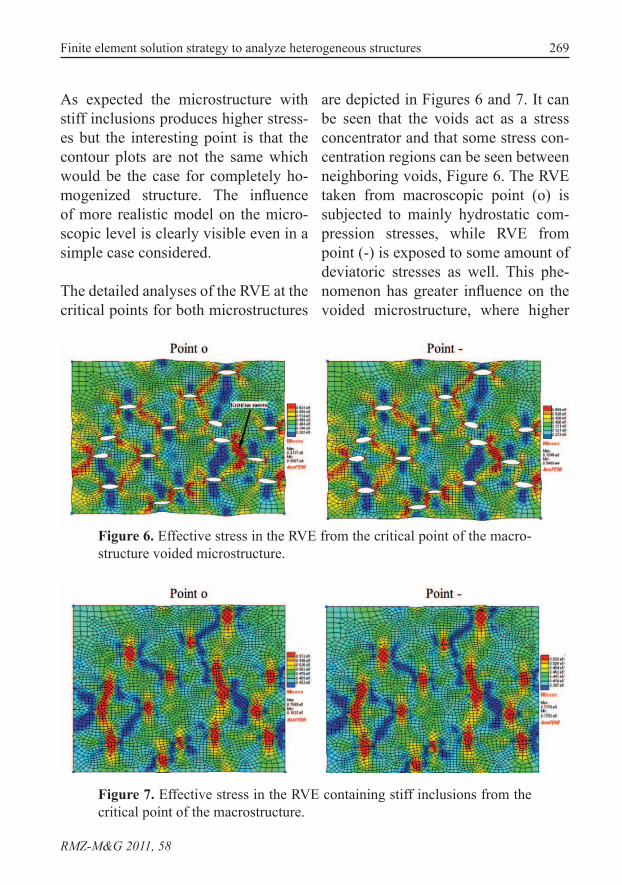
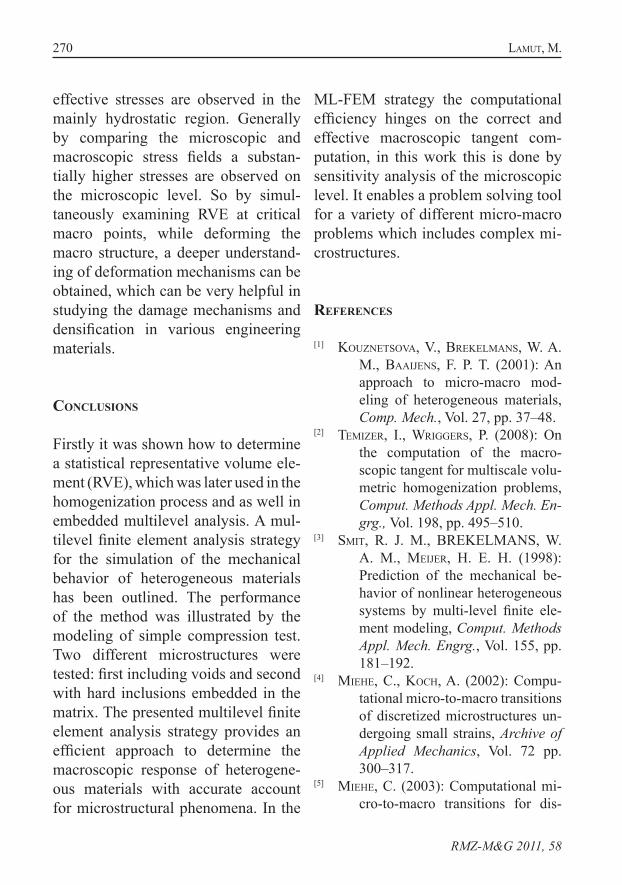
The detailed analyses of the RVE at the critical points for both microstructures
are depicted in Figures 6 and 7. It can be seen that the voids act as a stress concentrator and that some stress con-centration regions can be seen between neighboring voids, Figure 6. The RVE taken from macroscopic point (o) is subjected to mainly hydrostatic com-pression stresses, while RVE from point (-) is exposed to some amount of deviatoric stresses as well. This phe-nomenon has greater influence on the voided microstructure, where higher
Figure 7. Effective stress in the RVE containing stiff inclusions from the critical point of the macrostructure.
Figure 6. Effective stress in the RVE from the critical point of the macro-structure voided microstructure.
270 LaMut, M.
RMZ-M&G 2011, 58
effective stresses are observed in the mainly hydrostatic region. Generally by comparing the microscopic and macroscopic stress fields a substan-tially higher stresses are observed on the microscopic level. So by simul-taneously examining RVE at critical macro points, while deforming the macro structure, a deeper understand-ing of deformation mechanisms can be obtained, which can be very helpful in studying the damage mechanisms and densification in various engineering materials.
conclusions
Firstly it was shown how to determine a statistical representative volume ele-ment (RVE), which was later used in the homogenization process and as well in embedded multilevel analysis. A mul-tilevel finite element analysis strategy for the simulation of the mechanical behavior of heterogeneous materials has been outlined. The performance of the method was illustrated by the modeling of simple compression test. Two different microstructures were tested: first including voids and second with hard inclusions embedded in the matrix. The presented multilevel finite element analysis strategy provides an efficient approach to determine the macroscopic response of heterogene-ous materials with accurate account for microstructural phenomena. In the
ML-FEM strategy the computational efficiency hinges on the correct and effective macroscopic tangent com-putation, in this work this is done by sensitivity analysis of the microscopic level. It enables a problem solving tool for a variety of different micro-macro problems which includes complex mi-crostructures.
references
[1] KouznetSova, V., BreKeLManS, W. A. M., BaaijenS, F. P. T. (2001): An approach to micro-macro mod-eling of heterogeneous materials, Comp. Mech., Vol. 27, pp. 37–48.
[2] TeMizer, I., WriGGerS, P. (2008): On the computation of the macro-scopic tangent for multiscale volu-metric homogenization problems, Comput. Methods Appl. Mech. En-grg., Vol. 198, pp. 495–510.
[3] SMit, R. J. M., BREKELMANS, W. A. M., Meijer, H. E. H. (1998): Prediction of the mechanical be-havior of nonlinear heterogeneous systems by multi-level finite ele-ment modeling, Comput. Methods Appl. Mech. Engrg., Vol. 155, pp. 181–192.
[4] Miehe, C., Koch, A. (2002): Compu-tational micro-to-macro transitions of discretized microstructures un-dergoing small strains, Archive of Applied Mechanics, Vol. 72 pp. 300–317.
[5] Miehe, C. (2003): Computational mi-cro-to-macro transitions for dis-
271Finite element solution strategy to analyze heterogeneous structures
RMZ-M&G 2011, 58
cretized micro-structures of heter-ogeneous materials at finite strains based on the minimization of aver-aged incremental energy, Comput. Meth. Appl. Mech. Eng., Vol. 192, pp. 559–591.
[6] FeyeL, F., ChaBoche, J. L. (2000): FE2 multiscale approach for modelling the elastoviscoplastic behaviour of long fibre SiC/Ti composite ma-terials, Comput. Methods Appl. Mech. Engrg., Vol. 183, pp. 309–330.
[7] FeyeL, F. (1999): Multiscale FE2 elas-toviscoplastic analysis of compos-ite structures, Comput. Mat. Sci., Vol. 16, pp. 344–354.
[8] Zohdi, T. I., WriGGerS, P. (2001): Com-putational Micro-macro Material Testing, Arch. Comput. Methods Eng., Vol. 8, pp. 131–228.
[9] LaMut, M. (2010): Mikro in makrome-hansko modeliranje kompozitnih materialov. Ph. D. Thesis. Ljubljana: University of Ljubljana 2010; 87 p.
[10] LaMut, M., KoreLc, j., rodič, T. (2011): Multiscale modelling of heterogeneous materials, Math. Tech., Vol. 45, pp.421–426.
[11] HiLL, R. (1963): Elastic properties of reinforced solids : some theoretical principles, J. Mech. Phys. Solids., Vol. II, pp. 357–372.
[12] HiLL, R. (1972): On constitutive macro-variables for heterogeneous solids at finite strain, Proc. R. Soc. Lond. A., Vol. 326, pp. 131–147.
[13] Terada, K., Hori, M., Kyoya, T., KiKuchi, N. (2000): Simulation of the multi-scale convergence in computational homogenization
approaches, International Journal of Solids and Structures, Vol. 37, pp. 2285–2311.
[14] KhiSaeva, Z., F., OStoja-StarzewSKi, M. (2006): On the Size of RVE in Finite Elasticity of Random Composites, J. Elasticity, Vol. 85, pp. 153–173.
[15] SLuiS, O., SchreurS, P. J. G., BreKeLManS, W. A. M., Meijer, H.E.H. (2000): Overall behaviour of heterogeneous elastoviscoplastic materials: effect of microstructural modelling, Mechanics of Materials, Vol. 32, pp. 449–462.
[16] TeMizer, I., WriGGerS, P. (2008): On the computation of the macroscopic tangent for multiscale volumetric homogenization problems, Comput. Methods Appl. Mech. Engrg., Vol. 198, pp. 495–510.
[17] TeMizer, I., Zohdi, T. I. (2007): A numerical method for homogenization in non-linear elasticity, Comput. Mech., Vol. 40, pp. 281–298.
[18] Miehe, C. (1996): Numerical computation of algorithmic (consistent) tangent moduli in large-strain computational inelasticity, Comput. Methods Appl. Mech. Engrg., Vol. 134, pp. 223–240.
[19] KoreLc, J. (2009): Automation of primal and sensitivity analysis of transient coupled problems, Comput. Mech., Vol. 44, pp. 631–649.
[20] KoreLc, J. (2007): AceGen & AceFEM user manual, FGG-UL.

RMZ-M&G 2011, 58

273
Original scientific paper
RMZ – Materials and Geoenvironment, Vol. 58, No. 3, pp. 273–288, 2011
Tracing coalbed gas dynamics and origin of gases in advance-ment of the working faces at mining areas Preloge and Pesje,
Velenje Basin
Spremljanje sestave premogovega plina in izvor plinov z napre-dovanjem čela delovišč na pridobivalnih (rudarskih) območjih
jam Preloge in Pesje, Velenjski bazen
tjaša Kanduč1, *, janja žuLa2, SiMon zavšeK2
1Jožef Stefan Institute, Jamova 39, SI - 1000 Ljubljana, Slovenia2Velenje Coal mine, Partizanska 78, SI - 3320 Velenje, Slovenia
*Corresponding author. E-mail: [email protected]
Received: May 9, 2011 Accepted: September 7, 2011
Abstract: During excavation of lignite in the Velenje Coal Mine coalm-ine, seam problems with gas outbursts occur. Geochemical investiga-tions are designed to help predict, prevent, and manage coal mine gas outbursts and to study their origin and mechanisms. However, geochemical studies of the coalbed gases in the Velenje basin have been initiated since year 2000. Temporal changes in chemical and isotopic composition of “free” seam gases were observed as a func-tion of the advancement of the working face –120/B, G2/C and –50/B within boreholes jpk-28/10, jpk-30/10, jpk-31/10, jpk-22/09 and jpk-23/09. Mass spectrometry and isotope mass spectrometry methods were used to determine gas composition and perform gas charac-terization. Coalbed gases in the Velenje basin are highly variable in both their concentrations and stable isotope composition. Major gas components are CO2 and methane. Concentrations and isotopic stud-ies revealed several genetic types of coalbed gases: endogenic CO2 (including CO2 originating from dissolution of carbonates), microbial methane and CO2.
Izvleček: Med izkopavanjem lignita se lahko pojavljajo plinski izbruhi, zato je pomembno izvajati nadzorne meritve premogovnih plinov na odkopih. Geokemične raziskave premogovnega plina so pomembne
274 Kanduč, t., žuLa, j., zavšeK, S.
RMZ-M&G 2011, 58
introduction
An increasing demand for coal, as a result of changes in the availabil-ity and cost of other fossil fuels, has re-focused attention on the problem of outbursting in deeper coal mines. When the rate of advance of the cut-ting face is slow, better opportunities for the slow escape of the gases under high pressure in the virgin coal exist. However, at the faster rates of advance of the coal face now required, less time is available for the equalization of gas pressures and mining induced stresses. Thus, the hazard of instanta-neous outbursting of gas and coal is increased, although under favorable circumstances some control may be
achieved by gas drainage (SMith & GouLd, 1980). It is generally assumed that the pressure and volume of gases held within the virgin coal play a major part in producing outbursts; however, some doubt still exists as to whether outbursts are actually triggered by gas pressure or by stresses induced in the rock itself during mining operations (fLoreS, 1998).
The most trivial definition of coal-bed gas is “gas from coal”. Coalbed gas usually consist of hydrocarbons (mainly methane), CO2 in concen-trations from 0 to greater than 99 %, and occasionally small percent-ages of nitrogen (CLayton, 1998). A numbers of models were developed
za razumevanje mehanizma nastanka, preprečevanja in napovedova-nja plinskih izbruhov. Raziskave premogovnega plina v Velenjskem bazenu potekajo od leta 2000. Časovne spremembe v kemijski in izotopski sestavi “prostih” premogovnih plinov smo spremljali kot funkcijo približevanja čel delovišč 120/B, G2/C in –50/B v vrtinah jpk-28/10, jpk-30/10, jpk-31/10, jpk-22/09 in jpk-23/09. Sestavo in izotopsko sestavo premogovnih plinov smo določili z metodama ma-sne spektrometrije in izotopske masne spektrometrije. Premogovni plini v Velenjskem bazenu se spreminjajo tako po vsebnosti kot tudi po izotopski sestavi. Glavni plinski komponenti sta CO2 in metan. Raziskave vsebnosti in stabilnih izotopov premogovnih plinov kaže-jo različne izvore plinov: endogeni CO2, (vključno s CO2, ki nastaja zaradi raztapljanja karbonatov) ter mikrobni metan in CO2.
Key words: coalbed gas composition, working faces, carbon isotopes, gas origin, Velenje basin
Ključne besede: sestava premogovnih plinov, odkopi, ogljikovi izotopi, izvor plinov, Velenjski bazen
275Tracing coalbed gas dynamics and origin of gases in advancement of the working ...
RMZ-M&G 2011, 58
to describe sources of hydrocarbon gases (ShoeLL, 1983, KotarBa, 1990, Scott, 1993, KotarBa, 2001, ara-vena, 2003). Stable carbon isotope analyses of methane and CO2 can be applied to identify the origin of coal-bed gases, their migration pathways, and accumulation processes. There are three main sources of hydrocarbon gases and CO2 in sedimentary basins: abiogenic, microbial and thermogenic gas (Scott, 1993). In general, thermo-genic gases are typically associated with high rank coal, whereas microbi-al gases are typically associated with low rank coals and could have been produced throughout the basin histo-ry, as long as the coalbeds were never pasteurized. Abiogenic sources of gas are typically found in deep subsurface (Sherwood LoLLar et al., 2006).
Details of isotopic composition of dif-ferent lithotypes of lignite and the ori-gin of coalbed CO2 gas based on tecton-ic events during formation of the basin using cluster analysis and CDMI index (carbon dioxide methane index) of dif-ferent gases are presented in Kanduč et al. (2005a) and Kanduč & Pezdič (2005b). The study revealed levels of microbial methane and CO2, and endo-genic CO2. Unexpected organic arsenic compounds found in Velenje lignite indicated their relation with biogeo-chemical degradation of organic mate-rial (ŠLejKovec & Kanduč, 2005c).
The aim of the study is to explain concentrations and origin of gases as a function of the advancement of the working faces –120/B, G2/C and –50/B in mining areas of Preloge South, Pre-loge North and Pesje in Velenje Basin.
materials and methods
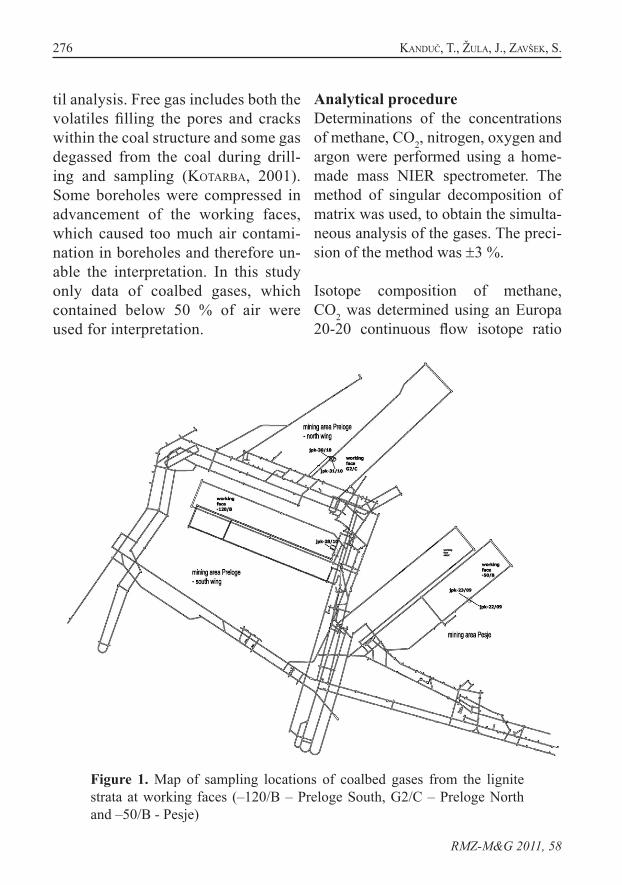
Sampling procedure Sampling of coalbed gas was per-formed at working faces –120/B (mining area Preloge South), G2/C (Preloge North) and –50/B (Pesje) from November 2009 till November 2010, in the lignite seam of the Ve-lenje basin with purpose to determine concentrations (CO2, methane, N2 and O2) and δ13C of methane and CO2 from pillar coal in advancement with the working face (Figure 1). Bore-holes were drilled in pillar coal to a depth of 20 m. After drilling, the cap-illary tube was inserted in the bore-hole. Boreholes (jpk-28/10 - Preloge South, jpk-30/10, jpk-31/10 - Preloge North, jpk-22/09 and jpk-23/09 - Pes-je) and working faces (–120/B, G2/C, and –50/B) are shown on Figure 1. “Free gas” emitted from the borehole was collected in a 50 mL plastic sy-ringe and then transferred to a 12 mL evacuated ampoule with a septum. After sampling “free gas” from the boreholes, the ampoules were stored at normal atmospheric conditions un-
276 Kanduč, t., žuLa, j., zavšeK, S.
RMZ-M&G 2011, 58
Figure 1. Map of sampling locations of coalbed gases from the lignite strata at working faces (–120/B – Preloge South, G2/C – Preloge North and –50/B - Pesje)
til analysis. Free gas includes both the volatiles filling the pores and cracks within the coal structure and some gas degassed from the coal during drill-ing and sampling (KotarBa, 2001). Some boreholes were compressed in advancement of the working faces, which caused too much air contami-nation in boreholes and therefore un-able the interpretation. In this study only data of coalbed gases, which contained below 50 % of air were used for interpretation.
Analytical procedureDeterminations of the concentrations of methane, CO2, nitrogen, oxygen and argon were performed using a home-made mass NIER spectrometer. The method of singular decomposition of matrix was used, to obtain the simulta-neous analysis of the gases. The preci-sion of the method was ±3 %.
Isotope composition of methane, CO2 was determined using an Europa 20-20 continuous flow isotope ratio

277Tracing coalbed gas dynamics and origin of gases in advancement of the working ...
RMZ-M&G 2011, 58
mass spectrometer with ANCA – TG preparation module. First water was removed and then CO2 was directly analyzed for 13C content. For methane measurements first CO2 was removed and then methane was combusted over hot 10 % platinum CuO (1000 °C). The methane completely converted to CO2 was then directly analyzed for isotopic composition of carbon (d13C). Working standards calibrated to IAEA (Interna-tional Atomic Energy Agency) refer-ence materials were used with value of –3.2 ‰ for CO2 and value of –47.5 ‰ for methane relatively to VPDB (Vien-na Pee Dee Belemnite). Analytical pre-cision for carbon isotope composition is estimated to be ±0.2 ‰. The stable carbon isotopes are presented in the δ – notation relative to VPDB standards and expressed in parts per million (Co-PLen, 1996) as follows (O’neiL, 1979):
(1)
Where:Rs – ratio 13C/12C in sampleRRM – ratio 13C/12C in reference mate-rial
results and discussion
“Free gases” accumulated within the lignite coal seam showed a consider-able variability in concentrations and isotopic composition. Due to air con-
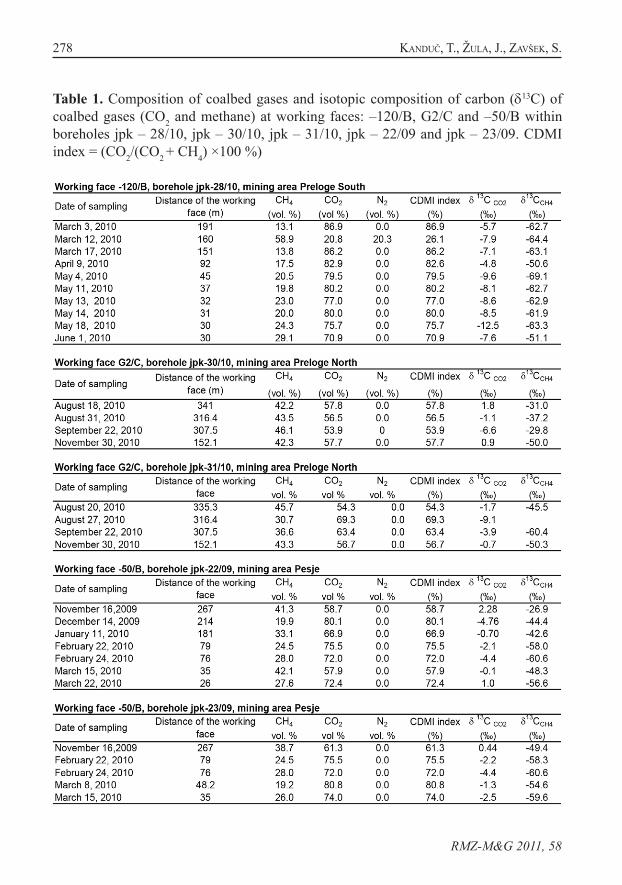
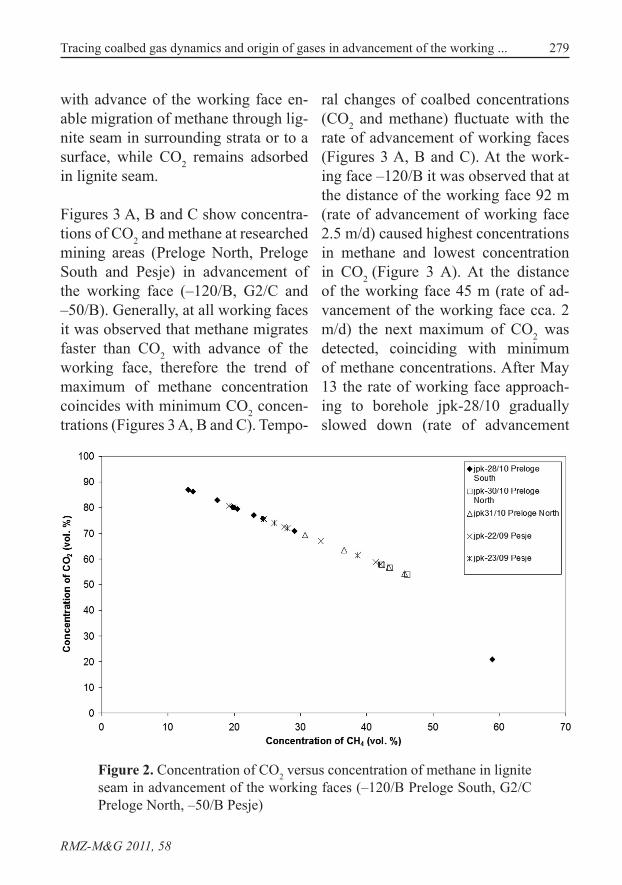
tamination within boreholes and the capillary system samples were recal-culated on an air - free basis. Major gas components were CO2 and meth-ane. Only one sample from our study had nitrogen, meaning that it was in excess. Concentrations of CO2 varied from 20.8 % to 86.9 %, methane from 13.1 % to 58.9 %. Geochemical index CDMI ((CO2/ (CO2 + CH4) × 100 %) vary from 26.1 % to 86.9 % and stable isotope ratios varied in the following ranges: δ13CCO2 from –12.5 ‰ to 2.3 ‰ and δ13CCH4 from –69.1 ‰ to –26.9 ‰ (Table 1).
High correlation (r between 0.95 and 1) is obtained between methane and CO2 concentrations (Figure 2) in a lignite seam within boreholes as a function of the advancement of the working faces (–120/B, G2/C and –50/C). Working faces from different mining areas (Pre-loge North, Preloge South and Pesje) have different composition of coalbed gases. At all investigated mining areas Preloge South (–120/B), Preloge North (G2/C) and Pesje (–50/B) CO2 prevails under methane (Figure 2). The high-est CO2 concentrations are observed in mining are Preloge South (except 1 sample) where N2 concentrations were in excess of air (Table 1). The results of areas of high and low methane con-centrations (Figure 2) are in physico-chemical properties of CO2 and meth-ane (AtKinS, 1994). Fissures generated
278 Kanduč, t., žuLa, j., zavšeK, S.
RMZ-M&G 2011, 58
Table 1. Composition of coalbed gases and isotopic composition of carbon (d13C) of coalbed gases (CO2 and methane) at working faces: –120/B, G2/C and –50/B within boreholes jpk – 28/10, jpk – 30/10, jpk – 31/10, jpk – 22/09 and jpk – 23/09. CDMI index = (CO2/(CO2 + CH4) ×100 %)
279Tracing coalbed gas dynamics and origin of gases in advancement of the working ...
RMZ-M&G 2011, 58
with advance of the working face en-able migration of methane through lig-nite seam in surrounding strata or to a surface, while CO2 remains adsorbed in lignite seam.
Figures 3 A, B and C show concentra-tions of CO2 and methane at researched mining areas (Preloge North, Preloge South and Pesje) in advancement of the working face (–120/B, G2/C and –50/B). Generally, at all working faces it was observed that methane migrates faster than CO2 with advance of the working face, therefore the trend of maximum of methane concentration coincides with minimum CO2 concen-trations (Figures 3 A, B and C). Tempo-
ral changes of coalbed concentrations (CO2 and methane) fluctuate with the rate of advancement of working faces (Figures 3 A, B and C). At the work-ing face –120/B it was observed that at the distance of the working face 92 m (rate of advancement of working face 2.5 m/d) caused highest concentrations in methane and lowest concentration in CO2 (Figure 3 A). At the distance of the working face 45 m (rate of ad-vancement of the working face cca. 2 m/d) the next maximum of CO2 was detected, coinciding with minimum of methane concentrations. After May 13 the rate of working face approach-ing to borehole jpk-28/10 gradually slowed down (rate of advancement
Figure 2. Concentration of CO2 versus concentration of methane in lignite seam in advancement of the working faces (–120/B Preloge South, G2/C Preloge North, –50/B Pesje)
280 Kanduč, t., žuLa, j., zavšeK, S.
RMZ-M&G 2011, 58
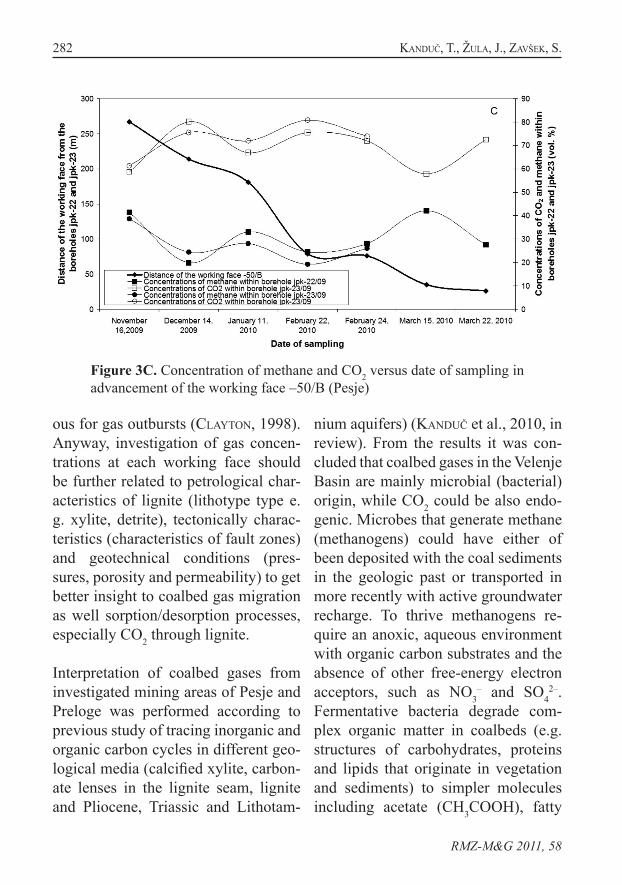
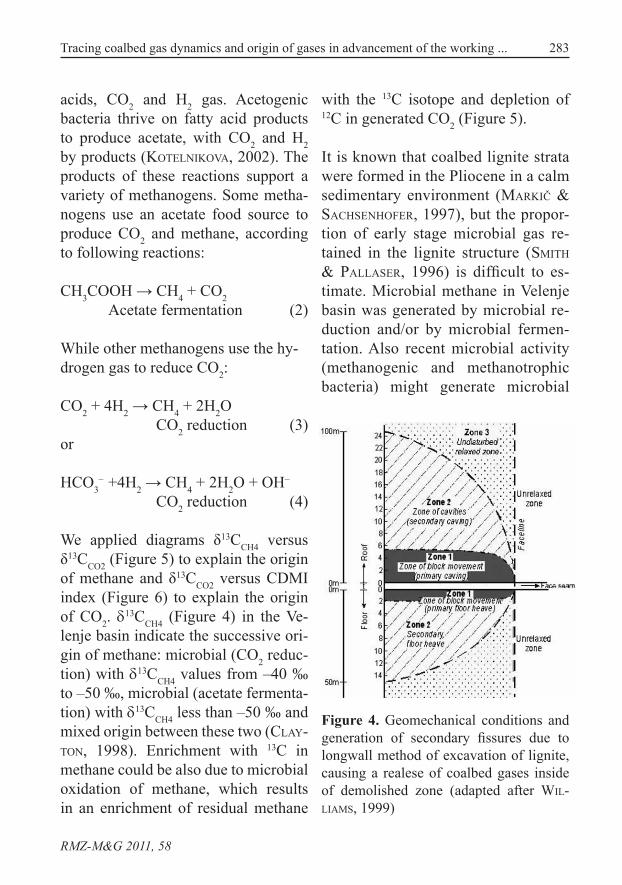
of working face cca. 1 m/d) causing lower fluctuations in concentration of CO2 and methane. At the working face G2/C no trends of increasing/decreas-ing of CO2 and methane concentrations are observed, probably due to constant approaching of the working face with average rate 1.9 m/d to the boreholes jpk-30/10 and jpk-31/10 (Figure 3 B). The rate of advancement of the work-ing face –50/B was from 0.9 m/d to 2.4 m/d. Maximum methane and minimum methane concentrations were traced within borehole jpk-22/09 at the dis-tance of the working face 35 m (rate of advancement of working face cca. 2.2 m/d) (Figure 3 C). Approaching of the working face also influence on stress situation at working face (Figure 4). During excavation of lignite sec-ondary fissures are generated due to rearrangement of primary stress condi-tions, enabling releasing of coalbed gas preserved in pores of coalbed reservoir. These stress conditions are presented in Figure 4 modified after WiLLiaM (1999). Results of changing of stresses were investigated by three axis cells build in lignite structure. The research revealed that at the distance of 120 m from the working face vertical stress-es start to increase. At the distance of 80 m from the working face shearing and collapsing of lignite structure oc-cur; vertical stresses continue to in-crease while horizontal and transverse stresses decrease. At the distance of the working face 30–50 m from three axis
cell vertical stresses are so high that the lignite structure collapse (ZavšeK, 1990). Research of temporal variations of concentrations (CO2 and methane) within borehole 780H IV at working face -80c similar trends as at working faces –120/B, G2/C and–50/B in con-centrations of CO2 and methane were observed; at the distance of the work-ing face 177 m and 122 m maximum concentrations of methane were traced and coincide with minimum concentra-tions of CO2 (Kanduč, 2004). Besides the rate of advancement of the working face concentrations of methane and CO2 measured in lignite seam within bore-holes (jpk-28/10, jpk-30/10, jpk-31/10, jpk-22/09 and jpk-23/09) also depends on permeability and porosity of lignite seam. When methane and CO2 reaches strata with high permeability such as fault zones, their concentrations start to increase, therefore also areas with high concentrations of methane and CO2 might be expected. CO2 behaves at certain condition (above its critical temperature 31.1 °C and critical pres-sure 7.39 MPa, expanding to fill its container like a gas but with a den-sity like that of a liquid) as supercriti-cal fluid (AtKinS, 1994), meaning that could be at liquid and gas phases. The conditions of critical temperature and pressure for CO2 are possibly reached at working faces causing its adsorption (liquid phase)/desorption (gas phase). Areas with high CO2 content (CDMI index) might be potentially danger-

281Tracing coalbed gas dynamics and origin of gases in advancement of the working ...
RMZ-M&G 2011, 58
Figure 3A. Concentration of methane and CO2 versus date of sampling in advancement of the working face –120/B (Preloge South)
Figure 3B. Concentration of methane and CO2 versus date of sampling in advancement of the working face G2/C (Preloge North)
282 Kanduč, t., žuLa, j., zavšeK, S.
RMZ-M&G 2011, 58
ous for gas outbursts (CLayton, 1998). Anyway, investigation of gas concen-trations at each working face should be further related to petrological char-acteristics of lignite (lithotype type e. g. xylite, detrite), tectonically charac-teristics (characteristics of fault zones) and geotechnical conditions (pres-sures, porosity and permeability) to get better insight to coalbed gas migration as well sorption/desorption processes, especially CO2 through lignite.
Interpretation of coalbed gases from investigated mining areas of Pesje and Preloge was performed according to previous study of tracing inorganic and organic carbon cycles in different geo-logical media (calcified xylite, carbon-ate lenses in the lignite seam, lignite and Pliocene, Triassic and Lithotam-
nium aquifers) (Kanduč et al., 2010, in review). From the results it was con-cluded that coalbed gases in the Velenje Basin are mainly microbial (bacterial) origin, while CO2 could be also endo-genic. Microbes that generate methane (methanogens) could have either of been deposited with the coal sediments in the geologic past or transported in more recently with active groundwater recharge. To thrive methanogens re-quire an anoxic, aqueous environment with organic carbon substrates and the absence of other free-energy electron acceptors, such as NO3
– and SO42–.
Fermentative bacteria degrade com-plex organic matter in coalbeds (e.g. structures of carbohydrates, proteins and lipids that originate in vegetation and sediments) to simpler molecules including acetate (CH3COOH), fatty
Figure 3C. Concentration of methane and CO2 versus date of sampling in advancement of the working face –50/B (Pesje)
283Tracing coalbed gas dynamics and origin of gases in advancement of the working ...
RMZ-M&G 2011, 58
acids, CO2 and H2 gas. Acetogenic bacteria thrive on fatty acid products to produce acetate, with CO2 and H2 by products (KoteLniKova, 2002). The products of these reactions support a variety of methanogens. Some metha-nogens use an acetate food source to produce CO2 and methane, according to following reactions:
CH3COOH → CH4 + CO2 Acetate fermentation (2)
While other methanogens use the hy-drogen gas to reduce CO2:
CO2 + 4H2 → CH4 + 2H2O CO2 reduction (3)or
HCO3– +4H2 → CH4 + 2H2O + OH–
CO2 reduction (4)
We applied diagrams δ13CCH4 versus δ13CCO2 (Figure 5) to explain the origin of methane and δ13CCO2 versus CDMI index (Figure 6) to explain the origin of CO2. d
13CCH4 (Figure 4) in the Ve-lenje basin indicate the successive ori-gin of methane: microbial (CO2 reduc-tion) with d13CCH4 values from –40 ‰ to –50 ‰, microbial (acetate fermenta-tion) with d13CCH4 less than –50 ‰ and mixed origin between these two (CLay-ton, 1998). Enrichment with 13C in methane could be also due to microbial oxidation of methane, which results in an enrichment of residual methane
with the 13C isotope and depletion of 12C in generated CO2 (Figure 5).
It is known that coalbed lignite strata were formed in the Pliocene in a calm sedimentary environment (MarKič & SachSenhofer, 1997), but the propor-tion of early stage microbial gas re-tained in the lignite structure (SMith & PaLLaSer, 1996) is difficult to es-timate. Microbial methane in Velenje basin was generated by microbial re-duction and/or by microbial fermen-tation. Also recent microbial activity (methanogenic and methanotrophic bacteria) might generate microbial
Figure 4. Geomechanical conditions and generation of secondary fissures due to longwall method of excavation of lignite, causing a realese of coalbed gases inside of demolished zone (adapted after wiL-LiaMS, 1999)
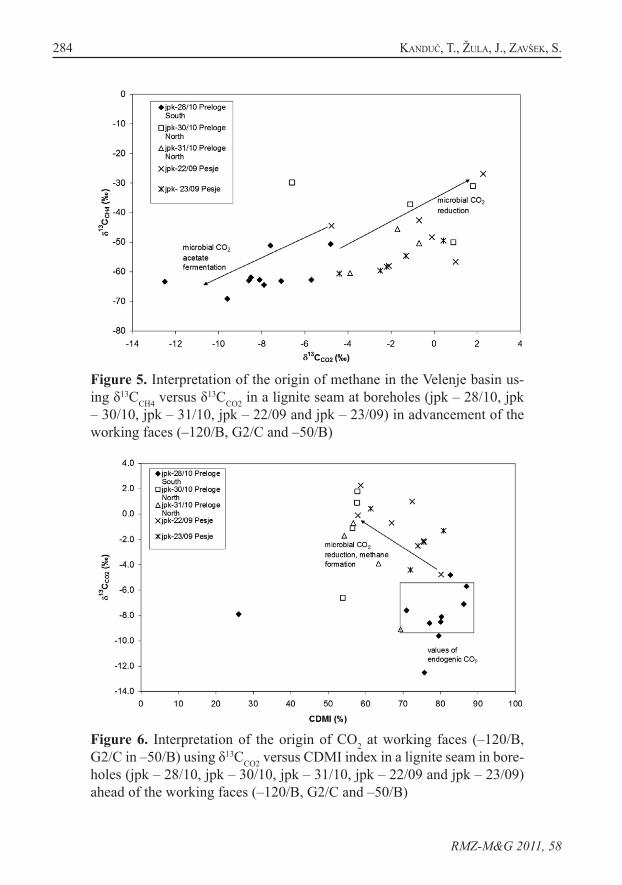
284 Kanduč, t., žuLa, j., zavšeK, S.
RMZ-M&G 2011, 58
Figure 5. Interpretation of the origin of methane in the Velenje basin us-ing δ13CCH4 versus δ13CCO2 in a lignite seam at boreholes (jpk – 28/10, jpk – 30/10, jpk – 31/10, jpk – 22/09 and jpk – 23/09) in advancement of the working faces (–120/B, G2/C and –50/B)
Figure 6. Interpretation of the origin of CO2 at working faces (–120/B, G2/C in –50/B) using δ13CCO2 versus CDMI index in a lignite seam in bore-holes (jpk – 28/10, jpk – 30/10, jpk – 31/10, jpk – 22/09 and jpk – 23/09) ahead of the working faces (–120/B, G2/C and –50/B)
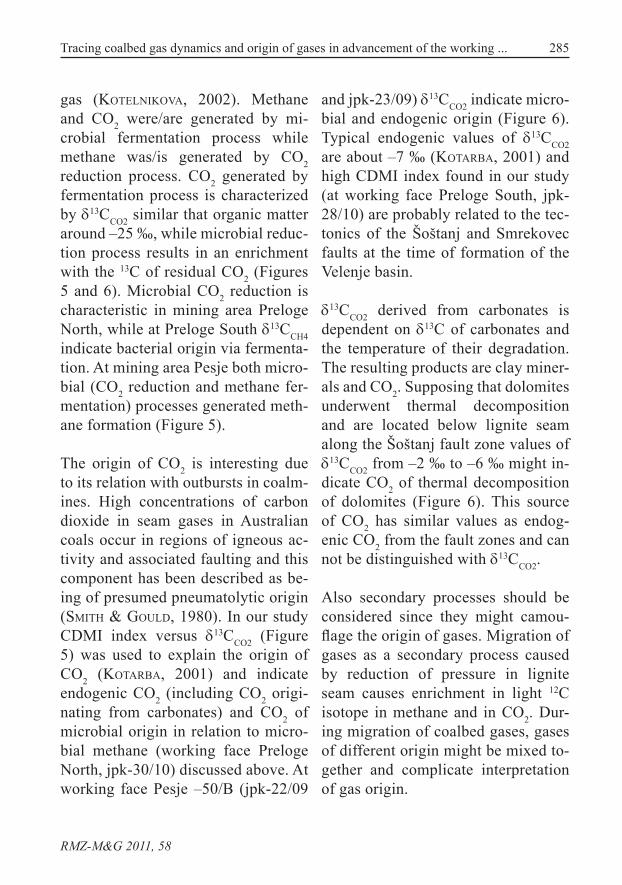
285Tracing coalbed gas dynamics and origin of gases in advancement of the working ...
RMZ-M&G 2011, 58
gas (KoteLniKova, 2002). Methane and CO2 were/are generated by mi-crobial fermentation process while methane was/is generated by CO2 reduction process. CO2 generated by fermentation process is characterized by d13CCO2 similar that organic matter around –25 ‰, while microbial reduc-tion process results in an enrichment with the 13C of residual CO2 (Figures 5 and 6). Microbial CO2 reduction is characteristic in mining area Preloge North, while at Preloge South d13CCH4 indicate bacterial origin via fermenta-tion. At mining area Pesje both micro-bial (CO2 reduction and methane fer-mentation) processes generated meth-ane formation (Figure 5).
The origin of CO2 is interesting due to its relation with outbursts in coalm-ines. High concentrations of carbon dioxide in seam gases in Australian coals occur in regions of igneous ac-tivity and associated faulting and this component has been described as be-ing of presumed pneumatolytic origin (SMith & GouLd, 1980). In our study CDMI index versus d13CCO2 (Figure 5) was used to explain the origin of CO2 (KotarBa, 2001) and indicate endogenic CO2 (including CO2 origi-nating from carbonates) and CO2 of microbial origin in relation to micro-bial methane (working face Preloge North, jpk-30/10) discussed above. At working face Pesje –50/B (jpk-22/09
and jpk-23/09) d13CCO2 indicate micro-bial and endogenic origin (Figure 6). Typical endogenic values of d13CCO2 are about –7 ‰ (KotarBa, 2001) and high CDMI index found in our study (at working face Preloge South, jpk-28/10) are probably related to the tec-tonics of the Šoštanj and Smrekovec faults at the time of formation of the Velenje basin.
d13CCO2 derived from carbonates is dependent on d13C of carbonates and the temperature of their degradation. The resulting products are clay miner-als and CO2. Supposing that dolomites underwent thermal decomposition and are located below lignite seam along the Šoštanj fault zone values of d13CCO2 from –2 ‰ to –6 ‰ might in-dicate CO2 of thermal decomposition of dolomites (Figure 6). This source of CO2 has similar values as endog-enic CO2 from the fault zones and can not be distinguished with d13CCO2.
Also secondary processes should be considered since they might camou-flage the origin of gases. Migration of gases as a secondary process caused by reduction of pressure in lignite seam causes enrichment in light 12C isotope in methane and in CO2. Dur-ing migration of coalbed gases, gases of different origin might be mixed to-gether and complicate interpretation of gas origin.
286 Kanduč, t., žuLa, j., zavšeK, S.
RMZ-M&G 2011, 58
conclusions
Gas outbursts remain for coalminers one of the main problems in the Ve-lenje coalmine, therefore geochemical investigations are one of the important parameters used in case of prediction or prevention gas outbursts.
Concentrations of methane and CO2 change in advance of the working face. Areas with high CO2 concentrations accompany with low methane concen-trations and could be related with the rate of advancement of the working face. The rate of advancement of the working face is one of the crucial pa-rameters influencing on gas composi-tion at working faces.
Concentrations and stable isotope stud-ies of coalbed gases at working faces allow the possible interpretation of the origin of coalbed gas in the Velenje basin. Considering also the results of previous studies, it can be concluded that coalbed CO2 from investigated working faces is endogenic and bacte-rial origin. Methane is microbial origin (formed through microbial fermenta-tion and/or CO2 reduction). Secondary processes like migration, adsorption/desorption and mixing of gases of dif-ferent origin during excavation com-plicate the interpretation of gas origin and were neglected in interpretation of the origin of coalbed gases. Examina-tion of the origin of nitrogen (at loca-
tions with excess of nitrogen) in coal-bed gases from Velenje Basin needs further research.
Acknowledgements
This study was conducted in the frame-work of project Z1-2052 funded by the Slovenian Research Agency (ARRS) and the Velenje Coalmine d.d. The authors are also grateful to Mr. Tedej Zagoričnik, Mr. Robert Lah and Mr. Stojan Žigon for technical support, as-sistance in the field sampling and labo-ratory analyses. Sincere thanks to Dr. Jennifer McIntosh for improving the English of the manuscript.
references
aravena, r., harriSon, S. M., BarKer, j. f., aBercroMBie, h. & rudoLPh, d. (2003): Origin of methane in the Elk Valley coalfield, south-eastern British Columbia, Canada. Chem. Geol.; Vol. 195, pp. 219–227.
atKinS, P. w. (1994): Physical Chemistry, fifth ed. Oxford Univ. Press, Ox-ford, pp. 1031.
cLayton, j. L. (1998): Geochemistry of coalbed gas – A review. Inter. J. Coal Geol.; Vol. 35, pp. 159–173.
coPLen, t. B. (1996): New guidenices for reporting stable hydrogen, carbon and oxygen isotopes ratio data. Geochim. Cosmochim. Acta.; Vol.
287Tracing coalbed gas dynamics and origin of gases in advancement of the working ...
RMZ-M&G 2011, 58
60, pp. 390–3360.fLoreS, r. M. (1998): Coalbed methane:
From hazard to resource. Inter. J. Coal Geol.; Vol. 35, pp. 3–26.
Kanduč, t. (2004): Isotopic character-istics of coalbed gases in Velenje Basin. Master Thesis. Ljubljana: University of Ljubljana 2004; pp. 78 (in Slovene).
Kanduč, t., MarKič, M. & Pezdič, j. (2005a). Stable isotope geochem-istry of different lithotypes of the Velenje lignite (Slovenia), Ge-ologija; Vol. 48, pp. 83–92.
Kanduč, t. & Pezdič, j. (2005b). Origin and distribution of coalbed gases from the Velenje Basin, Slovenia. Geochem. J.; Vol. 39, pp. 397–409.
Kanduč, t. & šLejKovec, z. (2005c). Unexpected arsenic compounds in low-rank coals. Environ. Sci. Technol.; Vol. 39, pp. 3450–3454.
Kanduč, t., MarKič, M., zavšeK, S. & McintoSh, j. (2010). Methano-genesis in the Pliocene Velenje Coal Basin, Slovenia, inferred from stable carbon isotopes. Inter. J. Coal Geol. (in review).
KotarBa, M. (1990): Isotopic geochemis-try and habitat of the natural gases from the Upper Carboniferous Za-cler coal – bearing formation in the Nowa Ruda coal district (Lower Silesia, Poland). Org. Geochem.; 16, pp. 549–560
KotarBa, M. j. (2001): Composition and origin of coalbed gases in the Up-per Silesian and Lublin basins, Poland. Org. Geochem.; 32, pp. 163–180
KoteLniKova, S. (2002): Microbial produc-tion and oxidation of methane in deep subsurface. Earth – Science Reviews. ; Vol. 58, pp. 367–395.
MarKič, M. & SachSenhofer, r. f. (1997): Petrographic composition and depositional environments of the Pliocene Velenje lignite seam (Slovenia). Inter. J. Coal Geol. 33, pp. 229–254
o’neiL, j. r. (1979): Stable Isotope Geo-chemistry of Rocks and Minerals. - V: Lectures in Isotope Geology, Jager, E., Hunzinger, J. C., (Eds). - Springer Verlag, 235–263, Berlin.
Scott, a. r. (1993): Composition and origin of coalbed gases from se-lected basins in the United States. Proceeding of the 1993 Interna-tional Methane Symposium, Bir-mingham, Alabama. Vol. 1, pp. 207–222.
Sherwood LoLLar, B., LacraMPe-cou-LouMe, G., SLater, G. f., ward, j., MoSer, d. P., GihrinG, t. M., Lin, L.-h. & onStott, t. c. (2006): Unravelling abiogenic and bio-genic sources of methane in the Earth’s deep subsurface. Chem. Geol.; Vol. 226, pp. 328–339.
ShoeLL, M. (1983): Genetic characteriza-tion of natural gases. Amer. Ass. Petrol. Geol. Bull.; Vol. 67, pp. 2225–2238.
SMith, j. w. & PaLLaSer, r. (1996): Mi-crobial origin of Australian coal-bed methane. Amer. Ass. Petrol. Geol. Bull.; Vol. 80, pp. 891–897.
SMith, j. w. & GouLd, K. w. (1980): An isotopic study of the role of car-bon dioxide in outbursts in coal
288 Kanduč, t., žuLa, j., zavšeK, S.
RMZ-M&G 2011, 58
mines. Geochem. J.; Vol. 14, pp. 27–32.
zavšeK, S. (1990): Projekt raziskovalne proge na k. +75 v jami Škale, pro-jektna šrtudija, rudarski project, REK Velenje, DO Rudnik Lignita Velenje. Velenje: Premogovnik
Velenje, Hidrogeološki oddelek, pp. 30 (in Slovene).
wiLLiaM, d. j. Fugutive emissions from coal mining (online). 1999, No-vember 23.12.2003 [citirano 11. 11. 1999]. Dostopno na svetovnem spletu:<http://www.atse.org.au>.
289
Original scientific paper
RMZ – Materials and Geoenvironment, Vol. 58, No. 3, pp. 289–302, 2011
Sediment transport and sedimentation in a coastal ecosystem – a case study
Sedimentni transport in sedimentacija v priobalnem ekosistemu - zgled študije
B. K. Purandara1, B. venKateSh1 & v. K. chouBey2
1Regional Center, National Institute of Hydrology, Hanuman Nagar, Belgaum – 590 001 Karnataka, India
2NIH, Roorkee - 2447667, Uttarakhand, India
*Corresponding author. E-mail: [email protected]
Received: August 27, 2011 Accepted: November 2, 2011
Abstract: The determination and interpretation of particle grain-size has a fundamental role in hydraulics, geomorphology and sedimentology. The study of textural parameters of the sediments is of paramount util-ity in differentiating various depositional environments. The present study is carried out along the Central Kerala coast. Grain-size data have been collected from various sources. Apart from collected data, few representative surface sediment samples from the downstream of important rivers like Pamba, Manimala, Muvattupuzha, Minachil and Periyar which debauches into Vembanad lake have been collected. Surface and suspended sediment samples were also collected from the Vembanad lake area where the rivers join the lake and the adjacent nearshore area. Beach sediments were also collected from the selected locations. The study revealed a systematic change in grain-size pat-tern from moving from one environment to another. Coastal waters showed significant quantities of suspended sediment which resulted in the formation of mud banks (wave dampening). It is also observed that the accumulation of finer sediments aid in protecting the coast during southwest monsoon season. A socio-economic survey has been conducted in the study area to know the importance and significance of the rare coastal phenomena known as mud banks. Mud banks acts as a treasure house for fishes.
290 Purandara, v. K., venKateSh, B. & chouBey, v. K.
RMZ-M&G 2011, 58
Izvleček: Določanje in interpretacija zrnavosti ima bistveno vlogo v hidra-vliki, geomorfologiji in sedimentologiji. Preučevanje strukturnih zna-čilnosti sedimentov je izjemno pomembno pri razločevanju različnih sedimentacijskih okolij. To študijo so opravili ob obali osrednje Ke-rale (Indija). Podatke o zrnavosti so zbrali iz različnih virov. Razen tega so vzeli nekaj značilnih površinskih vzorcev naplavin iz spodnje-ga teka pomembnejših rek, ki se izlivajo v jezero Vembanad, kot so Pamba, Manimala, Muvattupuzha, Minachil in Periyar. Površinski in suspendirani sediment so vzorčili pri izlivu rek na območju jezera Vembanad in v okolici. Nadalje so vzorčili tudi obalni sediment v iz-branih točkah. Študija je razkrila sistematično spreminjanje zrnavosti na prehodih od enega okolja do drugega. Ugotovili so, da priobalne vode vsebujejo znatne količine suspendiranega sedimenta, kar vodi do nastanka blatnih usedlin (“wave dampening”). Opazili so tudi, da kopičenje zelo drobnozrnatih usedlin pripomore k varovanju obale v obdobjih jugozahodnega monsuna. Na preučevanem območju so opravili tudi družbeno-ekonomsko raziskavo za oceno pomembnosti redkega obalnega pojava, znanega kot blatni nasipi. Blatni nasipi so prava zakladnica za ribe.
Key words: grain-size, lake, suspended sediments, mud bank, nearshore, beach
Ključne besede: zrnavost, jezero, suspendirane usedline, blatni nasip, priobalno okolje, obala
Introduction
The various processes involved in the movement of water and its relationship to depositional patterns have attracted the scientists and engineers from vari-ous fields. Tides, freshwater outflow, and waves cause complicated water movement which transport, fractionate and modify the properties of particulate matter in coastal regions. These area differ geomorphologically, but have the common feature that suspended mat-
ter is carried back and forth, deposited, and eroded many times before it finally settles, either permanently or for a long period. Although the problem of the source of the sediments is often very complex, the process of sorting and grain size selection usually establishes an equilibrium between the bottom, sus-pended matter and the water.
Sediment granulometry have been studied using grain-size statistics. Re-view of this work has been given by

291Sediment transport and sedimentation in a coastal ecosystem – a case study
RMZ-M&G 2011, 58
(FoLK & Ward, 1957; FoLK, 1966; FriedMan, 1961, 1967; Veerayya et al. 1975; RawLiSon,1984; Purandara, 1993; Pathani,1997; KuMar et al, 2000; GaneSan, 2004; SaniL et al., 2006; Purandara, 2008).
Kerala coast is one of the most dynam-ic and distinctive areas with variety of natural resources and facilities and there has always been a zone of hec-tic human activity. In the coastal areas, numerous problems such as devasta-tion of natural habits due to erosion, pollution, siltation, over population, salt water intrusion, flooding etc are encountered. This part of the coastal area is known for highest density of population in the world.
The present study is an attempt to un-derstand the distribution pattern of sediments in rivers, lake, beach and ad-joining shelf. The study has been con-ducted along the central Kerala coast, between Azhikode in the north to Pur-akkad in the south (south of Alleppey). This stretch of coastal land is impor-tant for their unique formation of `Mud banks’. Mud banks are natural smooth water anchorages formed at particular locations along the Kerala coast during the southwest monsoon season. It ex-tends outwards up to a distance of 3–4 km from the shore. These are semicir-cular in shape, with their northern and southern edges defined by two crescen-
tic lines of breakers running outwards to the sea. The formation of mud banks play a major role in moulding the socio-economic set up of the coastal people by providing a stable fishing ground during the monsoon season. Mud banks affect the coastal processes by damping the waves in the following ways:• traps the littoral material trans-
ported from the updrift side thereby preventing its downcoast move-ment,
• causes refraction of waves on its sides, (iii) protects the beach in par-ticular from erosion.
Study area
Geologically, the study area is covered by the Tertiary and Recent sediments which rests directly upon the Archaean crystalline complex consisting of khon-dalites, leptynites, charnockites and mica hornblende gneisses. The entire wetland ecosystem comprises of four major rivers that debouches into the Vembanad lake which fringes the coast-al tract with an outlet to sea. The sedi-ments brought by the rivers first settles in the lake and then it filters out to the sea through the estuary. The estuarine region presents a stable marine condi-tion for major part of the year. During the monsoon period temporary halo-cline formed with fresh to brackish wa-
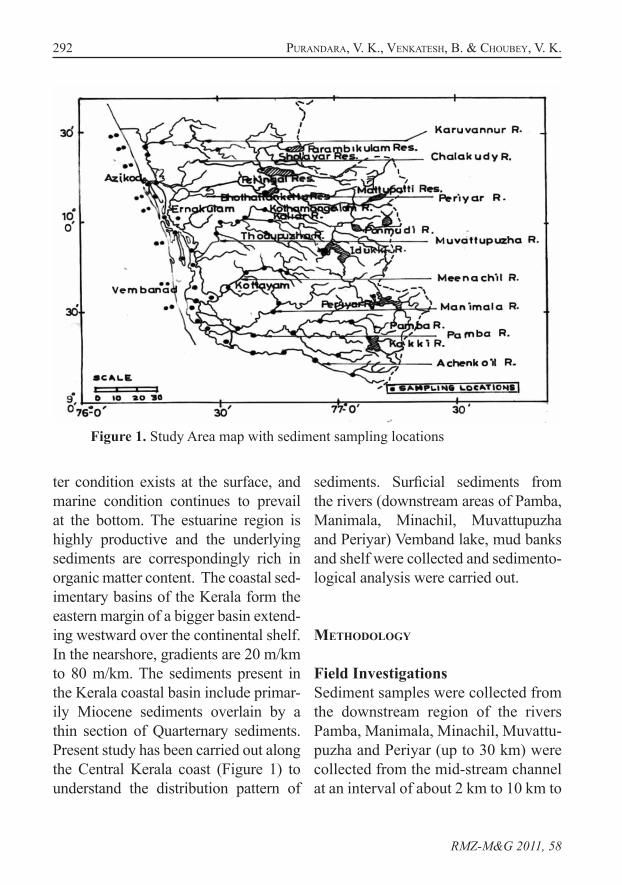
292 Purandara, v. K., venKateSh, B. & chouBey, v. K.
RMZ-M&G 2011, 58
ter condition exists at the surface, and marine condition continues to prevail at the bottom. The estuarine region is highly productive and the underlying sediments are correspondingly rich in organic matter content. The coastal sed-imentary basins of the Kerala form the eastern margin of a bigger basin extend-ing westward over the continental shelf. In the nearshore, gradients are 20 m/km to 80 m/km. The sediments present in the Kerala coastal basin include primar-ily Miocene sediments overlain by a thin section of Quarternary sediments. Present study has been carried out along the Central Kerala coast (Figure 1) to understand the distribution pattern of
sediments. Surficial sediments from the rivers (downstream areas of Pamba, Manimala, Minachil, Muvattupuzha and Periyar) Vemband lake, mud banks and shelf were collected and sedimento-logical analysis were carried out.
Methodology
Field InvestigationsSediment samples were collected from the downstream region of the rivers Pamba, Manimala, Minachil, Muvattu-puzha and Periyar (up to 30 km) were collected from the mid-stream channel at an interval of about 2 km to 10 km to
Figure 1. Study Area map with sediment sampling locations
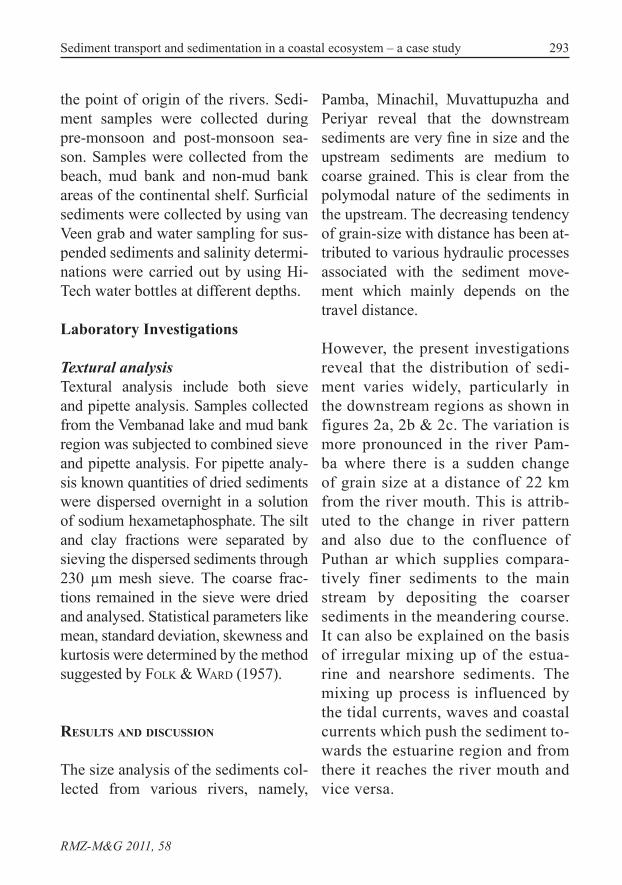
293Sediment transport and sedimentation in a coastal ecosystem – a case study
RMZ-M&G 2011, 58
the point of origin of the rivers. Sedi-ment samples were collected during pre-monsoon and post-monsoon sea-son. Samples were collected from the beach, mud bank and non-mud bank areas of the continental shelf. Surficial sediments were collected by using van Veen grab and water sampling for sus-pended sediments and salinity determi-nations were carried out by using Hi-Tech water bottles at different depths.
Laboratory Investigations
Textural analysisTextural analysis include both sieve and pipette analysis. Samples collected from the Vembanad lake and mud bank region was subjected to combined sieve and pipette analysis. For pipette analy-sis known quantities of dried sediments were dispersed overnight in a solution of sodium hexametaphosphate. The silt and clay fractions were separated by sieving the dispersed sediments through 230 µm mesh sieve. The coarse frac-tions remained in the sieve were dried and analysed. Statistical parameters like mean, standard deviation, skewness and kurtosis were determined by the method suggested by FoLK & Ward (1957).
Results and discussion
The size analysis of the sediments col-lected from various rivers, namely,
Pamba, Minachil, Muvattupuzha and Periyar reveal that the downstream sediments are very fine in size and the upstream sediments are medium to coarse grained. This is clear from the polymodal nature of the sediments in the upstream. The decreasing tendency of grain-size with distance has been at-tributed to various hydraulic processes associated with the sediment move-ment which mainly depends on the travel distance.
However, the present investigations reveal that the distribution of sedi-ment varies widely, particularly in the downstream regions as shown in figures 2a, 2b & 2c. The variation is more pronounced in the river Pam-ba where there is a sudden change of grain size at a distance of 22 km from the river mouth. This is attrib-uted to the change in river pattern and also due to the confluence of Puthan ar which supplies compara-tively finer sediments to the main stream by depositing the coarser sediments in the meandering course. It can also be explained on the basis of irregular mixing up of the estua-rine and nearshore sediments. The mixing up process is influenced by the tidal currents, waves and coastal currents which push the sediment to-wards the estuarine region and from there it reaches the river mouth and vice versa.
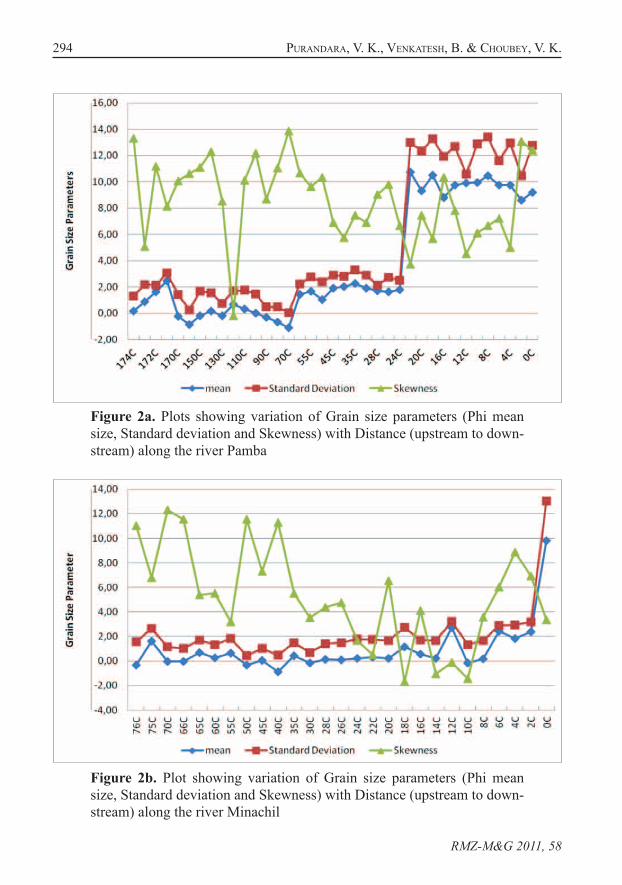
294 Purandara, v. K., venKateSh, B. & chouBey, v. K.
RMZ-M&G 2011, 58
Figure 2a. Plots showing variation of Grain size parameters (Phi mean size, Standard deviation and Skewness) with Distance (upstream to down-stream) along the river Pamba
Figure 2b. Plot showing variation of Grain size parameters (Phi mean size, Standard deviation and Skewness) with Distance (upstream to down-stream) along the river Minachil
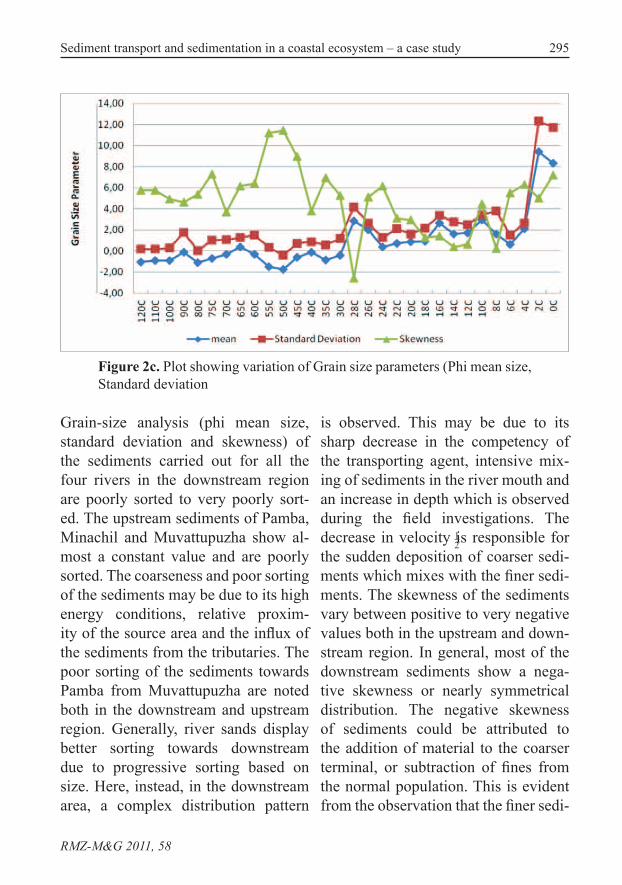
295Sediment transport and sedimentation in a coastal ecosystem – a case study
RMZ-M&G 2011, 58
Grain-size analysis (phi mean size, standard deviation and skewness) of the sediments carried out for all the four rivers in the downstream region are poorly sorted to very poorly sort-ed. The upstream sediments of Pamba, Minachil and Muvattupuzha show al-most a constant value and are poorly sorted. The coarseness and poor sorting of the sediments may be due to its high energy conditions, relative proxim-ity of the source area and the influx of the sediments from the tributaries. The poor sorting of the sediments towards Pamba from Muvattupuzha are noted both in the downstream and upstream region. Generally, river sands display better sorting towards downstream due to progressive sorting based on size. Here, instead, in the downstream area, a complex distribution pattern
is observed. This may be due to its sharp decrease in the competency of the transporting agent, intensive mix-ing of sediments in the river mouth and an increase in depth which is observed during the field investigations. The decrease in velocity is responsible for the sudden deposition of coarser sedi-ments which mixes with the finer sedi-ments. The skewness of the sediments vary between positive to very negative values both in the upstream and down-stream region. In general, most of the downstream sediments show a nega-tive skewness or nearly symmetrical distribution. The negative skewness of sediments could be attributed to the addition of material to the coarser terminal, or subtraction of fines from the normal population. This is evident from the observation that the finer sedi-
12
Figure 2c. Plot showing variation of Grain size parameters (Phi mean size, Standard deviation
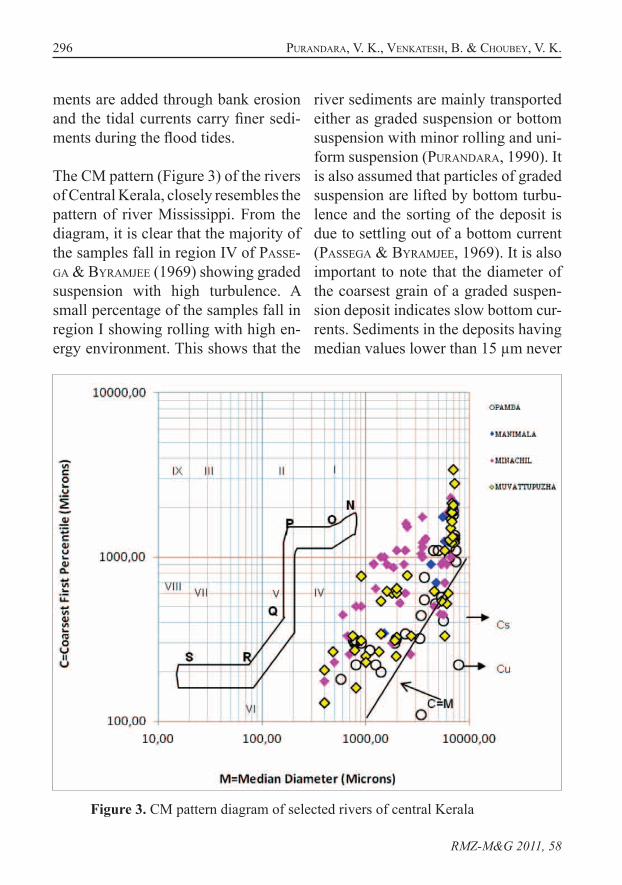
296 Purandara, v. K., venKateSh, B. & chouBey, v. K.
RMZ-M&G 2011, 58
ments are added through bank erosion and the tidal currents carry finer sedi-ments during the flood tides.
The CM pattern (Figure 3) of the rivers of Central Kerala, closely resembles the pattern of river Mississippi. From the diagram, it is clear that the majority of the samples fall in region IV of PaSSe-Ga & ByraMjee (1969) showing graded suspension with high turbulence. A small percentage of the samples fall in region I showing rolling with high en-ergy environment. This shows that the
river sediments are mainly transported either as graded suspension or bottom suspension with minor rolling and uni-form suspension (Purandara, 1990). It is also assumed that particles of graded suspension are lifted by bottom turbu-lence and the sorting of the deposit is due to settling out of a bottom current (PaSSeGa & ByraMjee, 1969). It is also important to note that the diameter of the coarsest grain of a graded suspen-sion deposit indicates slow bottom cur-rents. Sediments in the deposits having median values lower than 15 µm never
Figure 3. CM pattern diagram of selected rivers of central Kerala
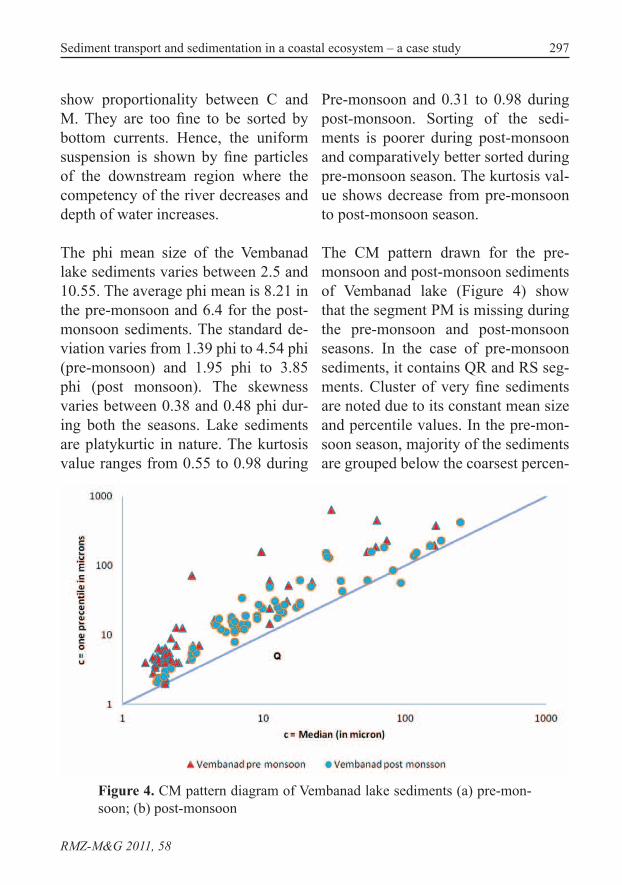
297Sediment transport and sedimentation in a coastal ecosystem – a case study
RMZ-M&G 2011, 58
show proportionality between C and M. They are too fine to be sorted by bottom currents. Hence, the uniform suspension is shown by fine particles of the downstream region where the competency of the river decreases and depth of water increases.
The phi mean size of the Vembanad lake sediments varies between 2.5 and 10.55. The average phi mean is 8.21 in the pre-monsoon and 6.4 for the post-monsoon sediments. The standard de-viation varies from 1.39 phi to 4.54 phi (pre-monsoon) and 1.95 phi to 3.85 phi (post monsoon). The skewness varies between 0.38 and 0.48 phi dur-ing both the seasons. Lake sediments are platykurtic in nature. The kurtosis value ranges from 0.55 to 0.98 during
Pre-monsoon and 0.31 to 0.98 during post-monsoon. Sorting of the sedi-ments is poorer during post-monsoon and comparatively better sorted during pre-monsoon season. The kurtosis val-ue shows decrease from pre-monsoon to post-monsoon season.
The CM pattern drawn for the pre-monsoon and post-monsoon sediments of Vembanad lake (Figure 4) show that the segment PM is missing during the pre-monsoon and post-monsoon seasons. In the case of pre-monsoon sediments, it contains QR and RS seg-ments. Cluster of very fine sediments are noted due to its constant mean size and percentile values. In the pre-mon-soon season, majority of the sediments are grouped below the coarsest percen-
Figure 4. CM pattern diagram of Vembanad lake sediments (a) pre-mon-soon; (b) post-monsoon
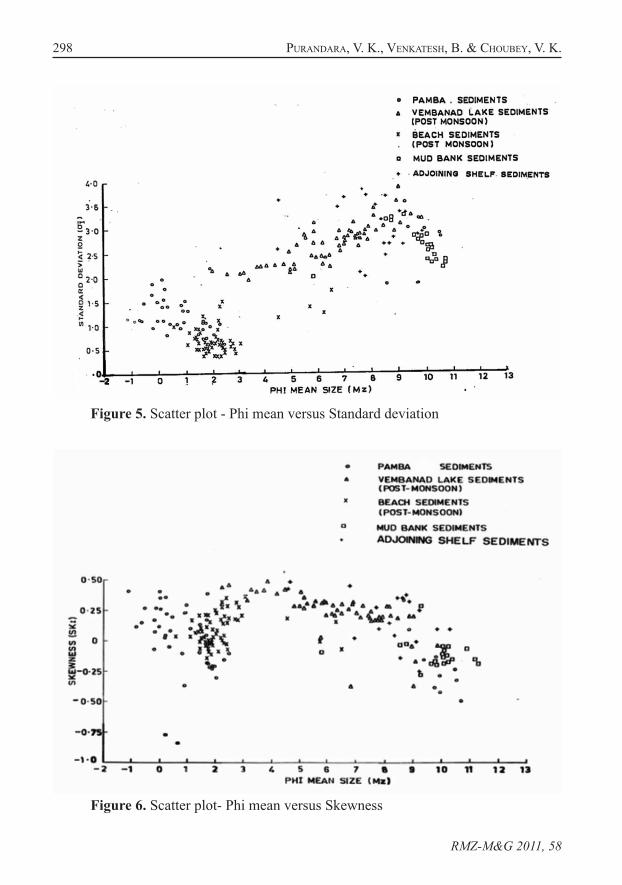
298 Purandara, v. K., venKateSh, B. & chouBey, v. K.
RMZ-M&G 2011, 58
Figure 5. Scatter plot - Phi mean versus Standard deviation
Figure 6. Scatter plot- Phi mean versus Skewness
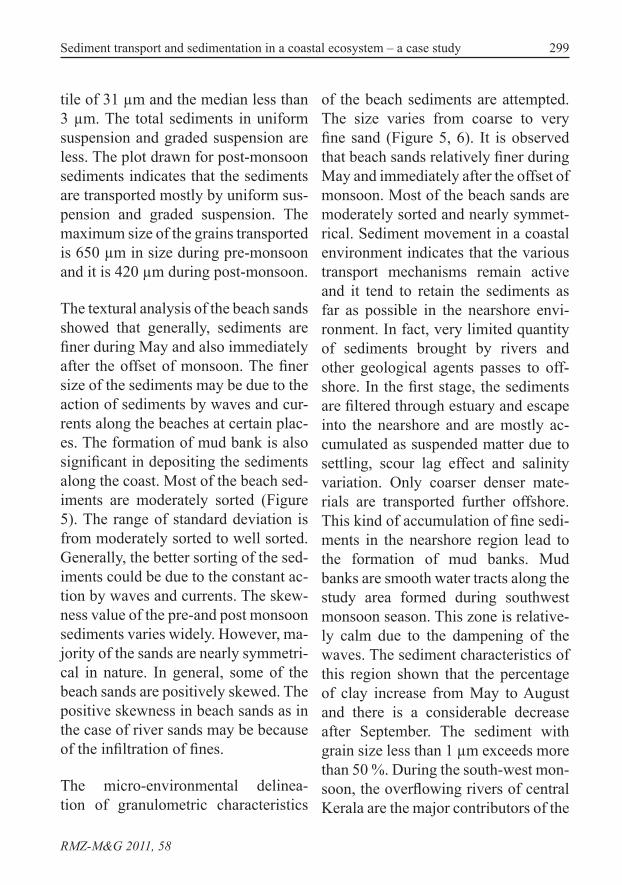
299Sediment transport and sedimentation in a coastal ecosystem – a case study
RMZ-M&G 2011, 58
tile of 31 µm and the median less than 3 µm. The total sediments in uniform suspension and graded suspension are less. The plot drawn for post-monsoon sediments indicates that the sediments are transported mostly by uniform sus-pension and graded suspension. The maximum size of the grains transported is 650 µm in size during pre-monsoon and it is 420 µm during post-monsoon.
The textural analysis of the beach sands showed that generally, sediments are finer during May and also immediately after the offset of monsoon. The finer size of the sediments may be due to the action of sediments by waves and cur-rents along the beaches at certain plac-es. The formation of mud bank is also significant in depositing the sediments along the coast. Most of the beach sed-iments are moderately sorted (Figure 5). The range of standard deviation is from moderately sorted to well sorted. Generally, the better sorting of the sed-iments could be due to the constant ac-tion by waves and currents. The skew-ness value of the pre-and post monsoon sediments varies widely. However, ma-jority of the sands are nearly symmetri-cal in nature. In general, some of the beach sands are positively skewed. The positive skewness in beach sands as in the case of river sands may be because of the infiltration of fines.
The micro-environmental delinea-tion of granulometric characteristics
of the beach sediments are attempted. The size varies from coarse to very fine sand (Figure 5, 6). It is observed that beach sands relatively finer during May and immediately after the offset of monsoon. Most of the beach sands are moderately sorted and nearly symmet-rical. Sediment movement in a coastal environment indicates that the various transport mechanisms remain active and it tend to retain the sediments as far as possible in the nearshore envi-ronment. In fact, very limited quantity of sediments brought by rivers and other geological agents passes to off-shore. In the first stage, the sediments are filtered through estuary and escape into the nearshore and are mostly ac-cumulated as suspended matter due to settling, scour lag effect and salinity variation. Only coarser denser mate-rials are transported further offshore. This kind of accumulation of fine sedi-ments in the nearshore region lead to the formation of mud banks. Mud banks are smooth water tracts along the study area formed during southwest monsoon season. This zone is relative-ly calm due to the dampening of the waves. The sediment characteristics of this region shown that the percentage of clay increase from May to August and there is a considerable decrease after September. The sediment with grain size less than 1 µm exceeds more than 50 %. During the south-west mon-soon, the overflowing rivers of central Kerala are the major contributors of the
300 Purandara, v. K., venKateSh, B. & chouBey, v. K.
RMZ-M&G 2011, 58RMZ-M&G 2011, 58
sediments through the lake and estuary. These overloaded sediments brought by rivers as suspension and bed load may be filtered through the estuarine mouth and will be transported to the nearshore zone. The transportation of sediments through such a long distance will bring very finer sediments and may remain in suspension due to lower salinity. Due to high concentration of suspended sediments (100 mg/L to 900 mg/L in the surface layer and 120 mg/L to 3600 mg/L in the bottom waters), waves are unable to reach the coast and are dampened completely. This process is very clear from the results which showed that there is a considerable in-crease in the concentration of suspend-ed sediments from May to August and then a gradual decrease as observed by (KuruP, 1977; RaMachandran & MaL-LiK, 1985; Purandara & Dora, 1991). Furthermore, it explains that the accu-mulation of sediments take place in the low energy environment as the waves cannot reach the shore. This clear-ly indicates the gradual decrease of grain-size when transported to the sea through rivers and estuary. The con-finement of suspended matter within a certain region, combined with move-ment by tidal and density currents, has an important selective effects on the sediment distribution on the continen-tal shelf. In many areas distributional patterns are closely related to water movements including that of waves. Deeper portions on the shelf are often
sufficiently quiet for mud deposition, but the deposits are coarse since no fine grained suspended matter is available. Conversely, muddy deposits may form in rough water if sufficient fine grained materials are supplied.
Conclusions
In summary, the movement of sedi-ments in coastal sedimentary environ-ments shows that various transport mechanisms are responsible for hold-ing the material within these regions. The study reveal that the accumulation of fine grained sediments and suspen-sion are mainly due to settling, tidal movements and scour lag effects. The size of the particles mainly depends on local conditions and also on the accu-mulation process but the retention is usually most effective for fine grained matter. Further, it is important to note that the confinement of suspended mat-ter within a certain region, combined with movement by tidal and density currents, has an important selective effect on the grain-size distribution of the deposit. (PoStMa, 1967) explained similar condition while dealing with estuarine sedimentation.
A socio-economic survey was con-ducted by contacting the farmers in the region and they expressed the view that the formation of mud banks is a boon to them because, the waters in
301Sediment transport and sedimentation in a coastal ecosystem – a case study
RMZ-M&G 2011, 58
the region is enriched with nutrients and therefore, fishes come closer to the coast during this particular season. Since, offshore movement is restricted during the monsoon season, the avail-ability of fishes in the nearshore region helps them to fetch their livelihood. However, they also opined that, in the recent years the Vembanad lake is fac-ing threat of pollution due to various industries located in and around the lake. The pollutants entering the lake will finally reach to the open sea and may harm the production fishes due to their pollutant. Therefore, it is essen-tial to take control measures while dis-charging the industrial wastes to lake.
Acknowledgement
Authors are highly grateful to Sh. R. D. Singh, Director, National Institute of Hydrology, Roorkee for his encourage-ment. Authors are also grateful to De-partment of Marine Sciences, Cochin university of Science and Technology for the assistance rendered during the study.
References
FoLK, R. L., Ward, W. C. (1957): Brazos River Bar: A study in the signifi-cance of grain-size parameters. Journal of Sedimentary Petrology, Vol. 27, pp. 3–26.
FriedMan, G. M. (1961). Distinction be-tween Dune, Beach and River sands from their textural charac-teristics. Journal of Sedimentary Petrology, Vol. 31, pp. 514–529.
friedMan, G. M. (1967). Dynamic pro-cesses and statistical parameters compared for size frequency dis-tribution of beach and river sands. J. Sediment. Petrol., Vol. 37, pp. 327–354.
GaneSan, P. (2004): Delineation of high tide line and seasonal beach pro-filing at Kalbadevi bay, Maharash-tra, central west coast of India. Technical report: NIO/TR-8/2004.
KuMar, S. V., KuMar, K. A., Anand, N. M. (2000): Characteristics of waves off Goa, West coast of India. Jour-nal of Coastal Research, V. 16(3), pp. 782–789.
KuMar, S. V., PathaK, K. C., PedneKar, P., Raju, N. S. N., GowthaMan, R. (2006): Coastal processes along the Indian Coastline. Current Sci-ence, Vol. 91(4), pp. 530–536.
KuruP, P. G. (1977): Stduies on Physica aspects of mud banks along the Kerala coast, Mahasagar- Bull. National Institute of Oceanogra-phy, 2(3), 25–31.
PaSSeGa, R., (1957 Texture as characteris-tic of clastic deposition.Bull. Am. Assoc. Petrol. Geologists, Vol. 41(9), pp. 1952–1984.
PaSSeGa, R., ByraMjee, R. (1969): Grain size image of clastic deposits. Sed-imentology. Vol.13, pp. 233–252.
PoStMa, H. (1967): Sediment transport and sedimentation in estuaries (ed by G. H. Lauff). American Associ-
302 Purandara, v. K., venKateSh, B. & chouBey, v. K.
RMZ-M&G 2011, 58
ation for Advancement of Science, pp. 158–179.
Pathani, R. A. (1997): Significance of grain-size analysis to differentiate microenvironment from Malvan beach, Maharshtra. Journal Geol. Assn. Res. Centre, Vol. 5(1), pp. 20–28.
Purandara, B. K., UnniKriShnan, V. P., GuPta, C. S., Dora, Y. L., (1987): Textural and mineralogical studies from Fort-cochin to Chellanam, Kerala. Journal Geological Soci-ety of India, Vol. 30, pp. 524–530.
Purandara, B. K. (1990): Provenance, Sedimentation and Geochemistry of the modern sediments of mud banks off the central Kerala coast, India. Ph. D. Thesis, Cochin Uni-versity of Science & Technology.
Purandara, B. K., Dora, Y. L. (1991): Textural variations of Narakkal and Saudi Mud banks, west coast of India. Journal of Indian Asso-ciation of Sedimentologists, Vol. 10, pp. 1–11.
Purandara, B. K. (1993): Texture and Min-eralogy of Periyar river(southwest coast of India) sediments. IJMS, 22:78–80.
Purandara, B. K. (2008): Sediment Ob-servations in Muvattupuzha, Ker-ala, Southwest India. Proceedings (Abstract volume) National Semi-nar on Konkan Coast DEED, pp. 74–81.
RaMachandran, K. K. & MaLLiK, T. K. (1985): Mud banks off Kerala Coast- A State of the Art report. State Committee on Science, Tech-nology and Environment, Govt. of Kerala.
RawLiSon, S. E. (1984): Environments of deposition, Palaeo-currents, and provenance of Tertiary deposits Kachemaka Bay, Kenai Peninsula, Alaska, Sedimentary Geology, 38, pp. 421–442.
SaMSuddin, M., Suchindan, G. K., (1987): Beach erosion and accretion in relation to seasonal longshore current variation in the Northern Kerala coast, India. Journal of Coastal Research, Vol. 3(1), pp. 55–62.
SaMSuddin, M. (1986): Textural differenti-ation of the foreshore and breaker zone sediments on the northern Kerala coast, India. Sedimentary Geology, Vol. 46, pp.135–145.
UnniKriShnan, V. P. (1987): Texture, Min-eralogy and Provenance of the beach sands of south Kerala. Ph. D thesis. Cochin University of Science and Technology (unpub-lished).
Veerayya, M., Varadachari, V. V. R. (1975): Depositional environ-ments of coastal sediments of Ca-langute, Goa. Sedimentary Geol-ogy, Vol. 14, pp. 63–74.
303
Original scientific paper
RMZ – Materials and Geoenvironment, Vol. 58, No. 3, pp. 303–328, 2011
Integrated remote sensing and GIS approach to groundwater potential assessment in the basement terrain of
Ekiti area southwestern Nigeria
Povezava daljinskega ugotavljanja in GIS za oceno potenciala podtalnice v kristalinični podlagi območja Ekiti v jugozahodni
Nigeriji
aBeL o. taLaBi1, * & MoShood n. tijani2
1University of Ado-Ekiti, Faculty of Science, Department of Geology, Ado-Ekiti, Nigeria
2University of Ibadan, Faculty of Science, Geology Department, Ibadan, Nigeria
*Corresponding author. E-mail: [email protected]
Received: March 15, 2011 Accepted: September 6, 2011
Abstract: Occurrence of groundwater in the Basement Complex ter-rain of Ekiti area, southwestern Nigeria is controlled by second-ary porosities developed through weathering and fracturing of the crystalline bedrocks. Here, the aquifers are characteristically discontinuous (localized) warranting assessment of the ground-water potential of the area to serve as a guide for groundwater exploration. Remote sensing (RS) and Geographical Informa-tion System (GIS) have been useful in assessing, monitoring and conserving groundwater occurrence. Hence, this paper presents the integrated approach of RS and GIS to groundwater potential zonation in the study area. Thematic maps of geology, geomor-phology, lineament, slope, drainage and drainage density were prepared and integrated using ArcGIS 9.1 software to produce the groundwater potential map of the study area. The GIS evalu-ation produced a groundwater potential map in which the study area was categorized into zones; very good, good-moderately good and poor. Furthermore, superimposition of the groundwa-
304 taLaBi, a. o. & tijani, M. n.
RMZ-M&G 2011, 58
ter yield data from the study area on the groundwater potential map revealed that there are more number of high-yield wells in the favourable zones (very good to good-moderately good) indicated by the GIS approach. This study highlights that the groundwater potential map would apart from its role as explora-tion guide be useful for the development of sustainable ground-water scheme in the area.
Izvleček: Navzočnost podtalnice v stari podlagi območja Ekiti v jugo-zahodni Nigeriji je odvisna od sekundarne poroznosti, ki je po-sledica preperelosti in razpokanosti kristaliničnih kamnin. Zna-čilno za vodonosnike v njih je, da so nepovezani (lokalizirani) in je zato mogoče podatke o potencialu podtalnice v njih upo-rabiti kot vodilo za njeno sledenje. Daljinsko ugotavljanje (RS) in geografski informacijski sistem (GIS) sta uporabni orodji za ocenjevanje, spremljanje in varstvo podtalnice. V članku je opisana povezana uporaba RS in GIS za zoniranje potenciala podtalnice na raziskovanem ozemlju. Izdelane tematske karte geologije, geomorfologije, lineamentov, nagiba reliefa, površin-skih vodnih tokov in njihove gostote so združili s programsko opremo ArcGIS 9.1 v karto potenciala podtalnice raziskova-nega ozemlja. Na tej karti, izdelani z uporabo GIS, je ozemlje razdeljeno na območja dobrega, dobrega do zmerno dobrega in slabega potenciala. Ob prekritju karte izdatnosti podtalnice na raziskovanem ozemlju s karto njenega potenciala se je dalje iz-kazalo, da so visoko izdatni vodnjaki številnejši v ugodnih ob-močjih (z zelo dobrim in dobrim-zmerno dobrim potencialom), kakor so bili določeni z metodologijo GIS. Iz raziskave izha-ja, da je karto potenciala podtalnice mogoče uporabiti ne le kot vodilo pri sledenju, vendar tudi za trajnostno gospodarjenje s podtalnico na danem ozemlju.
Key words: Remote sensing, GIS, groundwater potential zonation, Ekiti area, Basement Complex, thematic maps, high yield wells.
Ključne besede: daljinsko ugotavljanje, GIS, zonalnost vodnega po-tenciala, območje Ekiti, kristalinična podlaga, tematske karte, vodnjaki visoke izdatnosti

305Integrated remote sensing and GIS approach to groundwater potential assessment ...
RMZ-M&G 2011, 58
Introduction
Water is an important constituent of all forms of life and is required in sufficient quantity and acceptable quality to meet the ever increasing demand for various domestic, agricultural and industrial processing operations. This require-ment is hardly fulfilled because 97.5 % of the world global water is saline exist-ing in the ocean, 69.5 % of the remain-ing 2.5 % world global water that is fresh is locked up in glaciers/permafrost while 30.1 % and 0.4 % of it represent groundwater and surface/atmospheric water respectively (http://ga.water.usgs.gov/edu/waterdistribution.html). Sur-face water on the one hand is prone to seasonal fluctuations and contamination through anthropogenic activities while groundwater on the other hand is more in quantity, readily available as it ex-ists in virtually all geologic formations and is naturally protected from direct contamination by surface anthropo-genic activities. In the basement terrain of Ekiti area, south western Nigeria, availability of surface water is seasonal; during the relatively dry period of No-vember to February each year, shallow groundwater in form of hand-dug wells and boreholes remain the only source of water supply as most streams and rivers are dried up. However, the occurrence and movement of groundwater in this crystalline bedrock setting depend on the degree of weathering and extent of
fracturing of the rocks (OLoruniwo & OLorunfeMi, 1987).
The highlighted scenario warrants a detailed investigation of the groundwa-ter potential characteristics of the area so that an exploration guide as well as sustainable groundwater management strategy can be developed.
Groundwater prospect in an area is controlled by many factors such as geology, geomorphology, drainage, slope, depth of weathering, presence of fractures, surface water bodies, ca-nals and irrigated fields amongst oth-ers (Jain, 1998). Slope for example is one of the factors that control the rate of infiltration of rainwater into the sub-surface and could therefore be used as an index of groundwater potential evaluation. In the gentle slope area the runoff is slow allowing more time for rainwater to percolate, whereas high slope area facilitate high runoff allow-ing less residence time for rainwater hence comparatively less infiltration. In one way or the other, each of the list-ed factors contributes to groundwater occurrence. These factors can be inter-preted or analyzed with GIS using RS data. BurrouGh (1986) defined a GIS ‘‘as a powerful set of tools for collect-ing, storing, retrieving at will, trans-forming and displaying spatial data from the real world for a particular set of purpose’’. GIS thus enables a wide
306 taLaBi, a. o. & tijani, M. n.
RMZ-M&G 2011, 58
range of map analysis operations to be undertaken in support of groundwater potential zonation of an area.
Several conventional methods ex-ist for the exploration and preparation of groundwater potential map of an area. These methods include; geologi-cal, geophysical and hydrogeological. However, RS amongst these methods is considered to be more favourable as it is less expensive and applicable even in inaccessible areas. It is a rapid and cost effective tool in producing valuable data in geology and geomorphology. In classifying groundwater potential zones, visual integration of data gen-erated from remote sensing is feasible but cumbersome. However, with the ad-vent of GIS technologies, the mapping of groundwater potential zones within each geological unit has become easy.
GuStafSSon (1993) used GIS for the analysis of lineament data derived from SPOT imagery for groundwater poten-tial mapping in a semi-arid area in south eastern Botswana. Also, Jain (1998) demonstrated the use of hydro geomor-phological map by using Indian Remote Sensing Satellite Linear Imaging Self-Scanning II geocoded data on 1 : 50 000 scale along with the topographic maps to indicate the groundwater potential zones in qualitative terms (i.e., good to very good, moderate to good and poor). Previous research efforts in the study area have been directed at locating and
developing potable groundwater using geophysical and geological techniques. Such studies, including the work of Re-BoucaS & cavaLcante (1989), classi-fied the basement terrains aquifers into three; the weathered basement aquifer, the basement detrital overburden aqui-fer and the fractured rock aquifer. Also, OyinLoye & AdeMiLua (2005) examined the nature of aquifer in the crystalline Basement rocks of Ado-Ekiti, Igede-Ekiti and Igbara-odo areas, southwest-ern Nigeria and concluded that aquifers occurred both in the regolith and frac-tured basement rocks of the area.
The highlighted previous ground-water investigations concentrated on identifying fracture zones and areas with thick overburden employing geo-physical and geological techniques as pathfinders to groundwater availabity. However, basic knowledge of ground-water location, its potential in terms of quantity and availability can pro-vide basis for more rational planning. Therefore, the present study assessed the groundwater potentials of the study area using integrated RS and GIS ap-proach.
study area
The study area (Figure 1) lies between latitudes 7015’–805’ N and longitudes 4044’–5045’ E and fall within the Base-ment Complex setting of southwestern
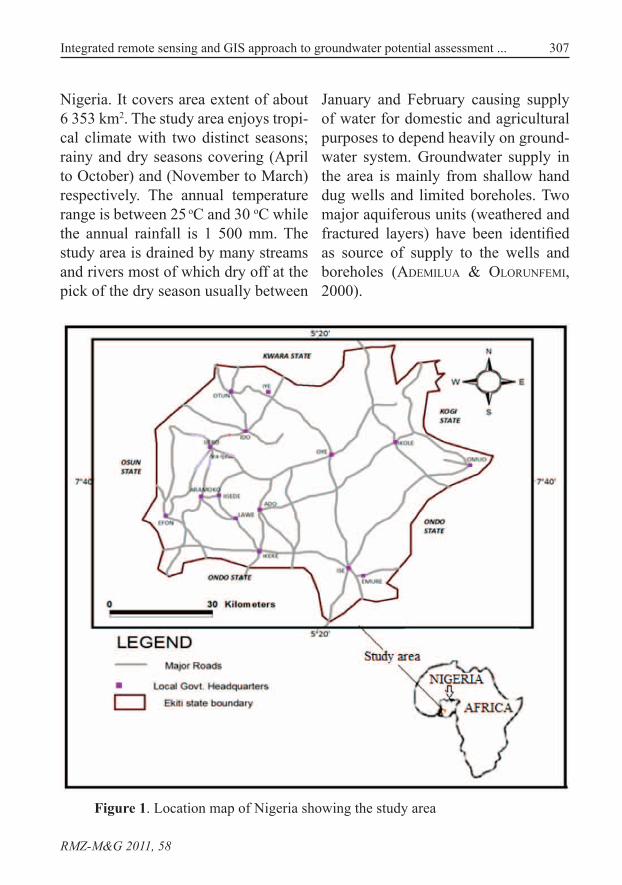
307Integrated remote sensing and GIS approach to groundwater potential assessment ...
RMZ-M&G 2011, 58
Nigeria. It covers area extent of about 6 353 km2. The study area enjoys tropi-cal climate with two distinct seasons; rainy and dry seasons covering (April to October) and (November to March) respectively. The annual temperature range is between 25 oC and 30 oC while the annual rainfall is 1 500 mm. The study area is drained by many streams and rivers most of which dry off at the pick of the dry season usually between
January and February causing supply of water for domestic and agricultural purposes to depend heavily on ground-water system. Groundwater supply in the area is mainly from shallow hand dug wells and limited boreholes. Two major aquiferous units (weathered and fractured layers) have been identified as source of supply to the wells and boreholes (AdeMiLua & OLorunfeMi, 2000).
Figure 1. Location map of Nigeria showing the study area
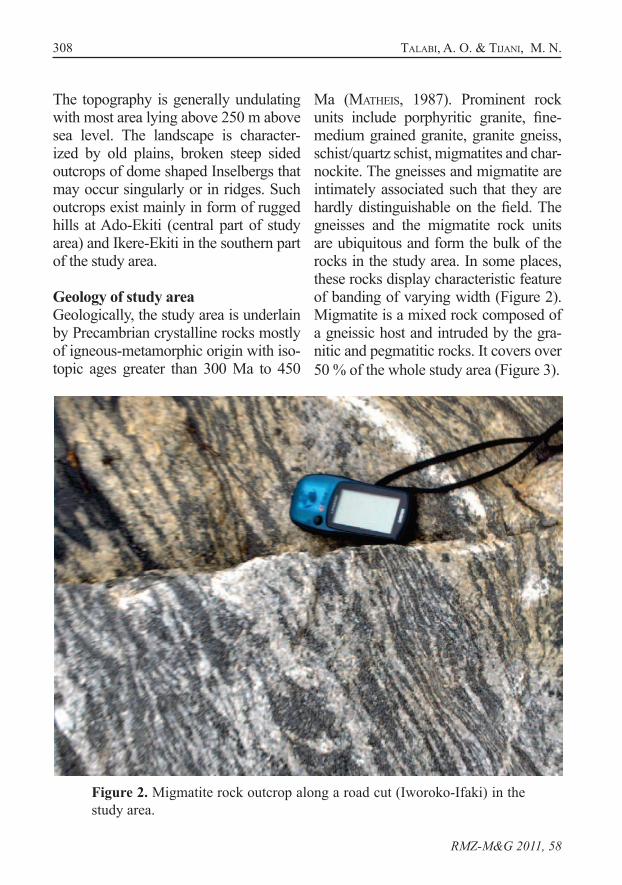
308 taLaBi, a. o. & tijani, M. n.
RMZ-M&G 2011, 58
The topography is generally undulating with most area lying above 250 m above sea level. The landscape is character-ized by old plains, broken steep sided outcrops of dome shaped Inselbergs that may occur singularly or in ridges. Such outcrops exist mainly in form of rugged hills at Ado-Ekiti (central part of study area) and Ikere-Ekiti in the southern part of the study area.
Geology of study areaGeologically, the study area is underlain by Precambrian crystalline rocks mostly of igneous-metamorphic origin with iso-topic ages greater than 300 Ma to 450
Ma (MatheiS, 1987). Prominent rock units include porphyritic granite, fine-medium grained granite, granite gneiss, schist/quartz schist, migmatites and char-nockite. The gneisses and migmatite are intimately associated such that they are hardly distinguishable on the field. The gneisses and the migmatite rock units are ubiquitous and form the bulk of the rocks in the study area. In some places, these rocks display characteristic feature of banding of varying width (Figure 2). Migmatite is a mixed rock composed of a gneissic host and intruded by the gra-nitic and pegmatitic rocks. It covers over 50 % of the whole study area (Figure 3).
Figure 2. Migmatite rock outcrop along a road cut (Iworoko-Ifaki) in the study area.
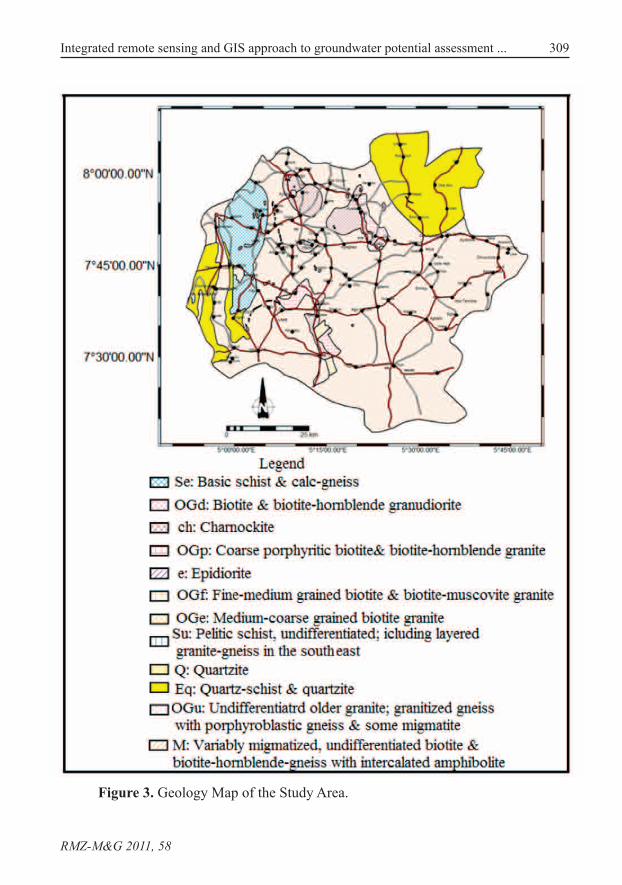
309Integrated remote sensing and GIS approach to groundwater potential assessment ...
RMZ-M&G 2011, 58
Figure 3. Geology Map of the Study Area.
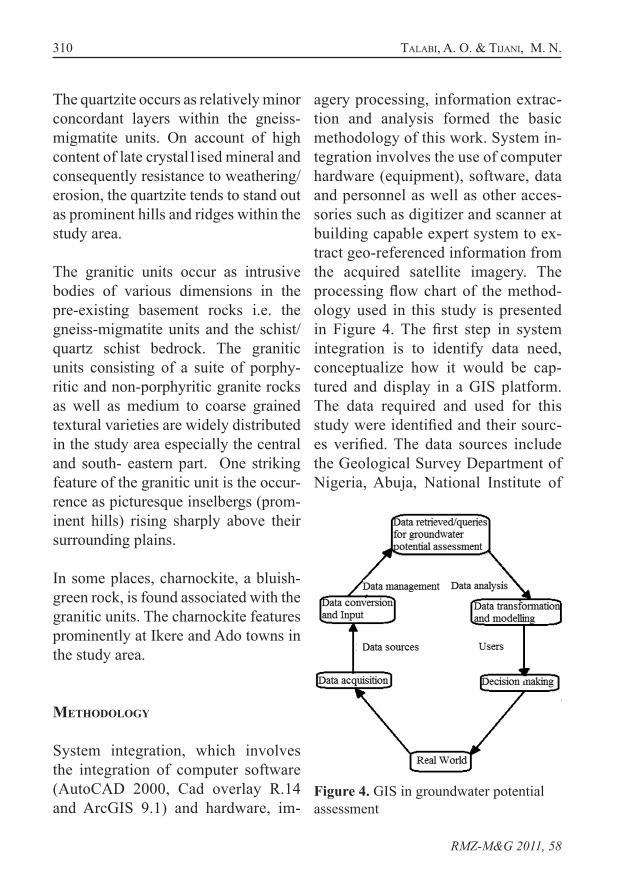
310 taLaBi, a. o. & tijani, M. n.
RMZ-M&G 2011, 58
The quartzite occurs as relatively minor concordant layers within the gneiss-migmatite units. On account of high content of late crystal1ised mineral and consequently resistance to weathering/erosion, the quartzite tends to stand out as prominent hills and ridges within the study area.
The granitic units occur as intrusive bodies of various dimensions in the pre-existing basement rocks i.e. the gneiss-migmatite units and the schist/quartz schist bedrock. The granitic units consisting of a suite of porphy-ritic and non-porphyritic granite rocks as well as medium to coarse grained textural varieties are widely distributed in the study area especially the central and south- eastern part. One striking feature of the granitic unit is the occur-rence as picturesque inselbergs (prom-inent hills) rising sharply above their surrounding plains.
In some places, charnockite, a bluish-green rock, is found associated with the granitic units. The charnockite features prominently at Ikere and Ado towns in the study area.
methodology
System integration, which involves the integration of computer software (AutoCAD 2000, Cad overlay R.14 and ArcGIS 9.1) and hardware, im-
agery processing, information extrac-tion and analysis formed the basic methodology of this work. System in-tegration involves the use of computer hardware (equipment), software, data and personnel as well as other acces-sories such as digitizer and scanner at building capable expert system to ex-tract geo-referenced information from the acquired satellite imagery. The processing flow chart of the method-ology used in this study is presented in Figure 4. The first step in system integration is to identify data need, conceptualize how it would be cap-tured and display in a GIS platform. The data required and used for this study were identified and their sourc-es verified. The data sources include the Geological Survey Department of Nigeria, Abuja, National Institute of
Figure 4. GIS in groundwater potential assessment
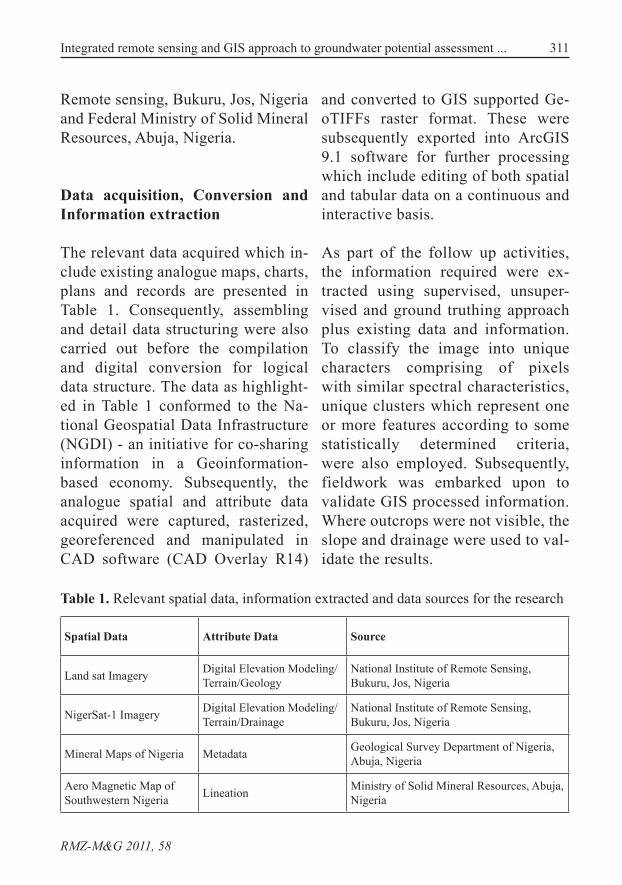
311Integrated remote sensing and GIS approach to groundwater potential assessment ...
RMZ-M&G 2011, 58
Remote sensing, Bukuru, Jos, Nigeria and Federal Ministry of Solid Mineral Resources, Abuja, Nigeria.
Data acquisition, Conversion and Information extraction
The relevant data acquired which in-clude existing analogue maps, charts, plans and records are presented in Table 1. Consequently, assembling and detail data structuring were also carried out before the compilation and digital conversion for logical data structure. The data as highlight-ed in Table 1 conformed to the Na-tional Geospatial Data Infrastructure (NGDI) - an initiative for co-sharing information in a Geoinformation-based economy. Subsequently, the analogue spatial and attribute data acquired were captured, rasterized, georeferenced and manipulated in CAD software (CAD Overlay R14)
and converted to GIS supported Ge-oTIFFs raster format. These were subsequently exported into ArcGIS 9.1 software for further processing which include editing of both spatial and tabular data on a continuous and interactive basis.
As part of the follow up activities, the information required were ex-tracted using supervised, unsuper-vised and ground truthing approach plus existing data and information. To classify the image into unique characters comprising of pixels with similar spectral characteristics, unique clusters which represent one or more features according to some statistically determined criteria, were also employed. Subsequently, fieldwork was embarked upon to validate GIS processed information. Where outcrops were not visible, the slope and drainage were used to val-idate the results.
Table 1. Relevant spatial data, information extracted and data sources for the research
Spatial Data Attribute Data Source
Land sat Imagery Digital Elevation Modeling/Terrain/Geology
National Institute of Remote Sensing, Bukuru, Jos, Nigeria
NigerSat-1 Imagery Digital Elevation Modeling/Terrain/Drainage
National Institute of Remote Sensing, Bukuru, Jos, Nigeria
Mineral Maps of Nigeria Metadata Geological Survey Department of Nigeria, Abuja, Nigeria
Aero Magnetic Map of Southwestern Nigeria Lineation Ministry of Solid Mineral Resources, Abuja,
Nigeria
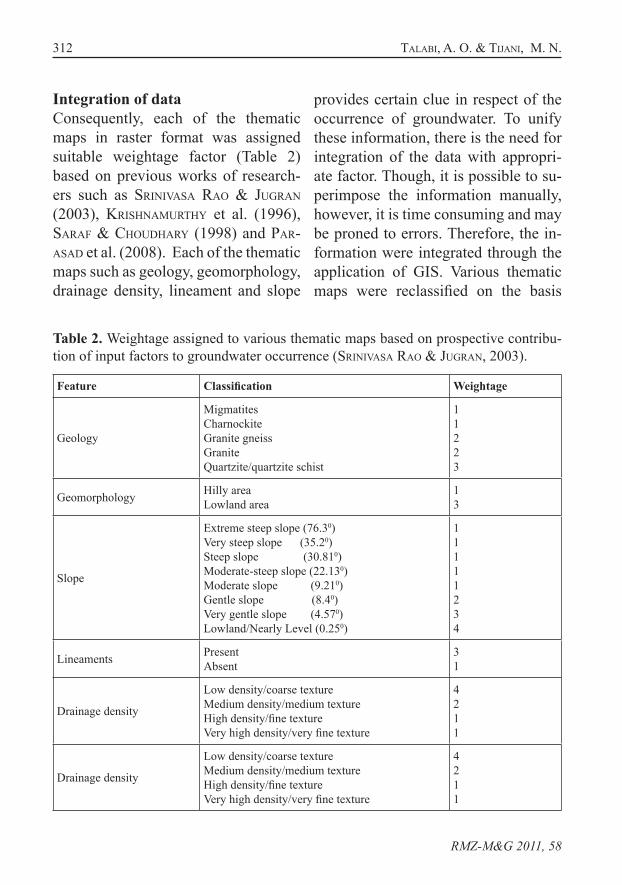
312 taLaBi, a. o. & tijani, M. n.
RMZ-M&G 2011, 58
Integration of dataConsequently, each of the thematic maps in raster format was assigned suitable weightage factor (Table 2) based on previous works of research-ers such as SrinivaSa Rao & JuGran (2003), KriShnaMurthy et al. (1996), Saraf & Choudhary (1998) and Par-aSad et al. (2008). Each of the thematic maps such as geology, geomorphology, drainage density, lineament and slope
provides certain clue in respect of the occurrence of groundwater. To unify these information, there is the need for integration of the data with appropri-ate factor. Though, it is possible to su-perimpose the information manually, however, it is time consuming and may be proned to errors. Therefore, the in-formation were integrated through the application of GIS. Various thematic maps were reclassified on the basis
Table 2. Weightage assigned to various thematic maps based on prospective contribu-tion of input factors to groundwater occurrence (SrinivaSa Rao & JuGran, 2003).
Feature Classification Weightage
Geology
MigmatitesCharnockiteGranite gneissGraniteQuartzite/quartzite schist
11223
Geomorphology Hilly areaLowland area
13
Slope
Extreme steep slope (76.30)Very steep slope (35.20)Steep slope (30.810)Moderate-steep slope (22.130)Moderate slope (9.210)Gentle slope (8.40)Very gentle slope (4.570)Lowland/Nearly Level (0.250)
11111234
Lineaments PresentAbsent
31
Drainage density
Low density/coarse textureMedium density/medium textureHigh density/fine textureVery high density/very fine texture
4211
Drainage density
Low density/coarse textureMedium density/medium textureHigh density/fine textureVery high density/very fine texture
4211
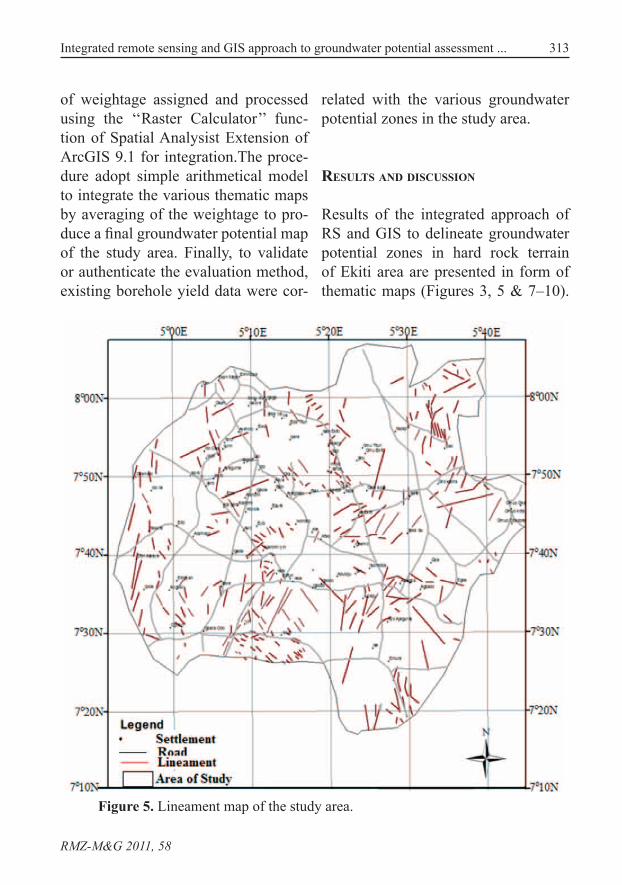
313Integrated remote sensing and GIS approach to groundwater potential assessment ...
RMZ-M&G 2011, 58
of weightage assigned and processed using the ‘‘Raster Calculator’’ func-tion of Spatial Analysist Extension of ArcGIS 9.1 for integration.The proce-dure adopt simple arithmetical model to integrate the various thematic maps by averaging of the weightage to pro-duce a final groundwater potential map of the study area. Finally, to validate or authenticate the evaluation method, existing borehole yield data were cor-
related with the various groundwater potential zones in the study area.
results and discussion
Results of the integrated approach of RS and GIS to delineate groundwater potential zones in hard rock terrain of Ekiti area are presented in form of thematic maps (Figures 3, 5 & 7–10).
Figure 5. Lineament map of the study area.
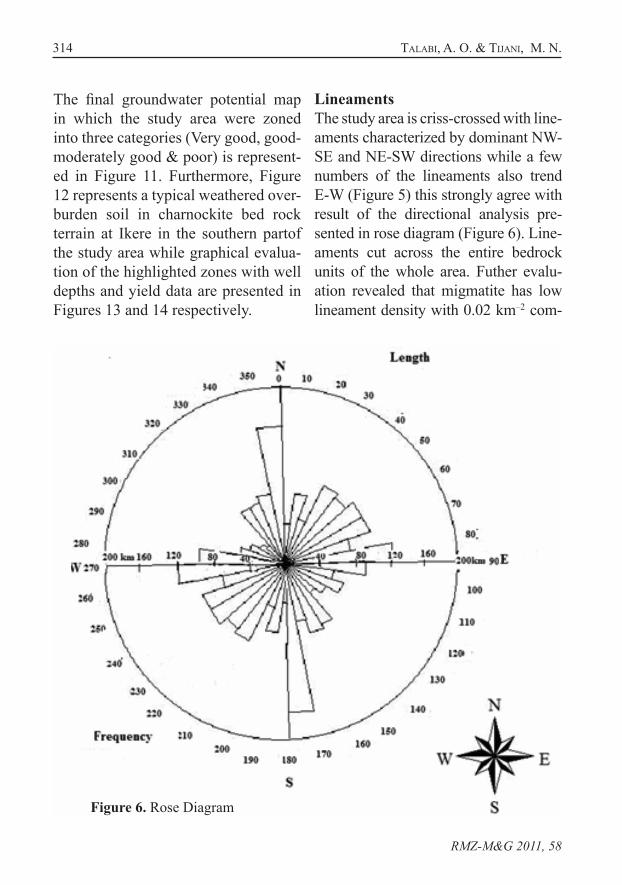
314 taLaBi, a. o. & tijani, M. n.
RMZ-M&G 2011, 58
Figure 6. Rose Diagram
The final groundwater potential map in which the study area were zoned into three categories (Very good, good-moderately good & poor) is represent-ed in Figure 11. Furthermore, Figure 12 represents a typical weathered over-burden soil in charnockite bed rock terrain at Ikere in the southern partof the study area while graphical evalua-tion of the highlighted zones with well depths and yield data are presented in Figures 13 and 14 respectively.
LineamentsThe study area is criss-crossed with line-aments characterized by dominant NW-SE and NE-SW directions while a few numbers of the lineaments also trend E-W (Figure 5) this strongly agree with result of the directional analysis pre-sented in rose diagram (Figure 6). Line-aments cut across the entire bedrock units of the whole area. Futher evalu-ation revealed that migmatite has low lineament density with 0.02 km–2 com-

315Integrated remote sensing and GIS approach to groundwater potential assessment ...
RMZ-M&G 2011, 58
pare to quartzite, granite and charnock-ite with density range from 0.05 km–2 to 0.13 km–2. These lineament density re-vealed existence of more lineaments on the granitic /charnockitic rocks which might be as a result of transpressive forces exhibited during intrusion of the rocks into the parent migmatite/meta-sedimentary rocks. However, the linea-
ments in the low lying part of the study area are of significant interest with re-spect to groundwater occurrence be-cause the lineaments on migmatite are mostly on the hilly and high slope areas with little or no overburden which are regarded as less significant due to pos-sible high runoff rather than favouring vertical groudwater infiltration.
Figure 7. Drainage Map of the Study Area
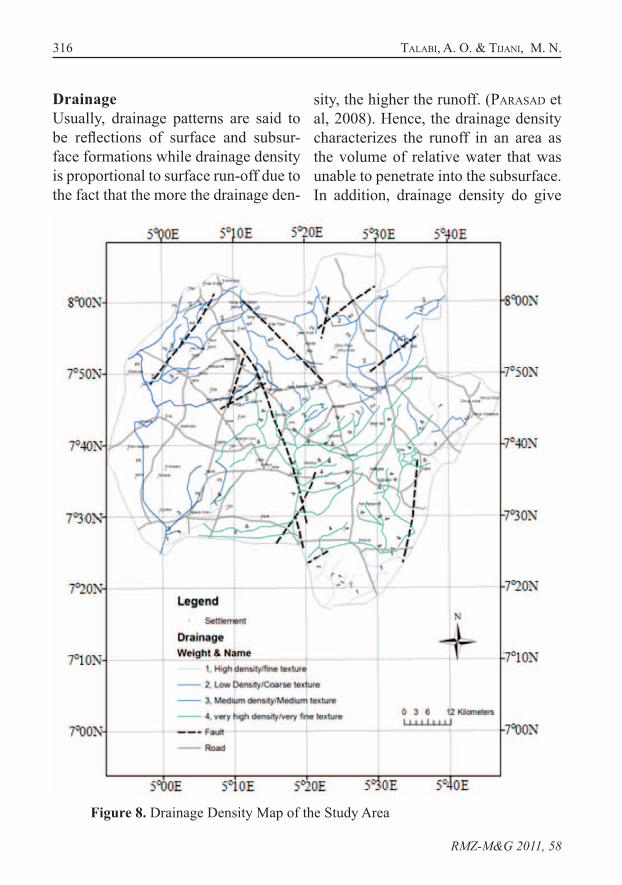
316 taLaBi, a. o. & tijani, M. n.
RMZ-M&G 2011, 58
Figure 8. Drainage Density Map of the Study Area
DrainageUsually, drainage patterns are said to be reflections of surface and subsur-face formations while drainage density is proportional to surface run-off due to the fact that the more the drainage den-
sity, the higher the runoff. (ParaSad et al, 2008). Hence, the drainage density characterizes the runoff in an area as the volume of relative water that was unable to penetrate into the subsurface. In addition, drainage density do give
317Integrated remote sensing and GIS approach to groundwater potential assessment ...
RMZ-M&G 2011, 58
indications of closing or otherwise of stream/river channels which inturn will depend on the nature and degree of weathering of the surface and sub-surface lithologic units. Low drainage density therefore enhances the chance of recharge and contributes positively to groundwater availability if other groundwater occurrence conditions are favourable. In this study thematic map extracted from the topographic map shows dendritic pattern (Figure 7) while the drainage density map pre-sented in Figure 8 reflects the infiltra-tion characteristics with high drainage density indicating low-infiltration and the low drainage density high infiltra-tion respectively. Most of the drainage originates from the quartzite ridge and granitic/charnockitic hills with dense drainage pattern. The lowland part of the study area that are characterized mainly by diverse rock units (por-phyritic granite, fine-medium grained granite, granite gneiss and migmatite) presents low density an indication of favourable condition for vertical infil-tration of runoff from surrounding hills and thus enhancing grounwater oc-currence.This observation signify that groundwater occurrence in the lowland part of the study area is not only con-trolled by rock formations but other factors like topography and weather-ing as weathering products from the surrounding hills pile up to form over-burden thickness aquifer while during igneous rocks intrusion fractures fa-
vourable for vertical infiltration were developed and thus additionally sup-port groundwater occurrence.
Slope/GeomorphologyResults of slope and geomorphology thematic maps produced from integrat-ed RS and GIS as presented in Figures 9 and 10 respectively revealed eight slope categories ranging from extreme slope to lowland and two main geo-morphic units; hilly area and lowland area. Geomorphology is a reflection of the various landform and structur-al features of an area. Such landform and structural features are useful in categorizing groundwater occurrence. Generally, field observation revealed that the lowland areas are covered by thick weathered material representing alluvium matrials from the hilly areas (Figure 12). The weathered overbur-den revealed three principal horizons designated A, B and C. The “A” hori-zon is dark brown to redish lateritised soil, littered with some plant residues which implies organic soil form. The “B” horizon is subdivided into three distinct sub-units but all the three units are generally finer in texture compared to “A” horizon and of a lighter brown. The first two subunits of ‘‘B’’ horizon constitute the vadoze zone where ac-tive leaching and vertical of infiltration water occurs.The third sub-unit of the horizon constitute the phreatic zone representing the aquiferous layer.Soil horizon ‘‘C’’ is grey to white in col-
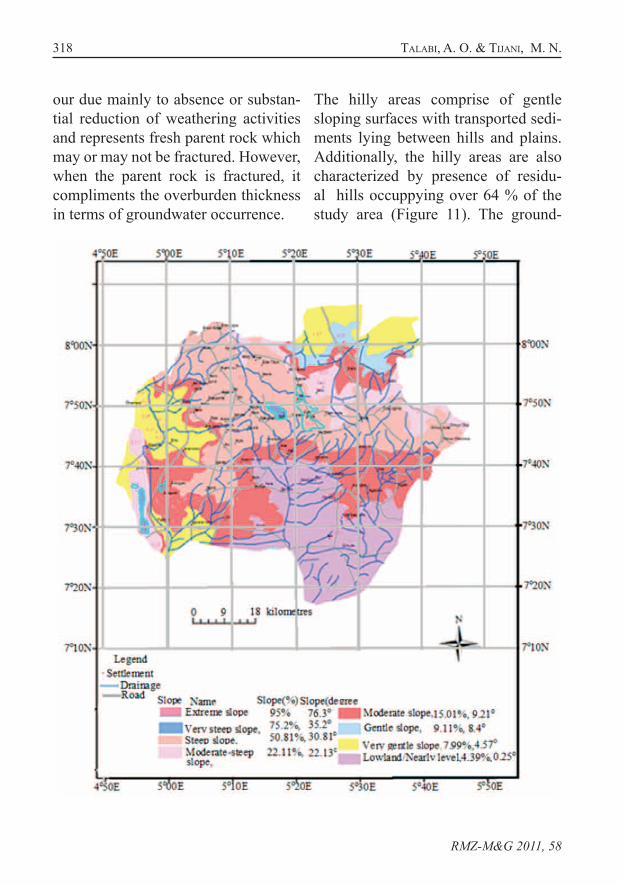
318 taLaBi, a. o. & tijani, M. n.
RMZ-M&G 2011, 58
our due mainly to absence or substan-tial reduction of weathering activities and represents fresh parent rock which may or may not be fractured. However, when the parent rock is fractured, it compliments the overburden thickness in terms of groundwater occurrence.
The hilly areas comprise of gentle sloping surfaces with transported sedi-ments lying between hills and plains. Additionally, the hilly areas are also characterized by presence of residu-al hills occuppying over 64 % of the study area (Figure 11). The ground-
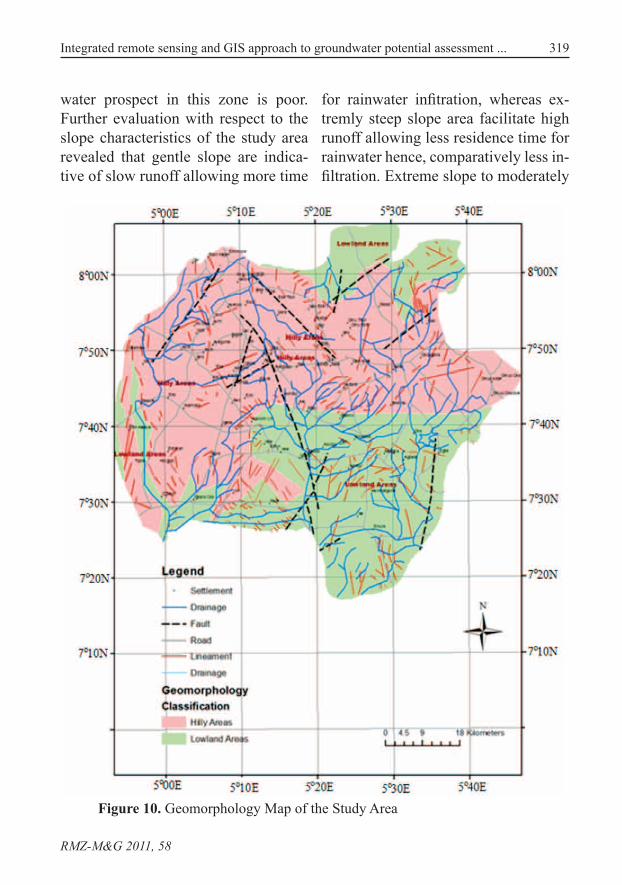
319Integrated remote sensing and GIS approach to groundwater potential assessment ...
RMZ-M&G 2011, 58
water prospect in this zone is poor. Further evaluation with respect to the slope characteristics of the study area revealed that gentle slope are indica-tive of slow runoff allowing more time
for rainwater infitration, whereas ex-tremly steep slope area facilitate high runoff allowing less residence time for rainwater hence, comparatively less in-filtration. Extreme slope to moderately
Figure 10. Geomorphology Map of the Study Area
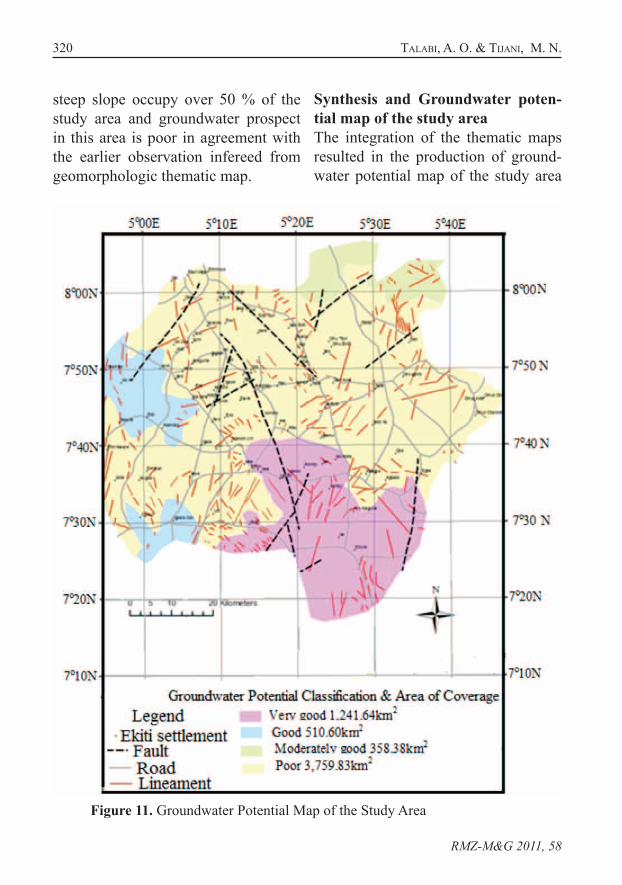
320 taLaBi, a. o. & tijani, M. n.
RMZ-M&G 2011, 58
steep slope occupy over 50 % of the study area and groundwater prospect in this area is poor in agreement with the earlier observation infereed from geomorphologic thematic map.
Synthesis and Groundwater poten-tial map of the study areaThe integration of the thematic maps resulted in the production of ground-water potential map of the study area
Figure 11. Groundwater Potential Map of the Study Area
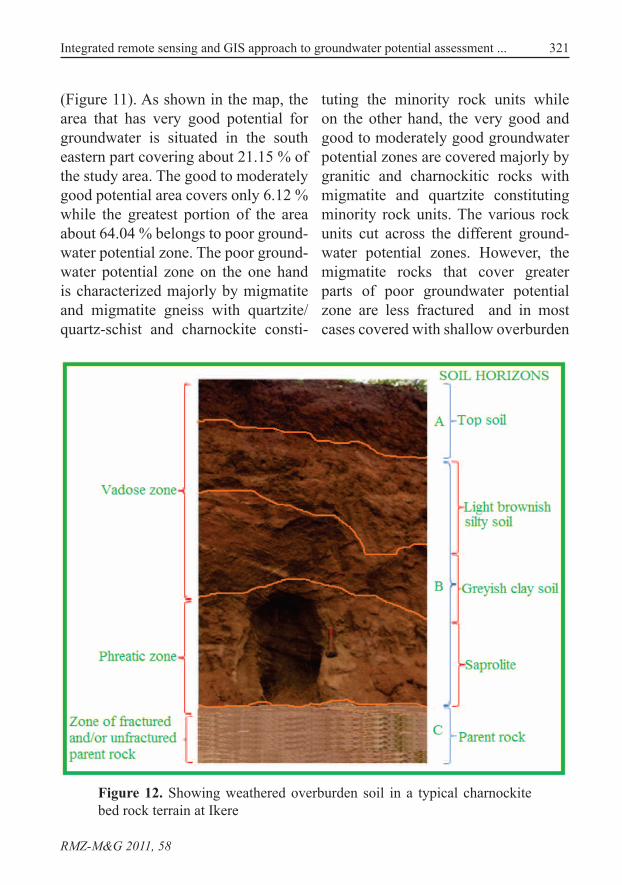
321Integrated remote sensing and GIS approach to groundwater potential assessment ...
RMZ-M&G 2011, 58
(Figure 11). As shown in the map, the area that has very good potential for groundwater is situated in the south eastern part covering about 21.15 % of the study area. The good to moderately good potential area covers only 6.12 % while the greatest portion of the area about 64.04 % belongs to poor ground-water potential zone. The poor ground-water potential zone on the one hand is characterized majorly by migmatite and migmatite gneiss with quartzite/quartz-schist and charnockite consti-
tuting the minority rock units while on the other hand, the very good and good to moderately good groundwater potential zones are covered majorly by granitic and charnockitic rocks with migmatite and quartzite constituting minority rock units. The various rock units cut across the different ground-water potential zones. However, the migmatite rocks that cover greater parts of poor groundwater potential zone are less fractured and in most cases covered with shallow overburden
Figure 12. Showing weathered overburden soil in a typical charnockite bed rock terrain at Ikere
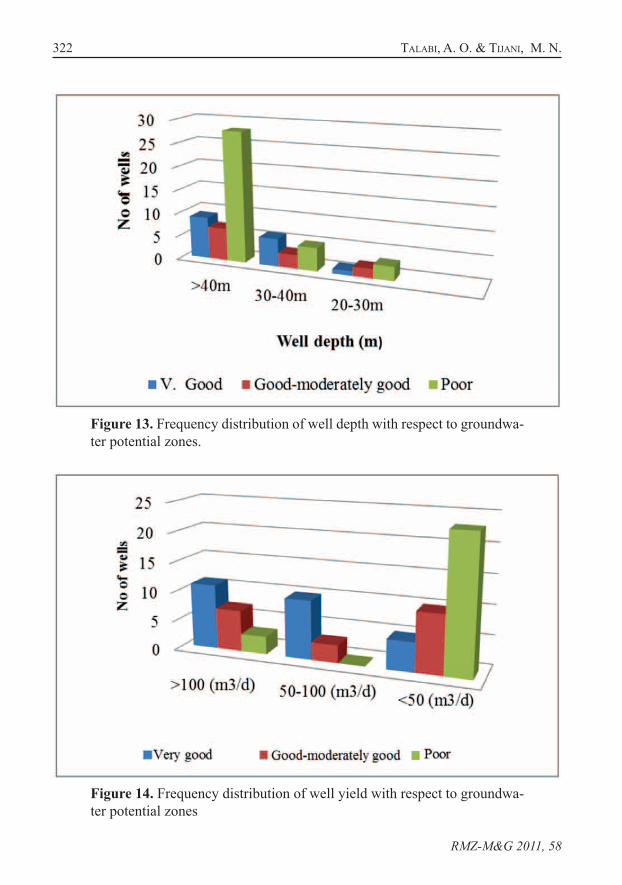
322 taLaBi, a. o. & tijani, M. n.
RMZ-M&G 2011, 58
Figure 14. Frequency distribution of well yield with respect to groundwa-ter potential zones
Figure 13. Frequency distribution of well depth with respect to groundwa-ter potential zones.
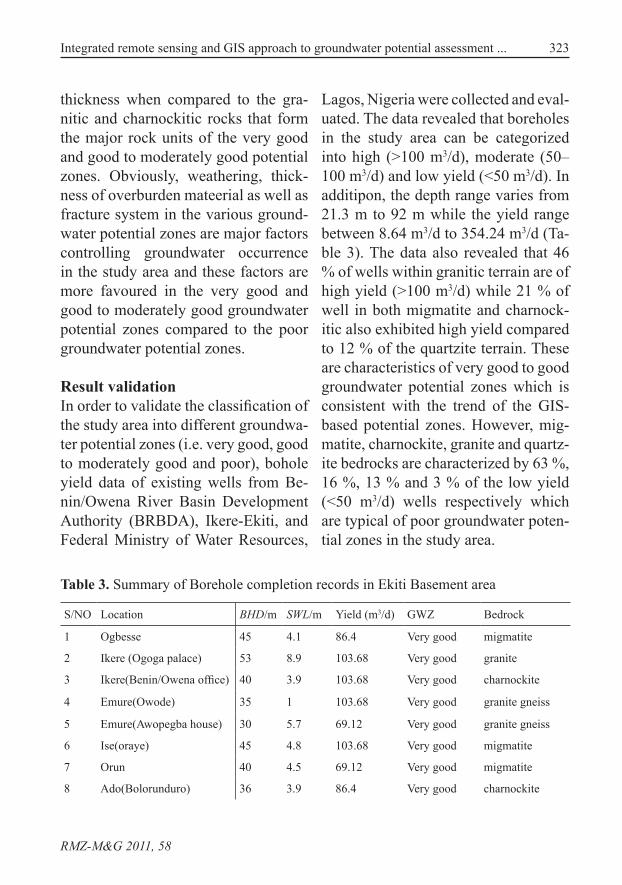
323Integrated remote sensing and GIS approach to groundwater potential assessment ...
RMZ-M&G 2011, 58
thickness when compared to the gra-nitic and charnockitic rocks that form the major rock units of the very good and good to moderately good potential zones. Obviously, weathering, thick-ness of overburden mateerial as well as fracture system in the various ground-water potential zones are major factors controlling groundwater occurrence in the study area and these factors are more favoured in the very good and good to moderately good groundwater potential zones compared to the poor groundwater potential zones.
Result validationIn order to validate the classification of the study area into different groundwa-ter potential zones (i.e. very good, good to moderately good and poor), bohole yield data of existing wells from Be-nin/Owena River Basin Development Authority (BRBDA), Ikere-Ekiti, and Federal Ministry of Water Resources,
Lagos, Nigeria were collected and eval-uated. The data revealed that boreholes in the study area can be categorized into high (>100 m3/d), moderate (50–100 m3/d) and low yield (<50 m3/d). In additipon, the depth range varies from 21.3 m to 92 m while the yield range between 8.64 m3/d to 354.24 m3/d (Ta-ble 3). The data also revealed that 46 % of wells within granitic terrain are of high yield (>100 m3/d) while 21 % of well in both migmatite and charnock-itic also exhibited high yield compared to 12 % of the quartzite terrain. These are characteristics of very good to good groundwater potential zones which is consistent with the trend of the GIS-based potential zones. However, mig-matite, charnockite, granite and quartz-ite bedrocks are characterized by 63 %, 16 %, 13 % and 3 % of the low yield (<50 m3/d) wells respectively which are typical of poor groundwater poten-tial zones in the study area.
Table 3. Summary of Borehole completion records in Ekiti Basement area
S/NO Location BHD/m SWL/m Yield (m3/d) GWZ Bedrock
1 Ogbesse 45 4.1 86.4 Very good migmatite
2 Ikere (Ogoga palace) 53 8.9 103.68 Very good granite
3 Ikere(Benin/Owena office) 40 3.9 103.68 Very good charnockite
4 Emure(Owode) 35 1 103.68 Very good granite gneiss
5 Emure(Awopegba house) 30 5.7 69.12 Very good granite gneiss
6 Ise(oraye) 45 4.8 103.68 Very good migmatite
7 Orun 40 4.5 69.12 Very good migmatite
8 Ado(Bolorunduro) 36 3.9 86.4 Very good charnockite
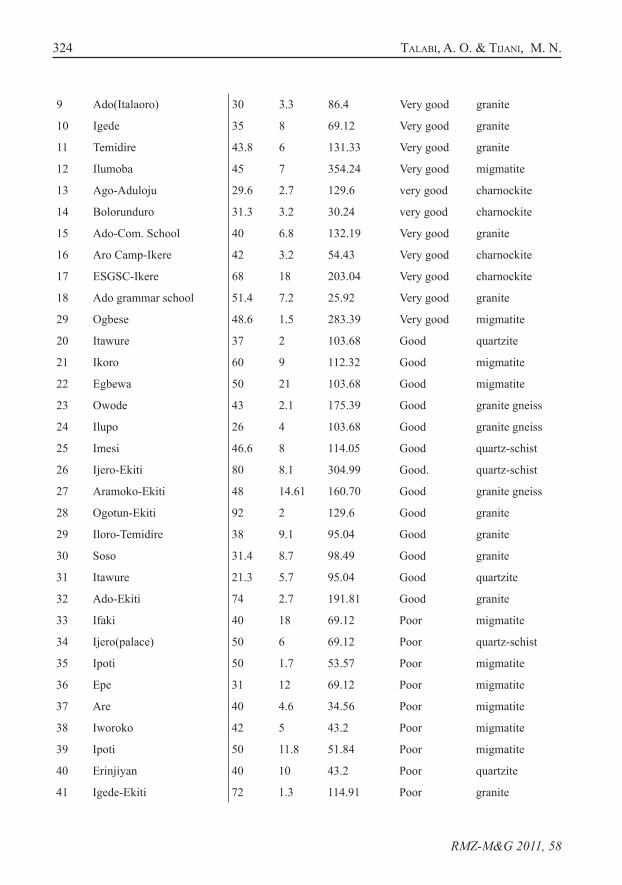
324 taLaBi, a. o. & tijani, M. n.
RMZ-M&G 2011, 58
9 Ado(Italaoro) 30 3.3 86.4 Very good granite
10 Igede 35 8 69.12 Very good granite
11 Temidire 43.8 6 131.33 Very good granite
12 Ilumoba 45 7 354.24 Very good migmatite
13 Ago-Aduloju 29.6 2.7 129.6 very good charnockite
14 Bolorunduro 31.3 3.2 30.24 very good charnockite
15 Ado-Com. School 40 6.8 132.19 Very good granite
16 Aro Camp-Ikere 42 3.2 54.43 Very good charnockite
17 ESGSC-Ikere 68 18 203.04 Very good charnockite
18 Ado grammar school 51.4 7.2 25.92 Very good granite
29 Ogbese 48.6 1.5 283.39 Very good migmatite
20 Itawure 37 2 103.68 Good quartzite
21 Ikoro 60 9 112.32 Good migmatite
22 Egbewa 50 21 103.68 Good migmatite
23 Owode 43 2.1 175.39 Good granite gneiss
24 Ilupo 26 4 103.68 Good granite gneiss
25 Imesi 46.6 8 114.05 Good quartz-schist
26 Ijero-Ekiti 80 8.1 304.99 Good. quartz-schist
27 Aramoko-Ekiti 48 14.61 160.70 Good granite gneiss
28 Ogotun-Ekiti 92 2 129.6 Good granite
29 Iloro-Temidire 38 9.1 95.04 Good granite
30 Soso 31.4 8.7 98.49 Good granite
31 Itawure 21.3 5.7 95.04 Good quartzite
32 Ado-Ekiti 74 2.7 191.81 Good granite
33 Ifaki 40 18 69.12 Poor migmatite
34 Ijero(palace) 50 6 69.12 Poor quartz-schist
35 Ipoti 50 1.7 53.57 Poor migmatite
36 Epe 31 12 69.12 Poor migmatite
37 Are 40 4.6 34.56 Poor migmatite
38 Iworoko 42 5 43.2 Poor migmatite
39 Ipoti 50 11.8 51.84 Poor migmatite
40 Erinjiyan 40 10 43.2 Poor quartzite
41 Igede-Ekiti 72 1.3 114.91 Poor granite
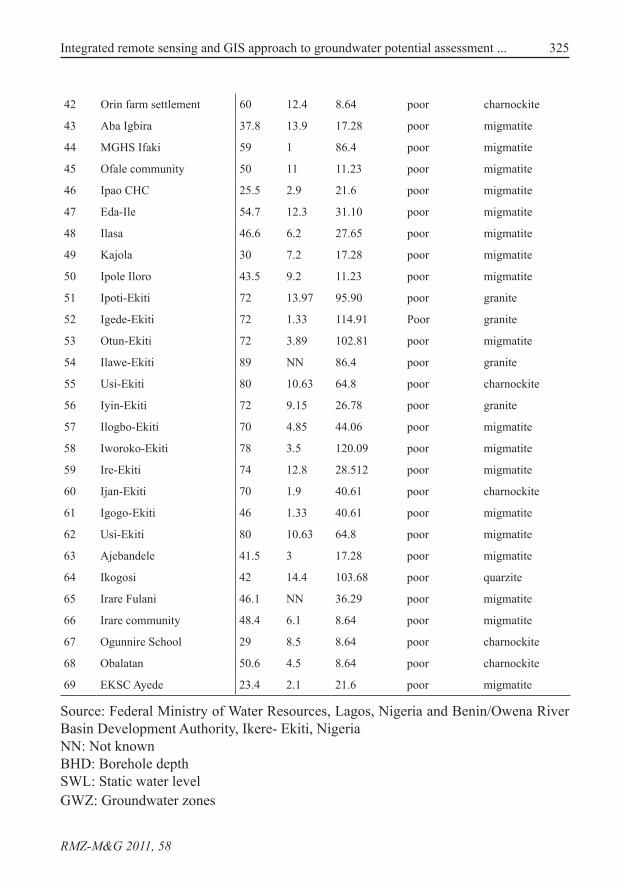
325Integrated remote sensing and GIS approach to groundwater potential assessment ...
RMZ-M&G 2011, 58
42 Orin farm settlement 60 12.4 8.64 poor charnockite
43 Aba Igbira 37.8 13.9 17.28 poor migmatite
44 MGHS Ifaki 59 1 86.4 poor migmatite
45 Ofale community 50 11 11.23 poor migmatite
46 Ipao CHC 25.5 2.9 21.6 poor migmatite
47 Eda-Ile 54.7 12.3 31.10 poor migmatite
48 Ilasa 46.6 6.2 27.65 poor migmatite
49 Kajola 30 7.2 17.28 poor migmatite
50 Ipole Iloro 43.5 9.2 11.23 poor migmatite
51 Ipoti-Ekiti 72 13.97 95.90 poor granite
52 Igede-Ekiti 72 1.33 114.91 Poor granite
53 Otun-Ekiti 72 3.89 102.81 poor migmatite
54 Ilawe-Ekiti 89 NN 86.4 poor granite
55 Usi-Ekiti 80 10.63 64.8 poor charnockite
56 Iyin-Ekiti 72 9.15 26.78 poor granite
57 Ilogbo-Ekiti 70 4.85 44.06 poor migmatite
58 Iworoko-Ekiti 78 3.5 120.09 poor migmatite
59 Ire-Ekiti 74 12.8 28.512 poor migmatite
60 Ijan-Ekiti 70 1.9 40.61 poor charnockite
61 Igogo-Ekiti 46 1.33 40.61 poor migmatite
62 Usi-Ekiti 80 10.63 64.8 poor migmatite
63 Ajebandele 41.5 3 17.28 poor migmatite
64 Ikogosi 42 14.4 103.68 poor quarzite
65 Irare Fulani 46.1 NN 36.29 poor migmatite
66 Irare community 48.4 6.1 8.64 poor migmatite
67 Ogunnire School 29 8.5 8.64 poor charnockite
68 Obalatan 50.6 4.5 8.64 poor charnockite
69 EKSC Ayede 23.4 2.1 21.6 poor migmatite
Source: Federal Ministry of Water Resources, Lagos, Nigeria and Benin/Owena River Basin Development Authority, Ikere- Ekiti, NigeriaNN: Not knownBHD: Borehole depthSWL: Static water levelGWZ: Groundwater zones
326 taLaBi, a. o. & tijani, M. n.
RMZ-M&G 2011, 58
Further evaluations revealed low cor-relation (r = 0.37) between well yield and well depth suggesting that well yield depends on aquifer character-istics such as porosity, permeability and fracture system rather than depth. This is consistent with the frequency distribution of well depth with respect to groundwater potential zones (Fig-ure 13) revealed that well yield is not controlled by depth due to the fact that wells with depth >40 m are more rep-resented in the poor groundwater po-tential zone. This is a clear indication of the localized nature of weathered basement aquifer in the study area. Nonetheless, the frequency diagram of well yield distribution (Figures 14) support the early observation because wells with low yield (<50 m3/d) are predominant in the poor groundwa-ter potential zone and minimal in the good to moderately good groundwater potential zone. Thus the frequency of occurrence of high yielding wells de-creases from very good groundwater potential zone to poor groundwater po-tential zone in agreement with the GIS evaluation of the groundwater poten-tial of the study area.
Further evidence to support this obser-vation is the fact that the shallowest well with depth of 21.3 m located on quartzite has a yield of 95.04 m3/d well with depth of 89.0 m on a granite bed-rock has a yield of 86.4 m3/d. This sce-nario is an indication of the tendency
of the unqualified local driller to drill deeper in the hard granitic and migma-tite bedrocks with the hope of intersect-ing fractures at deeper depth. The is an indication of lack of adequate knowl-edge of the hydrogeological settings by these local unqualified drillers as the assumption is not always applicable in such Basement bedrock setting hence the need to use professionally trained drillers in the drilling exercise not only reduce cost but also to ensure sustain-able groundwater exploitation.
summary and conclusions
This study provides an integrated RS/GIS approach to groundwater potential zonation in Ekiti Basement terrain to serve as a guide for groundwater ex-ploration and development in the study area. As part of the study approach, thematic maps were prepared and susequently integrated using Arc GIS 9.1 software to produce groundwater potential map of the study area.
The groundwater potential assessment revealed;1) That the very good groundwater
potential zones are located main-ly in the south-eastern part of the study area with an area extent of 1 241.64 km2 representing 21.15 % coverage. Also, the good to mod-erately good groundwater potential zones are concentrated in the north-
327Integrated remote sensing and GIS approach to groundwater potential assessment ...
RMZ-M&G 2011, 58
eastern and south-western parts of the study area. These zones have an area extent of 868.97 km2 represent-ing 6.12 % coverage. However, the poor groundwater potential zone with an area extent of 3 759.83 km2 represents 64.04 % coverage and is variably located in the remaining portions of the study area.
2) That the very good potential groundwater zone is undelain mostltly by granitic/ charnockitic rocks while the good to moderately good groundwater potential zone is covered by quartzite/quartz-schist, granite and charnockitic rocks. The poor groundwater potential zone, however, are underlain by predom-inantly by migmatite/ migmatite gneiss bedrock with few charnock-ite and granitic rock units.
3) That fractures on the migmatite bedrocks are poorly developed with thin overburden thickness account-ing for the poor groundwater occur-rence in this terrain. However, the relatively moderate to thick weath-ered overburden units characterized the quartzite and granitic bedrocks where greater proportion of high yield (>100 m3/d) are located.
4) That yield is not controlled by well depth as wells with depth >40 m are more represented in the poor groundwater potential zone com-pared to very good and good to moderately good groundwater po-tential zones. This is a clear indi-
cation of the localized nature of weathered basement aquifer in the study area.
5) That superimposition of existing groundwater yield data on the deci-phered groundwater potential zones revealed more frequent occurrence of high to medium yield wells in the favourable groundwater poten-tial zones which support the result of integrated GIS thematic maps.
In summary the overall asssessment as presented in this study highlight that mapping of groundwater potential us-ing integrated RS/GIS approach could be an effective means of charcateriza-tion of groundwater potential zones as well as serving as a usuful tool and guide in groundwaer exploration and development in the study area. How-ever, further geophysical investigation to determine the aquifer characteristics and the overburden thickness of vari-ous groundwater potential zones high-lighted is recommended to compliment the present study.
references
AdeMiLua, O. L. & OLorunfeMi, M. O. (2000): Geoelectric/Geology estima-tion of the groundwater potential of the Basement Complex area of Ekiti and Ondo States, Nigeria. Journal of Techno science. Vol. 4, pp. 4–20.
BurrouGh, P. A. (1986): Principles of Ge-ographical Information Systems for
328 taLaBi, a. o. & tijani, M. n.
RMZ-M&G 2011, 58
Land Resource aassessment. Claren-don Press, Oxford, U. K.
GuStafSSon, P. (1993): High Resolution Satellite Data and GIS as a Tool for Assessment of the Groundwater Poten-tial of a Semi-Arid Area. Proceedings of the Ninth Thematic Conference on Geologic Remote sensing. Vol. 1, pp. 609–619.
GuStafSSon, P. (1994): Spot satellite data for exploration of fractured aquifers in a semi-arid area in south eastern Bot-swana. Applied Hydrogeology J. Vol. 2, pp. 9–18.
Jain, P. K. (1998): Remote sensing tech-niques to locate ground water poten-tial zones in upper Urmil River basin, district Chatarpur-central India. J Ind Soc Remote Sens. Vol. 26, No. 3, pp. 135–47.
KriShnaMurthy, J. N., VenKateSa, K., JayaraMan, V. & ManiveL, M. (1996): An approach to demarcate ground water potential zones through remote sensing and geographical information system. Int J Remote Sens. Vol. 17, pp. 1867–1884.
MatheiS, G. (1987): Nigeria Rare Metal Pegmatites and their lithologic frame-work. Geol. Journ. Vol. 22, pp. 271–291.
OLoruniwo, M. A. & OLorunfeMi, M. O. (1987): Geophysical i n v e s -tigation for groundwater in Precam-brian terrains: a case study from Ikare. Southwestern Nigeria. Journal of Af-rican Earth Sciences. Vol. 6, No. 6, pp.787–796.
OyinLoye, A. O. & AdeMiLua, O. L. (2005): The nature of aquifer in the crystalline basement rocks of Ado-Ekiti, Igede-Ekiti and Igbara-Odo areas, southwest-
ern Nigeria. Pak. J. sci. Ind. Res. Vol. 48, No. 3, pp. 154–161.
PraSad, R. K., MondaL, N. C., Banerjee, PaLLavi, NandaKuMar, M. V. & Rao, N. SuBBa (2006): Groundwater poten-tial index in a crystalline terrain using remote sensing data. Environmental Geology. Vol. 50, pp. 1067–1076.
PraSad, R. K., MondaL, N. C., Banerjee, PaLLavi, NandaKuMar, M. V. & SinGh, V. S. (2008): Deciphering potential groundwater zone in hard rock through the application of GIS. Environ. Geol. Vol. 55, pp. 467–475.
ReBoucaS, A. C. & CavaLcante, I. N. (1989). Hydrogeology of crystalline rocks in Brazil. In groundwater ex-ploration and development in crystal-line basement aquifers. (Proceedings, Zimbabwe, 15–24 June, 1987, vol.1 sessions 1–5), Commonwealth Science Council, Pall Mall, London: 103–126.
Saraf, A. & Choudhary, P. R. (1998): In-tegrated remote sensing and GIS for ground water exploration and identification of artificial recharge site. Int J Remotes sense. Vol. 19, pp.1825–1841.
SinGh, V. S. (2008): Deciphering potential groundwater zone in hard rock through the application of GIS. Environ Geol. Vol. 55, pp. 467–475.
SrinivaSa, Rao Y. & JuGran, K. D. (2003): Delineation of groundwater potential zones and zones of groundwater quali-ty suitable for domestic purposes using remote sensing and GIS Hydrogeol. Sci. J. Vol. 48, pp. 821–833.
USGS – General Interest Publication ‘‘Groundwater’’ – retrieved from http://pubs.usgs.gov/edu/waterdistri-bution.html.
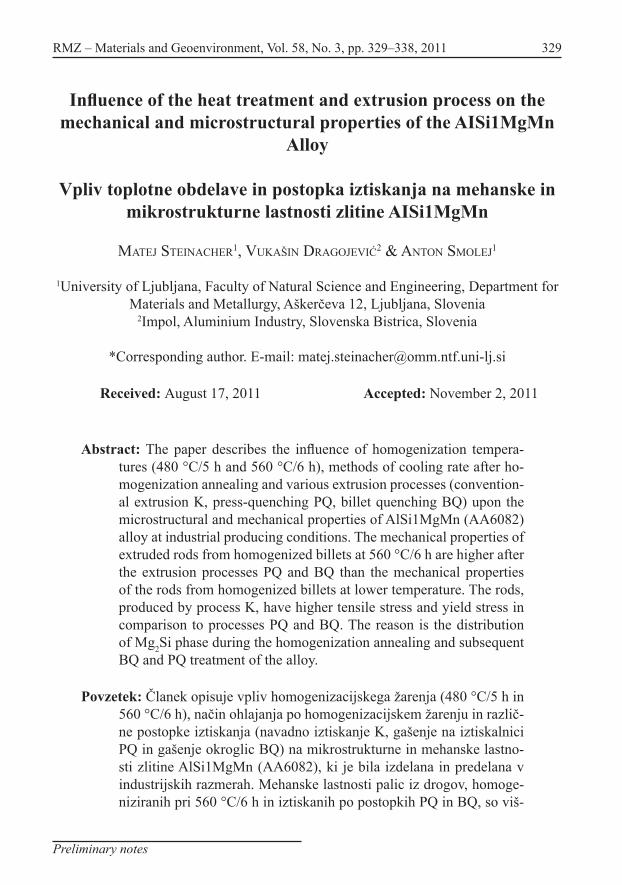
329
Preliminary notes
RMZ – Materials and Geoenvironment, Vol. 58, No. 3, pp. 329–338, 2011
Influence of the heat treatment and extrusion process on the mechanical and microstructural properties of the AISi1MgMn
Alloy
Vpliv toplotne obdelave in postopka iztiskanja na mehanske in mikrostrukturne lastnosti zlitine AISi1MgMn
Matej Steinacher1, vuKašin draGojević2 & anton SMoLej1
1University of Ljubljana, Faculty of Natural Science and Engineering, Department for Materials and Metallurgy, Aškerčeva 12, Ljubljana, Slovenia
2Impol, Aluminium Industry, Slovenska Bistrica, Slovenia
*Corresponding author. E-mail: [email protected]
Received: August 17, 2011 Accepted: November 2, 2011
Abstract: The paper describes the influence of homogenization tempera-tures (480 °C/5 h and 560 °C/6 h), methods of cooling rate after ho-mogenization annealing and various extrusion processes (convention-al extrusion K, press-quenching PQ, billet quenching BQ) upon the microstructural and mechanical properties of AlSi1MgMn (AA6082) alloy at industrial producing conditions. The mechanical properties of extruded rods from homogenized billets at 560 °C/6 h are higher after the extrusion processes PQ and BQ than the mechanical properties of the rods from homogenized billets at lower temperature. The rods, produced by process K, have higher tensile stress and yield stress in comparison to processes PQ and BQ. The reason is the distribution of Mg2Si phase during the homogenization annealing and subsequent BQ and PQ treatment of the alloy.
Povzetek: Članek opisuje vpliv homogenizacijskega žarenja (480 °C/5 h in 560 °C/6 h), način ohlajanja po homogenizacijskem žarenju in različ-ne postopke iztiskanja (navadno iztiskanje K, gašenje na iztiskalnici PQ in gašenje okroglic BQ) na mikrostrukturne in mehanske lastno-sti zlitine AlSi1MgMn (AA6082), ki je bila izdelana in predelana v industrijskih razmerah. Mehanske lastnosti palic iz drogov, homoge-niziranih pri 560 °C/6 h in iztiskanih po postopkih PQ in BQ, so viš-
330 Steinacher, M., draGojević, v. & SMoLej, a.
RMZ-M&G 2011, 58
je kot mehanske lastnosti palic iz drogov, homogeniziranih pri nižji temperaturi. Palice, ki so bile izdelane po tehnologiji K, imajo višje mehanske lastnosti v primerjavi s postopkoma PQ in BQ. Vzrok je porazdelitev faze Mg2Si med homogenizacijskim žarenjem in nadalj-njo BQ- in PQ-obdelavo zlitine.
Key words: AISi1MgMn alloy, homogenization, extrusionKljučne besede: zlitina AlSi1MgMn, homogenizacija, iztiskanje
introduction
Investigated AlSi1MgMn alloy be-longs to the AA6xxx (AlMgSi) series of aluminium alloys, where magnesi-um and silicon are the principal alloy-ing elements. The commercial alloys of this type contain the mass fractions 0.5 % to 1.5 % of Si and 0.5 % to 1.5 % of Mg and are used in great quanti-ties and they are universal aluminium alloys which can be extruded into sec-tions, rods and tubes. Their character-istics are high workability, strength properties, corrosion resistance and machinability. Their mechanical and technological properties depend on the chemical composition and heat treat-ment of castings i. e. cast blanks and extruded pieces.[1, 2]
Heat treatment of castings consists of the homogenization annealing where principal factors are temperature and time of annealing, and the cooling rate of material to the ambient temperature. The way of cooling influences the pre-cipitation of those alloying elements which are in solid solution during the
homogenization annealing. The size and the distribution of secondary pre-cipitates influence the stress required for deformation, extrusion rate, surface quality, and mechanical properties of extruded pieces. Optimal properties of semiproducts depend also on the re-heating of homogenized castings to the temperature of the extrusion process.[2]
The influence of the cooling after the homogenization on the extrusion rate was widely investigated, but find-ings were often controversial.[3–8] It is known that Mg2Si precipitates have to be fine and uniformly distributed in the matrix.[8]
The conventional extrusion process of the alloy includes the homogeniza-tion annealing of as-cast billets, cool-ing from the annealing temperature by air fans (H) or by water sprays (HP), heating to the forming temperature, extrusion, separated solution treatment in the salt bath, quenching, and artifi-cial aging.[9] Recently, the development of the extrusion of the 6xxx series al-loys combined different technological
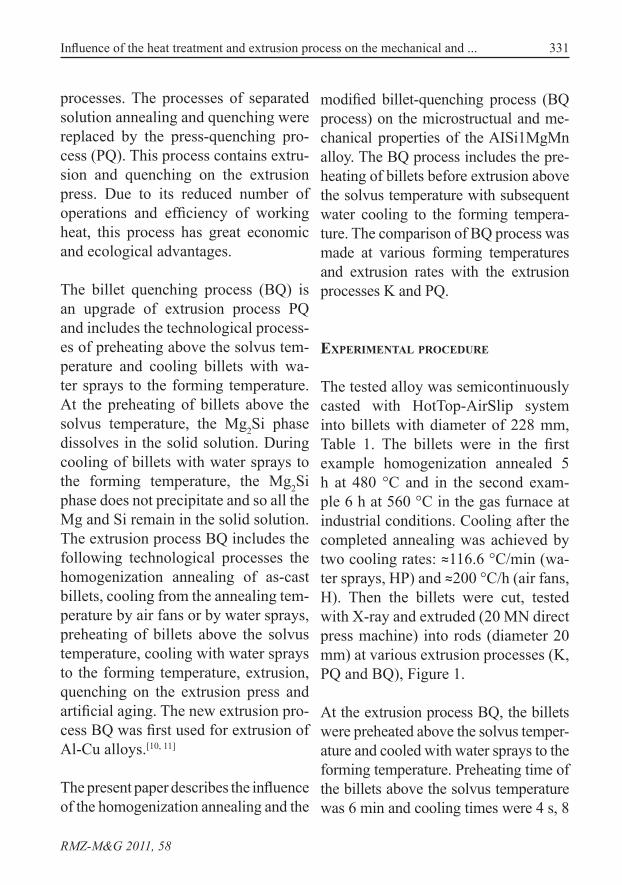
331Influence of the heat treatment and extrusion process on the mechanical and ...
RMZ-M&G 2011, 58
processes. The processes of separated solution annealing and quenching were replaced by the press-quenching pro-cess (PQ). This process contains extru-sion and quenching on the extrusion press. Due to its reduced number of operations and efficiency of working heat, this process has great economic and ecological advantages.
The billet quenching process (BQ) is an upgrade of extrusion process PQ and includes the technological process-es of preheating above the solvus tem-perature and cooling billets with wa-ter sprays to the forming temperature. At the preheating of billets above the solvus temperature, the Mg2Si phase dissolves in the solid solution. During cooling of billets with water sprays to the forming temperature, the Mg2Si phase does not precipitate and so all the Mg and Si remain in the solid solution. The extrusion process BQ includes the following technological processes the homogenization annealing of as-cast billets, cooling from the annealing tem-perature by air fans or by water sprays, preheating of billets above the solvus temperature, cooling with water sprays to the forming temperature, extrusion, quenching on the extrusion press and artificial aging. The new extrusion pro-cess BQ was first used for extrusion of Al-Cu alloys.[10, 11]
The present paper describes the influence of the homogenization annealing and the
modified billet-quenching process (BQ process) on the microstructual and me-chanical properties of the AISi1MgMn alloy. The BQ process includes the pre-heating of billets before extrusion above the solvus temperature with subsequent water cooling to the forming tempera-ture. The comparison of BQ process was made at various forming temperatures and extrusion rates with the extrusion processes K and PQ.
experimental procedure
The tested alloy was semicontinuously casted with HotTop-AirSlip system into billets with diameter of 228 mm, Table 1. The billets were in the first example homogenization annealed 5 h at 480 °C and in the second exam-ple 6 h at 560 °C in the gas furnace at industrial conditions. Cooling after the completed annealing was achieved by two cooling rates: ≈116.6 °C/min (wa-ter sprays, HP) and ≈200 °C/h (air fans, H). Then the billets were cut, tested with X-ray and extruded (20 MN direct press machine) into rods (diameter 20 mm) at various extrusion processes (K, PQ and BQ), Figure 1.
At the extrusion process BQ, the billets were preheated above the solvus temper-ature and cooled with water sprays to the forming temperature. Preheating time of the billets above the solvus temperature was 6 min and cooling times were 4 s, 8
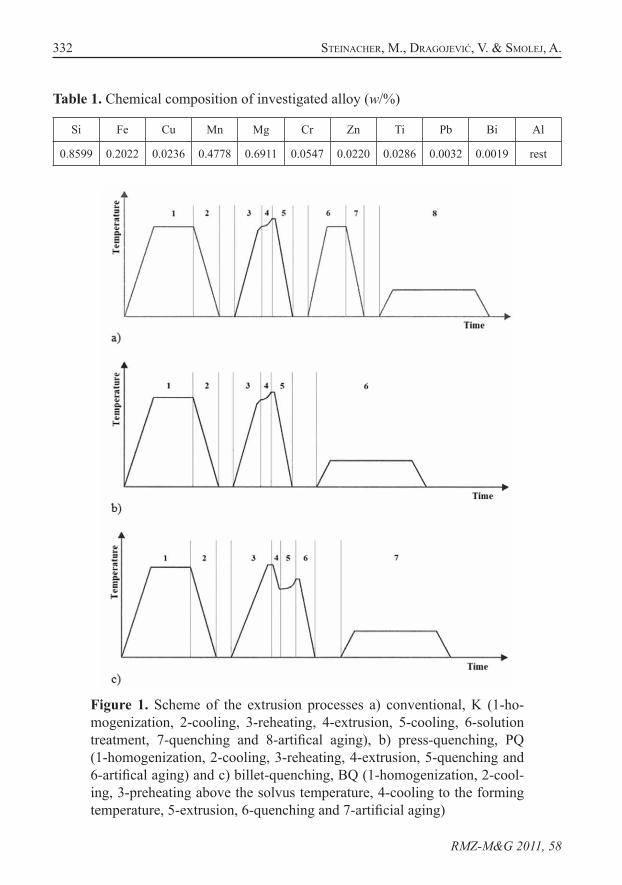
332 Steinacher, M., draGojević, v. & SMoLej, a.
RMZ-M&G 2011, 58
Figure 1. Scheme of the extrusion processes a) conventional, K (1-ho-mogenization, 2-cooling, 3-reheating, 4-extrusion, 5-cooling, 6-solution treatment, 7-quenching and 8-artifical aging), b) press-quenching, PQ (1-homogenization, 2-cooling, 3-reheating, 4-extrusion, 5-quenching and 6-artifical aging) and c) billet-quenching, BQ (1-homogenization, 2-cool-ing, 3-preheating above the solvus temperature, 4-cooling to the forming temperature, 5-extrusion, 6-quenching and 7-artificial aging)
Table 1. Chemical composition of investigated alloy (w/%)
Si Fe Cu Mn Mg Cr Zn Ti Pb Bi Al
0.8599 0.2022 0.0236 0.4778 0.6911 0.0547 0.0220 0.0286 0.0032 0.0019 rest
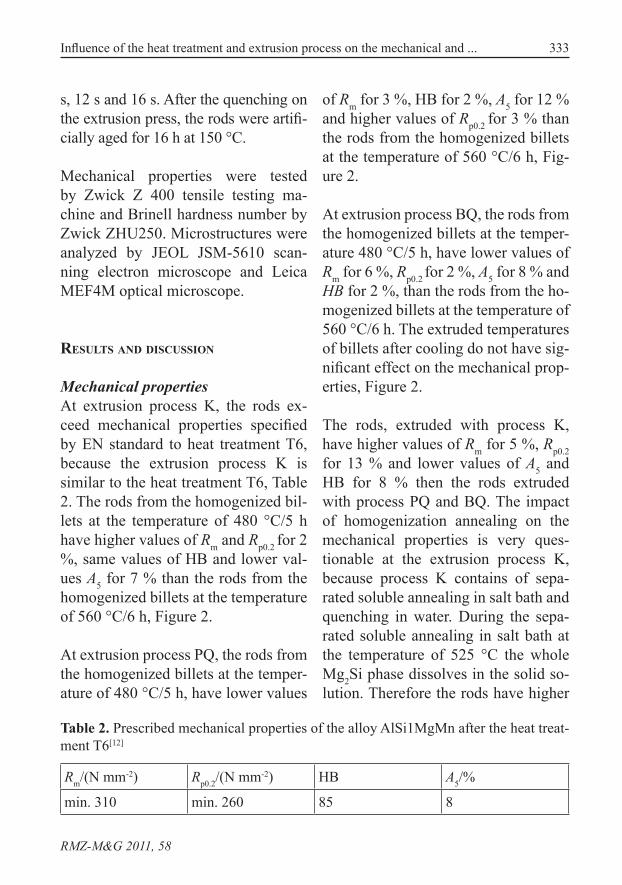
333Influence of the heat treatment and extrusion process on the mechanical and ...
RMZ-M&G 2011, 58
s, 12 s and 16 s. After the quenching on the extrusion press, the rods were artifi-cially aged for 16 h at 150 °C.
Mechanical properties were tested by Zwick Z 400 tensile testing ma-chine and Brinell hardness number by Zwick ZHU250. Microstructures were analyzed by JEOL JSM-5610 scan-ning electron microscope and Leica MEF4M optical microscope.
results and discussion
Mechanical propertiesAt extrusion process K, the rods ex-ceed mechanical properties specified by EN standard to heat treatment T6, because the extrusion process K is similar to the heat treatment T6, Table 2. The rods from the homogenized bil-lets at the temperature of 480 °C/5 h have higher values of Rm and Rp0.2 for 2 %, same values of HB and lower val-ues A5 for 7 % than the rods from the homogenized billets at the temperature of 560 °C/6 h, Figure 2.
At extrusion process PQ, the rods from the homogenized billets at the temper-ature of 480 °C/5 h, have lower values
of Rm for 3 %, HB for 2 %, A5 for 12 % and higher values of Rp0.2 for 3 % than the rods from the homogenized billets at the temperature of 560 °C/6 h, Fig-ure 2.
At extrusion process BQ, the rods from the homogenized billets at the temper-ature 480 °C/5 h, have lower values of Rm for 6 %, Rp0.2 for 2 %, A5 for 8 % and HB for 2 %, than the rods from the ho-mogenized billets at the temperature of 560 °C/6 h. The extruded temperatures of billets after cooling do not have sig-nificant effect on the mechanical prop-erties, Figure 2.
The rods, extruded with process K, have higher values of Rm for 5 %, Rp0.2 for 13 % and lower values of A5 and HB for 8 % then the rods extruded with process PQ and BQ. The impact of homogenization annealing on the mechanical properties is very ques-tionable at the extrusion process K, because process K contains of sepa-rated soluble annealing in salt bath and quenching in water. During the sepa-rated soluble annealing in salt bath at the temperature of 525 °C the whole Mg2Si phase dissolves in the solid so-lution. Therefore the rods have higher
Table 2. Prescribed mechanical properties of the alloy AlSi1MgMn after the heat treat-ment T6[12]
Rm/(N mm-2) Rp0.2/(N mm-2) HB A5/%
min. 310 min. 260 85 8
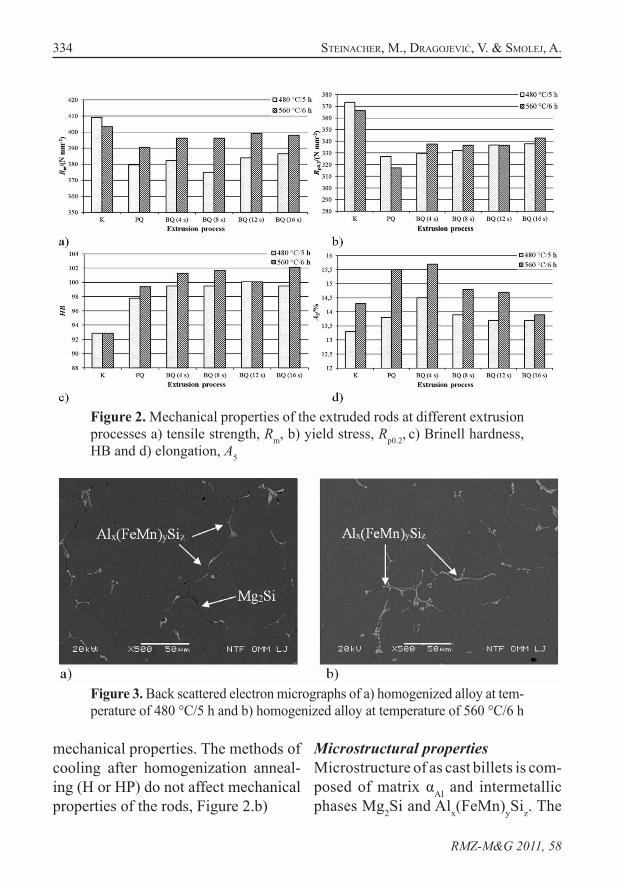
334 Steinacher, M., draGojević, v. & SMoLej, a.
RMZ-M&G 2011, 58
mechanical properties. The methods of cooling after homogenization anneal-ing (H or HP) do not affect mechanical properties of the rods, Figure 2.b)
Microstructural propertiesMicrostructure of as cast billets is com-posed of matrix αAl and intermetallic phases Mg2Si and Alx(FeMn)ySiz. The
Figure 2. Mechanical properties of the extruded rods at different extrusion processes a) tensile strength, Rm, b) yield stress, Rp0.2, c) Brinell hardness, HB and d) elongation, A5
Figure 3. Back scattered electron micrographs of a) homogenized alloy at tem-perature of 480 °C/5 h and b) homogenized alloy at temperature of 560 °C/6 h
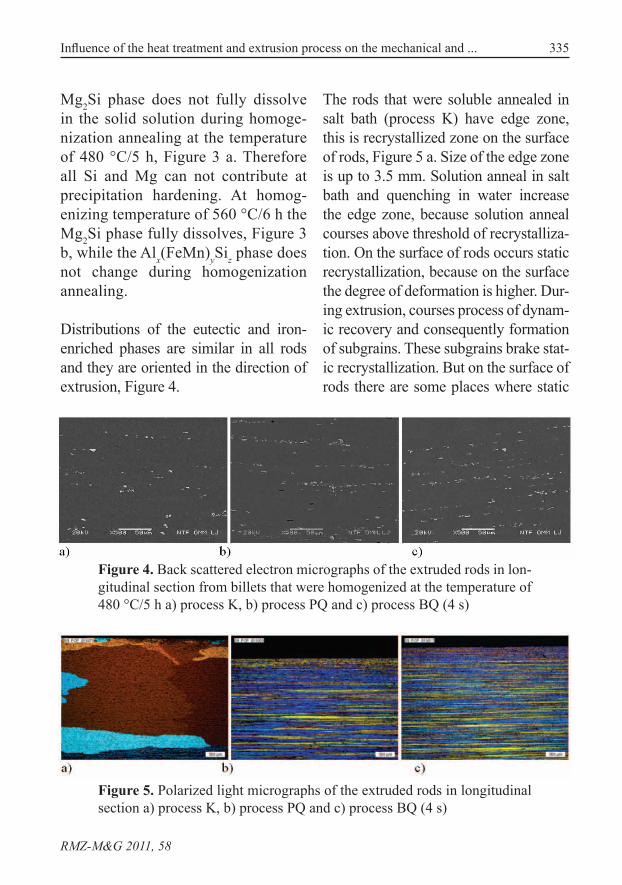
335Influence of the heat treatment and extrusion process on the mechanical and ...
RMZ-M&G 2011, 58
Mg2Si phase does not fully dissolve in the solid solution during homoge-nization annealing at the temperature of 480 °C/5 h, Figure 3 a. Therefore all Si and Mg can not contribute at precipitation hardening. At homog-enizing temperature of 560 °C/6 h the Mg2Si phase fully dissolves, Figure 3 b, while the Alx(FeMn)ySiz phase does not change during homogenization annealing.
Distributions of the eutectic and iron-enriched phases are similar in all rods and they are oriented in the direction of extrusion, Figure 4.
The rods that were soluble annealed in salt bath (process K) have edge zone, this is recrystallized zone on the surface of rods, Figure 5 a. Size of the edge zone is up to 3.5 mm. Solution anneal in salt bath and quenching in water increase the edge zone, because solution anneal courses above threshold of recrystalliza-tion. On the surface of rods occurs static recrystallization, because on the surface the degree of deformation is higher. Dur-ing extrusion, courses process of dynam-ic recovery and consequently formation of subgrains. These subgrains brake stat-ic recrystallization. But on the surface of rods there are some places where static
Figure 4. Back scattered electron micrographs of the extruded rods in lon-gitudinal section from billets that were homogenized at the temperature of 480 °C/5 h a) process K, b) process PQ and c) process BQ (4 s)
Figure 5. Polarized light micrographs of the extruded rods in longitudinal section a) process K, b) process PQ and c) process BQ (4 s)
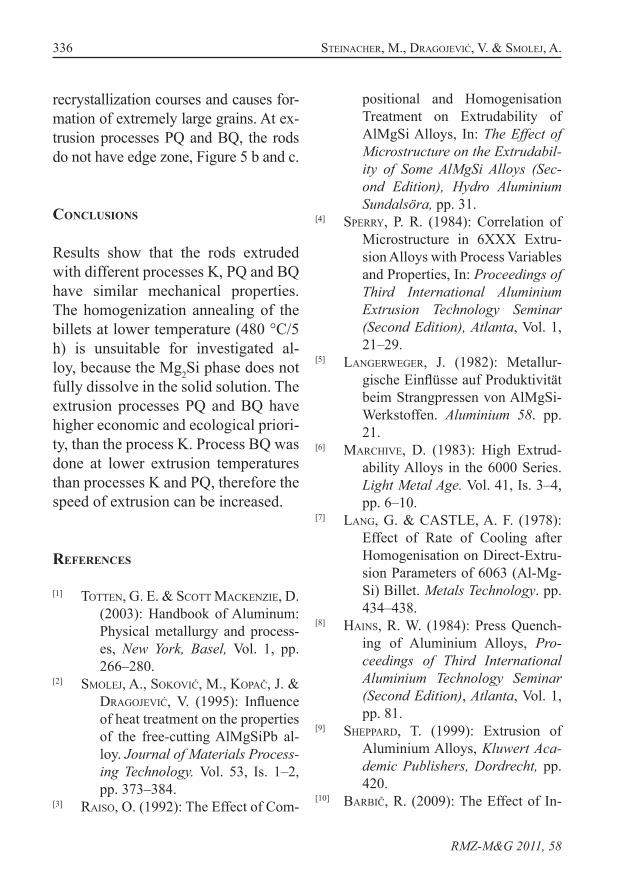
336 Steinacher, M., draGojević, v. & SMoLej, a.
RMZ-M&G 2011, 58
recrystallization courses and causes for-mation of extremely large grains. At ex-trusion processes PQ and BQ, the rods do not have edge zone, Figure 5 b and c.
conclusions
Results show that the rods extruded with different processes K, PQ and BQ have similar mechanical properties. The homogenization annealing of the billets at lower temperature (480 °C/5 h) is unsuitable for investigated al-loy, because the Mg2Si phase does not fully dissolve in the solid solution. The extrusion processes PQ and BQ have higher economic and ecological priori-ty, than the process K. Process BQ was done at lower extrusion temperatures than processes K and PQ, therefore the speed of extrusion can be increased.
references
[1] Totten, G. E. & Scott MacKenzie, D. (2003): Handbook of Aluminum: Physical metallurgy and process-es, New York, Basel, Vol. 1, pp. 266–280.
[2] SMoLej, A., SoKović, M., KoPač, J. & DraGojević, V. (1995): Influence of heat treatment on the properties of the free-cutting AlMgSiPb al-loy. Journal of Materials Process-ing Technology. Vol. 53, Is. 1–2, pp. 373–384.
[3] RaiSo, O. (1992): The Effect of Com-
positional and Homogenisation Treatment on Extrudability of AlMgSi Alloys, In: The Effect of Microstructure on the Extrudabil-ity of Some AlMgSi Alloys (Sec-ond Edition), Hydro Aluminium Sundalsöra, pp. 31.
[4] SPerry, P. R. (1984): Correlation of Microstructure in 6XXX Extru-sion Alloys with Process Variables and Properties, In: Proceedings of Third International Aluminium Extrusion Technology Seminar (Second Edition), Atlanta, Vol. 1, 21–29.
[5] LanGerweGer, J. (1982): Metallur-gische Einflüsse auf Produktivität beim Strangpressen von AlMgSi-Werkstoffen. Aluminium 58. pp. 21.
[6] Marchive, D. (1983): High Extrud-ability Alloys in the 6000 Series. Light Metal Age. Vol. 41, Is. 3–4, pp. 6–10.
[7] LanG, G. & CASTLE, A. F. (1978): Effect of Rate of Cooling after Homogenisation on Direct-Extru-sion Parameters of 6063 (Al-Mg-Si) Billet. Metals Technology. pp. 434–438.
[8] HainS, R. W. (1984): Press Quench-ing of Aluminium Alloys, Pro-ceedings of Third International Aluminium Technology Seminar (Second Edition), Atlanta, Vol. 1, pp. 81.
[9] ShePPard, T. (1999): Extrusion of Aluminium Alloys, Kluwert Aca-demic Publishers, Dordrecht, pp. 420.
[10] BarBič, R. (2009): The Effect of In-
337Influence of the heat treatment and extrusion process on the mechanical and ...
RMZ-M&G 2011, 58
tensive Billet Cooling on Press Quenching and Properties of Al-Cu Alloys, Doctoral thesis, Uni-versity of Ljubljana, Faculty of Natural Sciences and Engineer-ing, Department for Materials and Metallurgy, Ljubljana.
[11] BarBič, r., draGojević, v. & SMoLej, a. (2010): Billet quenching extru-sion process as efficient and reli-
able replacement for conventional extrusion of Al-Cu alloys. Materi-als Science and Technology. Vol. 26, No. 1, pp. 58–65.
[12] Europäisches KOmitte für Nor-mung, Aluminium und Alumin-iumlegirungen-Stranggepresste Stangen, Rohren und Profile-Teil 2: Mechanische Eingeschaften, 1997, EN 755-2.

RMZ-M&G 2011, 58
339
Event notes
RMZ – Materials and Geoenvironment, Vol. 58, No. 3, pp. 339–342, 2011
Petdeset let delovanja Metalurškega instituta “Kemal Kapetanović” v Zenici
Dne 25. oktobra se je na Metalurškem institutu ''Kemal Kapetanović'' v Zenici odvijal slavnostni dogodek – praznovanje 50-letnice delovanja.
Metalurški institut ''Kemal Kapetanović'' v Zenici deluje kot znanstvenorazisko-valna institucija že polnih 50 let. Institut je bil osnovan v času, ko so intenzivna rast proizvodnje in tehnološke zahteve pri proizvodnji jekla pokazale, da je sto-pnja raziskav in razvoja presegla nivo, ki ga je do tedaj uspel zagotavljati Odde-lek tehnične kontrole Železarne Zenica.
Na čelu s prof. dr. Kemalom Kapetanovićem, kot glavnim zagovornikom osno-vanja instituta, je leta 1961 institut začel svoje delo. Institut je imel jasno vizijo, perspektivo ter potrebo po izpolnitvi velikih pričakovanj celotne tedanje družbe.
Velika pozornost je bila posvečena osnovnemu konceptu raziskovalnega dela. Prevladala je orientacija, da se institut prvenstveno osredini na področji aplika-tivnega in razvojnega dela za potrebe črne metalurgije, primarno pa za potrebe tedanje Železarne Zenica.
Ta koncept je omogočil institutu hitro vključevanje v reševanje problematike proizvodnje, po orientaciji in programu dela pa ni prihajal v kolizijo z drugimi raziskovalnimi centri v bivši skupni državi. Za tako opredelitev je imel institut svetle vzore v zahodnoevropskih državah z visoko razvito metalurgijo, kot so npr. Nemčija, Avstrija, Švedska, ...
Metalurški institut ''Kemal Kapetanović'' si je pridobil velik ugled tako v poslov-nem kot tudi političnem svetu. Vključevanje v številne pomembne projekte zu-naj Bosne in Hercegovine je v tem času afirmiralo institut ne samo na področju bivše skupne države, temveč tudi širše. Vzpostavljeni so bili številni kontakti s priznanimi svetovnimi institucijami znanja, kar je močno prispevalo k dvigu ugleda instituta.
S ciljem prilagoditi se tedanjim sistemskim zakonom in zahtevam trga je institut leta 1991 z izdajo internih delnic začel aktivnosti pri reorganizaciji instituta kot delniške družbe z mešanim lastništvom. Težko obdobje po neljubih dogodkih na
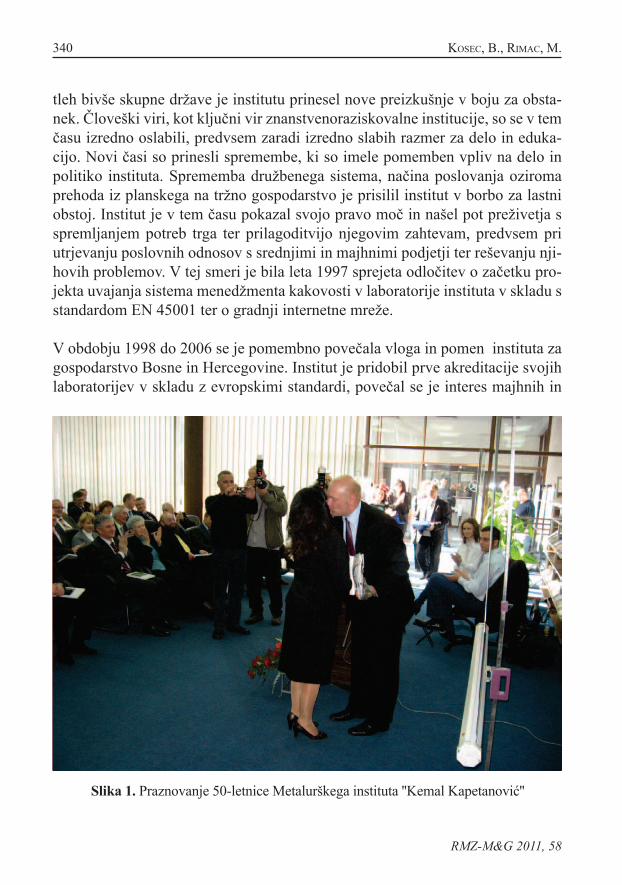
340 KoSec, B., riMac, M.
RMZ-M&G 2011, 58
tleh bivše skupne države je institutu prinesel nove preizkušnje v boju za obsta-nek. Človeški viri, kot ključni vir znanstvenoraziskovalne institucije, so se v tem času izredno oslabili, predvsem zaradi izredno slabih razmer za delo in eduka-cijo. Novi časi so prinesli spremembe, ki so imele pomemben vpliv na delo in politiko instituta. Sprememba družbenega sistema, načina poslovanja oziroma prehoda iz planskega na tržno gospodarstvo je prisilil institut v borbo za lastni obstoj. Institut je v tem času pokazal svojo pravo moč in našel pot preživetja s spremljanjem potreb trga ter prilagoditvijo njegovim zahtevam, predvsem pri utrjevanju poslovnih odnosov s srednjimi in majhnimi podjetji ter reševanju nji-hovih problemov. V tej smeri je bila leta 1997 sprejeta odločitev o začetku pro-jekta uvajanja sistema menedžmenta kakovosti v laboratorije instituta v skladu s standardom EN 45001 ter o gradnji internetne mreže.
V obdobju 1998 do 2006 se je pomembno povečala vloga in pomen instituta za gospodarstvo Bosne in Hercegovine. Institut je pridobil prve akreditacije svojih laboratorijev v skladu z evropskimi standardi, povečal se je interes majhnih in
Slika 1. Praznovanje 50-letnice Metalurškega instituta ''Kemal Kapetanović''
341Petdeset let delovanja Metalurškega instituta “Kemal Kapetanović” v Zenici
RMZ-M&G 2011, 58
srednje velikih podjetij za delo in storitve instituta tako v Bosni in Hercegovini kot tudi širše, prav tako se je obnovilo tudi prekinjeno sodelovanje z velikimi poslovnimi sistemi.
Zeniško-dobojski kanton je konec leta 2006 kot lastnik kapitala prevzel pravi-ce in obveznosti ustanovitelja Metalurškega instituta ''Kemal Kapetanović'' ter potrdil njegov status organizacijske enote Univerze v Zenici. Tako se je institut vključil v visokošolsko institucijo s ciljem povezave znanstvenoraziskovalnega dela, izobraževanja in gospodarstva.
Leto 2011 pomeni za institut petdeset let njegovega obstoja in delovanja. Glede na razmere in okolje, v katerem je deloval in deluje še danes, lahko rečemo, da je bil zelo uspešen. Z gotovostjo lahko zapišemo, da je Metalurški institut ''Kemal Kapetanović'' pustil pomemben pečat v obdobju 1961–2011. Pokazal je, da so moč znanja, volja in upornost nujni za razvoj družbe in gospodarstva.
Vizija instituta je nadaljevati tradicijo uspešnega poslovanja in obstanka v tem prostoru. Institut želi biti iniciator in nosilec razvoja ter uvajanja novih tehnologij in materialov, dviga kakovosti proizvodov ter konzultantska insti-tucija predvsem za podjetja zeniško-dobojskega kantona. Institut želi v nasle-dnjem obdobju pridobiti več državnih merilnih laboratorijev ter biti podpora Univerzi v Zenici pri vzgoji dodiplomskih in podiplomskih študentov ter mladih strokovnjakov iz industrije. S pridobitvijo mednarodnih akreditacij za določene laboratorijske storitve v letošnjem letu je institut ustvaril realne pogoje, da ponudi svoje znanje in storitve tudi zunaj Bosne in Hercegovine.
Institut je v zadnjih letih vzpostavil tudi pristne odnose na znanstvenorazisko-valnem in poslovnem področju s slovenskimi institucijami znanja ter podjetji.
Več informacij o Metalurškem institutu ''Kemal Kapetanović'' v Zenici lahko dobite na njihovi spletni strani www.miz.ba oziroma po elektronski pošti [email protected] ter telefonu: 00 387 32 247 999 in faksu 00 387 247 980.
Borut Kosec, Univerza v Ljubljani, Naravoslovnotehniška fakultetaMilenko Rimac, Metalurški institut ''Kemal Kapetanović''
342 Author’s Index
RMZ-M&G 2011, 58RMZ-M&G 2011, 58
Author`s Index, Vol. 58, No. 3
Chen Jiawen [email protected] V. K.Dragojević Vukašin [email protected]ć Mirko [email protected]č Tjaša [email protected] Borut [email protected] Ladislav [email protected]žuh Stjepan Lamut Martin [email protected]ć Ladislav [email protected] B. K. [email protected] Milenko Smolej Anton [email protected] Matej [email protected] Abel O. [email protected] Moshood N. [email protected] B.Zavšek Simon [email protected]Žula Janja [email protected]
343Instructions to authors
RMZ-M&G 2011, 58
INSTRUCTIONS TO AUTHORS
RMZ-MATERIALS & GEOENVIRONMENT (RMZ- Materiali in geookolje) is a periodical publication with four issues per year (established 1952 and renamed to RMZ-M&G in 1998). The main topics of contents are Mining and Geotechnology, Metallurgy and Materials, Geology and Geoenvironment.
RMZ-M&G publishes original Scientific articles, Review papers, Preliminary notes, Professional papers in English. In addition, evaluations of other publications (books, monographs,...), In memoriam, Professional remarks and reviews are welcome. The Title, Abstract and Key words in Slovene will be included by the author(s) or will be provided by the referee or the Editorial Office.
* Additional information and remarks for Slovenian authors:Only Professional papers, Publications notes, Events notes, Discussion of papers and In memoriam, will be exceptionally published in the Slovenian language.
Authorship and originality of the contributions. Authors are responsible for originality of presented data, ideas and conclusions as well as for correct citation of data adopted from other sources. The publication in RMZ-M&G obligate authors that the article will not be published anywhere else in the same form.
Specification of Contributions
RMZ-M&G will publish papers of the following categories:
Full papers (optimal number of pages is 7 to 15, longer articles should be discussed with Editor prior to submission). An abstract is required.
• Original scientific papers represent unpublished results of original research.
• Review papers summarize previously published scientific, research and/or expertise articles on the new scientific level and can contain also other cited sources, which are not mainly result of author(s).
344 Instructions to authors
RMZ-M&G 2011, 58
• Preliminary notes represent preliminary research findings, which should be published rapidly.
• Professional papers are the result of technological research achievements, application research results and information about achievements in practice and industry.
Short papers (the number of pages is limited to 1 for Discussion of papers and 2 pages for Publication note, Event note and In Memoriam). No abstract is required for short papers.
• Publication notes contain author’s opinion on new published books, monographs, textbooks, or other published material. A figure of cover page is expected.
• Event notes in which descriptions of a scientific or professional event are given.
• Discussion of papers (Comments) where only professional disagreements can be discussed. Normally the source author(s) reply the remarks in the same issue.
• In memoriam (a photo is expected).
Supervision and review of manuscripts. All manuscripts will be supervised. The referees evaluate manuscripts and can ask authors to change particular segments, and propose to the Editor the acceptability of submitted articles. Authors can suggest the referee but Editor has a right to choose another. The name of the referee remains anonymous. The technical corrections will be done too and authors can be asked to correct missing items. The final decision whether the manuscript will be published is made by the Editor in Chief.
The Form of the Manuscript
The manuscript should be submitted as a complete hard copy including figures and tables. The figures should also be enclosed separately, both charts and photos in the original version. In addition, all material should also be provided in electronic form on a diskette or a CD. The necessary information can conveniently also be delivered by E-mail.
345Instructions to authors
RMZ-M&G 2011, 58
Composition of manuscript is defined in the attached Template
The original file of Template is available on RMZ-Materials and Geoenvironment Home page address:
http://www.rmz-mg.com
References - can be arranged in two ways:- first possibility: alphabetic arrangement of first authors - in text: (Borgne, 1955),or- second possibility: [1] numerated in the same order as cited in the text: example[1]
Format of papers in journals:Le BorGne, e. (1955): Susceptibilite magnetic anomale du sol superficiel. Annales de Geophysique, 11, pp. 399–419.
Format of books:roBertS, j. L. (1989): Geological structures, MacMillan, London, 250 p.
Text on the hard print copy can be prepared with any text-processor. The electronic version on the diskette, CD or E-mail transfer should be in MS Word or ASCII format.Captions of figures and tables should be enclosed separately.Figures (graphs and photos) and tables should be original and sent separately in addition to text. They can be prepared on paper or computer designed (MSExcel, Corel, Acad).Format. Electronic figures are recommended to be in CDR, Al, EPS, TIF or JPG formats. Resolution of bitmap graphics (TIF, JPG) should be at least 300 dpi. Text in vector graphics (CDR, Al, EPS) must be in MSWord Times typography or converted in curves.Color prints. Authors will be charged for color prints of figures and photos.Labeling of the additionally provided material for the manuscript should be very clear and must contain at least the lead author’s name, address, the beginning of the title and the date of delivery of the manuscript. In case of an E-mail transfer the exact message with above asked data must accompany the attachment with the file containing the manuscript.
346 Instructions to authors
RMZ-M&G 2011, 58
Information about RMZ-M&G:Editor in Chief prof. dr. Peter Fajfar (phone: ++386 1 4250-316) orSecretary Barbara Bohar Bobnar, univ. dipl. ing. geol. (phone: ++386 1 4704-630),Aškerčeva 12, 1000 Ljubljana, Sloveniaor at E-mail addresses:[email protected], [email protected]
Sending of manuscripts. Manuscripts can be sent by mail to the Editorial Office address:• RMZ-Materials & Geoenvironment Aškerčeva 12, 1000 Ljubljana, Slovenia or delivered to:• Reception of the Faculty of Natural Science and Engineering (for RMZ-
M&G) Aškerčeva 12, 1000 Ljubljana, Slovenia • E-mail - addresses of Editor and Secretary• You can also contact them on their phone numbers.
These instructions are valid from August 2009
347Instructions to authors
RMZ-M&G 2011, 58
NAVODILA AVTORJEM
RMZ-MATERIALS AND GEOENVIRONMENT (RMZ- Materiali in geookolje) – kratica RMZ-M&G - je revija (ustanovljena kot zbornik 1952 in preimenovana v revijo RMZ-M&G 1998), ki izhaja vsako leto v štirih zvezkih. V reviji objavljamo prispevke s področja rudarstva, geotehnologije, materialov, metalurgije, geologije in geookolja.
RMZ- M&G objavlja izvirne znanstvene, pregledne in strokovne članke ter predhodne objave samo v angleškem jeziku. Strokovni članki so lahko izjemoma napisani v slovenskem jeziku. Kot dodatek so zaželene recenzije drugih publikacij (knjig, monografij …), nekrologi In Memoriam, predstavitve znanstvenih in strokovnih dogodkov, kratke objave in strokovne replike na članke objavljene v RMZ-M&G v slovenskem ali angleškem jeziku. Prispevki naj bodo kratki in jasni.
Avtorstvo in izvirnost prispevkov. Avtorji so odgovorni za izvirnost podatkov, idej in sklepov v predloženem prispevku oziroma za pravilno citiranje privzetih podatkov. Z objavo v RMZ-M&G se tudi obvežejo, da ne bodo nikjer drugje objavili enakega prispevka.
Vrste prispevkov
Optimalno število strani je 7 do 15, za daljše članke je potrebno soglasje glavnega urednika.Izvirni znanstveni članki opisujejo še neobjavljene rezultate lastnih raziskav.Pregledni članki povzemajo že objavljene znanstvene, raziskovalne ali strokovne dosežke na novem znanstvenem nivoju in lahko vsebujejo tudi druge (citirane) vire, ki niso večinsko rezultat dela avtorjev.Predhodna objava povzema izsledke raziskave, ki je v teku in zahteva hitro objavo.Strokovni članki vsebujejo rezultate tehnoloških dosežkov, razvojnih projektov in druge informacije iz prakse.Recenzije publikacij zajemajo ocene novih knjig, monografij, učbenikov, razstav …(do dve strani; zaželena slika naslovnice in kratka navedba osnovnih podatkov - izkaznica).
348 Instructions to authors
RMZ-M&G 2011, 58
In memoriam (do dve strani, zaželena slika).Strokovne pripombe na objavljene članke ne smejo presegati ene strani in opozarjajo izključno na strokovne nedoslednosti objavljenih člankov v prejšnjih številkah RMZ-M&G. Praviloma že v isti številki avtorji prvotnega članka napišejo odgovor na pripombe.Poljudni članki, ki povzemajo znanstvene in strokovne dogodke (do dve strani).
Recenzije. Vsi prispevki bodo predloženi v recenzijo. Recenzent oceni primernost prispevka za objavo in lahko predlaga kot pogoj za objavo dopolnilo k prispevku. Recenzenta izbere Uredništvo med strokovnjaki, ki so dejavni na sorodnih področjih, kot jih obravnava prispevek. Avtorji lahko sami predlagajo recenzenta, vendar si uredništvo pridržuje pravico, da izbere drugega recenzenta. Recenzent ostane anonimen. Prispevki bodo tudi tehnično ocenjeni in avtorji so dolžni popraviti pomanjkljivosti. Končno odločitev za objavo da glavni in odgovorni urednik.
Oblika prispevka
Prispevek predložite v tiskanem oštevilčenem izvodu (po možnosti z vključenimi slikami in tabelami) ter na disketi ali CD, lahko pa ga pošljete tudi prek E-maila. Slike in grafe je možno poslati tudi risane na papirju, fotografije naj bodo originalne.
Razčlenitev prispevka:
Predloga za pisanje članka se nahaja na spletni strani:
http://www.rmz-mg.com/predloga.htm
Seznam literature je lahko urejen na dva načina: -po abecednem zaporedju prvih avtorjev ali -po [1]vrstnem zaporedju citiranosti v prispevku.
Oblika je za oba načina enaka:Članki:
Le BorGne, e. (1955): Susceptibilite magnetic anomale du sol superficiel. Annales de Geophysique; Vol. 11, pp. 399–419.
349Instructions to authors
RMZ-M&G 2011, 58
Knjige:roBertS, j. L. (1989): Geological structures, MacMillan, London, 250 p.
Tekst izpisanega izvoda je lahko pripravljen v kateremkoli urejevalniku. Na disketi, CD ali v elektronskem prenosu pa mora biti v MS Word ali v ASCII obliki.Naslovi slik in tabel naj bodo priloženi posebej. Naslove slik, tabel in celotno besedilo, ki se pojavlja na slikah in tabelah, je potrebno navesti v angleškem in slovenskem jeziku.Slike (ilustracije in fotografije) in tabele morajo biti izvirne in priložene posebej. Njihov položaj v besedilu mora biti jasen iz priloženega kompletnega izvoda. Narejene so lahko na papirju ali pa v računalniški obliki (MS Excel, Corel, Acad).Format elektronskih slik naj bo v EPS, TIF ali JPG obliki z ločljivostjo okrog 300 dpi. Tekst v grafiki naj bo v Times tipografiji.Barvne slike. Objavo barvnih slik sofinancirajo avtorjiOznačenost poslanega materiala. Izpisan izvod, disketa ali CD morajo biti jasno označeni – vsaj z imenom prvega avtorja, začetkom naslova in datumom izročitve uredništvu RMZ-M&G. Elektronski prenos mora biti pospremljen z jasnim sporočilom in z enakimi podatki kot velja za ostale načine posredovanja.
Informacije o RMZ-M&G: urednik prof. dr. Peter Fajfar, univ. dipl. ing. metal. (tel. ++386 1 4250316) ali tajnica Barbara Bohar Bobnar, univ. dipl. ing. geol. (tel. ++386 1 4704630), Aškerčeva 12, 1000 Ljubljanaali na E-mail naslovih:[email protected]@ntf.uni-lj.si
Pošiljanje prispevkov. Prispevke pošljite priporočeno na naslov Uredništva:• RMZ-Materials and Geoenvironment
Aškerčeva 12,1000 Ljubljana, Slovenija
oziroma jih oddajte v• Recepciji Naravoslovnotehniške fakultete (pritličje) (za RMZ-M&G)
Aškerčeva 12,1000 Ljubljana, Slovenija
• Možna je tudi oddaja pri uredniku oziroma pri tajnici.
Navodila veljajo od avgusta 2009.

RMZ-M&G 2011, 58
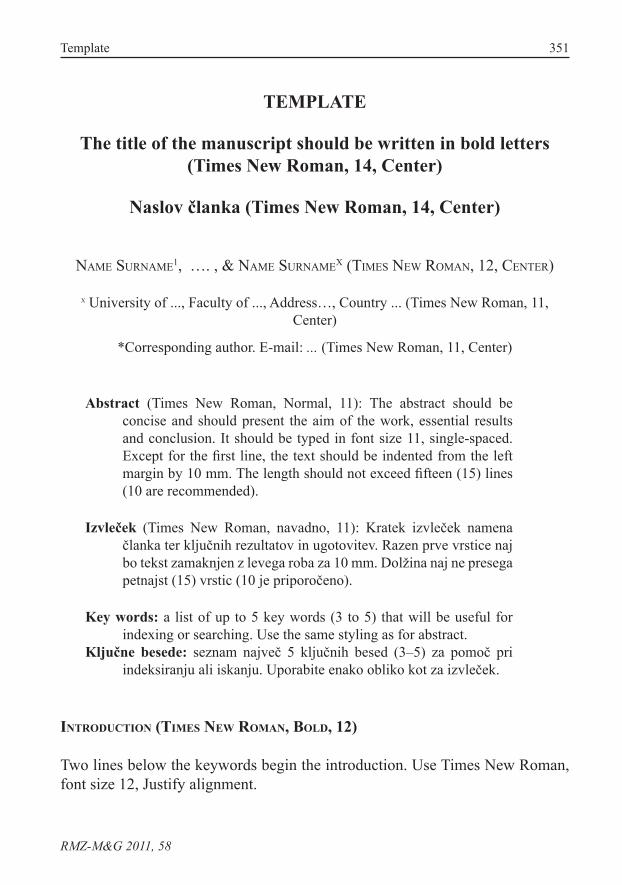
351Template
RMZ-M&G 2011, 58
TEMPLATE
The title of the manuscript should be written in bold letters (Times New Roman, 14, Center)
Naslov članka (Times New Roman, 14, Center)
naMe SurnaMe1, …. , & naMe SurnaMeX (tiMeS new roMan, 12, center)
x University of ..., Faculty of ..., Address…, Country ... (Times New Roman, 11, Center)
*Corresponding author. E-mail: ... (Times New Roman, 11, Center)
Abstract (Times New Roman, Normal, 11): The abstract should be concise and should present the aim of the work, essential results and conclusion. It should be typed in font size 11, single-spaced. Except for the first line, the text should be indented from the left margin by 10 mm. The length should not exceed fifteen (15) lines (10 are recommended).
Izvleček (Times New Roman, navadno, 11): Kratek izvleček namena članka ter ključnih rezultatov in ugotovitev. Razen prve vrstice naj bo tekst zamaknjen z levega roba za 10 mm. Dolžina naj ne presega petnajst (15) vrstic (10 je priporočeno).
Key words: a list of up to 5 key words (3 to 5) that will be useful for indexing or searching. Use the same styling as for abstract.
Ključne besede: seznam največ 5 ključnih besed (3–5) za pomoč pri indeksiranju ali iskanju. Uporabite enako obliko kot za izvleček.
introduction (times new roman, Bold, 12)
Two lines below the keywords begin the introduction. Use Times New Roman, font size 12, Justify alignment.
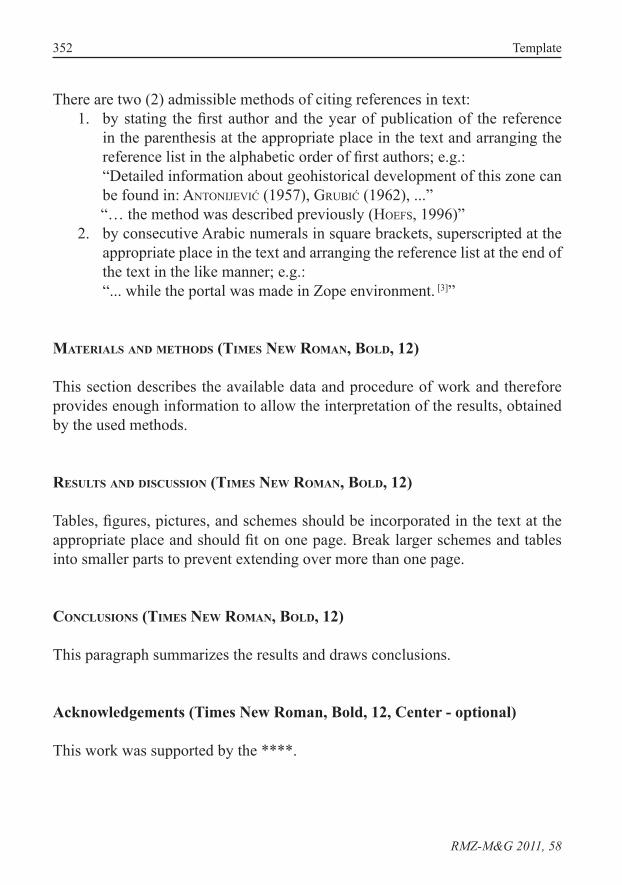
352 Template
RMZ-M&G 2011, 58
There are two (2) admissible methods of citing references in text:1. by stating the first author and the year of publication of the reference
in the parenthesis at the appropriate place in the text and arranging the reference list in the alphabetic order of first authors; e.g.:
“Detailed information about geohistorical development of this zone can be found in: antonijević (1957), GruBić (1962), ...”“… the method was described previously (hoefS, 1996)”
2. by consecutive Arabic numerals in square brackets, superscripted at the appropriate place in the text and arranging the reference list at the end of the text in the like manner; e.g.:
“... while the portal was made in Zope environment. [3]”
materials and methods (times new roman, Bold, 12)
This section describes the available data and procedure of work and therefore provides enough information to allow the interpretation of the results, obtained by the used methods.
results and discussion (times new roman, Bold, 12)
Tables, figures, pictures, and schemes should be incorporated in the text at the appropriate place and should fit on one page. Break larger schemes and tables into smaller parts to prevent extending over more than one page.
conclusions (times new roman, Bold, 12)
This paragraph summarizes the results and draws conclusions.
Acknowledgements (Times New Roman, Bold, 12, Center - optional)
This work was supported by the ****.
353Template
RMZ-M&G 2011, 58
references (times new roman, Bold, 12)
In regard to the method used in the text, the styling, punctuation and capitalization should conform to the following:
FIRST OPTION - in alphabetical ordercaSati, P., jadouL, f., nicora, a., MarineLLi, M., fantini-SeStini, n. & foiS, e. (1981):
Geologia della Valle del’Anisici e dei gruppi M. Popera - Tre Cime di Lavaredo (Dolomiti Orientali). Riv. Ital. Paleont.; Vol. 87, No. 3, pp. 391–400, Milano.
foLK, r. L. (1959): Practical petrographic classification of limestones. Amer. Ass. Petrol. Geol. Bull.; Vol. 43, No. 1, pp. 1–38, Tulsa.
SECOND OPTION - in numerical order[1] trčeK, B. (2001): Solute transport monitoring in the unsaturated zone of the karst
aquifer by natural tracers. Ph. D. Thesis. Ljubljana: University of Ljubljana 2001; 125 p.
[2] hiGaShitani, K., iSeri, h., oKuhara, K., hatade, S. (1995): Magnetic Effects on Zeta Potential and Diffusivity of Nonmagnetic Particles. Journal of Colloid and Interface Science, 172, pp. 383–388.
Citing the Internet site:CASREACT-Chemical reactions database [online]. Chemical Abstracts Service, 2000, updated 2. 2. 2000 [cited 3. 2. 2000]. Accessible on Internet: http://www.cas.org/CASFILES/casreact.html.
Texts in Slovene (title, abstract and key words) can be written by the author(s) or will be provided by the referee or by the Editorial Board.
354 Template
RMZ-M&G 2011, 58
PREDLOGA ZA SLOVENSKE ČLANKE
Naslov članka (Times New Roman, 14, Na sredino)
The title of the manuscript should be written in bold letters (Times New Roman, 14, Center)
iMe PriiMeK1, …, iMe PriiMeKX (tiMeS new roMan, 12, na Sredino)
XUniverza…, Fakulteta…, Naslov…, Država… (Times New Roman, 11, Center)
*Korespondenčni avtor. E-mail: ... (Times New Roman, 11, Center)
Izvleček (Times New Roman, Navadno, 11): Kratek izvleček namena članka ter ključnih rezultatov in ugotovitev. Razen prve j bo tekst zamaknjen z levega roba za 10 mm. Dolžina naj ne presega petnajst (15) vrstic (10 je priporočeno).
Abstract (Times New Roman, Normal, 11): The abstract should be concise and should present the aim of the work, essential results and conclusion. It should be typed in font size 11, single-spaced. Except for the first line, the text should be indented from the left margin by 10 mm. The length should not exceed fifteen (15) lines (10 are recommended).
Ključne besede: seznam največ 5 ključnih besed (3–5) za pomoč pri indeksiranju ali iskanju. Uporabite enako obliko kot za izvleček.
Key words: a list of up to 5 key words (3 to 5) that will be useful for indexing or searching. Use the same styling as for abstract.
uvod (times new roman, KrepKo, 12)
Dve vrstici pod ključnimi besedami se začne Uvod. Uporabite pisavo Times New Roman, velikost črk 12, z obojestransko poravnavo. Naslovi slik in tabel (vključno z besedilom v slikah) morajo biti v slovenskem jeziku.
Slika (Tabela) X. Pripadajoče besedilo k sliki (tabeli)
355Template
RMZ-M&G 2011, 58
Obstajata dve sprejemljivi metodi navajanja referenc:1. z navedbo prvega avtorja in letnice objave reference v oklepaju na
ustreznem mestu v tekstu in z ureditvijo seznama referenc po abecednem zaporedju prvih avtorjev; npr.:
“Detailed information about geohistorical development of this zone can be found in: antonijević (1957), GruBić (1962), ...”
“… the method was described previously (hoefS, 1996)”
ali
2. z zaporednimi arabskimi številkami v oglatih oklepajih na ustreznem mestu v tekstu in z ureditvijo seznama referenc v številčnem zaporedju navajanja; npr.;“... while the portal was made in Zope[3] environment.”
materiali in metode (times new roman, KrepKo, 12)
Ta del opisuje razpoložljive podatke, metode in način dela ter omogoča zadostno količino informacij, da lahko z opisanimi metodami delo ponovimo.
rezultati in razprava (times new roman, KrepKo, 12)
Tabele, sheme in slike je treba vnesti (z ukazom Insert, ne Paste) v tekst na ustreznem mestu. Večje sheme in tabele je po treba ločiti na manjše dele, da ne presegajo ene strani.
sKlepi (times new roman, KrepKo, 12)
Povzetek rezultatov in sklepi.
356 Template
RMZ-M&G 2011, 58
Zahvale (Times New Roman, Krepko, 12, Na sredino - opcija)
Izvedbo tega dela je omogočilo ………
viri (times new roman, KrepKo, 12)
Glede na uporabljeno metodo citiranja referenc v tekstu upoštevajte eno od naslednjih oblik:
PRVA MOŽNOST (priporočena) - v abecednem zaporedjucaSati, P., jadouL, f., nicora, a., MarineLLi, M., fantini-SeStini, n. & foiS, e. (1981):
Geologia della Valle del’Anisici e dei gruppi M. Popera – Tre Cime di Lavaredo (Dolomiti Orientali). Riv. Ital. Paleont.; Vol. 87, No. 3, pp. 391–400, Milano.
foLK, r. L. (1959): Practical petrographic classification of limestones. Amer. Ass. Petrol. Geol. Bull.; Vol. 43, No. 1, pp. 1–38, Tulsa.
DRUGA MOŽNOST - v numeričnem zaporedju[1] trčeK, B. (2001): Solute transport monitoring in the unsaturated zone of the karst
aquifer by natural tracers. Ph. D. Thesis. Ljubljana: University of Ljubljana 2001; 125 p.
[2] hiGaShitani, K., iSeri, h., oKuhara, K., hatade, S. (1995): Magnetic Effects on Zeta Potential and Diffusivity of Nonmagnetic Particles. Journal of Colloid and Interface Science, 172, pp. 383–388.
Citiranje spletne strani:CASREACT-Chemical reactions database [online]. Chemical Abstracts Service, 2000, obnovljeno 2. 2. 2000 [citirano 3. 2. 2000]. Dostopno na svetovnem spletu: http://www.cas.org/CASFILES/casreact.html.
Znanstveni, pregledni in strokovni članki ter predhodne objave se objavijo v angleškem jeziku. Izjemoma se strokovni članek objavi v slovenskem jeziku.