Electrophotocatalysis: Cyclic Voltammetry as an Analytical ...
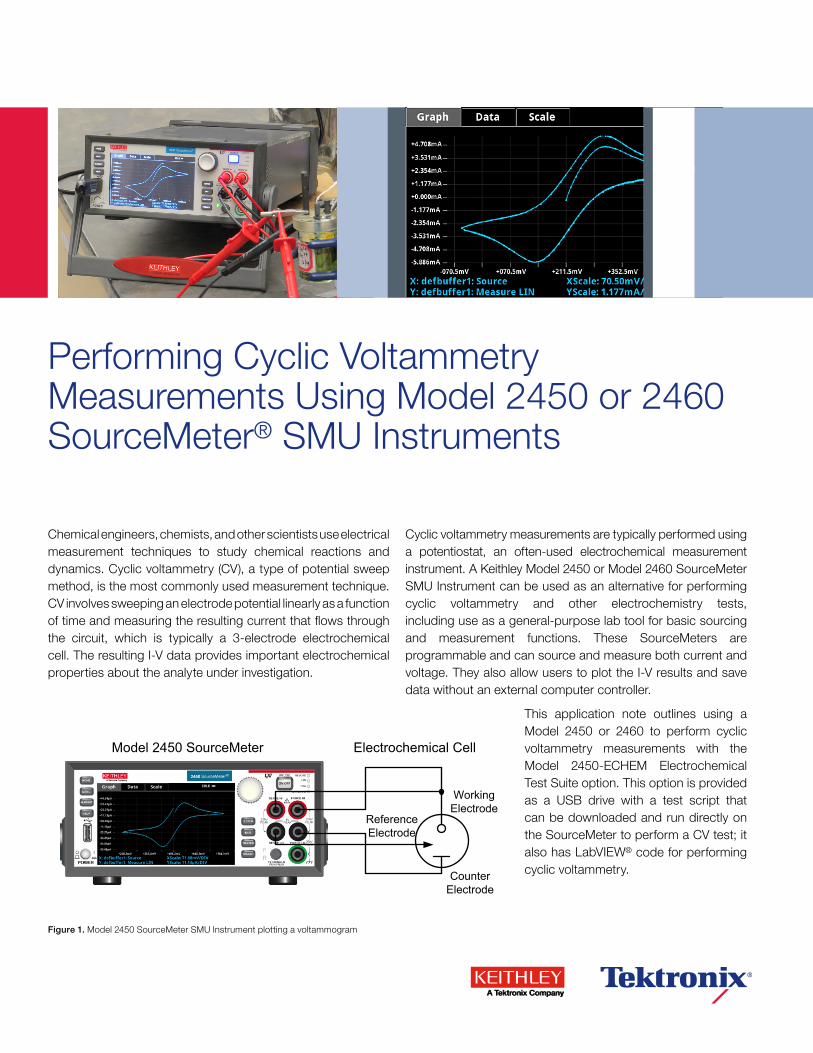
Chemical engineers, chemists, and other scientists use electrical measurement techniques to study chemical reactions and dynamics. Cyclic voltammetry (CV), a type of potential sweep method, is the most commonly used measurement technique. CV involves sweeping an electrode potential linearly as a function of time and measuring the resulting current that flows through the circuit, which is typically a 3-electrode electrochemical cell. The resulting I-V data provides important electrochemical properties about the analyte under investigation.
Cyclic voltammetry measurements are typically performed using a potentiostat, an often-used electrochemical measurement instrument. A Keithley Model 2450 or Model 2460 SourceMeter SMU Instrument can be used as an alternative for performing cyclic voltammetry and other electrochemistry tests, including use as a general-purpose lab tool for basic sourcing and measurement functions. These SourceMeters are programmable and can source and measure both current and voltage. They also allow users to plot the I-V results and save data without an external computer controller.
This application note outlines using a Model 2450 or 2460 to perform cyclic voltammetry measurements with the Model 2450-ECHEM Electrochemical Test Suite option. This option is provided as a USB drive with a test script that can be downloaded and run directly on the SourceMeter to perform a CV test; it also has LabVIEW® code for performing cyclic voltammetry.
Performing Cyclic Voltammetry Measurements Using Model 2450 or 2460 SourceMeter® SMU Instruments
Working Electrode
Reference Electrode
Counter Electrode
Model 2450 SourceMeter Electrochemical Cell
Figure 1. Model 2450 SourceMeter SMU Instrument plotting a voltammogram
Application Note
www.tektronix.com/xxx2
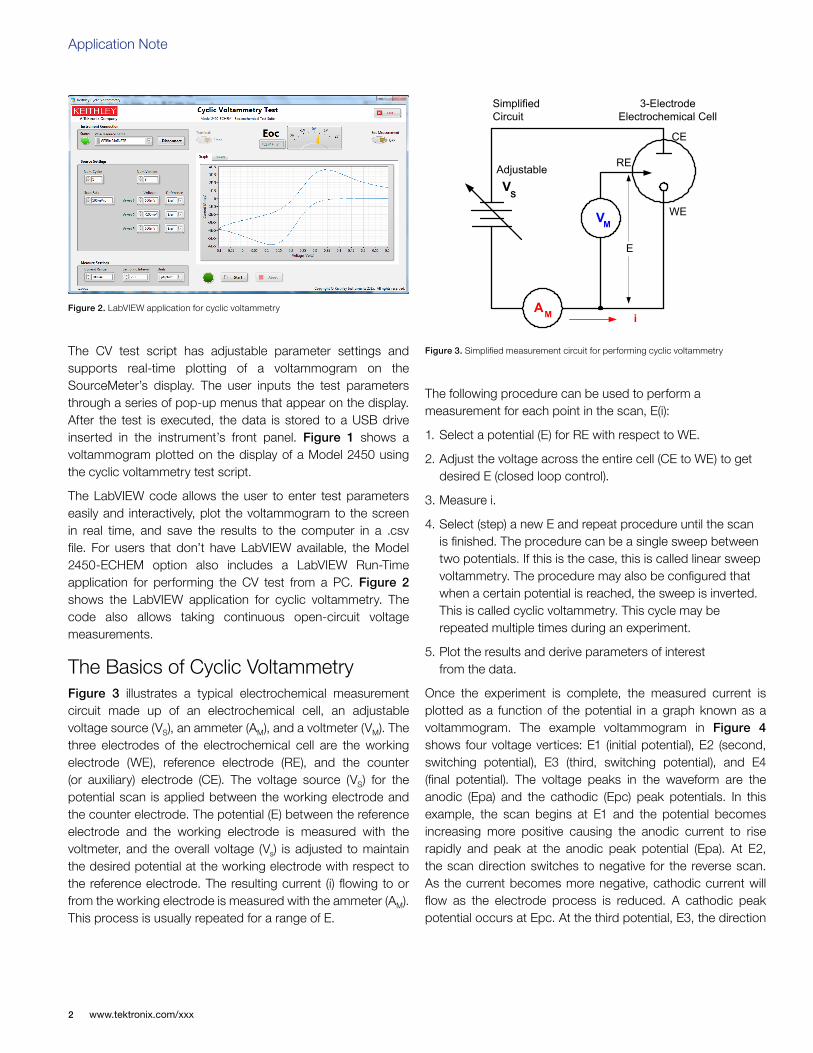
The CV test script has adjustable parameter settings and supports real-time plotting of a voltammogram on the SourceMeter’s display. The user inputs the test parameters through a series of pop-up menus that appear on the display. After the test is executed, the data is stored to a USB drive inserted in the instrument’s front panel. Figure 1 shows a voltammogram plotted on the display of a Model 2450 using the cyclic voltammetry test script.
The LabVIEW code allows the user to enter test parameters easily and interactively, plot the voltammogram to the screen in real time, and save the results to the computer in a .csv file. For users that don’t have LabVIEW available, the Model 2450-ECHEM option also includes a LabVIEW Run-Time application for performing the CV test from a PC. Figure 2 shows the LabVIEW application for cyclic voltammetry. The code also allows taking continuous open-circuit voltage measurements.
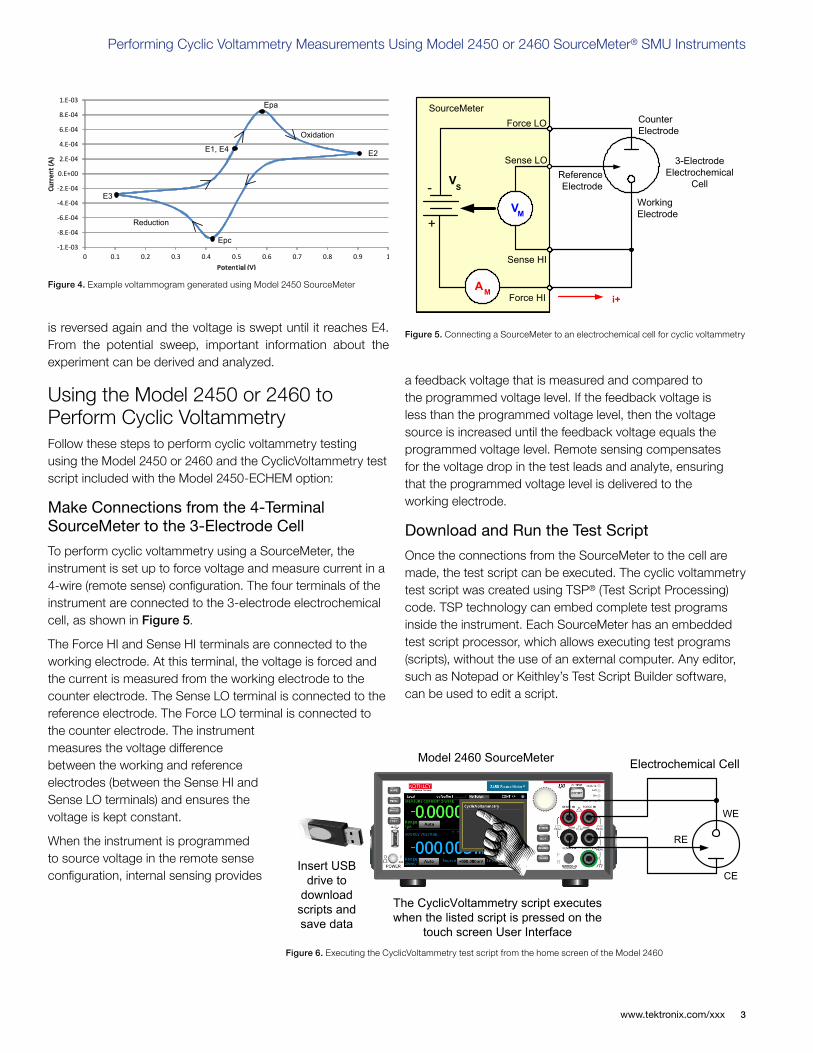
The Basics of Cyclic VoltammetryFigure 3 illustrates a typical electrochemical measurement circuit made up of an electrochemical cell, an adjustable voltage source (VS), an ammeter (AM), and a voltmeter (VM). The three electrodes of the electrochemical cell are the working electrode (WE), reference electrode (RE), and the counter (or auxiliary) electrode (CE). The voltage source (VS) for the potential scan is applied between the working electrode and the counter electrode. The potential (E) between the reference electrode and the working electrode is measured with the voltmeter, and the overall voltage (Vs) is adjusted to maintain the desired potential at the working electrode with respect to the reference electrode. The resulting current (i) flowing to or from the working electrode is measured with the ammeter (AM). This process is usually repeated for a range of E.
The following procedure can be used to perform a measurement for each point in the scan, E(i):
1. Select a potential (E) for RE with respect to WE.
2. Adjust the voltage across the entire cell (CE to WE) to get desired E (closed loop control).
3. Measure i.
4. Select (step) a new E and repeat procedure until the scan is finished. The procedure can be a single sweep between two potentials. If this is the case, this is called linear sweep voltammetry. The procedure may also be configured that when a certain potential is reached, the sweep is inverted. This is called cyclic voltammetry. This cycle may be repeated multiple times during an experiment.
5. Plot the results and derive parameters of interest from the data.
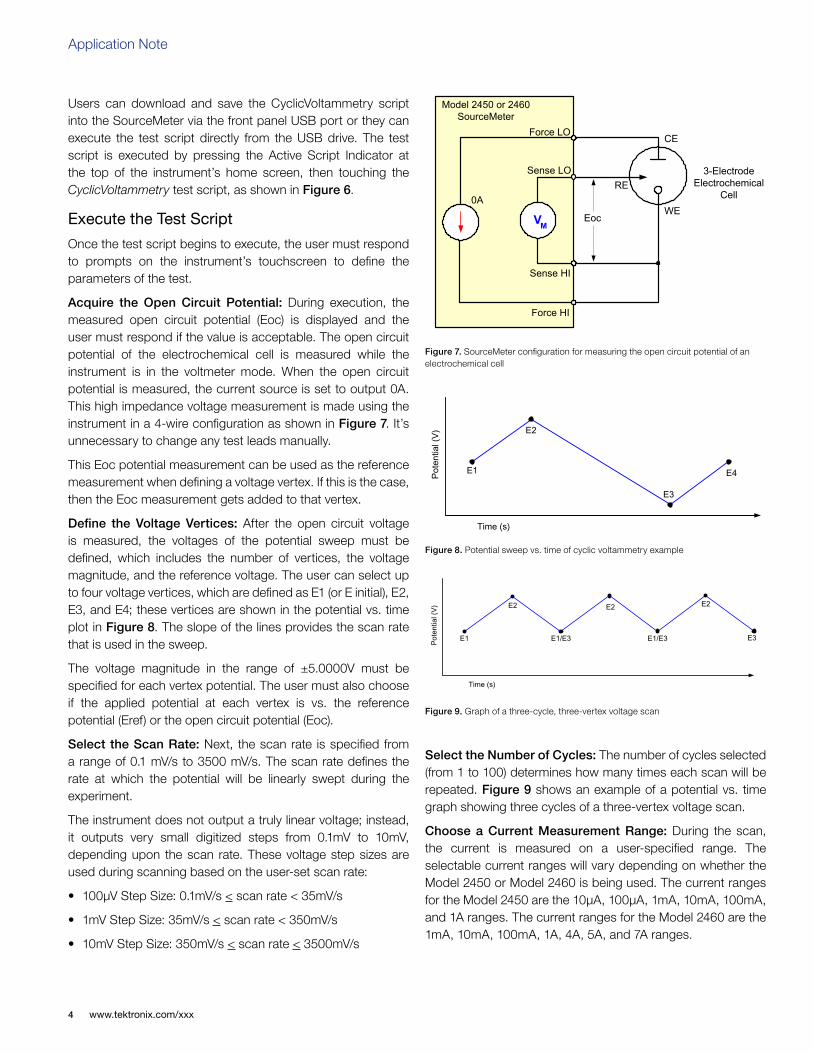
Once the experiment is complete, the measured current is plotted as a function of the potential in a graph known as a voltammogram. The example voltammogram in Figure 4 shows four voltage vertices: E1 (initial potential), E2 (second, switching potential), E3 (third, switching potential), and E4 (final potential). The voltage peaks in the waveform are the anodic (Epa) and the cathodic (Epc) peak potentials. In this example, the scan begins at E1 and the potential becomes increasing more positive causing the anodic current to rise rapidly and peak at the anodic peak potential (Epa). At E2, the scan direction switches to negative for the reverse scan. As the current becomes more negative, cathodic current will flow as the electrode process is reduced. A cathodic peak potential occurs at Epc. At the third potential, E3, the direction
Figure 2. LabVIEW application for cyclic voltammetry
RE
3-Electrode Electrochemical Cell
Adjustable
VM
AM
VS
SimplifiedCircuit
E
i
WE
CE
Figure 3. Simplified measurement circuit for performing cyclic voltammetry
www.tektronix.com/xxx 3
Performing Cyclic Voltammetry Measurements Using Model 2450 or 2460 SourceMeter® SMU Instruments
is reversed again and the voltage is swept until it reaches E4. From the potential sweep, important information about the experiment can be derived and analyzed.
Using the Model 2450 or 2460 to Perform Cyclic VoltammetryFollow these steps to perform cyclic voltammetry testing using the Model 2450 or 2460 and the CyclicVoltammetry test script included with the Model 2450-ECHEM option:
Make Connections from the 4-Terminal SourceMeter to the 3-Electrode Cell
To perform cyclic voltammetry using a SourceMeter, the instrument is set up to force voltage and measure current in a 4-wire (remote sense) configuration. The four terminals of the instrument are connected to the 3-electrode electrochemical cell, as shown in Figure 5.
The Force HI and Sense HI terminals are connected to the working electrode. At this terminal, the voltage is forced and the current is measured from the working electrode to the counter electrode. The Sense LO terminal is connected to the reference electrode. The Force LO terminal is connected to the counter electrode. The instrument measures the voltage difference between the working and reference electrodes (between the Sense HI and Sense LO terminals) and ensures the voltage is kept constant.
When the instrument is programmed to source voltage in the remote sense configuration, internal sensing provides
a feedback voltage that is measured and compared to the programmed voltage level. If the feedback voltage is less than the programmed voltage level, then the voltage source is increased until the feedback voltage equals the programmed voltage level. Remote sensing compensates for the voltage drop in the test leads and analyte, ensuring that the programmed voltage level is delivered to the working electrode.
Download and Run the Test Script
Once the connections from the SourceMeter to the cell are made, the test script can be executed. The cyclic voltammetry test script was created using TSP® (Test Script Processing) code. TSP technology can embed complete test programs inside the instrument. Each SourceMeter has an embedded test script processor, which allows executing test programs (scripts), without the use of an external computer. Any editor, such as Notepad or Keithley’s Test Script Builder software, can be used to edit a script.
-1.E-03
-8.E-04
-6.E-04
-4.E-04
-2.E-04
0.E+00
2.E-04
4.E-04
6.E-04
8.E-04
1.E-03
0 0.1 0.2 0.3 0.4 0.5 0.6 0.7 0.8 0.9 1
Curr
ent (
A)
Potential (V)
E1, E4 E2
E3
Epa
Epc
Oxidation
Reduction
Figure 4. Example voltammogram generated using Model 2450 SourceMeter
VM
AM
VS
Force HI
Sense HI
Sense LO
Force LO
SourceMeter Counter Electrode
Working Electrode
Reference Electrode
3-Electrode Electrochemical
Cell
+
-
i+
Figure 5. Connecting a SourceMeter to an electrochemical cell for cyclic voltammetry
WE
RE
CE
The CyclicVoltammetry script executes when the listed script is pressed on the
touch screen User Interface
Insert USB drive to
download scripts and save data
Model 2460 SourceMeter Electrochemical Cell
Figure 6. Executing the CyclicVoltammetry test script from the home screen of the Model 2460
Application Note
www.tektronix.com/xxx4
Users can download and save the CyclicVoltammetry script into the SourceMeter via the front panel USB port or they can execute the test script directly from the USB drive. The test script is executed by pressing the Active Script Indicator at the top of the instrument’s home screen, then touching the CyclicVoltammetry test script, as shown in Figure 6.
Execute the Test Script
Once the test script begins to execute, the user must respond to prompts on the instrument’s touchscreen to define the parameters of the test.
Acquire the Open Circuit Potential: During execution, the measured open circuit potential (Eoc) is displayed and the user must respond if the value is acceptable. The open circuit potential of the electrochemical cell is measured while the instrument is in the voltmeter mode. When the open circuit potential is measured, the current source is set to output 0A. This high impedance voltage measurement is made using the instrument in a 4-wire configuration as shown in Figure 7. It’s unnecessary to change any test leads manually.
This Eoc potential measurement can be used as the reference measurement when defining a voltage vertex. If this is the case, then the Eoc measurement gets added to that vertex.
Define the Voltage Vertices: After the open circuit voltage is measured, the voltages of the potential sweep must be defined, which includes the number of vertices, the voltage magnitude, and the reference voltage. The user can select up to four voltage vertices, which are defined as E1 (or E initial), E2, E3, and E4; these vertices are shown in the potential vs. time plot in Figure 8. The slope of the lines provides the scan rate that is used in the sweep.
The voltage magnitude in the range of ±5.0000V must be specified for each vertex potential. The user must also choose if the applied potential at each vertex is vs. the reference potential (Eref) or the open circuit potential (Eoc).
Select the Scan Rate: Next, the scan rate is specified from a range of 0.1 mV/s to 3500 mV/s. The scan rate defines the rate at which the potential will be linearly swept during the experiment.
The instrument does not output a truly linear voltage; instead, it outputs very small digitized steps from 0.1mV to 10mV, depending upon the scan rate. These voltage step sizes are used during scanning based on the user-set scan rate:
• 100µV Step Size: 0.1mV/s < scan rate < 35mV/s
• 1mV Step Size: 35mV/s < scan rate < 350mV/s
• 10mV Step Size: 350mV/s < scan rate < 3500mV/s
Select the Number of Cycles: The number of cycles selected (from 1 to 100) determines how many times each scan will be repeated. Figure 9 shows an example of a potential vs. time graph showing three cycles of a three-vertex voltage scan.
Choose a Current Measurement Range: During the scan, the current is measured on a user-specified range. The selectable current ranges will vary depending on whether the Model 2450 or Model 2460 is being used. The current ranges for the Model 2450 are the 10µA, 100µA, 1mA, 10mA, 100mA, and 1A ranges. The current ranges for the Model 2460 are the 1mA, 10mA, 100mA, 1A, 4A, 5A, and 7A ranges.
VM
Force HI
Sense HI
Sense LO
Force LO
Model 2450 or 2460 SourceMeter
CE
WE
RE
3-Electrode Electrochemical
Cell0A
Eoc
Figure 7. SourceMeter configuration for measuring the open circuit potential of an electrochemical cell
Pot
entia
l (V
)
E1
E2
E3
E4
Time (s)
Figure 8. Potential sweep vs. time of cyclic voltammetry example
Pot
entia
l (V
)
E1
E2
E1/E3
E2
Time (s)
E2
E3E1/E3
Figure 9. Graph of a three-cycle, three-vertex voltage scan
www.tektronix.com/xxx 5
Performing Cyclic Voltammetry Measurements Using Model 2450 or 2460 SourceMeter® SMU Instruments
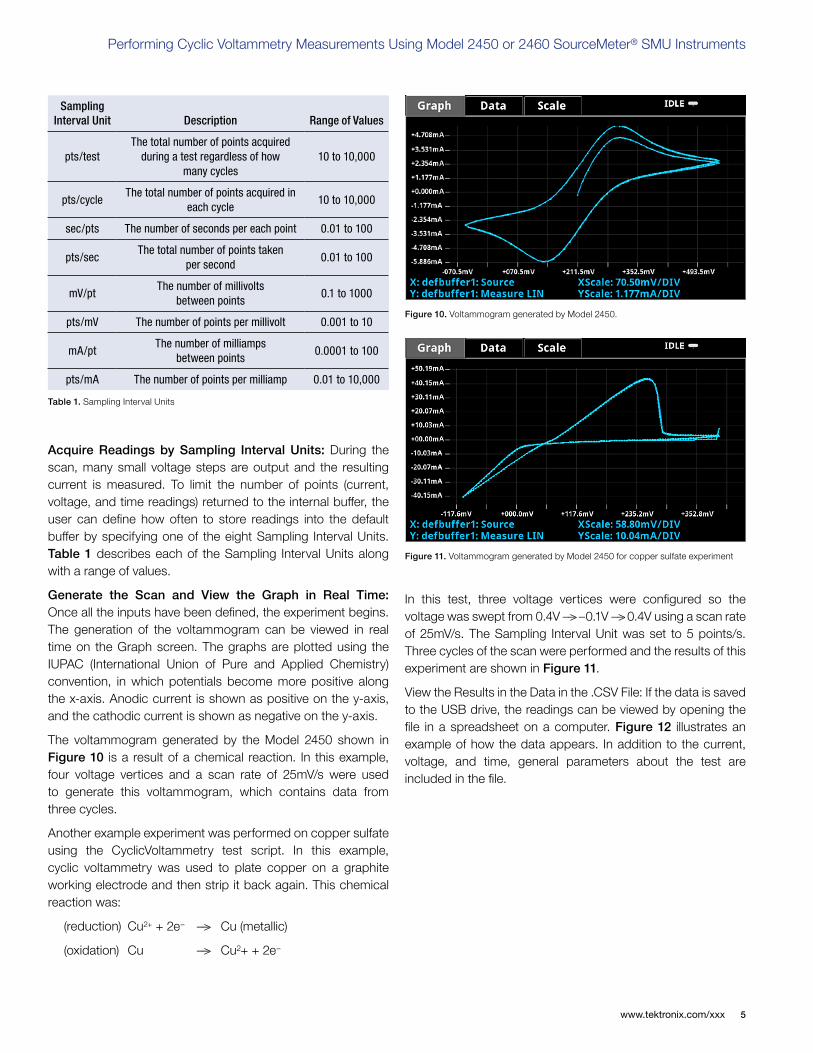
Acquire Readings by Sampling Interval Units: During the scan, many small voltage steps are output and the resulting current is measured. To limit the number of points (current, voltage, and time readings) returned to the internal buffer, the user can define how often to store readings into the default buffer by specifying one of the eight Sampling Interval Units. Table 1 describes each of the Sampling Interval Units along with a range of values.
Generate the Scan and View the Graph in Real Time: Once all the inputs have been defined, the experiment begins. The generation of the voltammogram can be viewed in real time on the Graph screen. The graphs are plotted using the IUPAC (International Union of Pure and Applied Chemistry) convention, in which potentials become more positive along the x-axis. Anodic current is shown as positive on the y-axis, and the cathodic current is shown as negative on the y-axis.
The voltammogram generated by the Model 2450 shown in Figure 10 is a result of a chemical reaction. In this example, four voltage vertices and a scan rate of 25mV/s were used to generate this voltammogram, which contains data from three cycles.
Another example experiment was performed on copper sulfate using the CyclicVoltammetry test script. In this example, cyclic voltammetry was used to plate copper on a graphite working electrode and then strip it back again. This chemical reaction was:
(reduction) Cu2+ + 2e– ––> Cu (metallic)
(oxidation) Cu ––> Cu2+ + 2e–
In this test, three voltage vertices were configured so the voltage was swept from 0.4V ––> –0.1V ––> 0.4V using a scan rate of 25mV/s. The Sampling Interval Unit was set to 5 points/s. Three cycles of the scan were performed and the results of this experiment are shown in Figure 11.
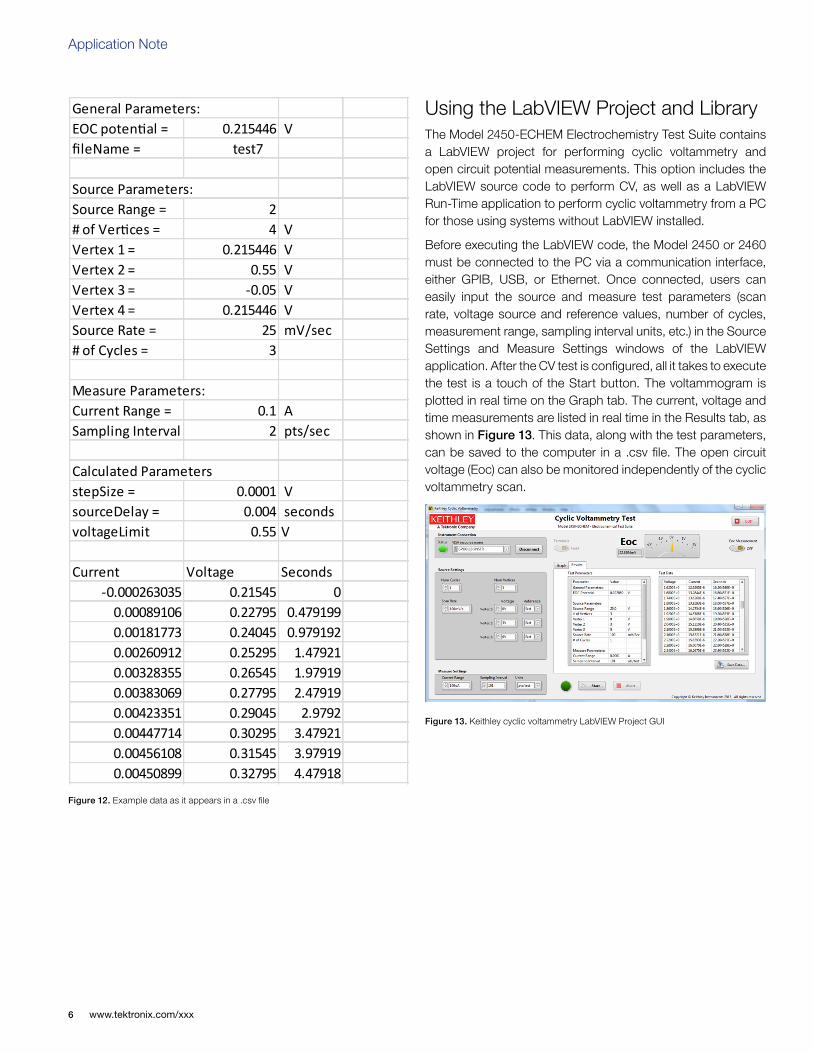
View the Results in the Data in the .CSV File: If the data is saved to the USB drive, the readings can be viewed by opening the file in a spreadsheet on a computer. Figure 12 illustrates an example of how the data appears. In addition to the current, voltage, and time, general parameters about the test are included in the file.
Sampling Interval Unit Description Range of Values
pts/testThe total number of points acquired
during a test regardless of how many cycles
10 to 10,000
pts/cycleThe total number of points acquired in
each cycle10 to 10,000
sec/pts The number of seconds per each point 0.01 to 100
pts/secThe total number of points taken
per second0.01 to 100
mV/ptThe number of millivolts
between points0.1 to 1000
pts/mV The number of points per millivolt 0.001 to 10
mA/ptThe number of milliamps
between points0.0001 to 100
pts/mA The number of points per milliamp 0.01 to 10,000
Table 1. Sampling Interval Units
Figure 10. Voltammogram generated by Model 2450.
Figure 11. Voltammogram generated by Model 2450 for copper sulfate experiment
Application Note
www.tektronix.com/xxx6
General Parameters:EOC poten al = 0.215446 VfileName =
Source Parameters:Source Range = 2# of Ver ces = 4 VVertex 1 = 0.215446 VVertex 2 = 0.55 VVertex 3 = -0.05 VVertex 4 = 0.215446 VSource Rate = 25 mV/sec# of Cycles = 3
Measure Parameters:Current Range = 0.1 ASampling Interval = 2 pts/sec
Calculated ParametersstepSize = 0.0001 VsourceDelay = 0.004 secondsvoltageLimit 0.55 V
Current Voltage Seconds-0.000263035 0.21545 0
0.00089106 0.22795 0.4791990.00181773 0.24045 0.9791920.00260912 0.25295 1.479210.00328355 0.26545 1.979190.00383069 0.27795 2.479190.00423351 0.29045 2.97920.00447714 0.30295 3.479210.00456108 0.31545 3.979190.00450899 0.32795 4.47918
Figure 12. Example data as it appears in a .csv file
Using the LabVIEW Project and LibraryThe Model 2450-ECHEM Electrochemistry Test Suite contains a LabVIEW project for performing cyclic voltammetry and open circuit potential measurements. This option includes the LabVIEW source code to perform CV, as well as a LabVIEW Run-Time application to perform cyclic voltammetry from a PC for those using systems without LabVIEW installed.
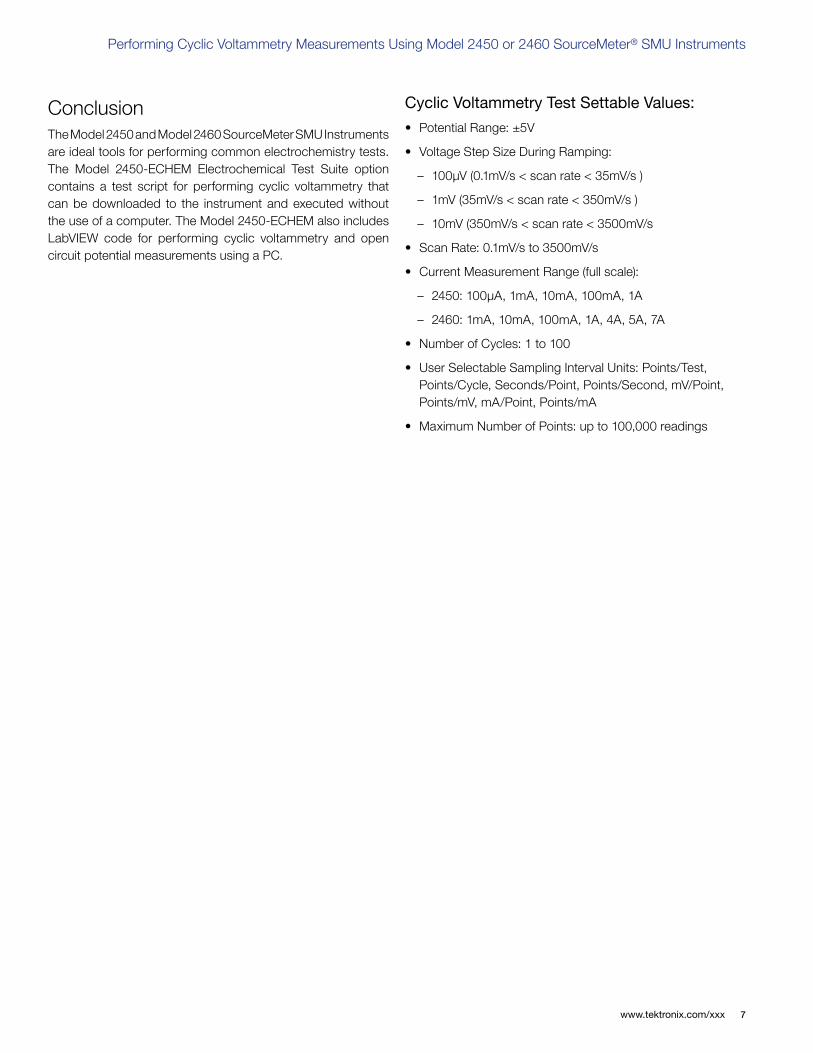
Before executing the LabVIEW code, the Model 2450 or 2460 must be connected to the PC via a communication interface, either GPIB, USB, or Ethernet. Once connected, users can easily input the source and measure test parameters (scan rate, voltage source and reference values, number of cycles, measurement range, sampling interval units, etc.) in the Source Settings and Measure Settings windows of the LabVIEW application. After the CV test is configured, all it takes to execute the test is a touch of the Start button. The voltammogram is plotted in real time on the Graph tab. The current, voltage and time measurements are listed in real time in the Results tab, as shown in Figure 13. This data, along with the test parameters, can be saved to the computer in a .csv file. The open circuit voltage (Eoc) can also be monitored independently of the cyclic voltammetry scan.
Figure 13. Keithley cyclic voltammetry LabVIEW Project GUI
www.tektronix.com/xxx 7
Performing Cyclic Voltammetry Measurements Using Model 2450 or 2460 SourceMeter® SMU Instruments
ConclusionThe Model 2450 and Model 2460 SourceMeter SMU Instruments are ideal tools for performing common electrochemistry tests. The Model 2450-ECHEM Electrochemical Test Suite option contains a test script for performing cyclic voltammetry that can be downloaded to the instrument and executed without the use of a computer. The Model 2450-ECHEM also includes LabVIEW code for performing cyclic voltammetry and open circuit potential measurements using a PC.
Cyclic Voltammetry Test Settable Values:
• Potential Range: ±5V
• Voltage Step Size During Ramping:
– 100µV (0.1mV/s < scan rate < 35mV/s )
– 1mV (35mV/s < scan rate < 350mV/s )
– 10mV (350mV/s < scan rate < 3500mV/s
• Scan Rate: 0.1mV/s to 3500mV/s
• Current Measurement Range (full scale):
– 2450: 100µA, 1mA, 10mA, 100mA, 1A
– 2460: 1mA, 10mA, 100mA, 1A, 4A, 5A, 7A
• Number of Cycles: 1 to 100
• User Selectable Sampling Interval Units: Points/Test, Points/Cycle, Seconds/Point, Points/Second, mV/Point, Points/mV, mA/Point, Points/mA
• Maximum Number of Points: up to 100,000 readings
Contact Tektronix:ASEAN / Australasia (65) 6356 3900
Austria +41 52 675 3777Balkans, Israel, South Africa and other ISE Countries +41 52 675 3777
Belgium 07 81 60166Brazil +55 (11) 3759-7627Canada 1 (800) 661-5625
Central East Europe, Ukraine and the Baltics +41 52 675 3777Central Europe & Greece +41 52 675 3777
Denmark +45 80 88 1401Finland +41 52 675 3777
France +33 (0) 1 69 86 81 81Germany +49 (221) 94 77 400
Hong Kong (852) 2585-6688India (91) 80-42922600
Italy +39 (02) 25086 1Japan 81 (3) 6714-3010
Luxembourg +44 (0) 1344 392400Mexico, Central/South America & Caribbean 52 (55) 54247900
Middle East, Asia and North Africa +41 52 675 3777The Netherlands 090 02 021797
Norway 800 16098People’s Republic of China 86 (10) 6235 1230
Poland +41 52 675 3777Portugal 80 08 12370
Republic of Korea 82 (2) 6917-5000Russia & CIS +7 (495) 7484900South Africa +27 11 206 8360
Spain (+34) 901 988 054Sweden 020 08 80371
Switzerland +41 52 675 3777Taiwan 886 (2) 2722-9622
United Kingdom & Ireland +44 (0) 1344 392400USA 1 (800) 426-2200
For other areas contact Tektronix, Inc. at: 1 (503) 627-7111Contact information updated 4 August 2009
For Further InformationTektronix maintains a comprehensive, constantly expanding collection of application notes, technical briefs and other resources to help engineers working on the cutting edge of technology. Please visit www.tektronix.com
Copyright © 2015, Tektronix. All rights reserved. Tektronix products are covered by U.S. and foreign patents, issued and pending. Information in this publication supersedes that in all previously published material. Specification and price change privileges reserved. TEKTRONIX and TEK are registered trademarks of Tektronix, Inc. All other trade names referenced are the service marks, trademarks or registered trademarks of their respective companies. 04/15 1KW-60116-0