Performance Review: FY2011 - ICICI Bank...ICICI Bank UK 23.25 ICICI AMC 0.61 ICICI Bank Canada 33.50...
30
Performance Review: FY2011 April 28, 2011
Transcript of Performance Review: FY2011 - ICICI Bank...ICICI Bank UK 23.25 ICICI AMC 0.61 ICICI Bank Canada 33.50...
Performance Review:FY2011
April 28, 2011
2
Certain statements in these slides are forward-looking statements. These statements are based on management's current expectations and are subject to uncertainty and changes in circumstances. Actual results may differ materially from those included in these statements due to a variety of factors. More information about these factors is contained in ICICI Bank's filings with the US Securities and Exchange Commission.
All financial and other information in these slides, other than financial and other information for specific subsidiaries where specifically mentioned, is on an unconsolidated basis for ICICI Bank Limited only unless specifically stated to be on a consolidated basis for ICICI Bank Limited and its subsidiaries. Please also refer to the statement of unconsolidated, consolidated and segmental results required by Indian regulations that has, along with these slides, been filed with the stock exchanges in India where ICICI Bank’s equity shares are listed and with the New York Stock Exchange and the US Securities and Exchange Commission, and is available on our website www.icicibank.com
3
Overview
4
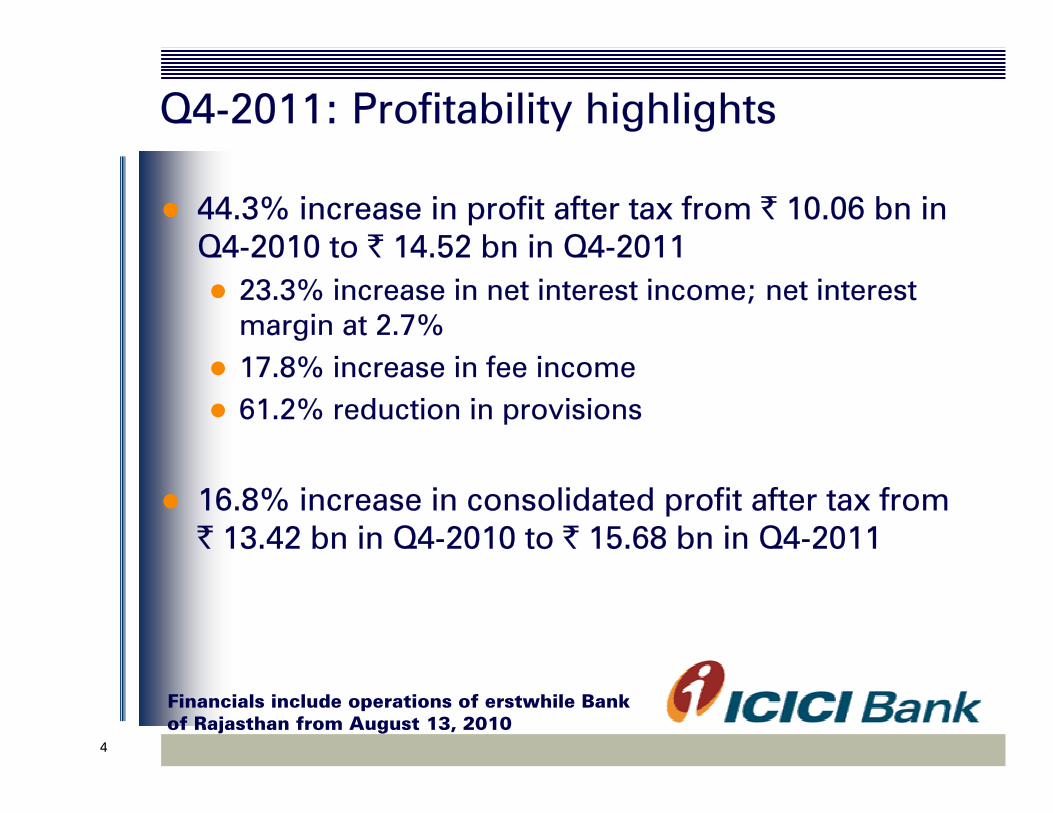
Q4-2011: Profitability highlights
44.3% increase in profit after tax from ` 10.06 bn in Q4-2010 to ` 14.52 bn in Q4-2011
23.3% increase in net interest income; net interest margin at 2.7%17.8% increase in fee income61.2% reduction in provisions
16.8% increase in consolidated profit after tax from ` 13.42 bn in Q4-2010 to ` 15.68 bn in Q4-2011
Financials include operations of erstwhile Bank of Rajasthan from August 13, 2010
5
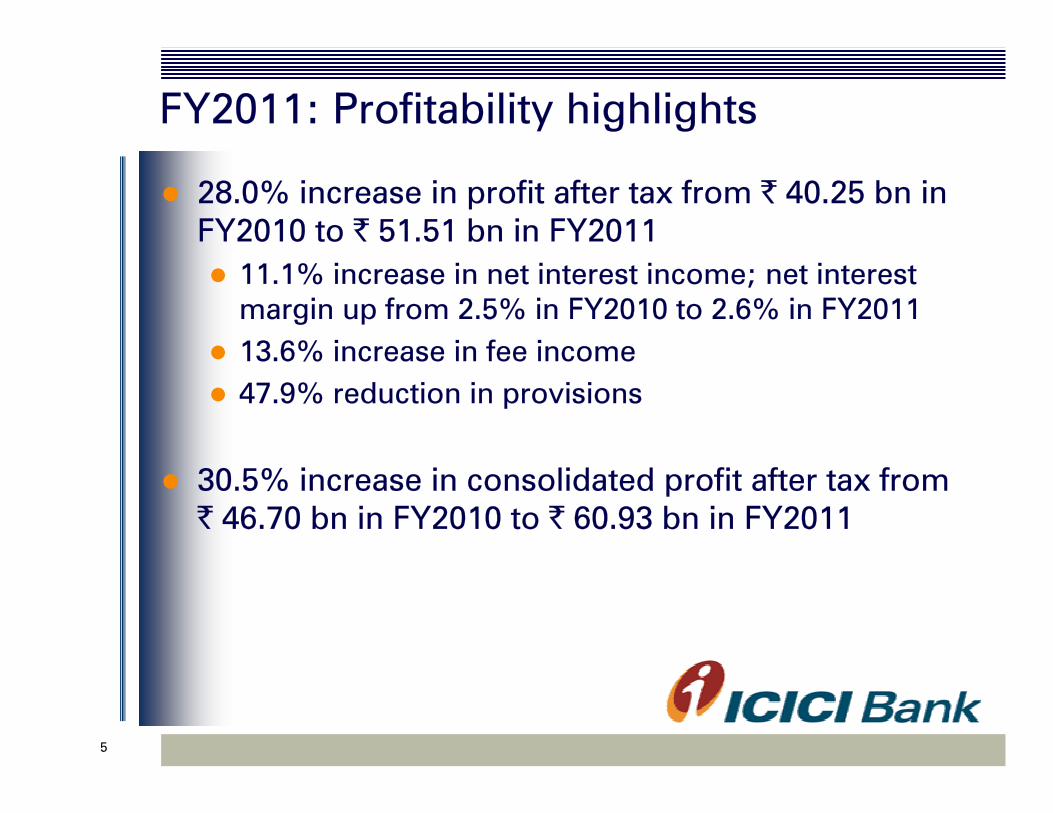
FY2011: Profitability highlights
28.0% increase in profit after tax from ` 40.25 bn in FY2010 to ` 51.51 bn in FY2011
11.1% increase in net interest income; net interest margin up from 2.5% in FY2010 to 2.6% in FY201113.6% increase in fee income47.9% reduction in provisions
30.5% increase in consolidated profit after tax from ` 46.70 bn in FY2010 to ` 60.93 bn in FY2011
6
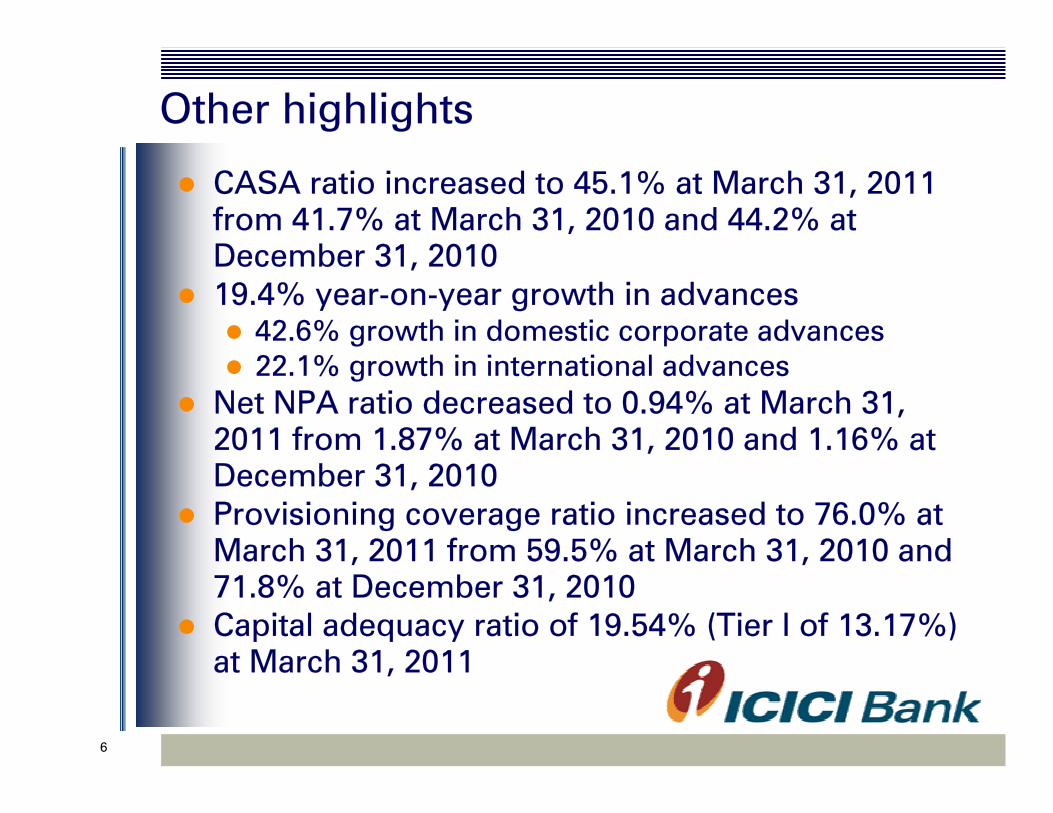
Other highlights
CASA ratio increased to 45.1% at March 31, 2011 from 41.7% at March 31, 2010 and 44.2% at December 31, 201019.4% year-on-year growth in advances
42.6% growth in domestic corporate advances22.1% growth in international advances
Net NPA ratio decreased to 0.94% at March 31, 2011 from 1.87% at March 31, 2010 and 1.16% at December 31, 2010Provisioning coverage ratio increased to 76.0% at March 31, 2011 from 59.5% at March 31, 2010 and 71.8% at December 31, 2010Capital adequacy ratio of 19.54% (Tier I of 13.17%) at March 31, 2011
7
Unconsolidated financials
8
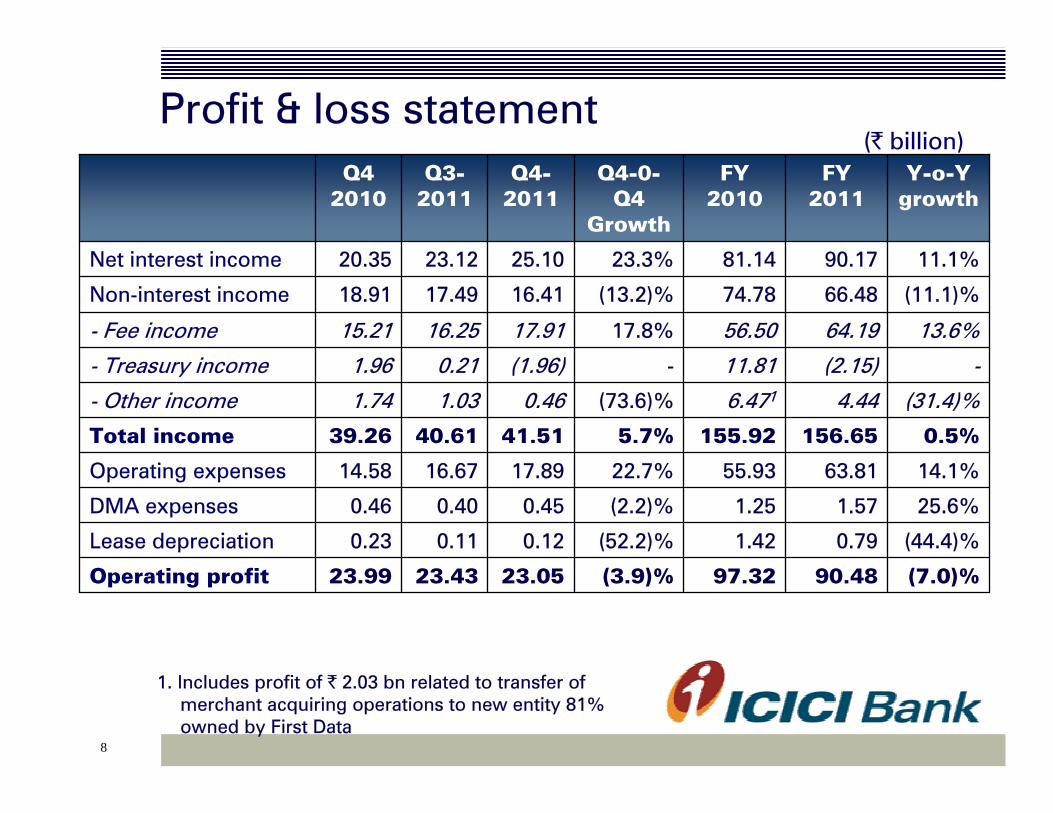
Profit & loss statement
-(2.15)11.81-(1.96)0.211.96- Treasury income
(7.0)%90.4897.32(3.9)%23.0523.4323.99Operating profit
(44.4)%0.791.42(52.2)%0.120.110.23Lease depreciation
1.57
63.81
156.65
4.44
64.19
66.48
90.17
FY 2011
0.40
16.67
40.61
1.03
16.25
17.49
23.12
Q3-2011
0.45
17.89
41.51
0.46
17.91
16.41
25.10
Q4-2011
1.25
55.93
155.92
6.471
56.50
74.78
81.14
FY 2010
0.46
14.58
39.26
1.74
15.21
18.91
20.35
Q4 2010
(2.2)%
22.7%
5.7%
(73.6)%
17.8%
(13.2)%
23.3%
Q4-0-Q4
Growth
0.5%Total income
25.6%
14.1%
(31.4)%
13.6%
(11.1)%
11.1%
Y-o-Y growth
DMA expenses
Operating expenses
- Other income
- Fee income
Non-interest income
Net interest income
(` billion)
1. Includes profit of ` 2.03 bn related to transfer of merchant acquiring operations to new entity 81% owned by First Data
9
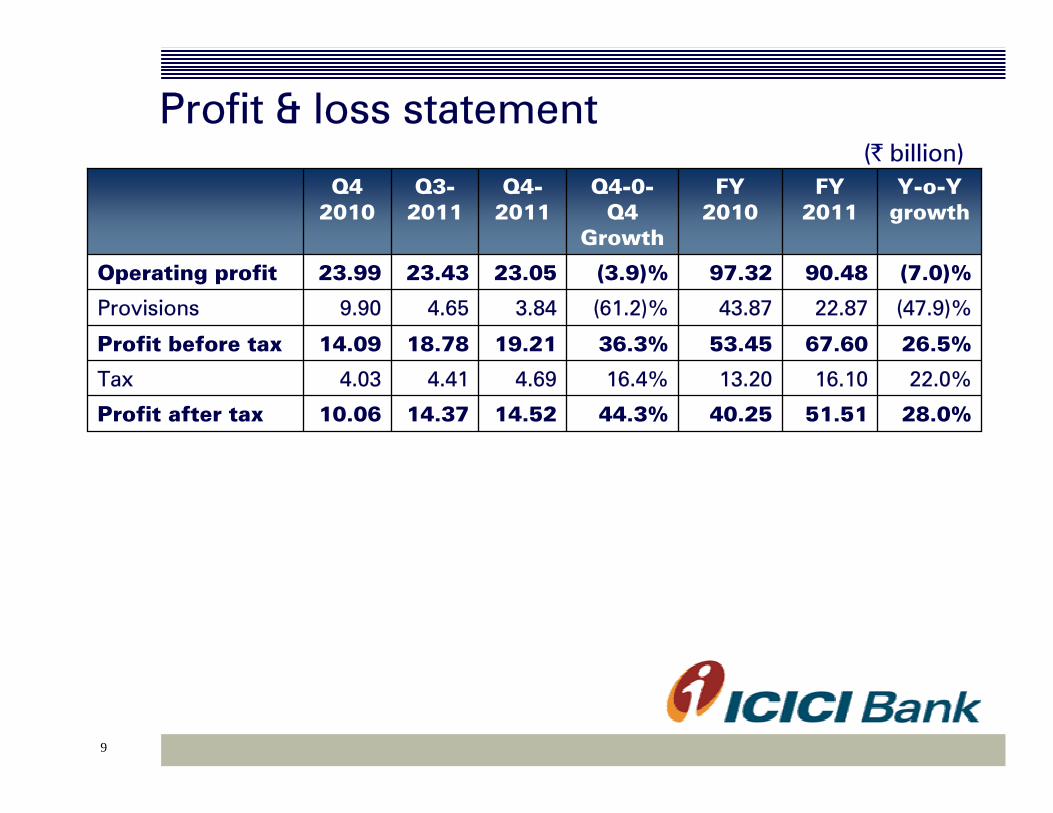
28.0%51.5140.2544.3%14.5214.3710.06Profit after tax
16.10
67.60
22.87
90.48
FY 2011
4.41
18.78
4.65
23.43
Q3-2011
4.69
19.21
3.84
23.05
Q4-2011
13.20
53.45
43.87
97.32
FY 2010
4.03
14.09
9.90
23.99
Q4 2010
16.4%
36.3%
(61.2)%
(3.9)%
Q4-0-Q4
Growth
22.0%
26.5%
(47.9)%
(7.0)%
Y-o-Y growth
Tax
Profit before tax
Provisions
Operating profit
(` billion)
Profit & loss statement

10
Balance sheet: Assets
49.2%150.80143.92101.10- RIDF1 and related
(6.2)%641.42667.11684.04- SLR investments
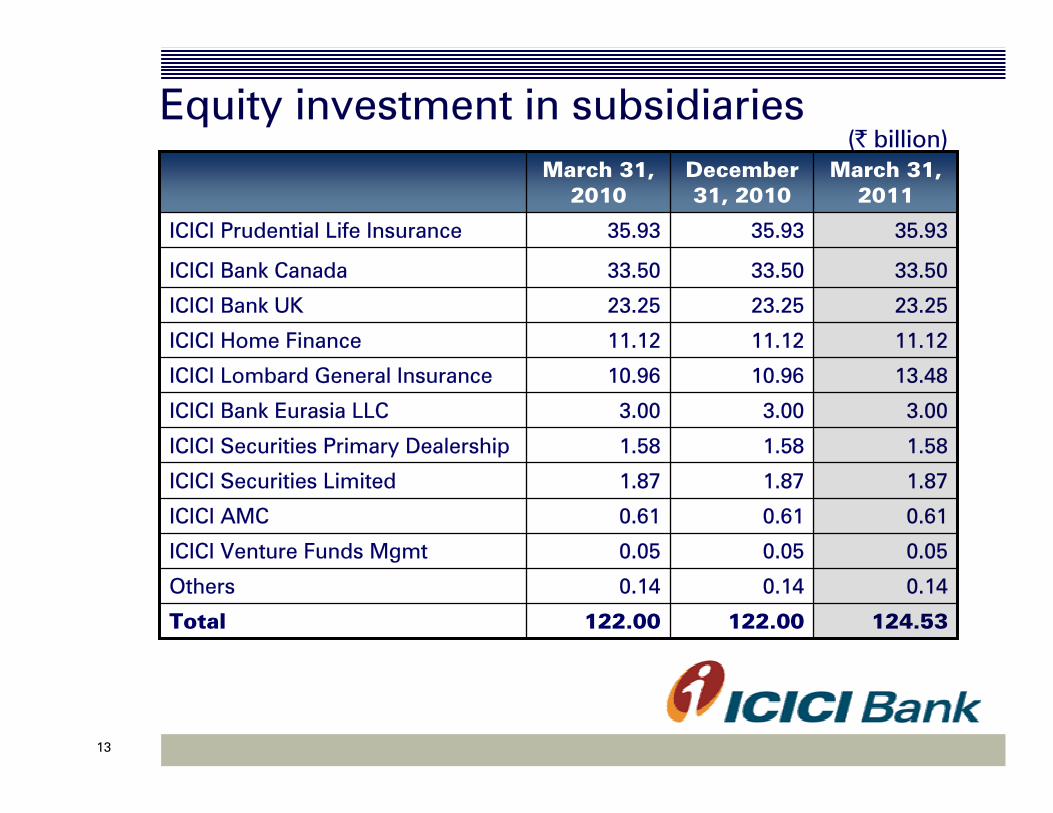
2.1%124.53122.00122.00- Equity investment insubsidiaries
3,634.00
224.27
1,812.06
1,208.93
388.74
March 31, 2010
11.4%1,346.861,337.03Investments
3,928.97
210.41
2,066.92
314.61
December 31, 2010
4,062.34
210.92
2,163.66
340.90
March 31, 2011
11.8%
(6.0)%
19.4%
(12.3)%
Y-o-Y growth
Total assets
Fixed & other assets
Advances
Cash & bank balances
(` billion)
Investment in security receipts of asset reconstruction companies was ` 28.31 bn at March 31, 2011Credit derivative exposure (including off balance sheet exposure) of ` 38.77 bn at March 31, 2011 (underlying comprises Indian corporate credits)
Including impact of exchange rate movement1: Rural Infrastructure Development Fund
11
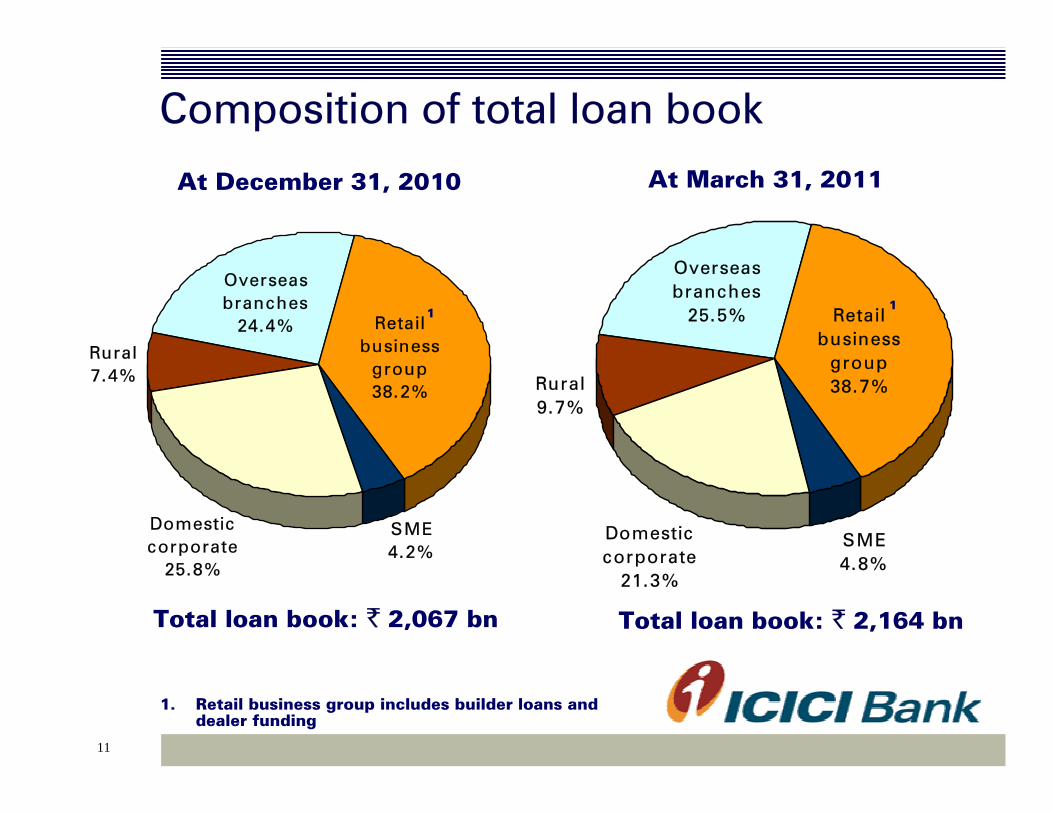
SME4.2%
Rural7.4%
Retail business
group38.2%
Overseas branches
24.4%
Domestic corporate
25.8%
Composition of total loan book
Total loan book: ` 2,067 bn
1. Retail business group includes builder loans and dealer funding
At December 31, 2010
1
SME4.8%
Rural9.7%
Retail business
group38.7%
Overseas branches
25.5%
Domestic corporate
21.3%
At March 31, 2011
Total loan book: ` 2,164 bn
1
12
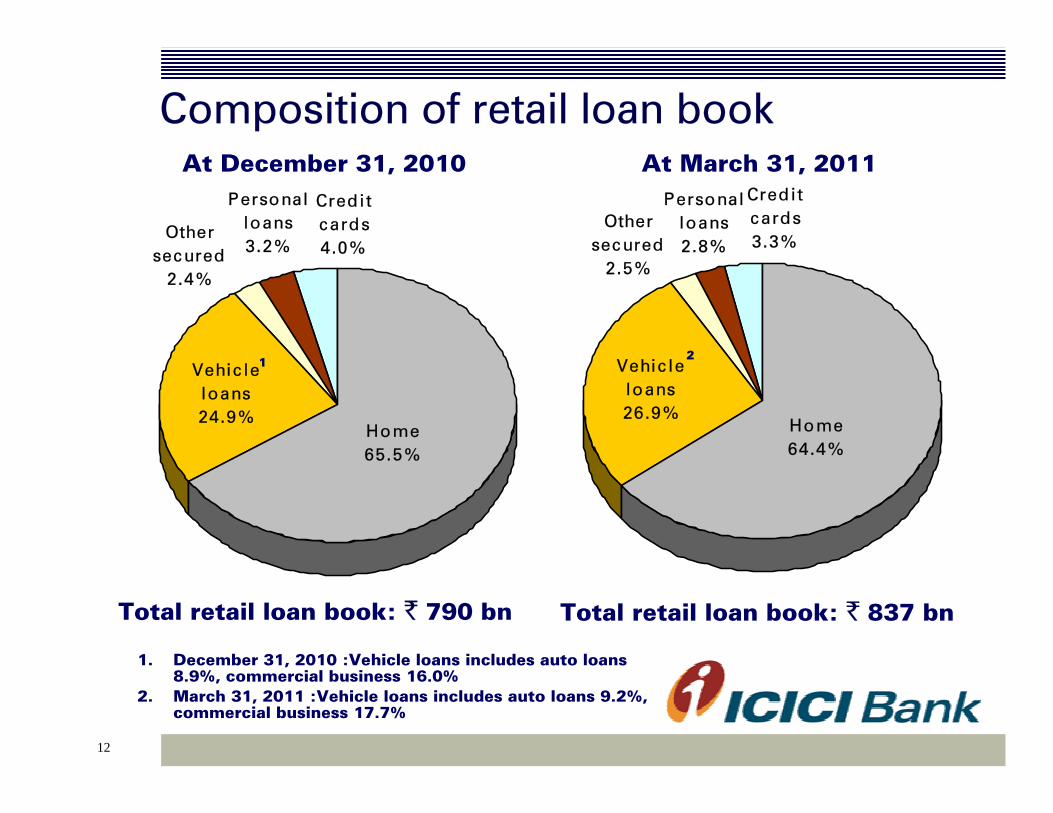
Vehic le loans24.9%
Home65.5%
Personal loans3.2%
Other secured
2.4%
Cred i t cards4.0%
Composition of retail loan book
Total retail loan book: ` 790 bn
1. December 31, 2010 :Vehicle loans includes auto loans 8.9%, commercial business 16.0%
2. March 31, 2011 :Vehicle loans includes auto loans 9.2%, commercial business 17.7%
At December 31, 2010
1 Vehic le loans26.9%
Home64.4%
Personal loans2.8%
Other secured
2.5%
Cred i t cards3.3%
At March 31, 2011
Total retail loan book: ` 837 bn
2
13
Equity investment in subsidiaries
122.00
0.14
0.05
0.61
1.87
1.58
3.00
10.96
11.12
23.25
33.50
35.93
December 31, 2010
122.00
0.14
0.05
0.61
1.87
1.58
3.00
10.96
11.12
23.25
33.50
35.93
March 31, 2010
11.12ICICI Home Finance
23.25ICICI Bank UK
0.61ICICI AMC
33.50ICICI Bank Canada
3.00ICICI Bank Eurasia LLC
13.48ICICI Lombard General Insurance
1.58ICICI Securities Primary Dealership
0.14Others
124.53
0.05
1.87
35.93
March 31, 2011
Total
ICICI Venture Funds Mgmt
ICICI Securities Limited
ICICI Prudential Life Insurance
(` billion)
14
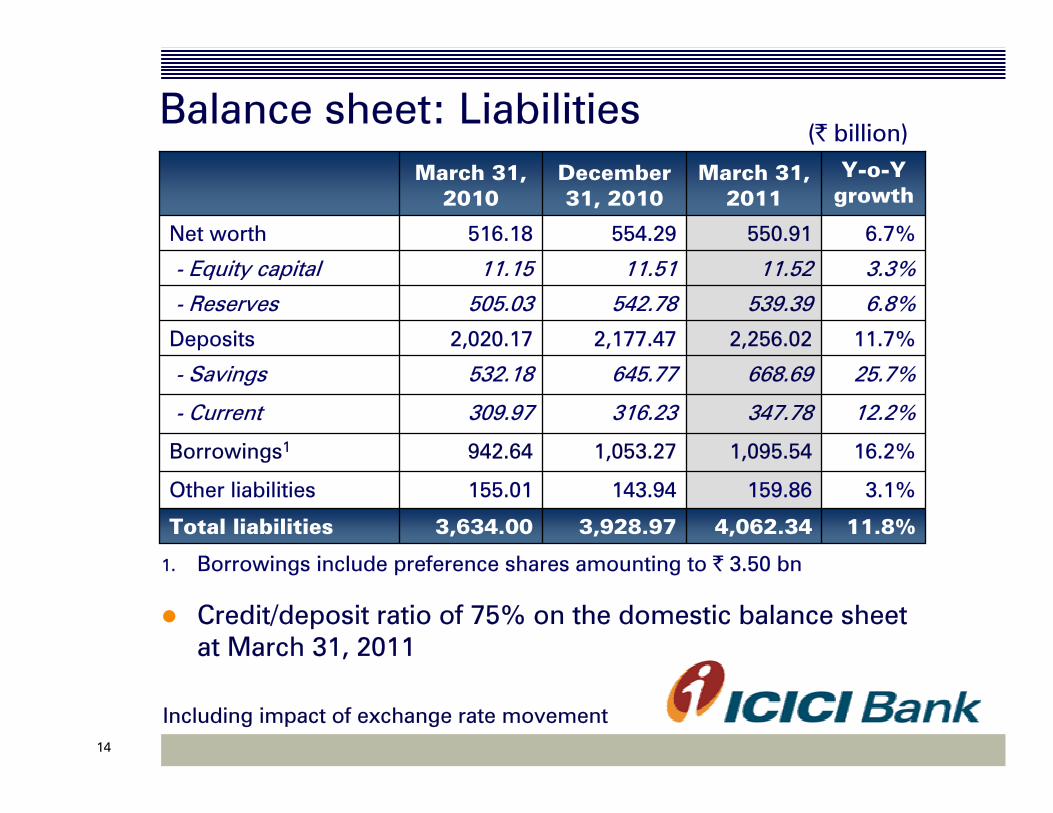
Balance sheet: Liabilities
25.7%668.69645.77532.18- Savings
12.2%347.78316.23309.97- Current
3,634.00
155.01
942.64
2,020.17
505.03
11.15
516.18
March 31, 2010
3,928.97
143.94
1,053.27
2,177.47
542.78
11.51
554.29
December 31, 2010
4,062.34
159.86
1,095.54
2,256.02
539.39
11.52
550.91
March 31, 2011
11.8%
3.1%
16.2%
11.7%
6.8%
3.3%
6.7%
Y-o-Y growth
Borrowings1
Total liabilities
Other liabilities
Deposits
- Reserves
- Equity capital
Net worth
(` billion)
Credit/deposit ratio of 75% on the domestic balance sheet at March 31, 2011
Including impact of exchange rate movement
1. Borrowings include preference shares amounting to ` 3.50 bn
15
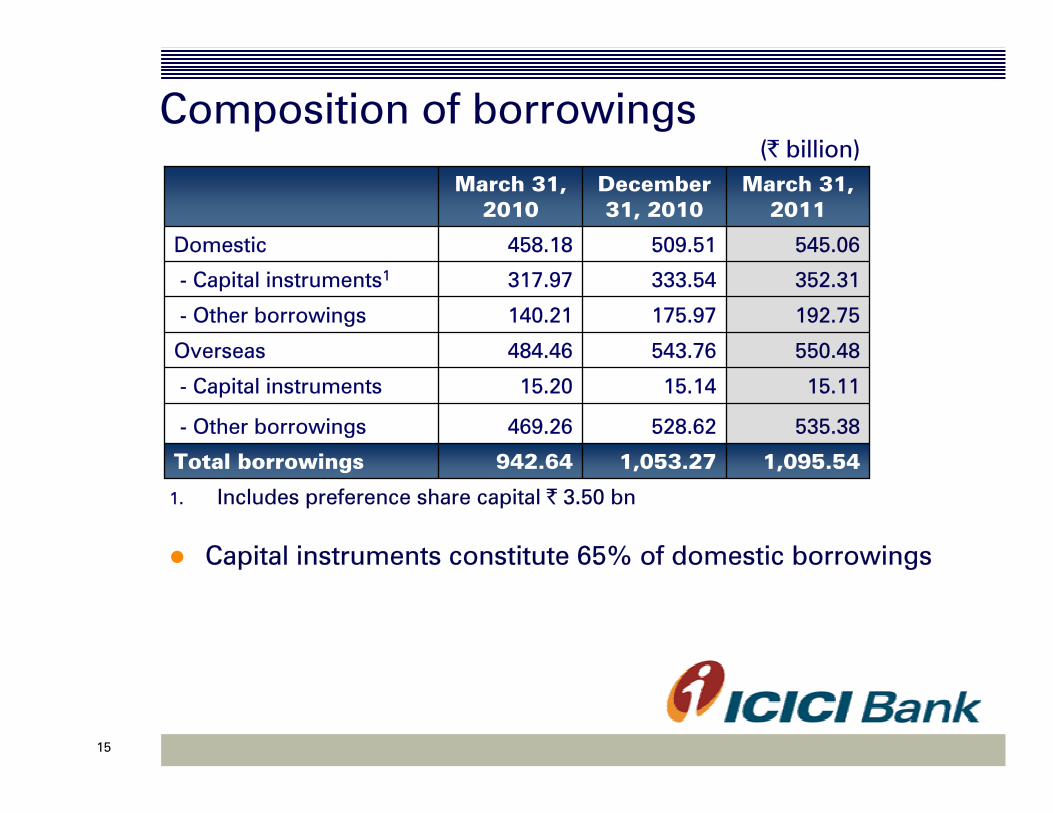
Composition of borrowings
942.64
469.26
15.20
484.46
140.21
317.97
458.18
March 31, 2010
550.48543.76Overseas
192.75175.97- Other borrowings
352.31333.54- Capital instruments1
1,095.54
535.38
15.11
545.06
March 31, 2011
1,053.27
528.62
15.14
509.51
December 31, 2010
Total borrowings
- Other borrowings
- Capital instruments
Domestic
Capital instruments constitute 65% of domestic borrowings
1. Includes preference share capital ` 3.50 bn
(` billion)
16
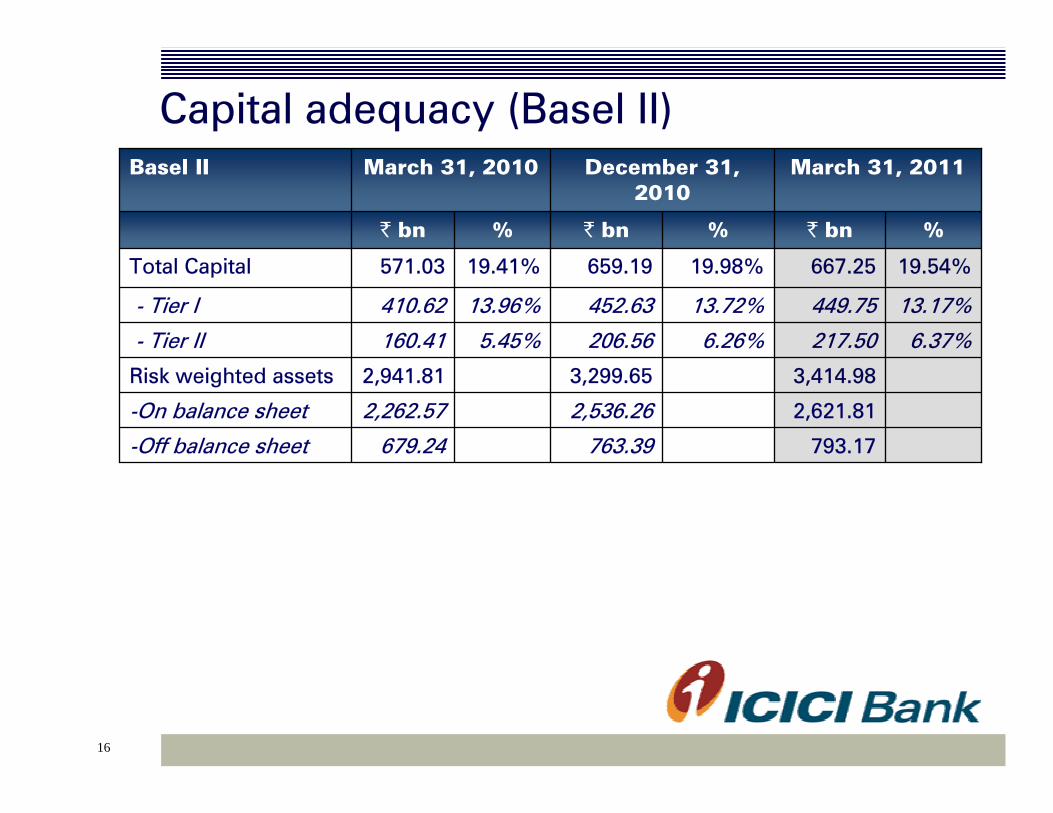
Capital adequacy (Basel II)
793.17763.39679.24-Off balance sheet
2,621.812,536.262,262.57-On balance sheet
3,299.65
206.56
452.63
659.19
` bn
December 31, 2010
6.26%
13.72%
19.98%
%
6.37%
13.17%
19.54%
%
3,414.98
217.50
449.75
667.25
` bn
March 31, 2011
2,941.81
160.41
410.62
571.03
` bn
March 31, 2010
5.45%
13.96%
19.41%
%
Risk weighted assets
- Tier II
- Tier I
Total Capital
Basel II
17
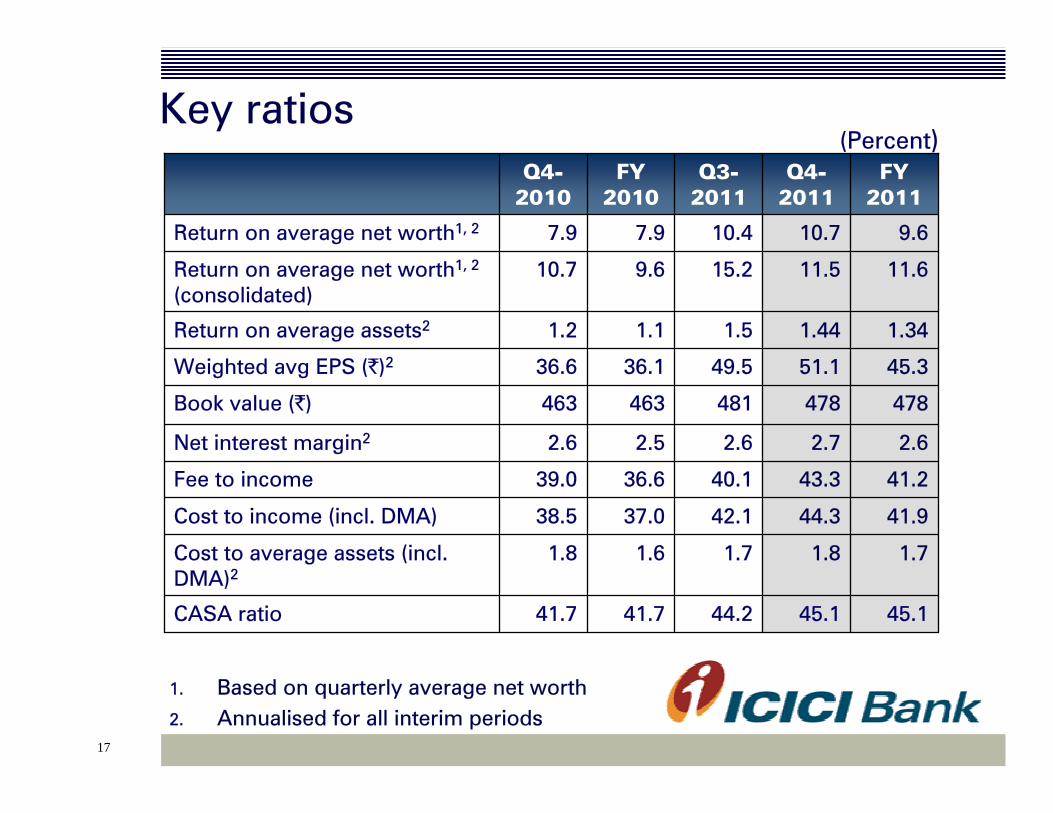
Key ratios
11.611.515.29.610.7Return on average net worth1, 2
(consolidated)
41.7
1.6
37.0
36.6
2.5
463
36.1
1.1
7.9
FY 2010
1.71.81.71.8Cost to average assets (incl. DMA)2
44.2
42.1
40.1
2.6
481
49.5
1.5
10.4
Q3-2011
1.341.441.2Return on average assets2
45.145.141.7CASA ratio
38.5
39.0
2.6
463
36.6
7.9
Q4-2010
44.3
43.3
2.7
478
51.1
10.7
Q4-2011
41.9
41.2
2.6
478
45.3
9.6
FY 2011
Fee to income
Book value (`)
Cost to income (incl. DMA)
Net interest margin2
Weighted avg EPS (`)2
Return on average net worth1, 2
(Percent)
1. Based on quarterly average net worth2. Annualised for all interim periods
18
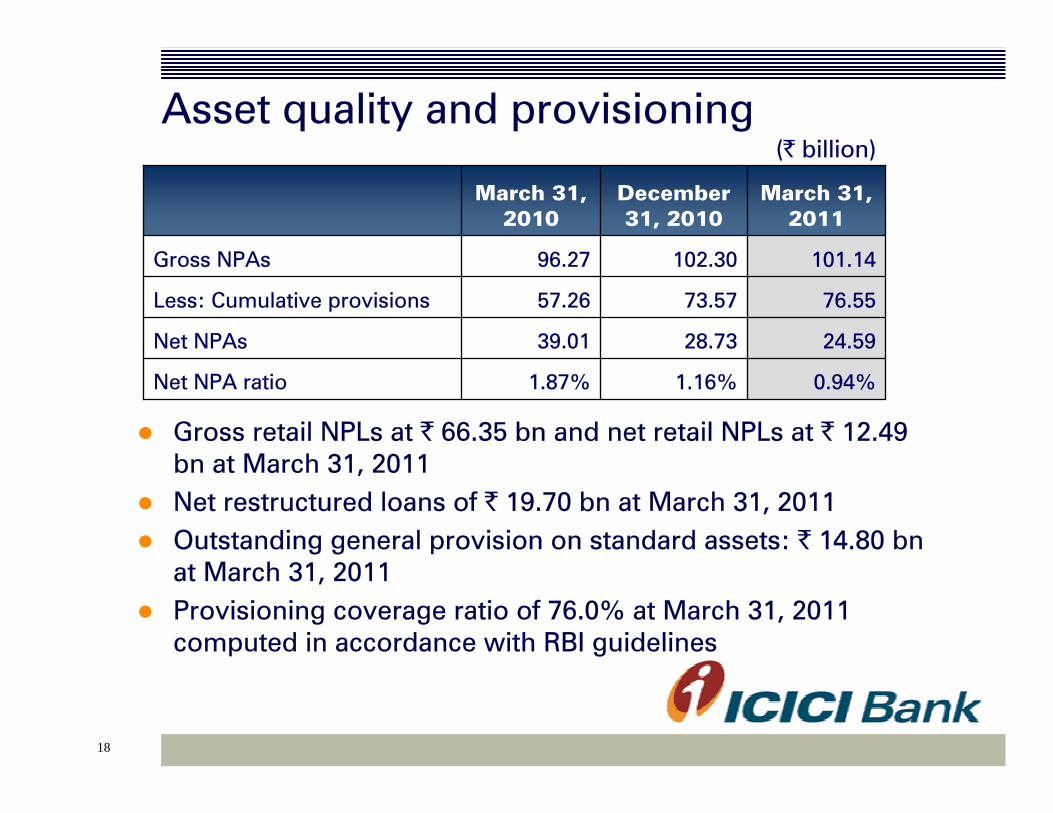
Asset quality and provisioning
Gross retail NPLs at ` 66.35 bn and net retail NPLs at ` 12.49 bn at March 31, 2011Net restructured loans of ` 19.70 bn at March 31, 2011Outstanding general provision on standard assets: ` 14.80 bn at March 31, 2011Provisioning coverage ratio of 76.0% at March 31, 2011 computed in accordance with RBI guidelines
(` billion)
1.16%
28.73
73.57
102.30
December 31, 2010
1.87%
39.01
57.26
96.27
March 31, 2010
0.94%
24.59
76.55
101.14
March 31, 2011
Net NPA ratio
Net NPAs
Less: Cumulative provisions
Gross NPAs
19
Overseas subsidiaries
20
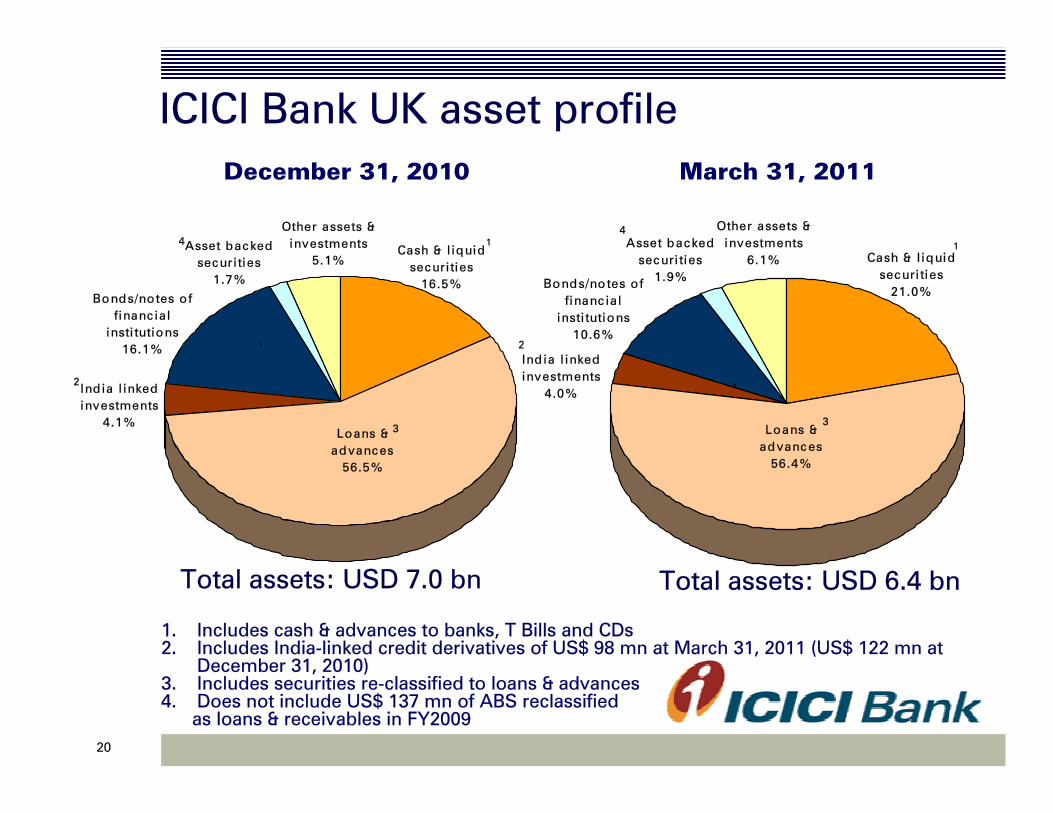
Loans & advances
56.4%
Asset backed securi ties
1.9%
Other assets & investments
6.1%
Ind ia l inked investments
4.0%
Cash & l iquid securi ties
21.0%Bonds/notes o f
financ ial insti tutions
10.6%
`
Loans & advances
56.5%
Asset backed securi ties
1.7%
Other assets & investments
5.1%
Ind ia l inked investments
4.1%
Cash & l iquid securi ties
16.5%Bonds/notes o f
financial insti tutions
16.1% `
ICICI Bank UK asset profile
1. Includes cash & advances to banks, T Bills and CDs2. Includes India-linked credit derivatives of US$ 98 mn at March 31, 2011 (US$ 122 mn at
December 31, 2010)3. Includes securities re-classified to loans & advances4. Does not include US$ 137 mn of ABS reclassified
as loans & receivables in FY2009
Total assets: USD 6.4 bn
1
2
3
4
December 31, 2010 March 31, 2011
Total assets: USD 7.0 bn
1
4
2
3
21
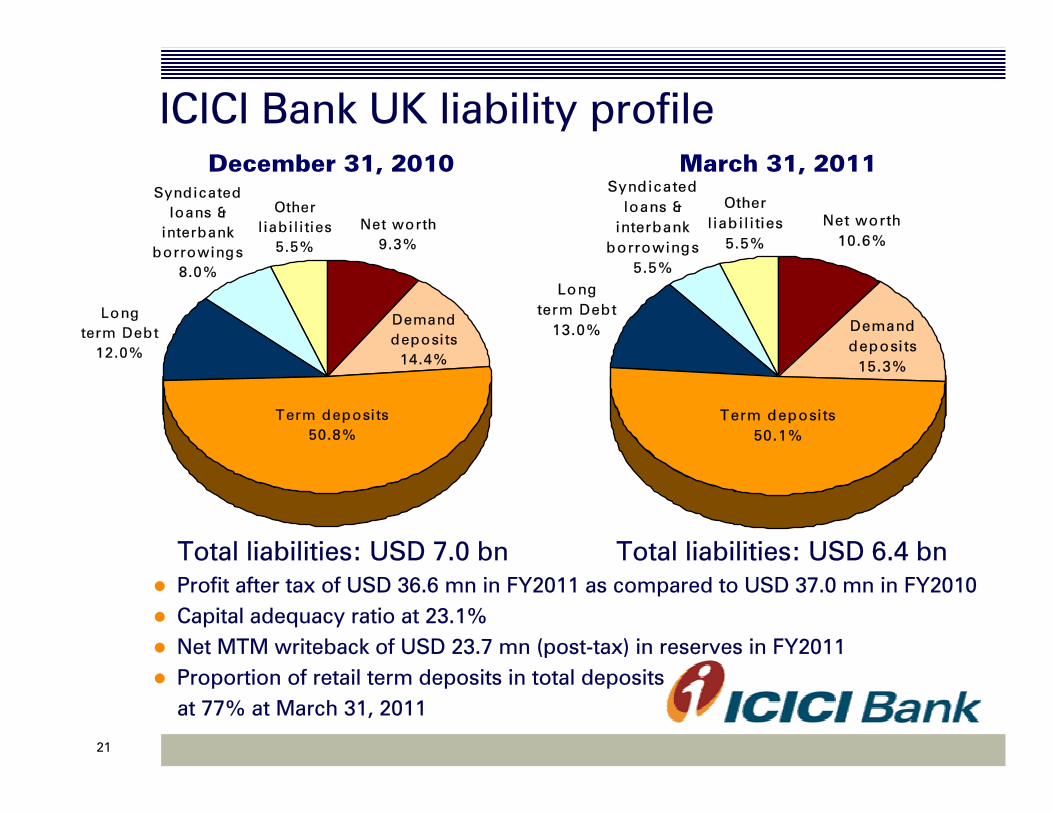
ICICI Bank UK liability profile
Total liabilities: USD 6.4 bn
December 31, 2010 March 31, 2011
Total liabilities: USD 7.0 bnProfit after tax of USD 36.6 mn in FY2011 as compared to USD 37.0 mn in FY2010Capital adequacy ratio at 23.1%Net MTM writeback of USD 23.7 mn (post-tax) in reserves in FY2011Proportion of retail term deposits in total deposits at 77% at March 31, 2011
Demand deposi ts
14.4%
Syndicated loans &
interbank borrowings
8.0%
Other l iab i l i ties
5.5%
Term deposi ts50.8%
Net worth9.3%
Long term Debt
12.0%
Demand deposi ts
15.3%
Syndicated loans &
interbank borrowings
5.5%
Other l iab i l i ties
5.5%
Term deposi ts50.1%
Net worth10.6%
Long term Debt
13.0%
22
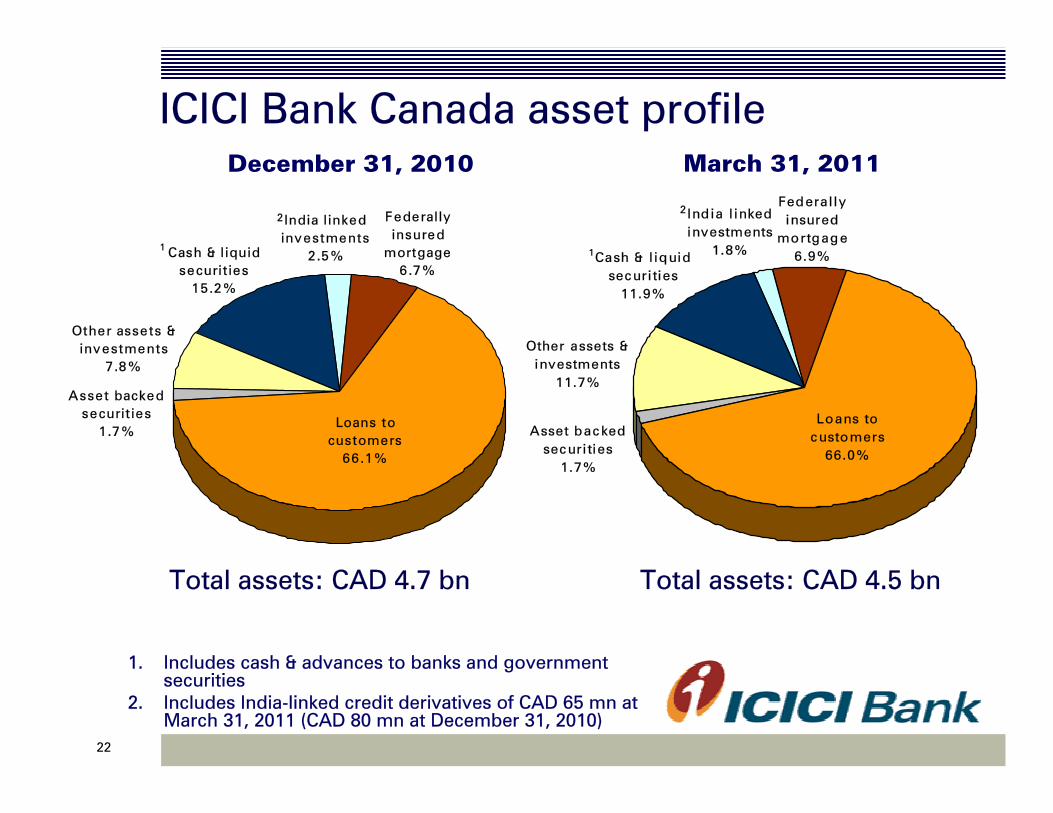
Cash & l iquid securit ies
15.2%
Federally insured
mortgage6.7%
Other assets & investments
7.8%
Asset backed securit ies
1.7%
India linked investments
2.5%
Loans to customers
66.1%
ICICI Bank Canada asset profile
1. Includes cash & advances to banks and government securities
2. Includes India-linked credit derivatives of CAD 65 mn at March 31, 2011 (CAD 80 mn at December 31, 2010)
Total assets: CAD 4.5 bn
2
1
December 31, 2010 March 31, 2011
Total assets: CAD 4.7 bn
2
1Cash & l iquid securi ties
11.9%
Federal ly insured
mortgage6.9%
Other assets & investments
11.7%
Asset backed securi ties
1.7%
India l inked investments
1.8%
Loans to customers
66.0%

23
ICICI Bank Canada liability profile
Total liabilities: CAD 4.5 bn
Profit after tax of CAD 32.4 mn in FY2011 as compared to CAD 35.4 mn in FY2010
Capital adequacy ratio at 26.3%1
December 31, 2010 March 31, 2011
Total liabilities: CAD 4.7 bn
Borrowings1.6%
Net worth20.8%
Demand deposi ts
15.1%
Other l iab i l i ties
2.3%Term deposi ts
60.2%Borrowings
1.7%
Net worth21.8%
Demand deposi ts
15.7%
Other l iab i l i ties
2.7% Term deposi ts58.2%
1. As per IFRS
24
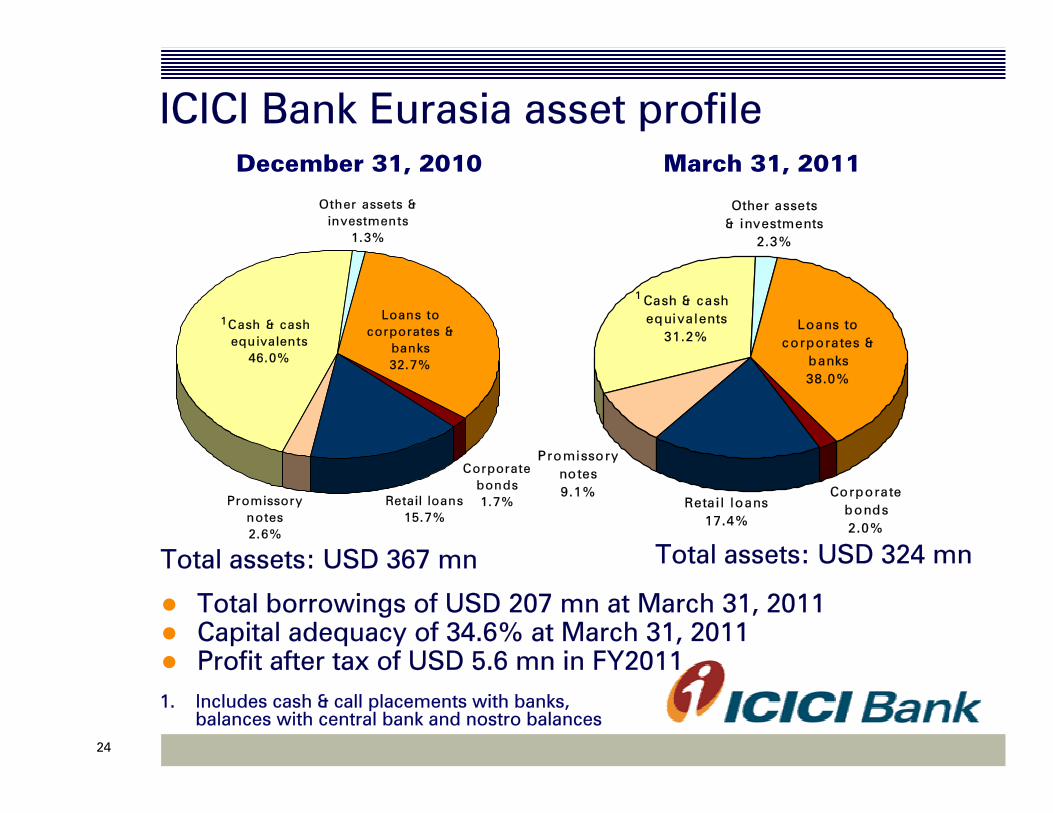
Other assets & investments
1.3%
Corporate bonds1.7%Promissory
notes2.6%
Cash & cash equivalents
46.0%
Retail loans15.7%
Loans to corporates &
banks32.7%
ICICI Bank Eurasia asset profile
Total assets: USD 324 mn
1. Includes cash & call placements with banks, balances with central bank and nostro balances
Total borrowings of USD 207 mn at March 31, 2011Capital adequacy of 34.6% at March 31, 2011Profit after tax of USD 5.6 mn in FY2011
1
December 31, 2010 March 31, 2011
Total assets: USD 367 mn
Other assets & investments
2.3%
Corporate bonds2.0%
Promissory notes9.1%
Cash & cash equivalents
31.2%
Retai l loans17.4%
Loans to corporates &
banks38.0%
1
25
Domestic subsidiaries
26
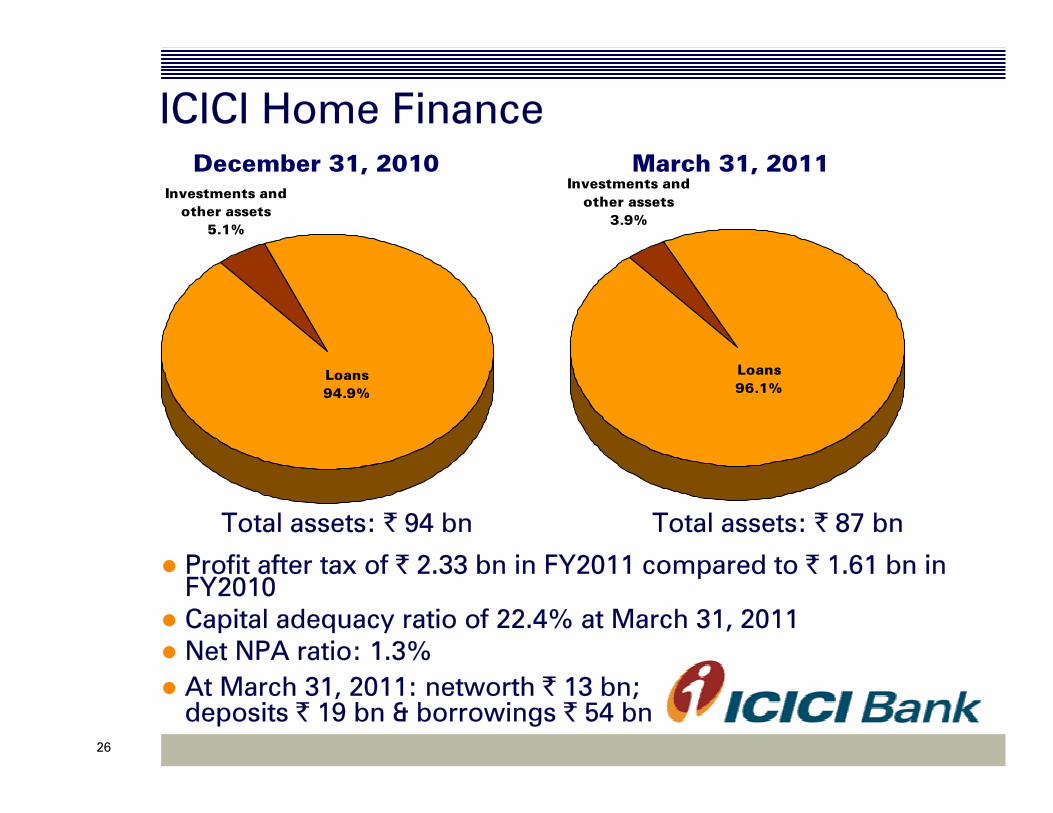
ICICI Home Finance
Total assets: ` 87 bn
Profit after tax of ` 2.33 bn in FY2011 compared to ` 1.61 bn in FY2010Capital adequacy ratio of 22.4% at March 31, 2011Net NPA ratio: 1.3%At March 31, 2011: networth ` 13 bn; deposits ` 19 bn & borrowings ` 54 bn
December 31, 2010 March 31, 2011
Total assets: ` 94 bn
Loans 96.1%
Investments and other assets
3.9%
Loans 94.9%
Investments and other assets
5.1%
27
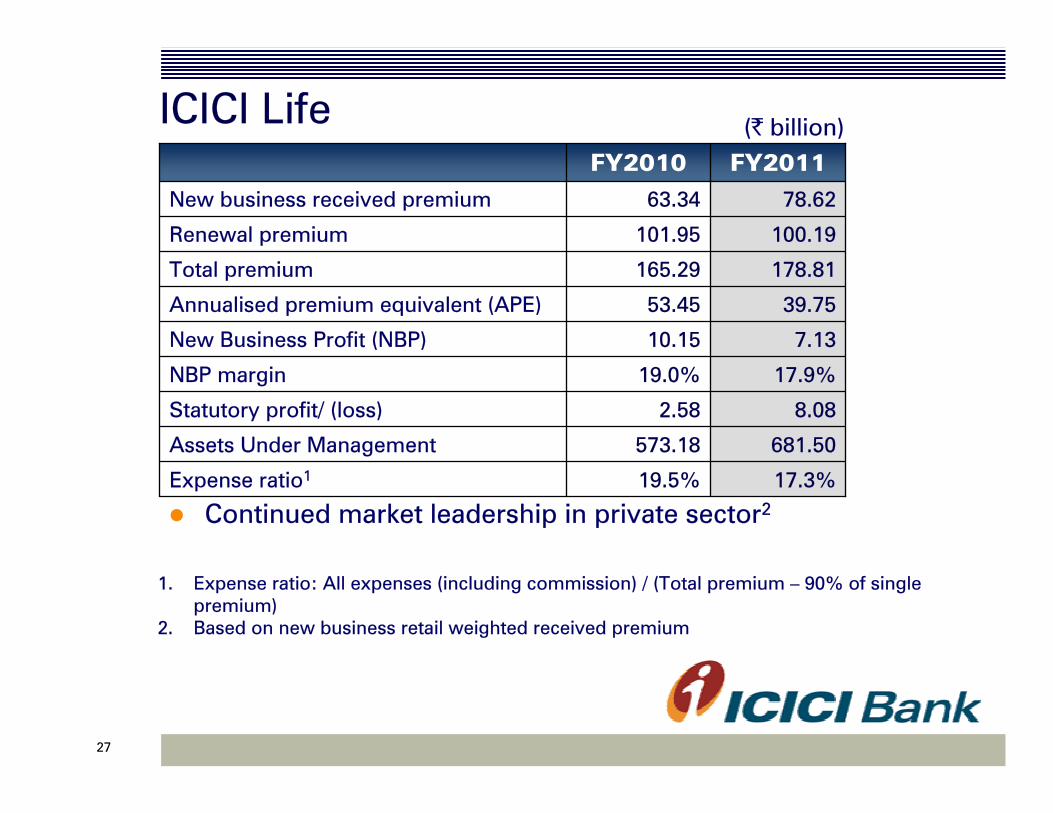
ICICI Life
39.7553.45Annualised premium equivalent (APE)
78.6263.34New business received premium
681.50573.18Assets Under Management
8.082.58Statutory profit/ (loss)
17.9%19.0%NBP margin
7.1310.15 New Business Profit (NBP)
100.19101.95Renewal premium
17.3%19.5%Expense ratio1
178.81165.29Total premium
FY2011FY2010(` billion)
1. Expense ratio: All expenses (including commission) / (Total premium – 90% of single premium)
2. Based on new business retail weighted received premium
Continued market leadership in private sector2

28
ICICI General
1. Excluding remittances from third party motor pool and including premium on reinsurance accepted
(0.80)1.44PAT
44.0834.31Gross premium1
FY2011FY2010
(` billion)
Continued market leadership in private sectorAs per IRDA order dated March 12, 2011, all general insurance companies are required to provide for motor pool losses at a provisional loss ratio of 153% (from FY2008 to FY2011) compared to earlier loss ratios of 122-127%. The profits of ICICI General for FY2011 includes an impact of ` 2.72 billion on account of the above.
29
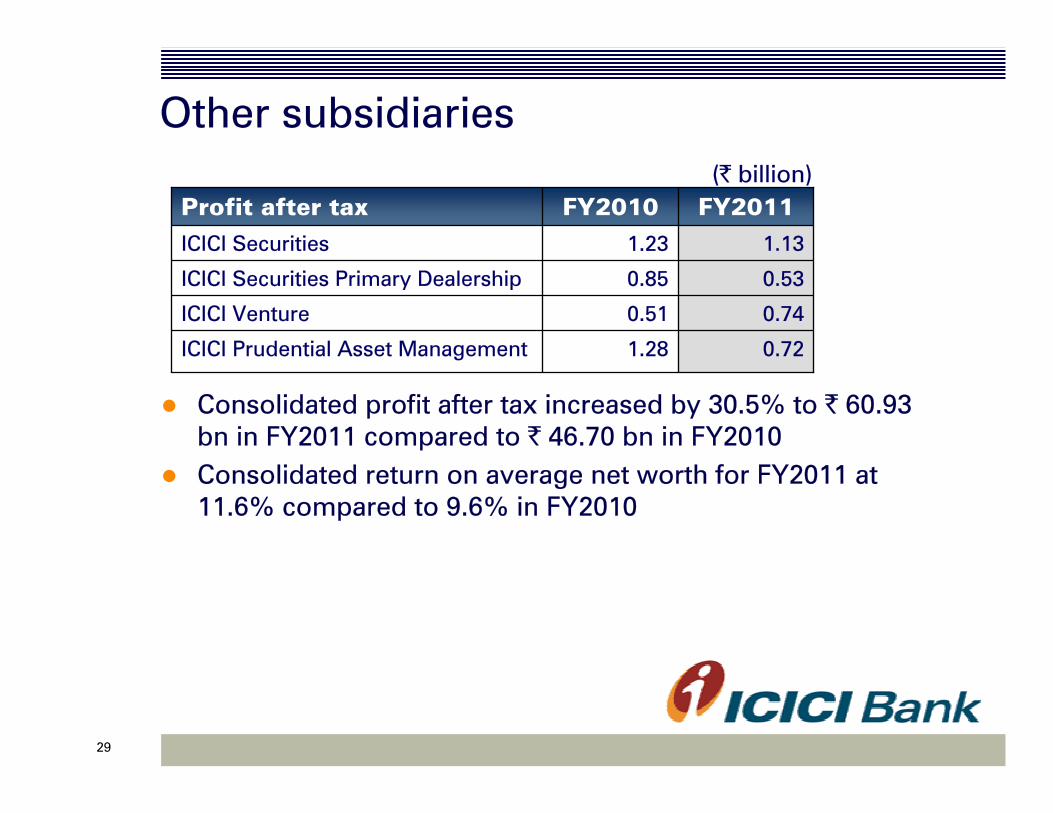
Other subsidiaries
1.28
0.51
0.85
1.23
FY2010
0.72ICICI Prudential Asset Management
1.13ICICI Securities
0.74
0.53
FY2011Profit after tax
ICICI Venture
ICICI Securities Primary Dealership
Consolidated profit after tax increased by 30.5% to ` 60.93 bn in FY2011 compared to ` 46.70 bn in FY2010Consolidated return on average net worth for FY2011 at 11.6% compared to 9.6% in FY2010
(` billion)
30
Thank you