Performance of the Agilent 7900 ICP-MS with UHMI for … standard (ISTD) solution was ... Once the...
12
Introduction Since the first generation of commercial ICP-MS appeared on the market in the 1980’s, the technique has been adopted for trace elemental analysis across a wide range of industries and applications. The measurement of high matrix samples typical of environmental, clinical, food, nuclear and geological applications, however, remains challenging. When high total dissolved solids (TDS) samples are analyzed directly by ICP-MS, matrix may deposit on the sampling and skimmer cone orifices, leading to a downward drift of the signal. The analyte signal may also be significantly suppressed (or, less commonly, enhanced) by matrix components when analyzing these sample types [1]. High matrix environmental samples of interest include marine organisms, sediments, groundwater, open ocean and coastal seawater [2]. Enclosed lakes and lagoons with salt levels far in Performance of the Agilent 7900 ICP-MS with UHMI for high salt matrix analysis Application note Authors Wim Proper 1 , Ed McCurdy 2 and Junichi Takahashi 3 1 Eurofins Analytico, Netherlands 2 Agilent Technologies, UK 3 Agilent Technologies, Japan Environmental, Food, Chemical
Transcript of Performance of the Agilent 7900 ICP-MS with UHMI for … standard (ISTD) solution was ... Once the...
Introduction
Since the fi rst generation of commercial ICP-MS appeared on the market in the 1980’s, the technique has been adopted for trace elemental analysis across a wide range of industries and applications. The measurement of high matrix samples typical of environmental, clinical, food, nuclear and geological applications, however, remains challenging. When high total dissolved solids (TDS) samples are analyzed directly by ICP-MS, matrix may deposit on the sampling and skimmer cone orifi ces, leading to a downward drift of the signal. The analyte signal may also be signifi cantly suppressed (or, less commonly, enhanced) by matrix components when analyzing these sample types [1]. High matrix environmental samples of interest include marine organisms, sediments, groundwater, open ocean and coastal seawater [2]. Enclosed lakes and lagoons with salt levels far in
Performance of the Agilent 7900 ICP-MS with UHMI for high salt matrix analysis
Application note
Authors
Wim Proper1, Ed McCurdy2 and Junichi Takahashi3
1 Eurofi ns Analytico, Netherlands2Agilent Technologies, UK3Agilent Technologies, Japan
Environmental, Food, Chemical
excess of oceanic seawater are also of interest; known as hypersaline lakes, these bodies of water include Don Juan Pond and Lake Vanda in Antarctica, Lake Assal in Djibouti, Garabogazköl in Turkmenistan, the Dead Sea between Israel and Jordan, and Mono Lake and the Great Salt Lake in the USA. In such waters, the level of salinity may be many times that of seawater (up to twelve times higher, at > 40% salinity in the case of Don Juan Pond).When high matrix samples are measured using ICP-MS, the matrix elements can affect analyte signals in several distinct ways. Probably the most widely recognized is the gradual downward drift that typically occurs due to the build-up of matrix deposits on the ICP-MS interface components (sampling cone and skimmer cone) when high matrix samples are measured over an extended period. This signal drift is the primary reason for the 0.2% (2000 ppm or 2 g/L) total dissolved solids (TDS) limit which is widely accepted as the maximum that can be tolerated for direct measurement by conventional ICP-MS instruments. 0.2% TDS is also the limit defi ned in many standard methods for ICP-MS, such as EN-ISO 17294-2 (Water Quality), US-EPA 6020B (Water and Wastes), and EN 13805 (Trace Elements in Food). Signal drift varies by matrix, with refractory element matrices often causing a greater build-up of matrix deposits, and the drift may also affect different analytes differently, most commonly with a greater signal loss for lower mass elements.Another important factor to consider when measuring high dissolved solids samples is the impact of the matrix on physical parameters such as sample viscosity, uptake rate, nebulization, droplet formation and evaporation rates, all of which can affect the quantity and quality of the aerosol produced and therefore the signal.
2
Analyte signals may also be affected by ionization suppression, where the presence of a high concentration of easily ionized (low fi rst ionization potential (IP)) atoms in the plasma causes an excess of free electrons, which inhibits the ionization of other elements, particularly poorly ionized analytes such as the commonly measured trace elements As, Se, Cd and Hg. As well as ionization suppression, a high concentration of a matrix element in the extracted ion beam may also defocus the other ions, causing signifi cant signal loss due to space charge effects [3]. Finally, major elements such as Na, Ca, Cl and S can give rise to polyatomic ions in the mass spectrum, which inhibit the determination of trace-levels of Ti, V, Cr, Ni, Cu, Zn, As and other elements. As a result, ICP-OES is often used for the analysis of high salt water samples [4, 5], leading to higher minimum reporting limits than ICP-MS. An alternative approach to avoiding spectral interferences is to use a matrix removal technique such as on-line chelation [6 – 8], solid phase extraction [9] or co-precipitation [10, 11]. These techniques can be applied to the routine analysis of certain elements, but they are time-consuming and require a skilled operator. Moreover, due to their similar chemical properties, some elements such as Br, Rb, I and Cs may be removed along with the matrix elements.It is now possible to dramatically reduce spectral interferences that are formed due to the major components of seawater and other high salt samples by using an ICP-MS equipped with collision/reaction cell (CRC) technology such as the Agilent Octopole Reaction System (ORS). Agilent has also developed the High Matrix Introduction (HMI) system specifi cally for the direct introduction of high matrix samples into an ICP-MS. HMI utilizes a conventional peristaltic pump and

nebulizer combined with very robust plasma conditions that use a longer sampling depth and reduced carrier gas fl ow rate. A second argon gas fl ow (the dilution gas) is added between the spray chamber and torch (i.e., after the spray chamber exit), so the dilution gas fl ow dilutes the sample aerosol as it passes to the torch. While the peristaltic pump uptakes sample solution at a normal uptake rate of ~0.4 mL/ min, the nebulizer gas fl ow is reduced to less than 1 L/ min. In accordance with the reduced gas fl ow rate, the volume of the sample aerosol created at the nebulizer also decreases. As a result, reduction of the amount of sample that reaches the plasma is achieved without any addition of reagent or diluent solutions, and without any manual handling of the sample itself. The direct analysis of seawater is now done routinely by Agilent ICP-MS equipped with HMI and ORS. However, there is an analytical need for trace metal analysis of higher matrix samples such as hypersaline lake water and saturated salt water (25% NaCl) that is used for dialysis, fi sh transportation and during the development of oil fi elds. This application note describes how a new instrument, the Agilent 7900 ICP-MS, fi tted with a new Ultra High Matrix Introduction (UHMI) option, allows samples with very high matrix levels up to 25% TDS to be run routinely. This level of salt matrix was not previously considered suitable for analysis by ICP-MS so the use of UHMI to extend the matrix tolerance of ICP-MS to percent levels of TDS overcomes a long-standing limitation of the ICP-MS technique.
3
ExperimentalReagents and instrumentationSalt matrix solutions of various dissolved solids levels (up to 25% w/w NaCl) were prepared by dissolving reagent grade NaCl (Merck EMSURE, Darmstadt, Germany), in deionized water stabilized with the addition of 0.5% HNO3 and 0.6% HCl. Calibration standards were prepared from custom mix and single element stock solutions purchased from Inorganic Ventures, Christiansburg, USA, and spike mixes were prepared from mixed QC stock solutions from CPI International, Amsterdam, NL, and a single element Hg standard from Merck, Darmstadt, Germany. A mixed internal standard (ISTD) solution was also prepared from single element stocks from the same suppliers, and added on-line using the standard ISTD mixing tee-connector.
An Agilent 7900 ICP-MS equipped with standard nickel sampling and skimmer cones, a standard glass nebulizer, quartz spray chamber chilled at 2 °C and quartz torch with 2.5 mm injector was used. The 7900 ICP-MS features a new Ultra High Matrix Introduction (UHMI) option, which extends the aerosol dilution range up to a factor of 100, allowing TDS levels of up to 25% to be run. UHMI dilution was performed automatically using the dilution factor set by the user, and calibrated by the plasma correction software algorithm to ensure consistent operating conditions. For the salt matrix samples in this work UHMI-100 (~100x dilution) was used. As normal for high salt matrices, the Agilent argon humidifi er accessory (G8412A) was used. The 7900 ICP-MS also features a fourth generation collision / reaction cell, the ORS4, which includes a standard He mode cell gas line. The optional H2 cell gas line was used for improved interference removal on certain elements with intense plasma-based polyatomic overlaps, notably Ca (m/z 40) Fe (56) and Se (78). An Agilent ASX-520 autosampler was used for sample delivery.

4
OptimizationOnce the UHMI dilution factor (based on the expected maximum matrix level for the samples of interest) is set in the acquisition parameters for a batch, the other instrument settings are optimized automatically using the ICP-MS MassHunter autotune function. Autotuning can be set to run automatically during the predefi ned instrument Startup sequence or separately as part of each batch acquisition, and tune settings for all tune modes (in this case He mode for most elements and H2 mode for Ca, Mn, Fe and Se) can be optimized independently. This ensures that conditions are always optimum for the current instrument hardware and sample type.
Analytical procedureFor ease of operation, the Agilent ICP-MS MassHunter software has several preset plasma modes which include the UHMI dilution factor. This allows appropriate conditions to be recalled and applied consistently without the need for regular re-tuning. For the performance tests on the high NaCl matrices (up to 25% NaCl), UHMI-100 (~100x aerosol dilution) was selected because it gives the maximum robustness and tolerance of exceptionally high matrix levels. The instrument settings used are shown in Table 1. All lens voltages were optimized using the autotune function of the instrument. It is clear that most parameters are consistent for the two gas modes used.
Analysis of a range of trace elements of interest was performed in salt matrices ranging from zero added NaCl to 25% NaCl solution. All samples were measured against simple aqueous calibration standards (no NaCl matrix), prepared in the same acid mix as the samples (0.5% HNO3 and 0.6% HCl).
Results and discussion
Evaluation of UHMI matrix tolerance for high NaCl To investigate the performance of the 7900 ICP-MS with UHMI for the routine measurement of high salt matrix samples, a stability test was performed. For this test, a blank (unspiked) solution of 25% NaCl was measured repeatedly, alternating with a spiked sample of the same NaCl matrix. Twenty fi ve measurements were performed for each sample, so 50 samples containing the 25% NaCl matrix were measured in total during the 4 hour sequence. Figure 1 shows the internal standard (ISTD) signals for the entire sequence, including the initial calibration standards and blank solutions that contained no NaCl matrix.
The effect of the NaCl matrix is very apparent, with all the internal standard signals being signifi cantly lower in the NaCl matrix samples than in the low matrix standards and blanks. Most of this reduction in signal is apparently due to physical sample uptake and nebulization effects, and differences in aerosol transport
Table 1. 7900 ICP-MS operating parameters for high salt matrix analysis
Cell Mode H2 He
Plasma mode UHMI-100RF power (W) 1600Sampling depth (mm) 10Carrier gas (L/min) 0.31Dilution gas (L/min) 0.58Ext 1 (V) 0Ext 2 (V) -235Omega bias (V) -120Omega lens (V) 9.2Defl ect (V) -3.8 0.8ORS gas (mL/min) 6 5
Stabilization (sec) 0 5KED (V) 3.0 5.0

5
and solvent evaporation rate for the solution with and without the 25% NaCl matrix. Some of the signal loss may be attributable to ionization suppression due to the high level of Na present in the plasma; Ir is the least easily ionized ISTD element (1st ionization potential (IP) of 8.97 eV) and the Ir signal dropped the most of any ISTD. However, ionization suppression cannot account for the majority of the signal change in the NaCl matrix, since Ge, which is also relatively poorly ionized (1st IP 7.90 eV), retained about the same proportion of its original (no matrix) signal as the more easily ionized elements.
However, from the stability plot in Figure 1, it is very striking that after the initial reduction in ISTD signal in the presence of the NaCl matrix, all the ISTD element signals remained constant in the subsequent NaCl matrix samples and the ISTD signals all remained approximately parallel. This indicates fi rstly that there
was very little sensitivity loss due to matrix deposition during the 4 hour sequence, and secondly there was no mass dependent signal change (mass bias). This stable and consistent response for elements of differing IP and mass is very important for accurate quantitative analysis, as it ensures that ISTD correction can be applied to a wide range of analytes with far greater confi dence and accuracy.
Spike recoveries and detection limits in 25% NaClSince every alternate sample in the NaCl matrix sequence was spiked with a QC stock (majors spiked at 20 mg/L, most traces spiked at 50 µg/L and As spiked at 25 µg/L), it was possible to assess the accuracy and stability of the quantitative measurement for a range of analytes, including elements of interest in typical environmental samples. Based on the good signal stability for the uncorrected (ISTD) signals, it might be expected that the analyte concentrations, corrected for
200
100
0
6 Li [He]
ISTD
Rec
over
y % (O
utlie
r Set
ting)
washwashCal 0St 01St 02St 03St 04St 05St 06St 07St 08washwashwashwashwashwashwashBlank 01Blank 02Blank 03Blank 04Blank 05Blank 06Blank 07Blank 08Blank 09Blank 1025%25%
+25%25%
+25%25%
+25%25%
+25%25%
+25%25%
+25%25%
+25%25%
+25%25%
+25%25%
+25%25%
+25%25%
+25%25%
+25%25%
+25%25%
+25%25%
+25%25%
+25%25%
+25%25%
+25%25%
+25%25%
+25%25%
+25%25%
+25%25%
+25%
45 Sc [H2]45 Sc [He]72 Ge [H2]72 Ge [He]103 Rh [He]115 In [He]193 Ir [He]
Figure 1. Internal standard signal for sequence including 50 samples of 25% NaCl matrix

6
the ISTD signal change, would also show good stability in this same sequence of 25% NaCl matrix samples. The spike recovery accuracy and precision data for the 25 spiked NaCl matrix samples, calibrated against the simple aqueous standards, are shown in Table 2. For most elements, the measured values were well within 10% of the true spiked amount with precision <5% over the 4 hour sequence.
From the unspiked 25% NaCl matrix samples that were measured interspersed with the spiked NaCl samples, the method detection limits (3 x SD of the 25 external
Table 2. Major and trace element spike recoveries, precision and method DLs over 4 hours, measured in 25% NaCl and calibrated against simple aqueous standards
Element Isotope Cell Mode Units DL (3xSD) Spike Mean Conc Recovery (%) RSD (%)
Mg 24 He mg/L 0.03 20 18.86 94 1.33Al 27 He mg/L 0.1 20 23.51 118 3.18K 39 He mg/L 2.27 20 27.94 140 2.92Ca 44 H2 mg/L 0.13 20 20.84 104 5.71Fe 56 H2 mg/L 0.01 20 19.06 95 3.13
Ti 47 He µg/L 3.54 50 48.85 98 10.63V 51 He µg/L 0.82 50 50.42 101 2.49Cr 52 He µg/L 0.79 50 48.77 98 2.69Mn 55 H2 µg/L 0.001 50 49.61 99 3.57Co 59 He µg/L 0.153 50 41.30 83 2.54Ni 60 He µg/L 1.98 50 46.48 93 5.08Cu 63 He µg/L 0.96 50 42.35 85 3.97Zn 66 He µg/L 2.13 50 43.46 87 4.91As 75 He µg/L 0.9 25 24.27 97 6.54Se 78 H2 µg/L 1.62 50 45.03 90 4.14Mo 95 He µg/L 0.001 50 56.00 112 2.21Cd 111 He µg/L 0.20 50 42.62 85 4.66Sn 118 He µg/L 1.01 50 50.43 101 3.74Sb 121 He µg/L 0.34 50 49.46 99 2.23Ba 137 He µg/L 0.84 50 48.87 98 3.79Pb 208 He µg/L 3.63 50 52.81 106 2.61
replicates) were calculated, and these fi gures are also shown in Table 2. Sub-µg/L detection limits (DLs) were obtained for most of the trace elements despite the very high matrix, the high UHMI dilution used, and the fact that the blanks used for the calculation of the DLs were each preceded by a spiked sample matrix. It should also be noted that the NaCl used to prepare the samples was reagent grade NaCl, which might have contributed to the relatively high blank contribution and standard deviation (SD) obtained for some elements such as Al, K, Ti, Ni, Zn, Sn and Pb.
7
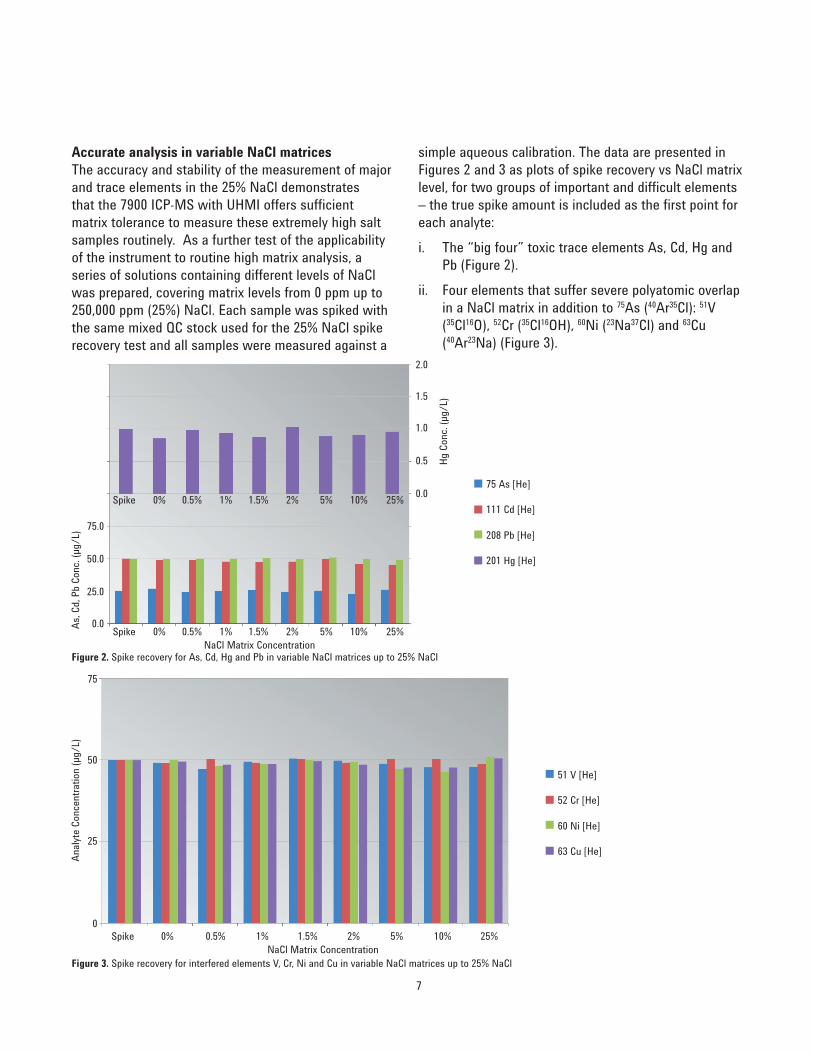
Accurate analysis in variable NaCl matricesThe accuracy and stability of the measurement of major and trace elements in the 25% NaCl demonstrates that the 7900 ICP-MS with UHMI offers suffi cient matrix tolerance to measure these extremely high salt samples routinely. As a further test of the applicability of the instrument to routine high matrix analysis, a series of solutions containing different levels of NaCl was prepared, covering matrix levels from 0 ppm up to 250,000 ppm (25%) NaCl. Each sample was spiked with the same mixed QC stock used for the 25% NaCl spike recovery test and all samples were measured against a
simple aqueous calibration. The data are presented in Figures 2 and 3 as plots of spike recovery vs NaCl matrix level, for two groups of important and diffi cult elements – the true spike amount is included as the fi rst point for each analyte:i. The “big four” toxic trace elements As, Cd, Hg and
Pb (Figure 2).ii. Four elements that suffer severe polyatomic overlap
in a NaCl matrix in addition to 75As (40Ar35Cl): 51V (35Cl16O), 52Cr (35Cl16OH), 60Ni (23Na37Cl) and 63Cu (40Ar23Na) (Figure 3).
Figure 3. Spike recovery for interfered elements V, Cr, Ni and Cu in variable NaCl matrices up to 25% NaCl
Figure 2. Spike recovery for As, Cd, Hg and Pb in variable NaCl matrices up to 25% NaCl
75.0
2.0
1.5
1.0
0.5
0.0
50.0
25.0
0.0Spike 0% 0.5% 1% 1.5% 2% 5% 10% 25%
Spike 0% 0.5% 1% 1.5% 2% 5% 10% 25%
NaCl Matrix Concentration
As, C
d, Pb
Con
c. (µ
g/L)
Hg C
onc.
(µg/
L)
75 As [He]
111 Cd [He]
208 Pb [He]
201 Hg [He]
51 V [He]
52 Cr [He]
60 Ni [He]
63 Cu [He]
75
50
25
0Spike 0% 0.5% 1% 1.5% 2% 5% 10% 25%
NaCl Matrix Concentration
Analy
te C
once
ntra
tion
(µg/
L)

8
ConclusionsThe Agilent 7900 ICP-MS with UHMI allows ICP-MS to be used for the fi rst time for the direct analysis of trace elements in very high matrix samples, without prior sample dilution. The new UHMI system extends the aerosol dilution range up to a factor of 100, tolerating TDS levels of up to 25% (10 times higher than the previous generation HMI), a matrix level 100 times above the accepted limit for conventional ICP-MS systems. The 4th generation Octopole Reaction System (ORS4), operating in He mode, is able to reduce the very intense matrix-based polyatomic interferences in these high salt samples, allowing accurate measurement of interfered trace elements such as V, Cr, Ni, Cu and As.
In this study, the 7900 ICP-MS with UHMI option was used to analyze a wide range of elements in undiluted saturated salt water and various commercially available table salts. The analysis demonstrates a level of matrix tolerance that is unprecedented in ICP-MS. This capability extends the use of ICP-MS for samples with a very high salt matrix, offering a possible alternative to AA or ICP-OES techniques.
These two groups of elements include analytes that can be challenging to measure accurately by ICP-MS even in many typical low matrix samples. Because of their toxicity, Cr, As, Cd, Hg and Pb are typically regulated or monitored at low or sub µg/L levels in environmental, food, clinical, pharmaceutical and consumer product samples, so the detection limit requirements are at ng/L levels. Added to that, several of these elements are poorly ionized (As, Cd and Hg all have a 1st IP around 9 eV or above, meaning they are typically only 10% to 50% ionized in the plasma), and for Cd and Hg the preferred isotope has relatively low abundance, so sensitivity of the measured isotope is further reduced. In the high salt matrices being investigated in this work, the analysis of many of the elements is further hampered by the presence of matrix-based polyatomic interferences as mentioned previously.
The data presented graphically in Figures 2 and 3 show that consistent and accurate recovery of the spike levels was achieved for all these elements in all levels of NaCl matrix measured, calibrated against simple, non-matrix matched standards. This is a remarkable performance for any ICP-MS, demonstrating accurate analysis of diffi cult, interfered elements in samples containing variable matrix levels that extend up to 25%, a concentration 100 times higher than the accepted TDS limit for conventional ICP-MS analysis.
Analysis of commercial table salt samplesCommercial table salts were purchased and analyzed in order to test the application of the method for trace element characterization of food-grade salt. Sea salts and rock salts were sourced from various countries. The analytical results obtained are shown in Table 3 for information; no reference or expected concentrations were available for these salt samples. For simplicity, only the elements that were found at signifi cant levels or showed a high degree of variation between the samples are shown.

9
Table 3. Analytical results of commercial table salts produced in various countries from rock salt or sea salt
Units SICJ Japan, Mexico, Australia seawater
Japan, Izu, seawater
Japan, Mexico, Australia seawater
Japan, Seto, seawater
Japan, seawater
Mexico, seawater
Germany, rock
Li µg/L 14 60 140 40 160 44 1.4 100Mg mg/L 51 430 1500 190 350 130 91 150Al µg/L 0.22 0.13 0.38 0.15 0.23 0.16 0.048 56S mg/L 59 520 2000 490 76 48 51 51K mg/L 250 190 470 150 560 180 59 150Ca mg/L 56 210 740 310 210 86 1.3 720V µg/L 0.11 0.12 0.53 0.21 0.47 0.13 2.8 7.7Cr µg/L 0.19 0.35 0.39 0.18 0.22 0.23 0.66 10Mn µg/L 4 0.084 0.071 0.14 4.4 1.5 0.049 26Fe µg/L 0.85 1.1 1.4 1.1 1.4 1 1 120Cu µg/L 1.3 0.13 0.74 0.082 42 10 0.082 6.4Zn µg/L 1.6 0.068 0.02 0.085 3.7 2.7 0.046 8.8Ga µg/L 0.0079 0.021 0.04 0.033 0.017 0.013 0.0072 0.046As µg/L 0.13 0.3 0.52 0.16 0.1 0.2 0.22 0.32Se µg/L 1 0.6 0.43 0.56 0.71 0.45 0.66 0.8Br mg/L 120 42 100 34 330 95 10 32Rb µg/L 18 38 110 22 240 54 0.16 81Sr mg/L 0.3 2.8 4 4.8 1.6 0.66 0.047 0.1Zr µg/L 0.0093 0.0031 ND* ND ND ND 0.016 0.24Mo µg/L 0.25 3.2 12 1.7 2.1 0.18 1.2 0.21Ag µg/L 2.9 7.8 8.7 4 3.6 1.6 2.4 43Cd µg/L 0.19 0.092 0.26 0.045 0.17 0.12 0.59 1.4Sn µg/L 0.12 0.092 0.06 0.12 0.076 0.094 0.067 0.4Sb µg/L 0.019 0.11 0.31 0.021 0.011 0.021 0.064 0.27Te µg/L 2.9 0.96 1 1.1 4 1.5 0.7 0.72I µg/L 0.82 38 43 41 160 41 85 120Cs µg/L 0.098 0.13 0.33 0.081 1 0.22 0.019 12Ba µg/L 0.97 12 17 11 5.1 1.9 0.51 3W µg/L 0.25 0.016 0.022 0.02 0.069 0.07 0.11 0.069Au µg/L 0.071 0.044 0.034 0.054 0.055 0.064 0.081 0.072Hg µg/L 0.065 0.03 0.035 0.053 0.026 0.032 0.16 0.038Pb µg/L 1.7 0.21 0.37 0.067 0.26 0.27 0.054 2
*Not detected

10
Table 3 continued. Analytical results of commercial table salts produced in various countries from rock salt or sea salt
Units S. Africa, rock
USA, seawater USA Pakistan,
rockUSA, seawater
USA, seawater
Mongolia, rock
Li µg/L 9.7 7.2 1.7 140 3 4.7 28Mg mg/L 44 37 0.2 360 6.4 17 12Al µg/L 47 51 65 6100 47 21 2000S mg/L 140 130 51 760 97 81 410K mg/L 78 94 140 270 63 74 130Ca mg/L 85 85 5.4 340 65 43 440V µg/L 0.56 0.62 0.26 46 0.37 0.28 5.8Cr µg/L 6.1 4.9 1.1 25 2.5 2.6 14Mn µg/L 83 310 0.48 470 55 390 380Fe µg/L 320 280 51 5600 260 140 6100Cu µg/L 5.2 1.7 11 18 1.7 2.6 170Zn µg/L 12 4.2 1.5 94 3.5 3.1 66Ga µg/L 0.045 0.095 0.058 4.3 0.077 0.054 1.5As µg/L 0.22 0.99 0.18 5 0.3 0.54 7.3Se µg/L 0.62 0.72 0.62 1.2 0.55 0.54 1.1Br mg/L 32 37 8.5 14 23 33 37Rb µg/L 3.8 2.8 5.9 28 0.87 1.4 9.1Sr mg/L 2.6 1.6 0.013 2.4 1.6 0.85 0.45Zr µg/L 0.053 0.093 0.16 0.23 0.04 0.02 1.3Mo µg/L 0.61 0.72 0.54 0.75 0.42 0.25 3.6Ag µg/L 0.79 2.4 9.2 5.2 4.4 2 85Cd µg/L 0.1 0.062 0.049 0.47 0.22 0.12 1.8Sn µg/L 0.98 0.68 1.3 1.1 0.66 0.55 0.66Sb µg/L 0.54 0.65 0.84 0.66 0.49 0.44 0.47Te µg/L 0.77 0.95 0.43 0.47 0.78 0.62 0.52I µg/L 29 64 1600 9.1 390 25 11Cs µg/L 0.042 0.02 0.027 1.3 0.03 0.02 0.87Ba µg/L 11 21 2.1 120 11 11 150W µg/L 0.081 0.17 0.26 0.2 0.16 0.06 0.051Au µg/L 0.073 0.087 0.69 0.068 0.11 0.054 0.12Hg µg/L 0.06 0.048 0.063 0.12 0.081 0.028 0.2Pb µg/L 1.9 2.4 2.7 28 24 1.7 57

11
References1. D. Beauchemin, J. W. McLaren and S. S. Berman,
Spectrochim. Acta Part B, 42, 3, 467-490 (1987)
2. J. McLaren, D. Beauchemin and T. V. Voet, Can. J. Spectrosc., 30, 6, 29A-32A (1985)
3. I. Rodushkin, T. Ruth and D. Klockare, J. Anal. At. Spectrom., 13, 3, 159-166 (1998)
4. P. F. Kehr, J. S. Jones, D. A. Fritz, D. E. Harrington and W. R. Bramstedt, At. Spectrosc., 6, 5, 128-133 (1985)
5. W. Li, F. Pan, S. You, Q. He, D. Kang and Y. Xu, Spectrochim. Acta Part B, 42, 6, 853-858 (1987)
6. L. Ebdon, A. Fisher, H. Handley and P. Jones, J. Anal. At. Spectrom., 8, 7, 979-981 (1993)
7. L. Halicz, I. Gavrieli and E. Dorfman, J. Anal. At. Spectrom., 11, 9, 811-814 (1996)
8. F. A. M Silva, C. L. P. Da Silveira, N. Miekekey and I. L. Kuechler, Anal. Sci., 20, 9, 1295-1299 (2004)
9. Tsung-ting Shih, Wei-yu Chen and Yuh-chang Sun, J. Chromatogr. A, 1218, 16, 2342-2348 (2011)
10. A. S. Buchanan and P. Hannaker, Anal. Chem, 56, 8, 1379-1382 (1984)
11. S. Kagaya, S. Miwa and K. Tohda, Anal. Sci., 23, 8, 1021-1024 (2007)

www.agilent.comAgilent shall not be liable for errors contained herein or for incidental or consequential damages in connection with the furnishing, performance or use of this material.
Information, descriptions, and specifi cations in this publication are subject to change without notice.
© Agilent Technologies, Inc. 2014Published April 8, 2014Publication number: 5991-4257EN