PERFORMANCE OF TAUM SAUK UPPER RESERVOIR DAM · PDF filePERFORMANCE OF TAUM SAUK UPPER...
15
PERFORMANCE OF TAUM SAUK UPPER RESERVOIR DAM DURING RESERVOIR REFILL By Jared Deible (1) , John Osterle (2) , Charles Weatherford (3) , Tom Hollenkamp (4) , and Matt Frerking (5) ABSTRACT The original rockfill dike, constructed in 1963 to form the Upper Reservoir at the Taum Sauk Pump Storage Project near Lesterville, MO failed abruptly on December 14, 2005. The Upper Reservoir Dam has been completely rebuilt as a 2.83 million cubic yard Roller Compacted Concrete (RCC) Dam in compliance with FERC Regulations and Missouri environmental permitting regulations. The project is the largest RCC project constructed in the USA and is the first pumped storage project to utilize an RCC water retaining structure. The project is owned and operated by AmerenUE and consists of an Upper Reservoir and a Lower Reservoir connected by a vertical shaft, rock tunnel, and penstock. The Powerhouse has two pump-turbines with a total generation capacity of 450MW. A refill plan was developed to monitor the performance of the dam during the first refill of the reservoir. This paper summarizes the monitoring and inspections conducted during the refill and the performance of the dam during this period. Because it is a pumped storage project with no natural inflow, the reservoir level can be raised and lowered with the reversible pump turbines at the project. The refill plan included hold points when the dam’s performance was assessed at eight reservoir levels. These eight levels included raising the reservoir to the maximum normal pool elevation and then dropping the reservoir to the minimum normal pool elevation to simulate the cycling of water levels during normal operation. Monitoring of the performance of the dam was done through instrumentation readings and visual inspections. Inspections checked for alignment changes, leakage, seepage, cracking, or any other unusual or changed conditions. Instrumentation monitored during the refill program includes piezometers, seepage weirs, survey monuments, and joint meters. The level control system for the project was also evaluated during the refill program. 1. Senior Project Engineer, Paul C. Rizzo Associates 2. Vice President, Paul C. Rizzo Associates 3. Resident Engineer, Paul C. Rizzo Associates 4. Chief Dam Safety Engineer, AmerenUE 5. Managing Supervisor, AmerenUE Presented at HydroVision International, Charlotte, North Carolina, July 27 - 30, 2010 © Paul C. Rizzo Associates, Inc.
Transcript of PERFORMANCE OF TAUM SAUK UPPER RESERVOIR DAM · PDF filePERFORMANCE OF TAUM SAUK UPPER...

PERFORMANCE OF TAUM SAUK UPPER RESERVOIR DAM DURING RESERVOIR REFILL
By Jared Deible(1), John Osterle(2), Charles Weatherford(3), Tom Hollenkamp(4), and Matt
Frerking(5)
ABSTRACT The original rockfill dike, constructed in 1963 to form the Upper Reservoir at the Taum Sauk Pump Storage Project near Lesterville, MO failed abruptly on December 14, 2005. The Upper Reservoir Dam has been completely rebuilt as a 2.83 million cubic yard Roller Compacted Concrete (RCC) Dam in compliance with FERC Regulations and Missouri environmental permitting regulations. The project is the largest RCC project constructed in the USA and is the first pumped storage project to utilize an RCC water retaining structure. The project is owned and operated by AmerenUE and consists of an Upper Reservoir and a Lower Reservoir connected by a vertical shaft, rock tunnel, and penstock. The Powerhouse has two pump-turbines with a total generation capacity of 450MW. A refill plan was developed to monitor the performance of the dam during the first refill of the reservoir. This paper summarizes the monitoring and inspections conducted during the refill and the performance of the dam during this period. Because it is a pumped storage project with no natural inflow, the reservoir level can be raised and lowered with the reversible pump turbines at the project. The refill plan included hold points when the dam’s performance was assessed at eight reservoir levels. These eight levels included raising the reservoir to the maximum normal pool elevation and then dropping the reservoir to the minimum normal pool elevation to simulate the cycling of water levels during normal operation. Monitoring of the performance of the dam was done through instrumentation readings and visual inspections. Inspections checked for alignment changes, leakage, seepage, cracking, or any other unusual or changed conditions. Instrumentation monitored during the refill program includes piezometers, seepage weirs, survey monuments, and joint meters. The level control system for the project was also evaluated during the refill program.
1. Senior Project Engineer, Paul C. Rizzo Associates 2. Vice President, Paul C. Rizzo Associates 3. Resident Engineer, Paul C. Rizzo Associates 4. Chief Dam Safety Engineer, AmerenUE 5. Managing Supervisor, AmerenUE
Presented at HydroVision International, Charlotte, North Carolina, July 27 - 30, 2010
© Paul C. Rizzo Associates, Inc.

2
1.0 Introduction The Taum Sauk Project consists of an Upper Reservoir and a Lower Reservoir connected by a vertical shaft, rock tunnel, and penstock. The Powerhouse has two pump-turbines with a total generation capacity of 450MW. The original rockfill dike, constructed in 1963 to form the Upper Reservoir at the Taum Sauk Pump Storage Project, failed abruptly on December 14, 2005. An aerial view of the breached section of the dike is shown below.
Figure 1: Aerial View of the Breached Dike
The original Upper Reservoir Dam was removed and completely rebuilt as a 2.83 million cubic yard Roller Compacted Concrete (RCC) Dam in compliance with FERC Regulations and Missouri environmental permitting regulations. AmerenUE has reconstructed the Upper Reservoir of the facility to restore the storage capacity, and intends to operate the Reservoir according to the current Project License. A plan view and typical section of the new Upper Reservoir are provided below.
Presented at HydroVision International, Charlotte, North Carolina, July 27 - 30, 2010
© Paul C. Rizzo Associates, Inc.

3
Figure 2: New Upper Reservoir Plan View
Figure 3: New Upper Reservoir Typical Section
Presented at HydroVision International, Charlotte, North Carolina, July 27 - 30, 2010
© Paul C. Rizzo Associates, Inc.
4
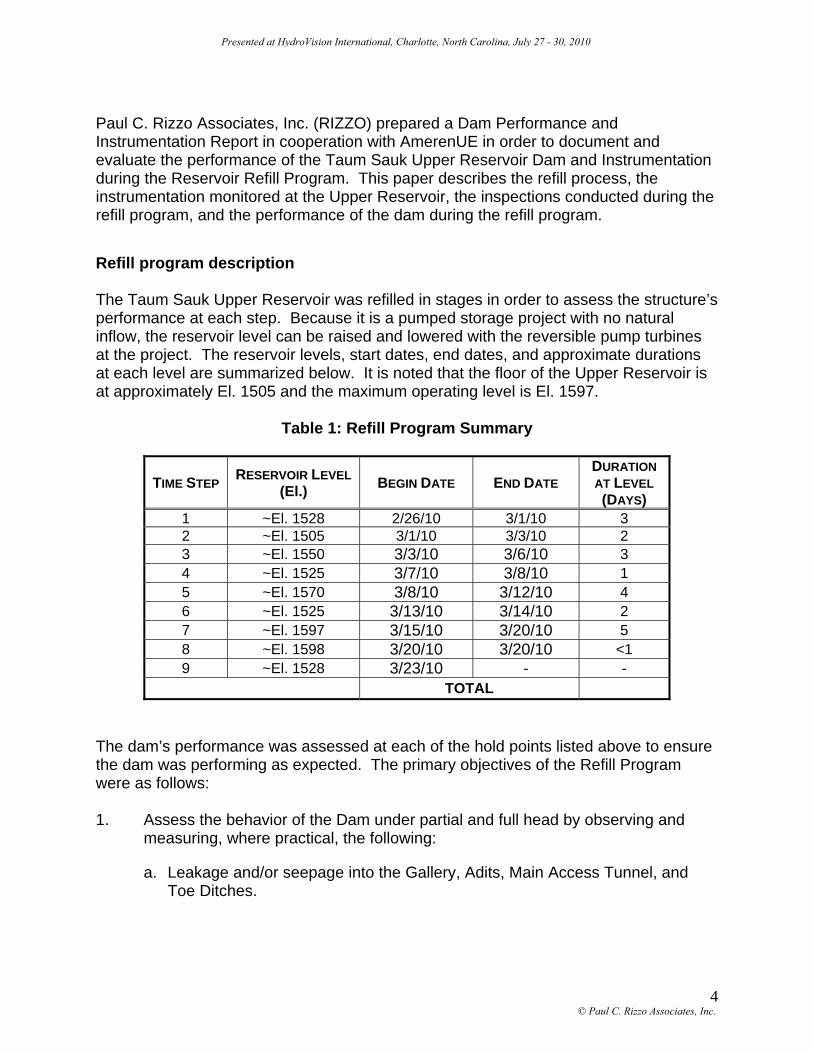
Paul C. Rizzo Associates, Inc. (RIZZO) prepared a Dam Performance and Instrumentation Report in cooperation with AmerenUE in order to document and evaluate the performance of the Taum Sauk Upper Reservoir Dam and Instrumentation during the Reservoir Refill Program. This paper describes the refill process, the instrumentation monitored at the Upper Reservoir, the inspections conducted during the refill program, and the performance of the dam during the refill program. Refill program description The Taum Sauk Upper Reservoir was refilled in stages in order to assess the structure’s performance at each step. Because it is a pumped storage project with no natural inflow, the reservoir level can be raised and lowered with the reversible pump turbines at the project. The reservoir levels, start dates, end dates, and approximate durations at each level are summarized below. It is noted that the floor of the Upper Reservoir is at approximately El. 1505 and the maximum operating level is El. 1597.
Table 1: Refill Program Summary
TIME STEP RESERVOIR LEVEL(El.) BEGIN DATE END DATE
DURATION AT LEVEL (DAYS)
1 ~El. 1528 2/26/10 3/1/10 3 2 ~El. 1505 3/1/10 3/3/10 2 3 ~El. 1550 3/3/10 3/6/10 3 4 ~El. 1525 3/7/10 3/8/10 1 5 ~El. 1570 3/8/10 3/12/10 4 6 ~El. 1525 3/13/10 3/14/10 2 7 ~El. 1597 3/15/10 3/20/10 5 8 ~El. 1598 3/20/10 3/20/10 <1 9 ~El. 1528 3/23/10 - -
TOTAL The dam’s performance was assessed at each of the hold points listed above to ensure the dam was performing as expected. The primary objectives of the Refill Program were as follows: 1. Assess the behavior of the Dam under partial and full head by observing and
measuring, where practical, the following:
a. Leakage and/or seepage into the Gallery, Adits, Main Access Tunnel, and Toe Ditches.
Presented at HydroVision International, Charlotte, North Carolina, July 27 - 30, 2010
© Paul C. Rizzo Associates, Inc.

5
b. Piezometric pressures in piezometers in the Gallery and downstream of the Gallery at the Adits, and at critical locations in the foundation throughout the Dam.
c. Alignment changes (horizontal and vertical), if any, of monuments on the Crest Road.
d. Deformation of the Dam (downstream/upstream, along the Dam axis direction, and vertical) as measured with Joint Meters installed at the Crest and Gallery at each Monolith Construction Joint
2.0 Summary of Instrumentation and Inspections The following sections include a description of the dam safety instrumentation monitored during the refill program, the monitoring frequency, and a summary of the inspections performed. Instrumentation at the site includes 24 vibrating wire piezometers, 10 leakage flumes, and 23 surface monuments. Inspections at the site during the refill program included a complete inspection of the Upper Reservoir every 12 hours. 2.1 Instrumentation 2.1.1 Piezometers
A total of 24 vibrating wire piezometers are located at 11 stations throughout the Dam. The piezometers are designed to measure uplift at the RCC/Rock interface at several sections, and uplift along defects in the foundation in several locations. Twenty of the 24 piezometers at the Upper Reservoir are connected to the Upper Reservoir Digital Control System (DCS). The DCS enables the piezometers to be read automatically at specified intervals. Hourly readings were reported for the piezometers connected to the DCS during the refill program. The four piezometers not connected to the DCS were read manually four times per day (approximately every 6 hours) during the refill program. 2.1.2 Flumes A total of ten trapezoidal flumes were installed at five locations in the gallery at the Upper Reservoir. A pair of flumes is located at each Gallery outlet so that the total outflow from the drainage Gallery is measured. The flumes are located in the drainage gallery trench so that leakage from crest-to-gallery drains, foundation drains, and any other leakage into the gallery flows through the flumes. Flume readings were taken twice a day (i.e., about every 12 hours).
Presented at HydroVision International, Charlotte, North Carolina, July 27 - 30, 2010
© Paul C. Rizzo Associates, Inc.

6
2.1.3 Surface Monuments Twenty-three surface monuments were installed along the Crest of the Upper Reservoir Dam. Two monuments are located at each monolith joint, one on each side of the monolith joint. Two additional monuments are located at critical sections of the dam. The survey system also includes benchmarks off the dam. The surface monuments are designed to measure any significant deformations of the dam. The monuments are surveyed with a robotic total station and a digital level. A baseline survey was conducted before the beginning of the refill program, and surveys were conducted at Time Steps 1, 3, 5, and 7 during the refill program. The surveys taken during the refill program were compared to the baseline survey to estimate total displacements.
2.1.4 Joint Meters Joint meters at the Taum Sauk Upper Reservoir consist of three pins set in the concrete around a construction joint. The gages allow displacements across the joint to be accurately measured and compared to previous readings to detect trends. The distance between each of the three pins is measured with a caliper, and each joint meter allows measurement of movement in the vertical and horizontal directions. A typical joint meter is shown in the diagram below, where measurement c is the check reading and measurements a and b measure movement across the joint.
Figure 4: Typical Joint Meter
Two joint meters are located at each monolith Construction Joint in the Dam. Ten joint meters are located on the Crest of the Upper Reservoir Dam and ten joint meters are located at the same joints in the Gallery. The joint meters were installed to monitor differential displacements between Monoliths.
Presented at HydroVision International, Charlotte, North Carolina, July 27 - 30, 2010
© Paul C. Rizzo Associates, Inc.

7
2.2 Inspections Visual inspections were conducted approximately every 12 hours during the Upper Reservoir Refill Program by RIZZO and AmerenUE personnel. The following key items were included in the inspections:
• Leakage/Seepage in Gallery, Adits, Access Tunnel, and Toe Ditches, including an evaluation of the turbidity.
• Visual inspection of instrumentation pipe anchorages.
• Visual observation of Upper Reservoir Staff Gage.
3.0 Assessment of Dam Performance The following sections discuss the performance of the Upper Reservoir Dam and Instrumentation during the refill program for each of the key parameters monitored. In accordance with FERC Guidelines, threshold levels and design basis values were established for instrumentation, where appropriate, prior to the start of the refill program. Threshold levels are defined by the FERC as the reading that indicates a significant departure from the normal range of readings and prompts an action. The design basis value is defined by the FERC as the value that is used in the design analysis for the project. Design basis values were established for piezometers based on stability analysis conducted for the project. Design basis values were not established for flumes, joint meters, or surface monuments because there was no design analysis involving these instruments. Preliminary threshold levels were established for all instrumentation for the refill program based on expected values. Threshold levels were established based on expected values because historic data was not available for the new Upper Reservoir to establish a range of expected values. For piezometers, the threshold levels established corresponded to a drain efficiency of 60%. 3.1 Piezometers and Uplift Pressures All piezometer readings were below threshold and design basis values during the refill program. Threshold levels were set based on a drain efficiency of 60 percent, and piezometer readings during the refill program indicate that actual uplift pressures on the Dam were less than expected values. An analysis of the refill program piezometer data indicates the drain efficiency varied from 79 percent to 100 percent for the uplift pressures at the RCC/Rock interface.
Presented at HydroVision International, Charlotte, North Carolina, July 27 - 30, 2010
© Paul C. Rizzo Associates, Inc.

8
At each section where piezometers were installed at the RCC/Rock interface, diagrams were developed that compared the uplift distribution based on piezometer readings during the refill program with the uplift distribution assumed for the establishment of threshold levels. An example is shown below.
Figure 5: Example Uplift Diagram
FOUNDATION DRAINS
Presented at HydroVision International, Charlotte, North Carolina, July 27 - 30, 2010
© Paul C. Rizzo Associates, Inc.

9
To verify that the piezometers at the Upper Reservoir were functioning correctly, the piezometer readings and reservoir elevations were plotted vs. time. The plots show all piezometers responded to changes in reservoir elevation during the Upper Reservoir refill. This indicates that all piezometers were working correctly. A typical plot is shown below. As shown on the plot, each of the piezometers at Station 9+10 showed changes in response to changes in the reservoir elevation. PZ-4 and PZ-5, which are closer to the upstream heel of the dam, showed a stronger response to changes in reservoir elevation as expected.
Figure 6: Piezometer Readings and Reservoir Elevation vs. Time
3.2 Movements and Structural
3.2.1 Visual Inspections Visual inspections did not indicate any signs of structural distress during the refill program. No movement between monoliths was observed, and there was no cracking or any other sign of structural distress observed during the refill program inspections.
Presented at HydroVision International, Charlotte, North Carolina, July 27 - 30, 2010
© Paul C. Rizzo Associates, Inc.

10
3.2.2 Joint Meters All displacements between Monoliths measured by joint meters were less than the threshold levels established for the refill program. The maximum measured displacement was 0.09 in. or approximately 2.3 millimeters (mm) in the horizontal (joint opening/closing) direction, and -0.38 in. or 9.7 mm in the upstream/downstream (joint shear) direction. Joint meters did not show any trends that would indicate significant displacement occurred between monoliths during the refill program. 3.2.3 Survey System Survey data indicate the Dam performed as expected with respect to movements during the refill program. All measured displacements, both horizontal and vertical, were less than the Threshold levels developed for the refill program. A review of the survey data indicates no significant movement of the Dam occurred during the refill program, and there were no trends indicating movement in the horizontal or vertical direction. The maximum measured displacement was 0.29 in., or approximately 7.3 mm. This is within the accuracy that was estimated for the survey system. 3.3 Leakage and Seepage
3.3.1 Visual Inspections at Downstream Toe Visual inspections did not indicate any major seepage or leakage at the toe of the Dam during the refill program. Several wet spots were observed and one minor slough was noted a significant distance downstream from the toe. It is suspected that the wet spots and the associated minor slough were associated with a combination of sources including snow and ice melt, ponded water, and seepage through the floor of the Dam. The areas were monitored during each inspection during the refill program, and none was considered to be a dam safety issue. 3.3.2 Foundation Drain Flows
Leakage from foundation drains during the refill program was minimal and observed in approximately 15 of the 677 foundation drains installed during construction. The measured values for leakage from the foundation drains were below threshold levels established for the refill program. All drain flows were clear and no turbidity was observed. 3.3.3 Crest-to-Gallery Drain Flows Leakage from crest-to-gallery drains was highly variable during the refill program, with some Drains being completely dry and others leaking considerably, especially in
Presented at HydroVision International, Charlotte, North Carolina, July 27 - 30, 2010
© Paul C. Rizzo Associates, Inc.

11
Monolith Nos. 1, 2, and 4. Photographs of the gallery in Monoliths 6 and 7 and the gallery in Monolith 2 are included below.
Figure 7: Gallery in Monolith 6 and 7 During Refill Program
Figure 8: Gallery in Monolith 2 During Refill Program
Presented at HydroVision International, Charlotte, North Carolina, July 27 - 30, 2010
© Paul C. Rizzo Associates, Inc.

12
The major causes of the difference in the amount of leakage between monoliths are likely the difference in the design of the waterstops installed in these Monoliths and the presence of a horizontal cold joint in monoliths 1 and 2. A cold joint was present in Monoliths 1 and 2 where a lift joint was left exposed for approximately one year, and flows from the crest to gallery drains in Monoliths 1 and 2 were significantly higher than in other monoliths. The design of the vertical waterstops was changed early in the Project, and the revised design allowed for more stable and restrained placement of the associated crack inducer board. With the early waterstops, there was a tendency for the crack inducer plate to move laterally, away from the water stop bulb. With the re-design, the crack inducer plate was fixed more rigidly and unable to move. A photograph of the revised waterstop design is included below.
Figure 9: Revised Waterstop Design
Leakage was also observed at several Construction Joints during the refill program. The majority of Construction Joints where leakage was observed are located in Monolith 1and 2 where, as mentioned above, the older style of waterstop was used.
Crack Inducer Groove
Presented at HydroVision International, Charlotte, North Carolina, July 27 - 30, 2010
© Paul C. Rizzo Associates, Inc.

13
3.3.5 Flumes The flumes (5 pairs for a total of 10) in the drainage trench capture all of the flow from the foundation drains, crest-to-gallery drains, and construction joints. They provide a measure of the cumulative leakage from the Reservoir for all sources, except for losses through the floor of the Reservoir. The following plot shows the total leakage, which is the sum of all flows passing through the ten flumes, and the flow through each flume.
Figure 10: Flume Flow During Refill Program
The flume data show that the cumulative leakage peaked at about 1,080 gpm on March 18, 2010, when the Upper Reservoir level reached El. 1597 for the first time. More than 80 percent of the flow was passing through flume Nos. 1 and 2 in Monoliths 1 and 2. After the reservoir reached El. 1597 for the first time, the cumulative flow of all flumes and the individual flows from each flume decreased as the reservoir elevation was held constant. At the completion of the refill program, the Upper Reservoir was dropped to approximately El. 1500. This allowed sealing of horizontal joints and vertical joints in the upstream face of the Upper Reservoir. Over a period of several days, approximately 15,000 lineal feet of horizontal joints and 34 vertical joints were sealed. After sealing, the total leakage through the flumes with a full Upper Reservoir had decreased to approximately 300 gpm. A comparison of the flow through each flume prior to and after sealing of the upstream face of the Upper Reservoir is provided below. Each set of leakage readings in the plot below were taken when the Upper Reservoir was near full.
Presented at HydroVision International, Charlotte, North Carolina, July 27 - 30, 2010
© Paul C. Rizzo Associates, Inc.

14
Figure 11: Flume Flows Before and After Sealing
As shown above, the sealing significantly reduced leakage in FL-1A, FL-1B, FL-2A, and FL-2B in monoliths 1 and 2. The total leakage through the flumes continues to decrease with time, and at the time of writing, the total leakage at the Upper Reservoir had decreased to approximately 100 gpm with the reservoir full. The continuing decrease in leakage is likely due to healing and silting of horizontal and vertical joints.
4.0 Summary The performance of the Upper Reservoir during the refill program was monitored with dam safety instrumentation and inspections. The Reservoir was filled through a series of time steps and the performance was assessed at each step. The Dam performed as intended at each time step. Instrumentation readings were generally consistent with expected values and no dam safety issues were identified during the visual inspections. The Taum Sauk Upper Reservoir has been returned to operation successfully. A photo of the Upper Reservoir at the completion of the refill program is shown below.
Presented at HydroVision International, Charlotte, North Carolina, July 27 - 30, 2010
© Paul C. Rizzo Associates, Inc.

15
Presented at HydroVision International, Charlotte, North Carolina, July 27 - 30, 2010
© Paul C. Rizzo Associates, Inc.

![In the Appalacian Region August 2009 Lexington, KY · 12/14/2005 · – – Johnson Shut-ins State Park – ... FERC Website Information – [search Taum Sauk] –Executive Summary](https://static.fdocuments.net/doc/165x107/5fed79c0940d6c10ca42d51c/in-the-appalacian-region-august-2009-lexington-ky-12142005-a-a-johnson.jpg)