
Activation of Ground Granulated Blast Furnace Slag Cement ...

Lane 1
PERFORMANCE OF SLAG CEMENT IN VIRGINIA CONCRETES
D. Stephen Lane
Associate Principal Research Scientist
Phone: 434-293-1953
Email: [email protected]
Virginia Center for Transportation Innovation and Research
530 Edgemont Road
Charlottesville, VA 22903
434-293-1900
Word Count: 3246 + 6 tables + 3 figures = 5380
TRB 2012 Annual Meeting Paper revised from original submittal.

Lane 2
Abstract 1 The Virginia Department of Transportation began allowing the use of slag cement in 2
hydraulic cement concretes in 1985 and its use has steadily increased since that time. 3
Several years ago a study was conducted to investigate the performance of bridge decks 4
constructed with hydraulic cement concretes containing straight portland cement and 5
portland cement plus slag cement with a specified w/cm of 0.45. At the time of the field 6
work, these decks were 12-16 years old. In addition to general observations of deck 7
condition, cores were extracted from the decks for petrographic examination of internal 8
condition and determination of concrete transport properties using electrical conductivity, 9
and rate of water absorption. Overall, the slag cement concretes have performed well 10
with a tendency toward lower transport properties and showing no inherent tendency for 11
scaling. Some evidence of alkali-aggregate reactivity was observed with evident damage 12
in one case, although it is not clear whether an insufficient amount of slag cement was 13
used or this was a case where slag cement would simply be ineffective. Overall the 14
performance and experience with slag cement has been favorable. 15
16
TRB 2012 Annual Meeting Paper revised from original submittal.

Lane 3
INTRODUCTION AND BACKGROUND 1 Slag cement is produced by finely grinding granulated, iron blast-furnace slag. In the 2
past, this material was commonly referred to as ground, granulated blast-furnace slag, 3
GGBFS, or ground slag. It is a byproduct of the production of iron from iron ore that, 4
when properly processed, possesses hydraulic properties. When used with portland 5
cement as a constituent of the cementitious material in hydraulic cement concrete, it 6
provides reduced permeability, improved resistance to alkali-silica reaction and sulfate 7
attack and higher later age strength. (1-3) Early-age strength development and setting 8
times can be retarded in cold weather and when used as high proportions of the 9
cementitious material. 10
A major milestone in the use of slag cement in the United States was the 11
installation of production facilities at Sparrows Point, Maryland in the early 1980s. (2) In 12
1985 the Virginia Department of Transportation (VDOT) published a report (4) of a 13
laboratory investigation of the use of slag cement in concrete and included it as an 14
admixture for use in hydraulic cement concrete in its specifications. In 1991, in an effort 15
to avoid damage resulting from alkali-silica reaction, VDOT specifications for hydraulic 16
cement concretes were revised to require the use of a pozzolan or slag cement in concrete 17
when the alkali content of the portland cement exceeded 0.50% Na2O equivalent. (5) 18
This change was also viewed as a positive move to improve the resistance of concrete to 19
chloride ion penetration and resulting chloride-induced corrosion of imbedded steel. In 20
2003, VDOT initiated a study to evaluate the performance of bridge deck concretes 21
produced with a maximum w/c of 0.47 to more recent concretes with a maximum w/cm 22
of 0.45 produced with either straight portland cement or portland cement with either 23
pozzolans or slag cement with respect to key factors relevant to the durability of concrete. 24
This paper summarizes the findings that relate to concrete produced with a maximum 25
0.45 w/ccm and were produced with either straight portland cement or portland cement 26
with slag cement. 27
28
29
METHODOLOGY 30 31
As part of studies to investigate the relative performance of concretes used in bridge deck 32
construction, cores were collected in 2003 from a number of bridge decks across 33
Virginia. (6,7) Decks spanned two construction periods, 1968-1971 and 1984-34
1991reflecting two different concrete specifications. In the earlier period, the 35
cementitious material consisted only of portland cement with a maximum specified w/c 36
of 0.47. In the later period, cementitious materials included portland cement only, 37
portland cement with fly ash, and portland cement with slag cement a maximum specified 38
w/cm of 0.45. The decks were selected so that a roughly equal number of structures 39
representing the three groups (portland cement, 0.47 w/c; portland cement, 0.45 w/c; and 40
portland cement with fly ash or slag cement, 0.45 w/cm) came from each of six climatic 41
(physiographic) regions across Virginia. (6) 42
This paper summarizes the results obtained from the slag cement concretes and 43
portland cement concretes (maximum 0.45 w/c) obtained from the same VDOT districts. 44
This subset includes four of the nine VDOT districts, Hampton Roads, Lynchburg, 45
Northern Virginia, and Staunton. The decks in the slag cement group ranged in age from 46
TRB 2012 Annual Meeting Paper revised from original submittal.
Lane 4
12-16 years and the portland cement group, 13-19 years. At the time of construction, the 1
decision to use slag cement was at the discretion of the concrete producer. Records were 2
not available to indicate the percentage of slag cement used as a portion of the 3
cementitious material, but 30-40% was a common value at that time. Information on the 4
concretes is included in Table 1. 5
6
TABLE 1. Description of Samples 7
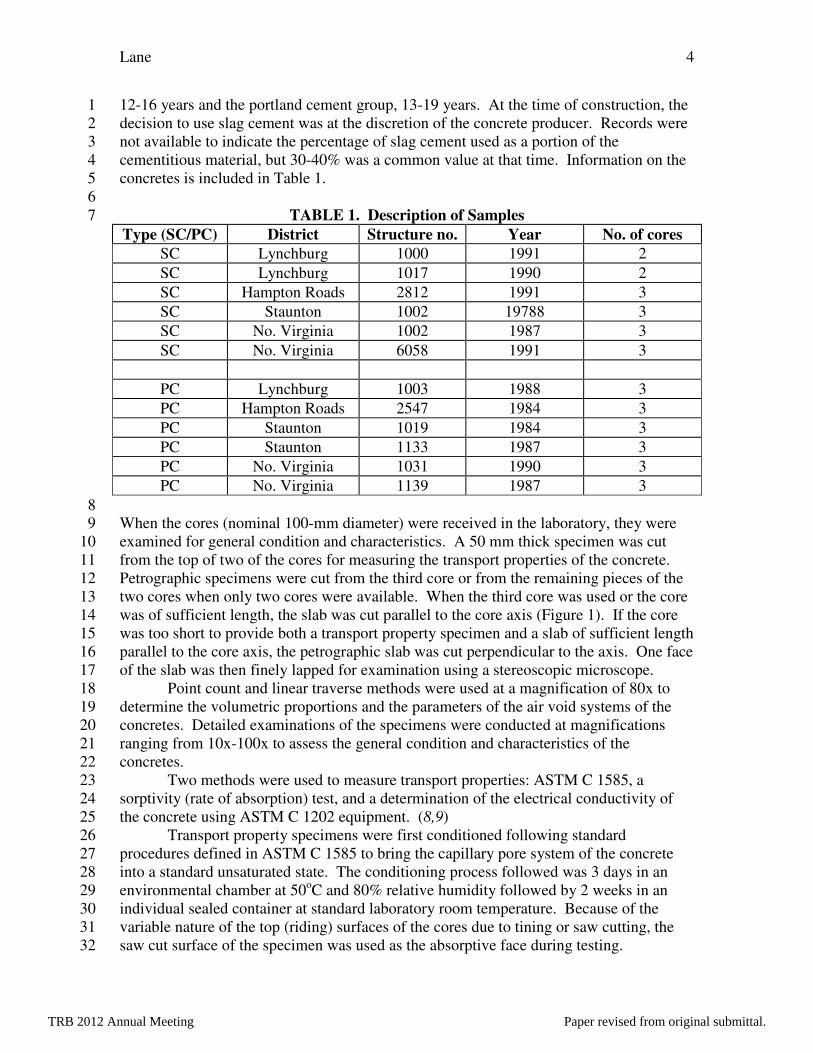
Type (SC/PC) District Structure no. Year No. of cores
SC Lynchburg 1000 1991 2
SC Lynchburg 1017 1990 2
SC Hampton Roads 2812 1991 3
SC Staunton 1002 19788 3
SC No. Virginia 1002 1987 3
SC No. Virginia 6058 1991 3
PC Lynchburg 1003 1988 3
PC Hampton Roads 2547 1984 3
PC Staunton 1019 1984 3
PC Staunton 1133 1987 3
PC No. Virginia 1031 1990 3
PC No. Virginia 1139 1987 3
8 When the cores (nominal 100-mm diameter) were received in the laboratory, they were 9
examined for general condition and characteristics. A 50 mm thick specimen was cut 10
from the top of two of the cores for measuring the transport properties of the concrete. 11
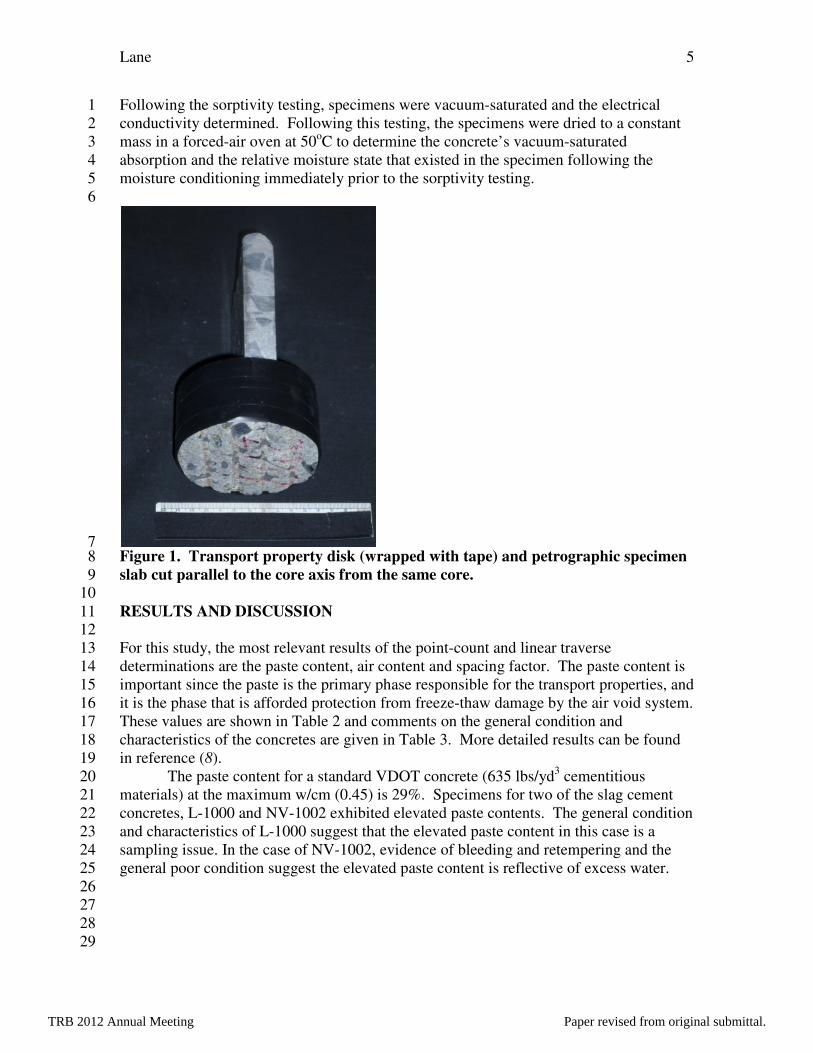
Petrographic specimens were cut from the third core or from the remaining pieces of the 12
two cores when only two cores were available. When the third core was used or the core 13
was of sufficient length, the slab was cut parallel to the core axis (Figure 1). If the core 14
was too short to provide both a transport property specimen and a slab of sufficient length 15
parallel to the core axis, the petrographic slab was cut perpendicular to the axis. One face 16
of the slab was then finely lapped for examination using a stereoscopic microscope. 17
Point count and linear traverse methods were used at a magnification of 80x to 18
determine the volumetric proportions and the parameters of the air void systems of the 19
concretes. Detailed examinations of the specimens were conducted at magnifications 20
ranging from 10x-100x to assess the general condition and characteristics of the 21
concretes. 22
Two methods were used to measure transport properties: ASTM C 1585, a 23
sorptivity (rate of absorption) test, and a determination of the electrical conductivity of 24
the concrete using ASTM C 1202 equipment. (8,9) 25
Transport property specimens were first conditioned following standard 26
procedures defined in ASTM C 1585 to bring the capillary pore system of the concrete 27
into a standard unsaturated state. The conditioning process followed was 3 days in an 28
environmental chamber at 50oC and 80% relative humidity followed by 2 weeks in an 29
individual sealed container at standard laboratory room temperature. Because of the 30
variable nature of the top (riding) surfaces of the cores due to tining or saw cutting, the 31
saw cut surface of the specimen was used as the absorptive face during testing. 32
TRB 2012 Annual Meeting Paper revised from original submittal.
Lane 5
Following the sorptivity testing, specimens were vacuum-saturated and the electrical 1
conductivity determined. Following this testing, the specimens were dried to a constant 2
mass in a forced-air oven at 50oC to determine the concrete’s vacuum-saturated 3
absorption and the relative moisture state that existed in the specimen following the 4
moisture conditioning immediately prior to the sorptivity testing. 5
6
7 Figure 1. Transport property disk (wrapped with tape) and petrographic specimen 8
slab cut parallel to the core axis from the same core. 9 10
RESULTS AND DISCUSSION 11 12
For this study, the most relevant results of the point-count and linear traverse 13
determinations are the paste content, air content and spacing factor. The paste content is 14
important since the paste is the primary phase responsible for the transport properties, and 15
it is the phase that is afforded protection from freeze-thaw damage by the air void system. 16
These values are shown in Table 2 and comments on the general condition and 17
characteristics of the concretes are given in Table 3. More detailed results can be found 18
in reference (8). 19
The paste content for a standard VDOT concrete (635 lbs/yd3 cementitious 20
materials) at the maximum w/cm (0.45) is 29%. Specimens for two of the slag cement 21
concretes, L-1000 and NV-1002 exhibited elevated paste contents. The general condition 22
and characteristics of L-1000 suggest that the elevated paste content in this case is a 23
sampling issue. In the case of NV-1002, evidence of bleeding and retempering and the 24
general poor condition suggest the elevated paste content is reflective of excess water. 25
26
27
28
29
TRB 2012 Annual Meeting Paper revised from original submittal.
Lane 6
TABLE 2. Paste content, air content and spacing factor of concretes 1 Structure Paste content % AC %, (P-C) AC % (LT) Spacing factor, mm
L-1000 (SC) 34.9 9.2 7.9 0.19
L-1017 (SC) 28.4 9.3 8.6 0.19
HR-2812 (SC) 29.6 6.5 6.9 0.19
S-1002 (SC) 29.9 8.1 9.7 0.20
NV-1002 (SC) 34.5 8.8 6.7 0.15
NV-6058 (SC) 27.9 11.2 9.8 0.11
L-1003 (PC) 32.8 6.9 7.0 0.19
HR-2547 (PC) 28.1 7.5 5.1 0.24
S-1019 (PC) 31.3 8.6 5.4 0.38
S-1133 (PC) 28.5 8.1 7.3 0.25
NV-1031 (PC) 29.2 8.8 7.3 0.15
NV-1130 (PC) 32.2 9.4 9.5 0.12
2
3
TABLE 3. General condition and petrographic characteristics 4 Structure Comments
L-1000 (SC) Overall good condition, some scaling
L-1017 (SC) Overall good condition, surface scaled, short paste cracks
HR-2812 (SC) Overall good condition, some scaling
S-1002 (SC) Overall poor condition, evidence of retempering, fair-poor paste aggregate bond,
cracks throughout associated with dolomitic coarse aggregate, frequent paste and
aggregate cracks
NV-1002 (SC) Overall poor condition, evidence of bleeding and retempering, poor consolidation,
plastic cracks, and surface cracks
NV-6058 (SC) Overall poor condition, evidence of retempering, poor paste-aggregate bond, fine
map cracking on surface, spotty evidence of ASR with chert particles
L-1003 (PC) Overall fair condition, evidence of retempering, ASR product, voids filled or lined,
occasional aggregate cracks
HR-2547 (PC) Overall good condition, plastic settlement cracks at 60 and 95 mm
S-1019 (PC) Overall fair condition, voids filled/lined with ettringite
S-1133 (PC) Overall poor condition, surface scaled w/ cracks to 50mm, ASR product associated
with dolomite and chert, frequent paste and aggregate cracks
NV-1031 (PC) Overall fair condition, evidence of retempering, poor paste-aggregate bond, surface
cracking and some scaling, coalescing air voids
NV-1130 (PC) Overall fair condition, surface scaled, occasional paste and aggregate cracks,
evidence of ASR product around chert`
5
6
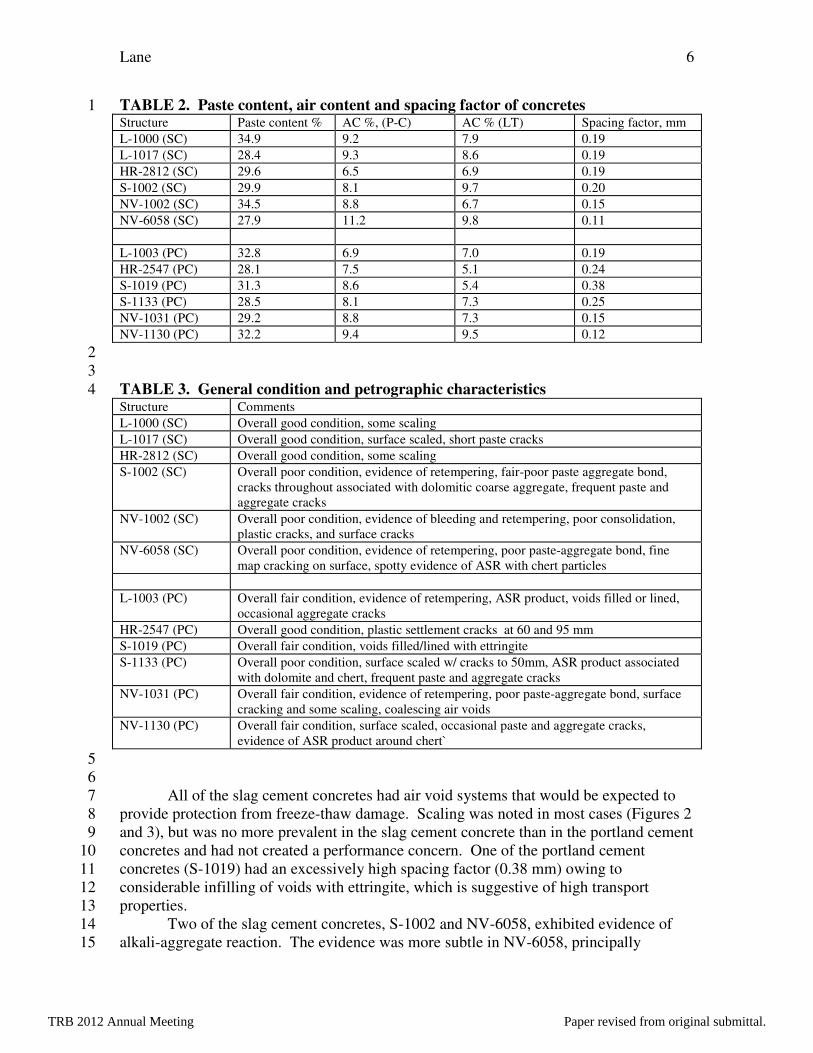
All of the slag cement concretes had air void systems that would be expected to 7
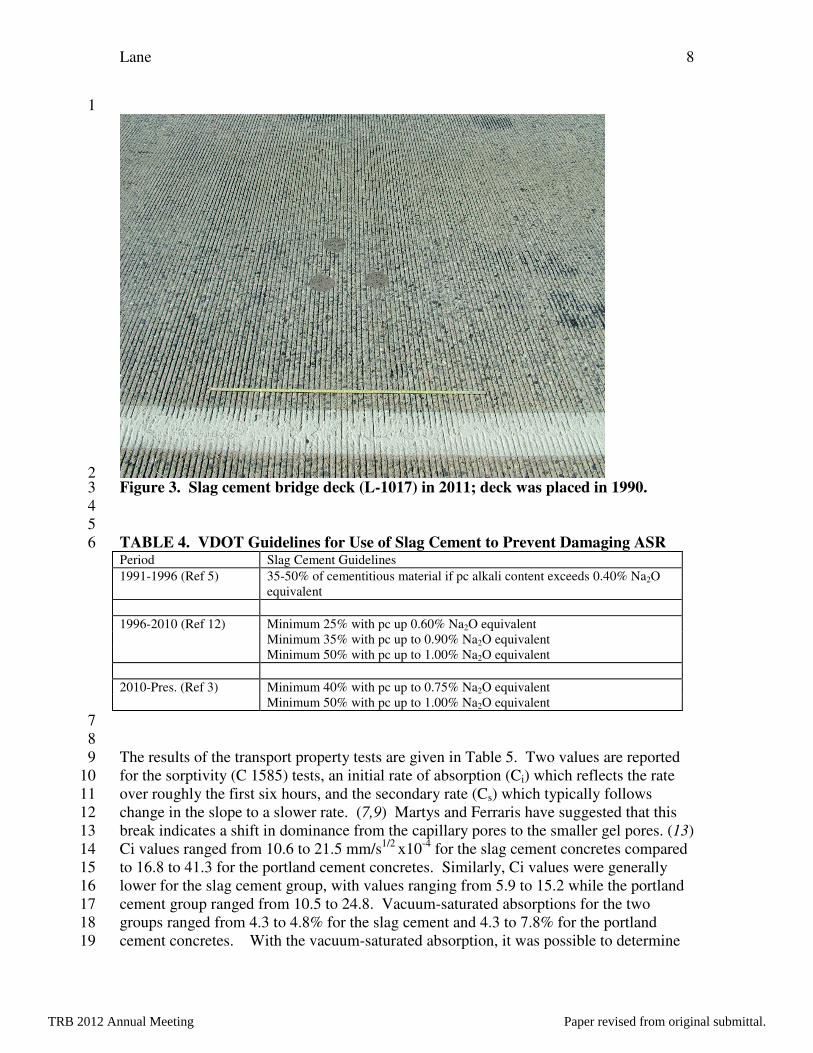
provide protection from freeze-thaw damage. Scaling was noted in most cases (Figures 2 8
and 3), but was no more prevalent in the slag cement concrete than in the portland cement 9
concretes and had not created a performance concern. One of the portland cement 10
concretes (S-1019) had an excessively high spacing factor (0.38 mm) owing to 11
considerable infilling of voids with ettringite, which is suggestive of high transport 12
properties. 13
Two of the slag cement concretes, S-1002 and NV-6058, exhibited evidence of 14
alkali-aggregate reaction. The evidence was more subtle in NV-6058, principally 15
TRB 2012 Annual Meeting Paper revised from original submittal.
Lane 7
sweating of ASR gel from sand-sized chert particles into the surrounding paste. The 1
damage was more extensive in S-1002, involving dolomite coarse aggregate particles. 2
Considerable ASR-related damage was also noted in S-1133, which contained a similar 3
dolomitic coarse aggregate and sand-sized chert. Slag cement is known to be effective in 4
preventing ASR-related damage (1-3) and was used in 1987 to prevent damaging ASR in 5
a section of pavement on I-64 in Virginia with an aggregate that had previously reacted 6
with a low-alkali cement. (5,10) The slag cement composed 20% of the cementitious 7
material with low-alkali cement from the same source used in the damage section and no 8
recurrence of ASR damage was noted through 15 years service. 9
Prevention of ASR-related damage is one of the reasons VDOT specifies the use 10
of slag cement pozzolan in concrete. Minimum percentages of slag cement as a portion 11
of the cementitious material is governed by the alkali content of the portland cement with 12
which it is used. The general guidelines have evolved through the years based on 13
research (3,5,11) and are given in Table 4. The most recent guidance is focused on 14
limiting the transport properties of concrete, which requires higher proportions of slag 15
cement than would be needed to prevent ASR damage with lower alkali content portland 16
cements. 17
An issue that needs further attention is the use of slag cement with alkali-18
carbonate rocks. It has been reported that slag cement is ineffective in preventing 19
damage with ACR rocks. (12) However, more recent work is suggesting that ACR is 20
simply a variant of ASR which begs the question: why then wouldn’t slag cement work? 21
22
23
24
25 Figure 2. Structure L-1017, slag cement concrete on US 501 NB in Campbell Co. 26
27
TRB 2012 Annual Meeting Paper revised from original submittal.
Lane 8
1
2 Figure 3. Slag cement bridge deck (L-1017) in 2011; deck was placed in 1990. 3
4
5
TABLE 4. VDOT Guidelines for Use of Slag Cement to Prevent Damaging ASR 6 Period Slag Cement Guidelines
1991-1996 (Ref 5) 35-50% of cementitious material if pc alkali content exceeds 0.40% Na2O
equivalent
1996-2010 (Ref 12) Minimum 25% with pc up 0.60% Na2O equivalent
Minimum 35% with pc up to 0.90% Na2O equivalent
Minimum 50% with pc up to 1.00% Na2O equivalent
2010-Pres. (Ref 3) Minimum 40% with pc up to 0.75% Na2O equivalent
Minimum 50% with pc up to 1.00% Na2O equivalent
7
8
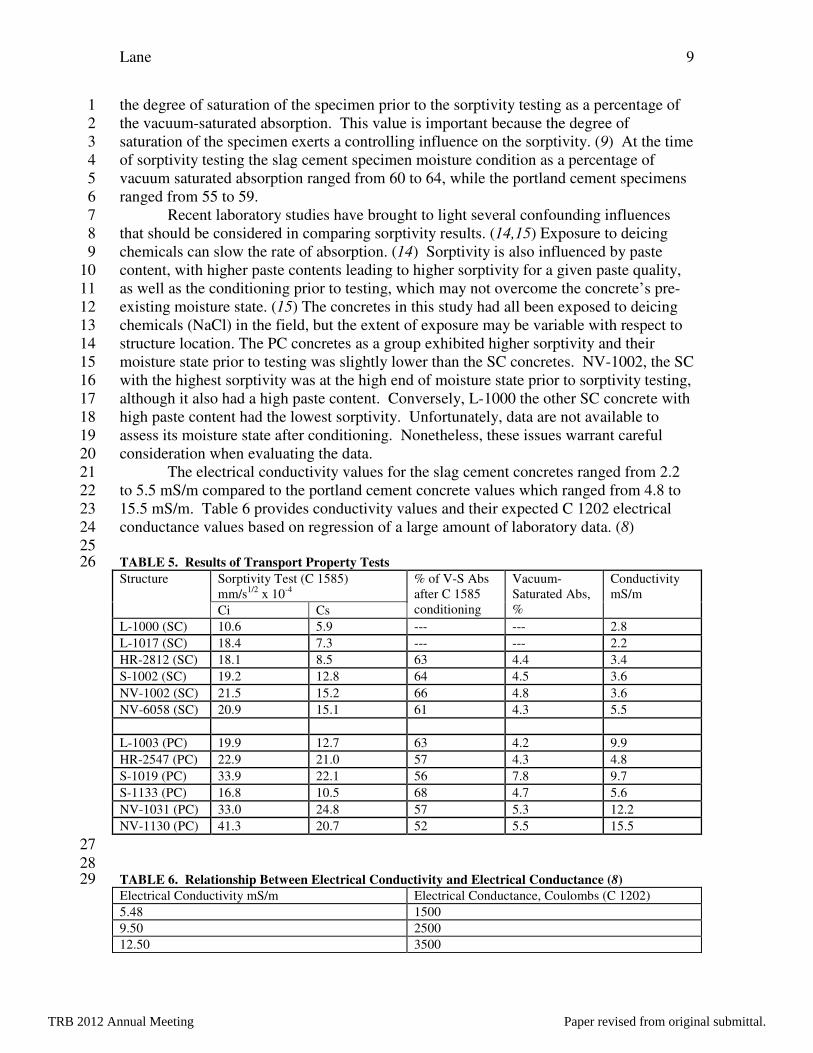
The results of the transport property tests are given in Table 5. Two values are reported 9
for the sorptivity (C 1585) tests, an initial rate of absorption (Ci) which reflects the rate 10
over roughly the first six hours, and the secondary rate (Cs) which typically follows 11
change in the slope to a slower rate. (7,9) Martys and Ferraris have suggested that this 12
break indicates a shift in dominance from the capillary pores to the smaller gel pores. (13) 13
Ci values ranged from 10.6 to 21.5 mm/s1/2
x10-4
for the slag cement concretes compared 14
to 16.8 to 41.3 for the portland cement concretes. Similarly, Ci values were generally 15
lower for the slag cement group, with values ranging from 5.9 to 15.2 while the portland 16
cement group ranged from 10.5 to 24.8. Vacuum-saturated absorptions for the two 17
groups ranged from 4.3 to 4.8% for the slag cement and 4.3 to 7.8% for the portland 18
cement concretes. With the vacuum-saturated absorption, it was possible to determine 19
TRB 2012 Annual Meeting Paper revised from original submittal.
Lane 9
the degree of saturation of the specimen prior to the sorptivity testing as a percentage of 1
the vacuum-saturated absorption. This value is important because the degree of 2
saturation of the specimen exerts a controlling influence on the sorptivity. (9) At the time 3
of sorptivity testing the slag cement specimen moisture condition as a percentage of 4
vacuum saturated absorption ranged from 60 to 64, while the portland cement specimens 5
ranged from 55 to 59. 6
Recent laboratory studies have brought to light several confounding influences 7
that should be considered in comparing sorptivity results. (14,15) Exposure to deicing 8
chemicals can slow the rate of absorption. (14) Sorptivity is also influenced by paste 9
content, with higher paste contents leading to higher sorptivity for a given paste quality, 10
as well as the conditioning prior to testing, which may not overcome the concrete’s pre-11
existing moisture state. (15) The concretes in this study had all been exposed to deicing 12
chemicals (NaCl) in the field, but the extent of exposure may be variable with respect to 13
structure location. The PC concretes as a group exhibited higher sorptivity and their 14
moisture state prior to testing was slightly lower than the SC concretes. NV-1002, the SC 15
with the highest sorptivity was at the high end of moisture state prior to sorptivity testing, 16
although it also had a high paste content. Conversely, L-1000 the other SC concrete with 17
high paste content had the lowest sorptivity. Unfortunately, data are not available to 18
assess its moisture state after conditioning. Nonetheless, these issues warrant careful 19
consideration when evaluating the data. 20
The electrical conductivity values for the slag cement concretes ranged from 2.2 21
to 5.5 mS/m compared to the portland cement concrete values which ranged from 4.8 to 22
15.5 mS/m. Table 6 provides conductivity values and their expected C 1202 electrical 23
conductance values based on regression of a large amount of laboratory data. (8) 24
25 TABLE 5. Results of Transport Property Tests 26 Structure Sorptivity Test (C 1585)
mm/s1/2
x 10-4
% of V-S Abs
after C 1585
conditioning
Vacuum-
Saturated Abs,
%
Conductivity
mS/m
Ci
Cs
L-1000 (SC) 10.6 5.9 --- --- 2.8
L-1017 (SC) 18.4 7.3 --- --- 2.2
HR-2812 (SC) 18.1 8.5 63 4.4 3.4
S-1002 (SC) 19.2 12.8 64 4.5 3.6
NV-1002 (SC) 21.5 15.2 66 4.8 3.6
NV-6058 (SC) 20.9 15.1 61 4.3 5.5
L-1003 (PC) 19.9 12.7 63 4.2 9.9
HR-2547 (PC) 22.9 21.0 57 4.3 4.8
S-1019 (PC) 33.9 22.1 56 7.8 9.7
S-1133 (PC) 16.8 10.5 68 4.7 5.6
NV-1031 (PC) 33.0 24.8 57 5.3 12.2
NV-1130 (PC) 41.3 20.7 52 5.5 15.5
27
28 TABLE 6. Relationship Between Electrical Conductivity and Electrical Conductance (8) 29 Electrical Conductivity mS/m Electrical Conductance, Coulombs (C 1202)
5.48 1500
9.50 2500
12.50 3500
TRB 2012 Annual Meeting Paper revised from original submittal.
Lane 10
CONCLUSIONS 1 This study reports the findings on an evaluation of the performance of slag cement 2
concretes in bridge decks after 12-16 years service. The evaluations included 3
petrographic examinations for general condition and the determination of sorptivity and 4
electrical conductivity. As a group, the SC concretes had lower electrical conductivity 5
and lower sorptivity than a companion group of PC concretes, although the sorptivity 6
values may be somewhat skewed by differences in moisture state prior to testing. The 7
moisture condition of the test specimen has an important impact in transport property test 8
results and should be carefully evaluated when performing comparative field studies. 9
Three of the six SC concretes were judged to be in good overall condition based on 10
petrographic examination. The other three were rated poor. In each of these cases, 11
retempering and excess water appeared to play a role. In one case there was extensive 12
damage associated with a dolomitic coarse aggregate which may reflect an inability of 13
SC to control ACR or an insufficient amount of SC to control ASR. Scaling appeared to 14
be no greater an issue with SC than with the PC concretes. Overall VDOT’s experience 15
with SC has been quite favorable. Exceptions to this emphasize the need to exercise 16
good quality control practices in concrete production and construction. 17 18 19
REFERENCES 20 21
1. American Concrete Institute. Slag Cement in Concrete and Mortar. ACI233-R-22
03. 2003. 23
24
2. Hogan, F.J, and Meusal, J. W. Evaluation for Durability and Strength 25
Development of a Ground Granulated Blast Furnace Slag. Cement, Concrete, and 26
Aggregates. Vol. 3, No. 1, 1981, pp. 40-52. 27
28
3. Lane, D.S., and Ozyildirim, H.C. Combinations of Pozzolans and Ground, 29
Granulated Blast-Furnace Slag for Durable Hydraulic Cement Concrete. VCTIR 30
00-R1. Virginia Center for Transportation Innovation and Research, 1999. 31
32
4. Ozyildirim, H.C., and Walker, H.N. Evaluation of Hydraulic Cement Concretes 33
Containing Slag added at the Mixer. VCTIR 86-R1. Virginia Center for 34
Transportation Innovation and Research, 1985. 35
36
5. Lane, D.S. Alkali-Silica Reactivity in Virginia. VCTIR 94-R17. Virginia Center 37
for Transportation Innovation and Research, 1994. 38
39
6. Williamson, G., Weyers, R.E., Brown, M.C., and Sprinkel, M.M. Bridge Deck 40
Service Prediction and Cost. VCTIR 08-CR4. Virginia Center for Transportation 41
Innovation and Research, 2007. 42
43
7. Lane, D.S. An Evaluation of the Performance of Concretes Containing Fly Ash 44
and Ground Slag in Bridge Decks. VCTIR 07-R7. Virginia Center for 45
Transportation Innovation and Research, 2006. 46
47
TRB 2012 Annual Meeting Paper revised from original submittal.

Lane 11
8. Lane, D.S. Supplanting the Rapid Chloride Permeability Test with a Quick 1
Measurement of Concrete Conductivity. VCTIR 05-R22. Virginia Center for 2
Transportation Innovation and Research, 2005. 3
4
9. Lane, D.S. Laboratory Comparison of Several Tests for Evaluating the Transport 5
Properties of Concrete. VCTIR 06-R38. Virginia Center for Transportation 6
Innovation and Research, 2006. 7
8
10. Lane, S. Research Pays Off: Alkali-Silica Reaction, Preventing Damage in 9
Hydraulic Cement Concrete, TR News, Nov-Dec, No. 217, 2001, pp. 29-30. 10
11
11. Lane, D.S., and Ozyildirim, HJ.C. Use of Fly Ash, Slag or Silica Fume to inhibit 12
Alkali-Silica Reactivity. VCTIR 05-R21. Virginia Center for Transportation 13
Innovation and Research, 1995. 14
15
12. Rogers, C.A. and Hooton, R.D. Comparison Between Laboratory and Field 16
Experience of Alkali-Carbonate Reactive Concrete. Proceedings of the Ninth 17
International Symposium on Alkali-Aggregate Reactions. The concrete Society, 18
Slough, UK, 1992, pp. 877-884. 19
20
13. Martys, N.S., and Ferraris, C.F. Capillary Transport in Mortars and Concrete. 21
Cement and Concrete Research. Vol. 27, No. 5, 1997, pp. 747-760. 22
23
14. Spragg, R.P., Castro, J., Li, W., Pour-Ghaz, M., Huang, P-T., and Weiss, J. 24
Wetting and Drying of Concrete Using Aqueous Solutions Containing Deicing 25
Salts. Cement and Concrete Composites. In Press. 26
27
15. Castro, J., Bentz, D., and Weiss, J. Effect of Sample Conditioning on the Water 28
Absorption of Concrete. Cement and Concrete Composites. Submitted for 29
publication. 30
TRB 2012 Annual Meeting Paper revised from original submittal.


