
Performance of Optical Spatial Modulation and Spatial...
18
Performance of Optical Spatial Modulation and Spatial Multiplexing with Imaging Receiver P.M. Butala, H. Elgala, T.D.C. Little Department of Electrical and Computer Engineering Boston University, Boston, Massachusetts {pbutala,helgala,tdcl}@bu.edu January 3, 2014 MCL Technical Report No. 01-03-2014 Abstract–Spatial modulation (SM) and spatial multiplexing (SMP) are two multiple-input multiple-output (MIMO) techniques for transmitting data over an indoor optical wireless channel. Receivers for SM and SMP can be of the non-imaging type, in which case the channel matrix coefficients can be highly correlated, or of the imaging type, which can reduce the degree of correlation and improve overall system performance. In this work, we propose a new framework to analyze the performance of imaging MIMO systems. This framework is applied to characterize the performance of SM and SMP under both imaging and non-imaging receivers. Results of our analysis indicate that imaging receivers can provide significant signal-to-noise ratio (SNR) improvements up to 45dB under SM and SMP as compared to the use of non-imaging receivers. Finally, the application of the proposed analysis framework indicates specific design principles to optimize imaging receiver parameters. In IEEE Wireless Communications and Networking Conference, Istanbul, Turkey, April 2014. This work was supported primarily by the Engineering Research Centers Program of the National Science Foundation under NSF Cooperative Agreement No. EEC-0812056. 1
Transcript of Performance of Optical Spatial Modulation and Spatial...

Performance of Optical Spatial Modulation and SpatialMultiplexing with Imaging Receiver
P.M. Butala, H. Elgala, T.D.C. LittleDepartment of Electrical and Computer Engineering
Boston University, Boston, Massachusettspbutala,helgala,[email protected]
January 3, 2014
MCL Technical Report No. 01-03-2014
Abstract–Spatial modulation (SM) and spatial multiplexing (SMP) are two multiple-inputmultiple-output (MIMO) techniques for transmitting data over an indoor optical wirelesschannel. Receivers for SM and SMP can be of the non-imaging type, in which case thechannel matrix coefficients can be highly correlated, or of the imaging type, which can reducethe degree of correlation and improve overall system performance. In this work, we proposea new framework to analyze the performance of imaging MIMO systems. This framework isapplied to characterize the performance of SM and SMP under both imaging and non-imagingreceivers. Results of our analysis indicate that imaging receivers can provide significantsignal-to-noise ratio (SNR) improvements up to 45dB under SM and SMP as compared tothe use of non-imaging receivers. Finally, the application of the proposed analysis frameworkindicates specific design principles to optimize imaging receiver parameters.
In IEEE Wireless Communications and Networking Conference, Istanbul, Turkey, April 2014.This work was supported primarily by the Engineering Research Centers Program of the National ScienceFoundation under NSF Cooperative Agreement No. EEC-0812056.
1

1 Introduction
The rapid adoption of mobile computing devices with rich media capability is driving anapparently insatiable demand for wireless data capacity. Technological innovations in radiofrequency (RF) communications have increased the capacity and utilization of availablespectrum; however, various realities limit the capacity growth to match this demand. Opticalwireless communications (OWC) with potential terahertz bandwidths have the potentialto significantly increase available wireless capacity assuming that we overcome numerousimplementation challenges.
We are particulary interested in visible light communications (VLC); a form of OWC thatcan exploit lighting devices (luminaires) as an opportunistic platform for indoor deployment.VLC in lighting is best achieved through the use of light-emitting diodes (LEDs) that areboth energy-efficient, and are fast for the purpose of supporting intensity modulation (IM).This research area has foundations in OWC work outside of the visible spectrum, i.e. Infrared(IR) [1,2]. However, the alignment of demands for energy efficiency, the ubiquity of lightingas a deployment platform, and the spectrum crunch is creating new impetus for leveragingOWC for new capacity.
The technical challenges to enable OWC to realize its potential include (1) the limitedmodulation capabilities of lighting-grade LEDs, (2) the directional nature of light, whichcan be both a challenge and an opportunity, and (3) dealing with the complexity of anoptical receiver, especially when it is mobile and must reconcile directional communications.The use of multiple channels to scale capacity using MIMO communications can addresschallenge (1). Challenge (2) is used as an opportunity to deliver desired properties at areceiver. Finally, at a macro level, challenge (3) is manageable through hybrid techniquesdescribed elsewhere; we isolate our operating environment to be in the context of indoorspaces – “smart rooms” – in which we can define limits of mobility and luminaire placementto achieve coverage and capacity goals.
MIMO techniques are considered to improve the capacity and throughput of the indoorOWC channel by distributing the signal power over multiple simultaneous links [3]. Repeti-tion coding (RC), SMP and SM are three space-time techniques considered for MIMO OWC.In RC, each luminaire simultaneously transmits the same signal. For an M-ary modulation,RC offers spectral efficiency of log2(M) bits/s/Hz. In SM, the information is encoded spa-tially along luminaire index and along M-ary modulation over the indexed luminaire [4]. ForNtx luminaires and M-ary modulation, SM offers spectral efficiency of log2(MNtx) bits/s/Hz.In SMP, information is jointly encoded using all luminaires. For Ntx luminaires and M-arymodulation, SMP offers spectral efficiency of log2(M
Ntx) bits/s/Hz.A non-imaging receiver (NImR) can be modeled as a grid of photodiodes, each mounted
with an optical concentrator and a filter. For an OWC channel deploying a NImR, thechannel matrix coefficients are highly correlated causing the system performance to degradesignificantly [5]. Performance of SM and SMP techniques using NImR has been studiedrecently and reported in reference [6]. In this prior work, the receiver elements are placed ata relatively wide distance – 10cm which would make this approach less practical for a smalldevice such as a mobile phone. In contrast, we seek to achieve inter-element spacing on achip scale using imaging receivers.
An imaging receiver (ImR) can be modeled as a grid of photodiodes sharing an imaging
2

lens and a filter. ImR has the potential to improve the system performance and increasethe coverage areas while being incorporated in a handheld device. Imaging diversity re-ceivers have been shown to markedly improve the performance of IR wireless communicationsystems [7] and indoor MIMO OWC systems [8]. In this paper, we propose an analysisframework including normalization steps that enables performance evaluation of SM andSMP approaches under ImR and NImR scenarios. We then study the effect of differentsystem configurations and signal power tradeoff on the achievable BER performance usingsimulations.
The remainder of the paper is organized as follows. Section II presents a brief introductionon the SM and SMP systems. Section III introduces the normalization parameters for thegeneralized imaging system. Performance analysis results are presented in Section IV. SectionV concludes the paper.
3
2 Imaging SM and SMP System
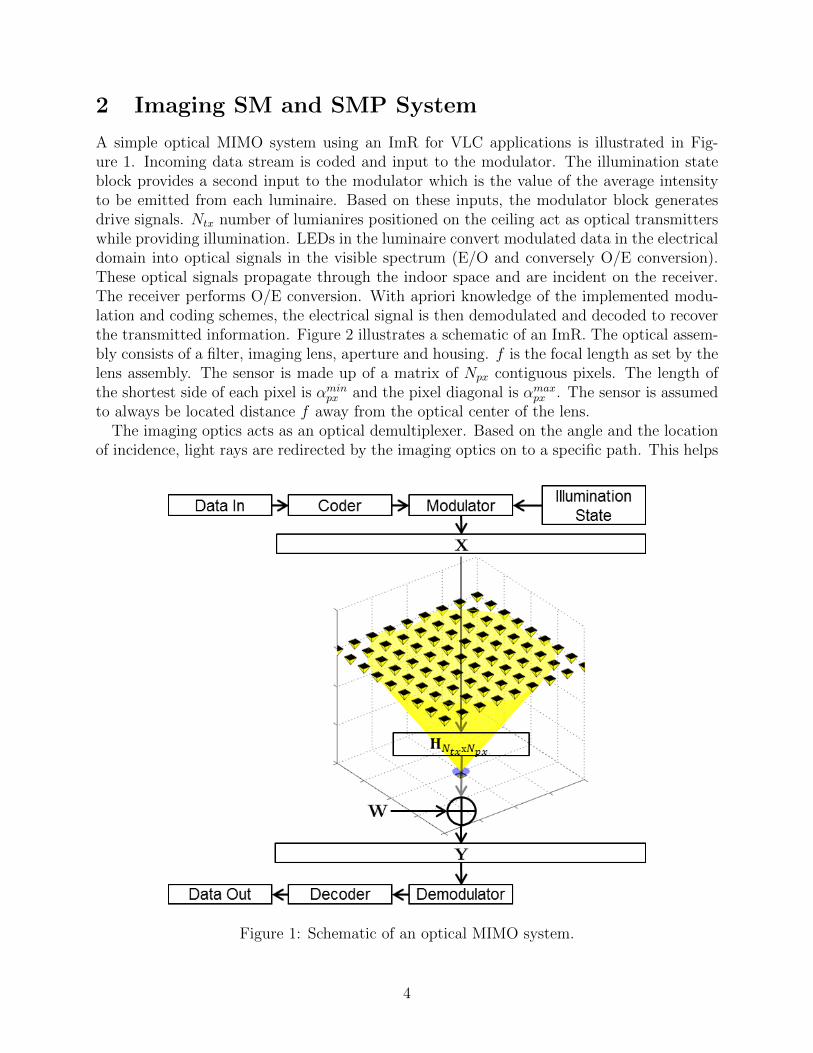
A simple optical MIMO system using an ImR for VLC applications is illustrated in Fig-ure 1. Incoming data stream is coded and input to the modulator. The illumination stateblock provides a second input to the modulator which is the value of the average intensityto be emitted from each luminaire. Based on these inputs, the modulator block generatesdrive signals. Ntx number of lumianires positioned on the ceiling act as optical transmitterswhile providing illumination. LEDs in the luminaire convert modulated data in the electricaldomain into optical signals in the visible spectrum (E/O and conversely O/E conversion).These optical signals propagate through the indoor space and are incident on the receiver.The receiver performs O/E conversion. With apriori knowledge of the implemented modu-lation and coding schemes, the electrical signal is then demodulated and decoded to recoverthe transmitted information. Figure 2 illustrates a schematic of an ImR. The optical assem-bly consists of a filter, imaging lens, aperture and housing. f is the focal length as set by thelens assembly. The sensor is made up of a matrix of Npx contiguous pixels. The length ofthe shortest side of each pixel is αmin
px and the pixel diagonal is αmaxpx . The sensor is assumed
to always be located distance f away from the optical center of the lens.The imaging optics acts as an optical demultiplexer. Based on the angle and the location
of incidence, light rays are redirected by the imaging optics on to a specific path. This helps
Figure 1: Schematic of an optical MIMO system.
4

Figure 2: Schematic of an imaging receiver.
to decorrelate the channel matrix coefficients. Similarly, the ambient radiant flux incidentat the aperture of the receiver is distributed among all pixels of the sensor. This helps tosignificantly reduce shot noise per pixel [9]. The channel can then be modeled as
Y = HX + W (1)
where X is the intensity modulated input signal vector of length Ntx. The channel matrixH takes into account the path-loss, transmission of the optics and the responsivity of thesensor pixels. It can be computed as in reference [8]. Y is the Npx length output currentvector. W ∼ N (0, σ2INpx) is the additive white Gaussian noise (AWGN) vector.
SM encodes k = log2(Ntx) bits in the transmitter index in addition to m = log2(M) bitsusing M-ary modulation. Thus SM achieves spectral efficiency of r = k + m = log2(MNtx)bits/s/Hz. The incoming data stream is divided into r bits long symbols. First m bits ofeach symbol are mapped to one of the M-ary constellation points while the last k bits ofeach symbol select the luminaire that transmits the selected constellation point. SM imple-mentation is illustrated in Figure 3a for Ntx = 4 transmitters and 4-PAM (pulse amplitude
(a) (b)
Figure 3: Illustration of (a) SM operation with Ntx = 4 and M = 4. (b) SMP operationwith Ntx = 4 and M = 2.
5

modulation). M-PAM intensity levels for SM are selected as in (2) where Iavg is the averagesignal constraint to maintain desired illumination. Given a bit sequence forming a symbol[1 1 1 0], PAM level 3 (ISM4 ) is sent on transmitter index 2.
ISMx =2IavgM + 1
x;x = 1 . . .M (2)
On the other hand, SMP uses all luminaires to jointly transmit information. If each of theNtx luminaires can transmit M-ary modulation such that they jointly generate MNtx uniquesymbols, spectral efficiency of SMP is given by r = Ntxlog2(M) bits/s/Hz. Each r bit longsection of the incoming data stream is then mapped to one of the MNtx unique symbols.SMP for a setup with Ntx = 4 transmitters and 2-PAM is illustrated in Figure 3b. M-PAMintensity levels for SMP are selected as in (3) where Iavg is the average signal constraint tomaintain desired illumination. A bit sequence forming a symbol [1 1 1 0] is jointly mappedto the 15th out of Ntxlog2(M) = 16 possible unique symbols.
ISMPx =
2IavgM − 1
x;x = 0 . . .M − 1 (3)
For a channel with equally likely symbols, a maximum likelihood detector is the optimaldetector. If noise is AWGN, this reduces to nearest neighbor detection. Having observed Yand knowing H, estimated symbol X is the symbol closest to observation Y in Euclideanspace. The signal detection can be written as
X = argmaxXi
pY|X(Y|Xi,H)
= argminXi
||Y −HXi||F(4)
where Xi are the different symbols and ||.||F is the Frobenius norm.
6

3 Analysis Framework
In this section, we develop a normalization framework to analyze performance of SM andSMP with ImR over a range of system configurations. The transmitters are assumed tobe arranged on a regular grid, facing down, with pitch Ptx. Each transmitter has sidelength αmin
tx and diagonal αmaxtx . The ImR surface is assumed parallel to the transmitter
plane. A receiver at a distance d from the transmitter plane sees a magnification Mim =f/(d− f). The system performance is dependent on how the spots land on the pixel array.Different system configurations can generate similar spot profile on the sensor and thus givingsimilar performance. To analyze the system performance independent of a specific systemconfiguration, the following normalization parameters are defined.
3.1 Normalized Luminaire Side Length
The normalized luminaire side length αs is defined as the ratio of the diagonal of a spot tothe side length of a pixel.
αs ≡Mimα
maxtx
αminpx
(5)
αs specifies the spot size relative to the sensor dimensions. For example, consider twosimilar systems which differ in only the luminaire diagonal and the pixel side length. If bothparameters differ in scale by the same factor, αs would remain the same for both systems.αs ≤ 1 implies that the spot size is at most as large as the size of a pixel. If the centroid ofthe spot is aligned with the centroid of a pixel, the spot will lie completely inside the pixel.
3.2 Normalized Luminaire Pitch
The normalized luminaire pitch δs is defined as the ratio of the spot pitch to the length ofthe pixel diagonal.
δs ≡MimPtx
αmaxpx
(6)
δs specifies the distance between the centroids of adjacent spots relative to the sensor di-mensions. For example, consider two similar systems which differ in only the transmitterpitch and pixel diagonal. If both parameters differ in scale by the same factor, δs wouldremain the same. δs > 1 ensures that centroids of adjacent spots lie on different pixels.In the limit, if both transmitters were point sources, condition δs > 1 would ensure thatdifferent pixels receive signals from neighboring transmitters, thus eliminating inter-carrierinterference (ICI).
3.3 Normalized Luminaire Edge-Edge Distance
The normalized luminaire edge-edge distance ηs is defined as the ratio of minimum distancebetween the edges of adjacent spots to the length of the pixel diagonal.
ηs ≡Mim(Ptx − αmax
tx )
αmaxpx
(7)
7

ηs specifies the minimum possible distance between the edges of adjacent spots relative tothe sensor dimensions. For example, now consider two similar systems which differ in onlythe minimum possible distance between the edges of adjacent luminaires and pixel diagonal.If both parameters scaled by the same factor, ηs would remain the same. ηs > 1 ensuresthat adjacent spots do not overlap on any pixel. ηs can be expressed in terms of αs and δsas in (8b) where l is conversion factor as in (8a). For square pixels, l = 1/
√2.
l =αminpx
αmaxpx
(8a)
ηs = δs − lαs (8b)
3.4 Normalized Magnification
Let M0 be the magnification of the system when αs = 1. Normalized magnification µs isdefined as the ratio of the magnification of the system to M0.
M0 ≡αminpx
αmaxtx
(9a)
µs ≡Mim
M0
(9b)
Consider two similar systems that differ in distance between the luminaire plane and thereceiver and also in the receiver focal lengths. µs for both systems is the same value whenboth parameters differ in scale by the same factor.
In an indoor VLC system, luminaires need to maintain an average emitted radiant fluxover different overlapping time windows so that the perceived illumination remains constant.Thus a fair performance comparison between different modulation schemes can be made whenthey emit the same radiant flux. Thus the SNR is defined as in reference [6],
SNR =(hP tx
avg)2
σ2(10)
where P txavg is the average radiant flux emitted by a transmitter, h is the O/E conversion
factor (AW−1Ω−2) and σ2 is the noise power. Without loss of generality, h = 1 is assumed.
8

4 Results
The effects of varying transmitter array and ImR configurations on the BER performanceof SM and SMP systems are studied using simulations. An array of 4 transmitters thatare arranged on a regular grid with pitch Ptx is considered. Using PAM, and to achieve 4bits/sym, SM with Nt = 4 and M = 4 and SMP with Nt = 4 and M = 2 are implemented.To achieve 8 bits/sym, SM with Nt = 4 and M = 64 and SMP with Nt = 4 and M =4 are implemented. The distance d between the transmitter and receiver planes is 2m.Lambertian luminaires of order m = 1 are assumed to have a spectral power distributionthat is approximated by a sum of gaussians as in [10]. The responsivity of each pixel isequal to 0.4A/W . Within this context, it is assumed that the pixels array is large enough toensure that each of the four spots fall on the sensor for each of the different configurationsconsidered below.
Using the parameters specified above, the channel gains are of the order of 10−7 for allsimulations. Thus the transmitted signal power is about 140dB higher than the receivedsignal power. Typically, the SNR is defined as the ratio of received signal power to noisepower. However, given SNR as defined in (10), there is an offset of at least +140dB overtypical definition.
4.1 Imaging vs Non-Imaging Receiver
Performance gains of using an ImR over a NImR are analyzed in this subsection. Thetransmitter and modulation parameters are the same as described above. For this analysis,Ptx = 0.5m is considered. The NImR is made up of 2 × 2 array of pixels; each with a sidelength of 1mm and a pitch of 1mm. Each pixel has a concentrator of refractive index 1.5and field-of-view (FOV) of 60 deg. For the ImR, the sensor is modeled as 2 × 2 array ofpixels with side length and pitch of 1mm. The imaging lens is defined to have sufficientmagnification to align the images of the four transmitters each with four pixels respectively.The FOV of the receiver changes with the sensor dimensions. The maximum FOV is definedas 60 deg; the same as in NImR case. A fair performance comparison between the tworeceiver configurations can be made under the assumption that the same signal radiant-fluxis incident on both. Thus, the aperture of the ImR is modeled to have an area of 1mm2.
BER vs SNR curves for SM and SMP using NImR and ImR are shown in Figure 4.At low signal powers, using a NImR, shot noise is the dominant source of noise. At highsignal powers, inter-channel-interference (ICI) dominates the noise for an NImR because thechannel matrix coefficients are highly correlated. This can be seen as two regions of the BERcurves when using a NImR. SM mitigates ICI and is thus more robust as compared to SMPin this scenario. BER achieved by SMP with NImR are greater than 10−3 for the range ofSNR considered and thus cannot be improved by forward error correction (FEC). SM needsa high transmit signal power to achieve BER= 10−3 for both 4 and 8 bits/sym. Conversely,ImR completely demultiplexes the four transmit signals while generating a diagonal channelmatrix and thus avoids ICI under ideal setup. To achieve BER= 10−3 at 4 bits/sym, SMwith ImR performs about 8dB better that SMP with ImR and about 45dB better thanSM with NImR. SMP packs more bits spatially in transmitter location as compared to SM.Thus, to achieve higher spectral efficiency while keeping the number of transmitters the
9

same, more PAM levels are needed for SM as compared to SMP thus quickly degrading SM’sperformance. To achieve BER= 10−3 at 8 bits/sym, SMP with ImR outperforms SM withImR by about 10dB and SM with NImR by about 52dB. The channel matrix coefficientdecorrelation afforded by ImR provide huge SNR gains over NImR for a given BER.
120 140 160 180 200 220 240
10−3
10−2
10−1
100
SNR (dB)
BE
R
SM: NImRSMP: NImRSM: ImRSMP: ImR
(a) 4 bits/sym
120 140 160 180 200 220 240
10−3
10−2
10−1
100
SNR (dB)
BE
R
SM: NImRSMP: NImRSM: ImRSMP: ImR
(b) 8 bits/sym
Figure 4: Performance comparison of SM and SMP using non–imaging and imaging receiver.
10

4.2 Varying αs
For this analysis, αs is varied while keeping δs and µs fixed. As illustrated in Figure 5, αs
affects only the spot size. As αs increases, spots on the sensor overlap increasingly morenumber of pixels degrading the BER performance. Increasing the number or pixels per spotalso increases the noise for each link thus causing the drop in performance. Very small pixelsizes or very large transmitter sizes also cause increase in αs. A smaller pixel size does enablethe system to pack more channels provided αs is relatively small. On the other hand, havingvery small pixel sizes or alternately large transmitter illumination surface tend to increaseαs and force the system to operate in a suboptimal configuration.
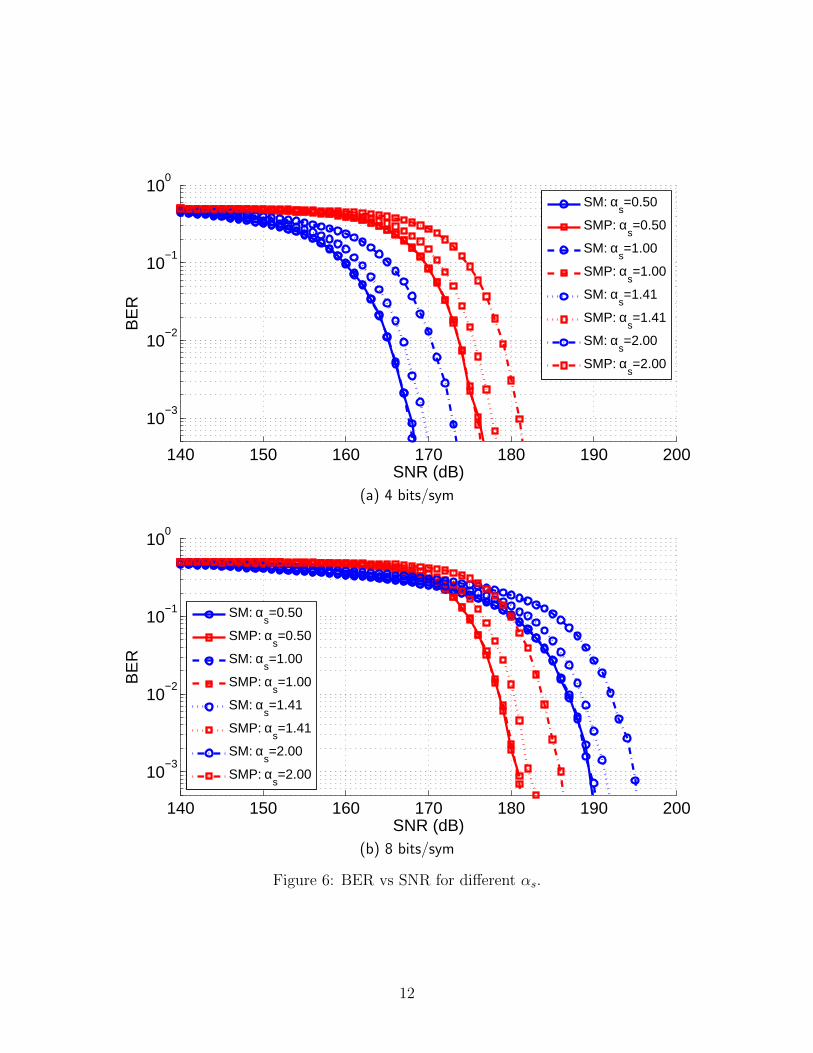
BER vs SNR curves for SM and SMP for different values of αs are shown in Figure 6. Toachieve BER≤ 10−3 at 4 bits/sym, SNRs of about [168,168,170,173]dB and [176,176,178,181]dBare needed for αs=[0.5,1,1.41,2] with SM and SMP respectively. To achieve BER≤ 10−3
at 8 bits/sym, SNRs of about [190,190,192,195]dB and [181,181,183,186]dB are needed forαs=[0.5,1,1.41,2] with SM and SMP respectively. Thus there is about a 2dB SNR penaltyfor system operating at αs = 1.41 and 5dB SNR penalty for system operating at αs = 2 ascompared to that at αs = 1.
(a) αs = 0.5 (b) αs = 1.0
(c) αs = 1.41 (d) αs = 2.0
Figure 5: Spots on the sensor for different αs
11
140 150 160 170 180 190 200
10−3
10−2
10−1
100
SNR (dB)
BE
R
SM: αs=0.50
SMP: αs=0.50
SM: αs=1.00
SMP: αs=1.00
SM: αs=1.41
SMP: αs=1.41
SM: αs=2.00
SMP: αs=2.00
(a) 4 bits/sym
140 150 160 170 180 190 200
10−3
10−2
10−1
100
SNR (dB)
BE
R
SM: αs=0.50
SMP: αs=0.50
SM: αs=1.00
SMP: αs=1.00
SM: αs=1.41
SMP: αs=1.41
SM: αs=2.00
SMP: αs=2.00
(b) 8 bits/sym
Figure 6: BER vs SNR for different αs.
12
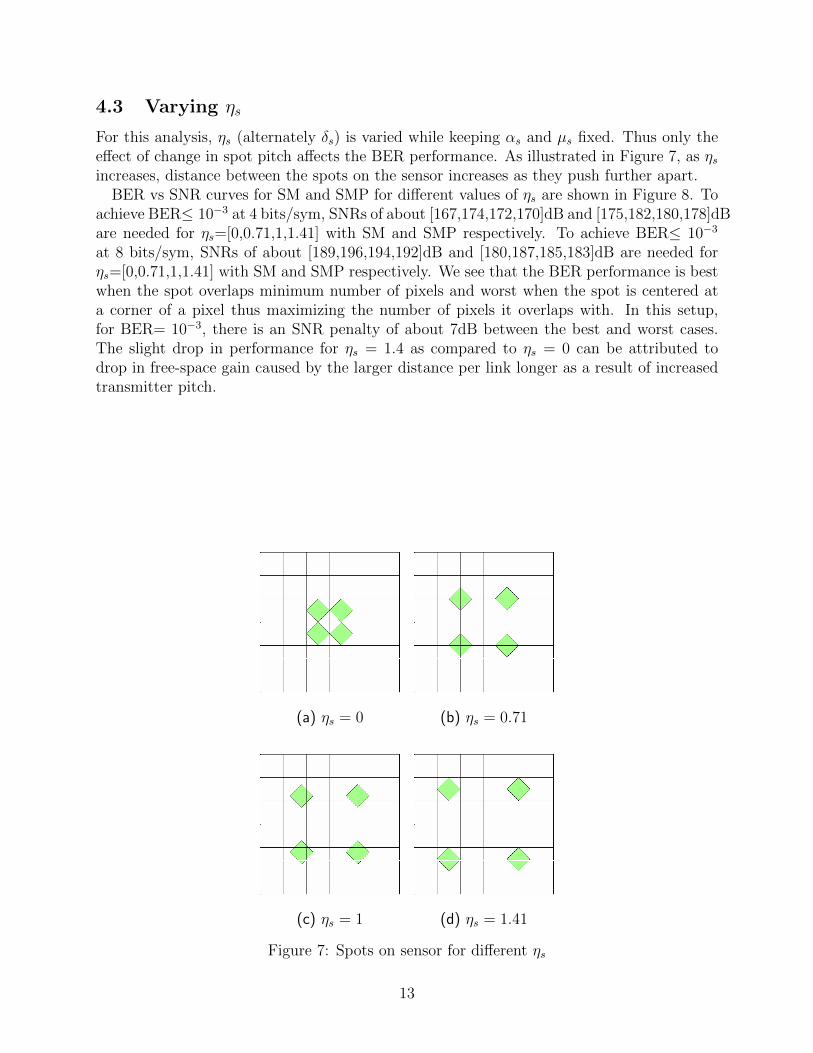
4.3 Varying ηs
For this analysis, ηs (alternately δs) is varied while keeping αs and µs fixed. Thus only theeffect of change in spot pitch affects the BER performance. As illustrated in Figure 7, as ηsincreases, distance between the spots on the sensor increases as they push further apart.
BER vs SNR curves for SM and SMP for different values of ηs are shown in Figure 8. Toachieve BER≤ 10−3 at 4 bits/sym, SNRs of about [167,174,172,170]dB and [175,182,180,178]dBare needed for ηs=[0,0.71,1,1.41] with SM and SMP respectively. To achieve BER≤ 10−3
at 8 bits/sym, SNRs of about [189,196,194,192]dB and [180,187,185,183]dB are needed forηs=[0,0.71,1,1.41] with SM and SMP respectively. We see that the BER performance is bestwhen the spot overlaps minimum number of pixels and worst when the spot is centered ata corner of a pixel thus maximizing the number of pixels it overlaps with. In this setup,for BER= 10−3, there is an SNR penalty of about 7dB between the best and worst cases.The slight drop in performance for ηs = 1.4 as compared to ηs = 0 can be attributed todrop in free-space gain caused by the larger distance per link longer as a result of increasedtransmitter pitch.
(a) ηs = 0 (b) ηs = 0.71
(c) ηs = 1 (d) ηs = 1.41
Figure 7: Spots on sensor for different ηs
13

140 150 160 170 180 190 200
10−3
10−2
10−1
100
SNR (dB)
BE
R
SM: ηs=0.00
SMP: ηs=0.00
SM: ηs=0.71
SMP: ηs=0.71
SM: ηs=1.00
SMP: ηs=1.00
SM: ηs=1.41
SMP: ηs=1.41
(a) 4 bits/sym
140 150 160 170 180 190 200
10−3
10−2
10−1
100
SNR (dB)
BE
R
SM: ηs=0.00
SMP: ηs=0.00
SM: ηs=0.71
SMP: ηs=0.71
SM: ηs=1.00
SMP: ηs=1.00
SM: ηs=1.41
SMP: ηs=1.41
(b) 8 bits/sym
Figure 8: BER vs SNR for different ηs.
14

4.4 Varying µs
In this analysis, µs is varied by varying f . Alternately, it can be varied by changing d.Varying µs affects both αs and ηs simultaneously. This captures their combined impacton the BER performance. We see from Figure 9 that increasing µs not only increases thespot size but also pushes the spots away from each other. Note unlike in previous case, thetransmitter pitch remains constant (Ptx > 0).
BER vs SNR curves for SM and SMP for different values of µs are shown in Figure 10. Toachieve BER= 10−3 at 4 bits/sym, SNRs of about [167,173,169,173]dB and [175,181,177,181]dBare needed for µs=[0.5,1,1.41,2] with SM and SMP respectively. To achieve BER= 10−3
at 8 bits/sym, SNRs of about [189,195,191,195]dB and [180,186,182,186]dB are needed forµs=[0.5,1,1.41,2] with SM and SMP respectively.
The best performance is obtained for µs ≤ 0.5. This is because at this value of µs, αs < 1and ηs is such that all spots lie on different adjacent pixels. It can also be inferred thatgiven enough transmitters in the room, at µ = 0.5, every single pixel could get signal froma single transmitter thus greatly improving the capacity of the channel. If the luminairestransmit with different power levels or if the channels gains are significantly different, capacitymaximizing µs is an optimization problem to be solved in the future.
(a) µs = 0.5 (b) µs = 1
(c) µs = 1.41 (d) µs = 2
Figure 9: Spots on sensor for different µs.
15

140 150 160 170 180 190 200
10−3
10−2
10−1
100
SNR (dB)
BE
R
SM: µs=0.50
SMP: µs=0.50
SM: µs=1.00
SMP: µs=1.00
SM: µs=1.41
SMP: µs=1.41
SM: µs=2.00
SMP: µs=2.00
(a) 4 bits/sym
140 150 160 170 180 190 200
10−3
10−2
10−1
100
SNR (dB)
BE
R
SM: µs=0.50
SMP: µs=0.50
SM: µs=1.00
SMP: µs=1.00
SM: µs=1.41
SMP: µs=1.41
SM: µs=2.00
SMP: µs=2.00
(b) 8 bits/sym
Figure 10: BER vs SNR for different µs.
16

At lower bit rates, SM benefits from having higher transmit power per symbol at lower M-PAM level. To achieve higher bit-rates, higher M-PAM levels push the constellations closerto each other thus quickly degrading the SM performance as compared to SMP. As shownin Figure 6, Figure 8 and Figure 10, to achieve BER= 10−3, at 4 bits/sym, SM performs8-10dB better while at 8 bits/sym, SMP performs 8-10dB better.
5 Conclusion
In this paper we explored the use of SM and SMP with both ImR and NImR in a MIMO VLCsystem. This effort was achieved via the creation of an analysis framework and normalizationapproach to enable performance characterization between systems. The results show thatan ImR has the potential to provide significant SNR (≈45dB) gains over NImR for SMand SMP in a practical indoor scenario. For lower spectral efficiencies (4 bits/sym), SMperforms 8-10 dB better than SMP while at higher spectral efficiencies (8 bits/sym), SMPgives 8-10 dB performance improvement. This is partly because the ImR helps decorrelate theparallel channel gains as compared to NImR. To achieve ideal performance for a given indoorconfiguration, parameters αs, ηs and µs should be carefully selected. From the simulationswe can conclude that the imaging MIMO system performs best when a spot is completelyenveloped by a single pixel and adjacent spots each lie on adjacent pixels. For the simulationcases considered, αs ≤ 1, ηs = 0 and µs = 0.5 were found to provide the best systemperformance.
17

References
[1] J. Kahn and J. Barry, “Wireless infrared communications,” Proceedings of the IEEE,vol. 85, no. 2, pp. 265 –298, feb 1997.
[2] T. Komine and M. Nakagawa, “Fundamental analysis for visible-light communicationsystem using led lights,” Consumer Electronics, IEEE Transactions on, vol. 50, no. 1,pp. 100 – 107, feb 2004.
[3] H. Elgala, R. Mesleh, and H. Haas, “Indoor optical wireless communication: potentialand state-of-the-art,” Communications Magazine, IEEE, vol. 49, no. 9, pp. 56–62, 2011.
[4] R. Mesleh, H. Elgala, and H. Haas, “Optical spatial modulation,” Optical Communica-tions and Networking, IEEE/OSA Journal of, vol. 3, no. 3, pp. 234–244, 2011.
[5] L. Zeng, D. O’Brien, H. Minh, G. Faulkner, K. Lee, D. Jung, Y. Oh, and E. T. Won,“High data rate multiple input multiple output (mimo) optical wireless communicationsusing white led lighting,” Selected Areas in Communications, IEEE Journal on, vol. 27,no. 9, pp. 1654–1662, 2009.
[6] T. Fath and H. Haas, “Performance comparison of mimo techniques for optical wire-less communications in indoor environments,” Communications, IEEE Transactions on,vol. 61, no. 2, pp. 733–742, 2013.
[7] J. Kahn, R. You, P. Djahani, A. Weisbin, B. K. Teik, and A. Tang, “Imaging diversityreceivers for high-speed infrared wireless communication,” Communications Magazine,IEEE, vol. 36, no. 12, pp. 88 –94, dec 1998.
[8] P. M. Butala, H. Elgala, and T. D. Little, “SVD-VLC: a novel capacity maximizingVLC MIMO system architecture under illumination constraints,” in Globecom 2013Workshop on Optical Wireless Communications, Atlanta, USA, Dec. 2013.
[9] P. Djahani and J. Kahn, “Analysis of infrared wireless links employing multibeamtransmitters and imaging diversity receivers,” Communications, IEEE Transactions on,vol. 48, no. 12, pp. 2077–2088, 2000.
[10] J. Grubor, S. Randel, K.-D. Langer, and J. Walewski, “Broadband information broad-casting using led-based interior lighting,” Lightwave Technology, Journal of, vol. 26,no. 24, pp. 3883–3892, 2008.
18


