
Performance of Generating Plant: New Metrics for Industry in
24
Performance of Generating Plant: New Metrics for Industry in Transition – Executive Summary World Energy Council For sustainable energy. able energy for the
Transcript of Performance of Generating Plant: New Metrics for Industry in
Performance of Generating Plant: New Metrics for Industry in Transition – Executive
Summary
World Energy Council
For sustainable energy.
able energy for the
Officers of the World Energy Council
Pierre Gadonneix
Chair
Francisco Barnés de Castro
Vice Chair, North America
Norberto Franco de Medeiros
Vice Chair, Latin America/Caribbean
Richard Drouin
Vice Chair, Montréal Congress 2010
C.P. Jain
Chair, Studies Committee
Younghoon David Kim
Vice Chair, Asia Pacific & South Asia
Jorge Ferioli
Chair, Programme Committee
Marie-José Nadeau
Vice Chair, Communications & Outreach Committee
Abubakar Sambo
Vice Chair, Africa
Johannes Teyssen
Vice Chair, Europe
Abbas Ali Naqi
Vice Chair, Special Responsibility for Middle East &
Gulf States
Graham Ward, CBE
Vice Chair, Finance
Zhang Guobao
Vice Chair, Asia
Christoph Frei
Secretary General
Performance of Generating Plant: New Metrics for Industry
in Transition – Executive Summaryfor Industry in Transition
- Executive Summary
World Energy Council
Copyright ©2010World Energy Council
All rights reserved. All or part of this publication may be used or
reproduced as long as the following citation is included on each
copy or transmission: „Used by permission of the World Energy
Council, London, www.worldenergy.org‟
Published 2010 by:
World Energy Council
Regency House 1-4 Warwick Street
London W1B 5LT United Kingdom
ISBN: 978 0 946121 01 4
Performance of
Generating Plant: New
Metrics for Industry in
Transition - Executive
Summary
Performance of Generating Plant: New Metrics for Industry in Transition – Executive Summary World Energy Council
1
1. The Challenges of Measuring and Improving Performance within
an Increasingly Complex Electricity Supply Sector 3
2. The PGP World-Class Availability Database: Management Tool
for a Competitive World 10
3. Nuclear Power Generating Units 13
4. Performance Indicators for Renewable Energy Sources 15
5. Technology Transfer : How to Make it Happen 16
…
Contents

Performance of Generating Plant: New Metrics for Industry in Transition – Executive Summary World Energy Council
2
Performance of Generating Plant Committee 2010
Chair: Dr Ing Karl Theis (VGB Power Tech e.V., Germany)
Algeria Mr. Latamene Ahcene
Austria Mr. Dieter Meyer Verbund (Austrian Renewable Power)
Colombia Mr José David Alcogen Montoya
Colombia Mr Armando Garzón ISAGEN
Egypt (Arab. Rep.) Dr. Gamel Abed El-Latif Haggag Ministry of Electricity and Energy
France Mr Daniel Glorian Français de l'Energie/CME
Germany Dipl Ing Juergen Aydt EnBW Kraftwereke AG
Hungary Dr Tibor Tersztyánszky Hungarian Energy Office
Indonesia Mr I Sakya PT PLN (PERSERO)
Italy Mr Luigi Salvaderi Consultant
Italy Mr Francesco Starace Enel GreenPower
Japan Mr. Osamu Watanabe Kyushu Electric Power Company
Jordan Dr Hisham Khatib Ministry of Energy
Kuwait Mr Ahmad Al-Jassar Ministry of Energy (Oil)
Latvia Mr. Karlis Mikelsons Latvenergo AS
Mexico Ing. Manuel Fernandez Montiel Instituto de Investigaciones Electricas
Nigeria Mr. R.O. Fagbenle
Peru Eng Guillermo Castillo Justo Former President ELECTROPERU
Romania Mr. Ion Marcu Electrocentrale Bucuresti SA
Russia Mr Alexey Rimov VTI Russian Federation
South Africa Dr. Terry Moss ESKOM
Spain Mr. Luis Matero Alcala ENDESA
Switzerland Mr. Thomas Fritschi ALSTOM
Thailand Mr. Somkiat Sutiratana
Turkey Mr. Selma Öztürk EÜAS
USA Mr Robert Richwine Senior Reliability Consultant
USA Mr Scott Stallard Black & Veatch
USA Mr Ed platt Solomon Associates
USA Mr. G. Michael Curley North American Electric Reliability Corporation
World Energy Council:
Ms. Elena Nekhaev
International Organisations:
Mr Juho Lipponen EURELECTRIC
Mr. Jiri Mandula International Atomic Energy Agency

Performance of Generating Plant: New Metrics for Industry in Transition – Executive Summary World Energy Council
3
Introduction
This is an Executive Summary of the 2010
publication “Performance of Generating Plant:
New Metrics for Industry in Transition” produced
by the four Work Groups of the World Energy
Council‟s Committee on the Performance of
Generating Plant. The complete report is
available for downloading on the WEC website at
www.worldenergy.org.
1. The Challenges of Measuring and Improving Performance within an Increasingly Complex Electricity Supply Sector
(Work Group 1, Chair: Scott Stallard, Black &
Veatch, USA)
During the last two decades, the electric power
sector has been subject to substantial changes
which included regulation, market formation and
structure, technology mix, and political aspects.
Interestingly, such rapidly changing dynamics
seem to have permanently altered industry make-
up, rules, incentives, and ways of doing business.
This begs the key question – how can we
measure and compare performance across
assets for the purpose of improving reliability,
addressing environmental imperatives, and at the
same time keeping and eye on cost of
improvement to value delivered to
utility/customer?
As such, best practices for measurement and
analysis of performance are changed as well.
Increasingly, such changes began to have
significant implications for plant operations and
associated metrics. Efforts of the PGP
Committee to develop a better means to address
such issues across the wide range of power
generation assets worldwide has centered on the
concept of value – value of the generation either
in terms of benefit (i.e., reliability) delivered to the
grid (regulated environment) or value delivered to
owners (de-regulated environment). Extensive
work on “commercial availability” metrics and
their use has been completed; it remains clear
that for the de-regulated entities, this is a critical
concept.
The Committee also completed an analytical
model that allows one to compare/contrast
“value” delivered by assets across markets with
the basic idea of providing a means to
understand the differences in incentives for
performance and more importantly performance
improvement.
With respect to measurement of performance,
the first objective is to analyze how to best
address variability of the “value” of assets, given
the wide diversity amongst stakeholders and their
priorities. Taking into account the divisive
implications of CO2 emissions for the near term,
developed and developing countries may require
different performance metrics and frameworks.
Specifically:
In the absence of environmental and market
imperatives, least-cost reliable generation
continues to be primary performance
motivator for developing countries. In such
cases, traditional data collection, analysis,
and benchmarking processes remain highly
relevant.
In developed countries, increased sensitivity
to the environment and particularly fossil fuel
use and its impacts on CO2 emissions,
creates further complexity with respect to
short-term and long-term individual unit and
system performance priorities and metrics.
In this case, our work suggests that further
definition of means to measure performance
against both financial and environmental
priorities will be needed – in essence, to
combine our prior work addressing
commercial availability with means to
address CO2.
Globally, GHG emissions, cost reduction, and
sustainability are all beginning to target
generation efficiency as a critical element of the
strategy. Therefore, further analysis of efficiency
metrics as key performance indicator is
necessary.

Performance of Generating Plant: New Metrics for Industry in Transition – Executive Summary World Energy Council
4
Implementation of best practices with respect
to efficiency improvement can have
substantial implications for both CO2 and
costs of production.
Key Drivers
Ideally, given that today further de-regulation
and/or privatization has largely stalled, a more
stable view of performance and performance
improvement metrics can be established.
Unfortunately, we have, however, witnessed the
opposite – major factors impacting the electric
supply sector varying widely from economic
downturn, to CO2, to growth of renewables, to
emergence of new technologies (largely driven
by carbon) all play a role in further division of the
sector in terms of roles, expectations, and key
performance metrics. Major drivers include:
Reliability. Supply reliability continues to be
a major driver or imperative. Demand side
management (DSM) is becoming more
attractive as deployment of Smart Grid
technologies takes place and end-use
efficiency and peak demand requirements
are further scrutinized.
CO2 / Greenhouse Gases (GHG). Concerns
surrounding climate change have driven
unprecedented political activity, proposed
CO2 regulations and taxes, creation of
regional CO2 emissions credit markets, and
discussions of global CO2 markets/offsets.
This is a transformational issue and, as such,
will be further addressed in detail below.
Growth of Renewables. Driven by CO2 and
sustainability motives, thousands of MW‟s of
renewable energy are either in operation or
being planned. In some cases, the
intermittency and reliability of such sources
(wind, solar) can place significant stress on
the grid. Bio-derived fuels are being burned
in both new and existing facilities. Currently,
in the majority of cases, without subsidy or
tax abatements, renewable energy does not
compete favorably with traditional generation
in terms of cost.
Global economic downturn. Energy
consumption and peak demand requirements
have been impacted throughout the world;
reduced demand has, in some cases,
provided relief from capacity short regions.
Interestingly, during this “pause,” the viability
of traditional generation assets – particularly
coal – has been challenged by growing
environmental opposition seeking to reduce
or eliminate use of fossil fuels for new
generation facilities.
Demonstrated Value of Data and Data Analysis
Benchmarking and other similar techniques that
focus on comparison of unit performance against
that of its peers remain invaluable. However,
methodologies must be adapted to evaluate
differences in “value” associated with different
markets, regulation, and technology; this can be
coupled to technical data derived from
benchmarking to provide financial perspective.
Benchmarking is a process used to evaluate
various aspects of equipment performance in
relation to best practice, as compared to their
peers. This then allows organizations to develop
plans on how to adopt such best practice, usually
with the aim of improving some aspect of
performance.
While, historically, the focus of such analysis has
been plant reliability, the concepts can be readily
extended to address efficiency, emissions, and
cost objective, presuming adequate data
availability.
Industry “best practices” usually associate
performance with ranking. Hence, it is often
useful to measure performance within the context
of industry ranking, or often more simply, within
the context of “deciles” or “quartiles.” The
distribution of equivalent availability factor (EAF)
and equivalent forced outage rate (EFOR), in
terms of deciles, for US coal-fired generation
from 2002-2007 are shown below.

Performance of Generating Plant: New Metrics for Industry in Transition – Executive Summary World Energy Council
5
Equivalent Forced Outage RateUS Coal-Fired Generation 2002-2006
0
5
10
15
20
25
30
35
0-10 10-20 20-30 30-40 40-50 50-60 60-70 70-80 80-90 90-100
Percentile
Perc
en
tag
e
As one can see from the figures, the distributions
are far from normal. The average performance
for EAF and EFOR are 85.8% and 8.2%,
respectively. Based on these values, the
“improvement” required to improve performance
from average to top quartile or top decile would
be as follows.
Continuing the Journey – Integrating Market, Environmental, and Financial Perspectives
Continuing the Journey – Integrating Market, Environmental and Financial Perspectives
Today, plant operators must think in strategic and
economic rather than purely technical terms. The
reality is that mixed regulatory, ownership and
market perspectives correspond to mixed goals,
objectives, and priorities for generation entities.
Varying business models, varying risk profiles,
and different “obligations to serve” complicate the
issue even further.
While the challenge remains essentially the same
– to improve the performance of the existing
generating plant – the complexity and the
dynamics of the market require a re-evaluation of
the means for collecting, analyzing, and
benchmarking performance. Specifically, one
must consider how to evaluate performance in
the context of multiple objectives – reliability,
availability, efficiency, environmental
performance, and flexibility.
Building on the benchmarking framework
illustrated above, one can quickly see that to
move from average EFOR performer to top-
quartile and top-decile would require
improvements of 7.7 and 10.4%, respectively.
This provides concrete means for “defining
capital investment and changes in O&M
necessary to reach such targets and to define the
costs/risks associated with such aspirations. Yet,
economics must play a role – how much is the
value – in terms of increased net margin from
power sales worth? To address this issue, in
2007, the PGP Committee introduced the initial
version of a spreadsheet-based tool1 to be used
to compare/contrast performance within the
context of financial performance. It provides a
medium for analyzing and presenting a thorough
availability and economic comparison for various
facilities, technologies, and market designs.
1 Originally published in conjunction with WEC
Performance of Generating Plant Final Report, Section 1,
WEC 2007, markets, and obligations effects of market on
value of performance improvement. This model has been
updated to consider cost of carbon as an input to production
cost and to bid strategy.

Performance of Generating Plant: New Metrics for Industry in Transition – Executive Summary World Energy Council
6
By applying this model it is possible to better
understand implications of revenue gains that
would be associated with improvements in EAF
or EFOR; for example, considering the impacts of
“value” vs. whether or not an average base-load
coal plant is operating within a regulated or de-
regulated market. While specifics of the market
and demand need to be tailored to the actual
situation, as modelled, the comparative analysis
yields some interesting results.
A large part of the financial benefits for
achieving top decile performance are
realized by achieving top quartile
performance.
Deregulated markets will yield potentially
higher benefits to generators for incremental
improvement.
The ability to understand magnitude of
opportunity associated with improved
performance is unquestionably a key challenge
for the foreseeable future, given the critical role
of existing plant to both produce needed power
as well as support larger environmental
performance objectives. The ability to evaluate
one‟s performance in the context of its peers
will be key.
The industry‟s challenge is to continue to find
ways to not only collect and analyze the
necessary data but also to provide the framework
for which to extend the analysis across markets,
across technology choices, and across financial
realities.
In terms of the potential impact on the energy
sector, the benefits of the global comparison
system are numerous and obvious. Information
exchange will help improve the performance of
power generating plants around the world and
provide access to electricity to larger populations
thus improving the quality of life for many people.
Impacts of CO2 and Fuel Price on Asset Performance Value
The introduction of CO2 as either a tax or via
allowance will significantly impact the cost of
generation for units with carbon-based fuels (coal
and to lesser degree, natural gas). The purpose
of this analysis is to compare/contrast how such
regulations and related costs would impact value
of generation versus a more traditional cost
factor, the cost of fuel.
Fuel cost has historically been the one of the
primary drivers associated with determining the
“winners” and “losers” within the ESG.

Performance of Generating Plant: New Metrics for Industry in Transition – Executive Summary World Energy Council
7
As one of the, if not the, main cost associated
with electricity production, fuel cost can vary
widely from region to region, and depending on
the physical location of the generating asset,
transport costs (normally a component of fuel
cost) can further impact relative fuel costs
between generating assets.
Interestingly, price volatility such as that modelled
for regional fuel prices essentially forces
competition amongst generators using the same
operating technology, while CO2, as a market
driver can change the competitive dynamics
between technologies with differing emissions
intensities.

Performance of Generating Plant: New Metrics for Industry in Transition – Executive Summary World Energy Council
8
It must be mentioned however, that potential for
erosion of operating margin would exist in
scenarios where coal and natural gas are
competing for base-load generation in the same
market.
As is shown in the above figures2, the projected
impact of a market price of CO2 affects each
generation technology in a slightly different way.
For the coal based asset, increasing CO2 prices,
will more or less, uniformly impact bids price for
coal-fired generation and make gas more
competitive on the margin. For higher CO2 prices,
other factors being equal, gas will displace coal in
base-load market.
Fuel cost on the other hand, has a much more
profound impact on the dispatch level of an
individual coal-fired generation asset, because
fuel cost variations are not uniform across the
market; hence, strong variations in fuel prices
can be far more deterministic to the fate of that
asset.
Value of 1% EFOR Improvement
Interesting trends arise when considering the
“commercial value” of 1% improvement in the
equivalent forced outage rate. This allows us to
consider level of investment that would be
prudent to invest in plant to reduce EFOR.
For gas-fired generation, EFOR
improvements have the increasing economic
value, generally, as fuel prices decrease.
Lower fuel prices maximize opportunity for
unit to be dispatched; there is a slight upward
spike in incremental value of improvement as
gas plant begins to displace coal generation.
2 Surface plots presented are three dimensional and, hence,
the angle of view is critically important to understanding the
variations in the “surface” of the plot. To that end, please
note that when necessary the direction of increasing
magnitude for both the X and Y axes have been reversed if
it’s deemed helpful to understanding the overall impact of
that particular analyses.
It is important to consider overall expected
fuel price vs. price volatility; as can be seen
from the example, the value of improvement
would vary widely if fuel price was highly
volatile.
In a competitive market, the price of CO2 will
be included in generation costs and the value
of improvement for gas plant will be
enhanced because, all other factors being
equal, gas will reap more benefits than coal
in terms of CO2 costs.
A similar result can be seen for coal-fired
generation.
If the coal-unit is not fully in the money,
decreasing fuel price will improve dispatch
opportunity and, yield greater MWh of energy
sales.
CO2 increase will be seen by the entire coal
fleet; impacts will negatively affect dispatch
opportunity most (and decrease margin for
improvement) when fuel prices and CO2
prices are both high. In situations where CO2
costs are very high, incremental value of
EFOR improvement is relatively insensitive to
fuel price.

Performance of Generating Plant: New Metrics for Industry in Transition – Executive Summary World Energy Council
9
It should be noted that market characteristics,
including sensitivity of demand to price, mix of
technology, as well as fuel market characteristics
can materially change the outcomes of this type
of analysis; the key take away is to understand
that the value of incremental improvement is
likely to vary widely both across and within
markets based on global (CO2) and local (e.g.,
fuel costs) influences.
Efficiency Improvement
Increasingly discussions/debates about
sustainability take note of value of efficiency
improvement; while such discussions have
largely centered on end-use efficiency and
reduction of transmission losses, there is
nevertheless more interest in generation
efficiency improvement metrics. The PGP
Committee is in the process of evaluating if/how
to address efficiency within the context of its data
collection and benchmarking efforts.
On one hand, the value of efficiency
improvement can be considered in manner very
similar to that of commercial availability; it would
be possible to quickly assess incremental margin
and dispatch afforded a unit with 1% greater
efficiency. But, while it is relatively straightforward
to assess the value of improvement, there is
substantial difficulty in benchmarking due to
variations in technology, fuel quality, degree of
environmental equipment present, and load.
Technological innovation is one of the key
challenges in addressing the greenhouse gas
problem and this has several implications.
First, while most of the current focus has
been on applying technology to address high
hurdles to meet enormous reduction targets,
one should not discount the use of
innovation/technology to address lower and
more readily attainable hurdles via existing
plant performance/emissions improvements.

Performance of Generating Plant: New Metrics for Industry in Transition – Executive Summary World Energy Council
10
Second, technologies to address carbon
capture/sequestration will significantly impact
overall plant efficiency (due to power
required in separation process) and may also
significantly alter system reliability
(depending on technology‟s impact on plant
reliability and system reserve margins).
Finally, the increased use of renewable
generation will alter the “roles” of traditional
generation assets to, for example, integrate
with/backstop renewable generation requiring
deeper and more frequent cycling, and starts;
this may introduce the need for new
performance metrics for both traditional and
renewable generation sources.
Conclusions
Market, regulatory, and technological forces will
continue to enhance value of performance. As
such, the need for tools/processes to collect,
evaluate, and leverage performance data
remains a priority. As noted above, critical issues
to be addressed include:
Means to collect and evaluate performance
data to understand overall industry
performance trends.
Means to benchmark plant within context of
its market, and to compare performance
“results” vs. incentives provided by the
market, regulations, etc.
Means to factor into forward PGP mission the
importance if efficiency, sustainability,
emerging technologies, and mix of
generation.
The PGP Committee will continue to align its
efforts to support industry needs through data
collection across technologies, application of
benchmarking, where feasible, to support
identification of best practices, and continue to
develop/refine its framework for evaluation of
“value” of performance.
2. The PGP World-Class Availability Database: Management Tool for a Competitive World
(Work Group 2, Chair: Mike Curley, NERC, USA)
The following is paraphrased from an April 2006
article in the Wall Street Journal and applies to all
industries, but may be especially relevant to
today‟s increasingly competitive electric power
generation business:
Business today is awash in data and data
crunchers but only a few companies have
transformed this technology into a strategic
weapon. Their ability to collect, analyze and act
on data is the essence of their competitive
advantage. These top companies are
outsmarting and outmaneuvering the competition
because they made information analysis and
management a distinctive capability, one that is
fundamental to their formula for doing business.
From a recent survey of 450 executives in 370
companies spread across 35 countries and 19
industries, a strong link was identified between
extensive and sophisticated use of analytics and
sustained high performance. Of the respondents,
high-performance companies – identified on the
basis of their ability to substantially and
consistently outperform their competitors over the
long term, over economic and industry cycles and
through generations of leadership – were five
times more likely than low performers to single
out analytics as critical to their competitive edge.
(“Intelligent Use of Data is a Powerful Corporate
Tool”, Wall Street Journal, April 27, 2006)
For the power industry, one of the critical tools to
help “sophisticated use of analytics and
sustained high performance” is an accurate,
dependable power plant database. The PGP
Committee was been at the forefront of this work
and is willing to share its experience with others
in the industry.

Performance of Generating Plant: New Metrics for Industry in Transition – Executive Summary World Energy Council
11
Since its inception in 1974, the Performance of
Generating Plant (PGP) Committee has serviced
the electric industry worldwide. The PGP
Committee organised workshops, training, and
other initiatives to share information, techniques
and methods to increase the productivity of
generating units. This work is now supported by
the PGP power plant database.
The information in the PGP database can help
generating companies in many different ways
through all life time cycles:
New Plants – design
Plant strategies – goals, benchmarking, high
impact outages
Inspection scheduling
Plant Modifications – replacement,
reconfigurations
Outage Planning
Tracking performance of generating units is
essential for benchmarking and goal setting.
Without it, there is no other method for evaluating
how well the power plants are performing.
Without plant‟s availability records, the plant
operators cannot determine ways to improve
performance of the equipment and make the
plant a profit-centre for the company. The causes
of unavailability must be thoroughly examined so
that the limited resources of operating companies
can be use in the most effective ways.
Recent developments of the PGP Database
The PGP Committee has been collecting
availability information on various generating
technologies from around the world. The
technologies collected are:
Fossil steam units
Nuclear
Combustion turbines
Combined cycle and co-generation blocks
Hydro and Pumped Storage units
Renewables including wind and solar
PGP now offers a new option for data collection.
For many years, PGP collected data on a
country-by-country basis where groups of units
were reported by each country. Some countries
were concerned that their data would be
negatively analyzed if only one or two operating
companies were presented.
In 2010, these concerns were addressed by
allowing individual electricity companies report
data directly to PGP. Instead of countries listed
on the retrievals, the world will be divided into
“regions” where the minimum reports will need to
contain a minimum of 3 electricity companies
from that region. This move is to maintain the
confidentiality of the PGP data while allowing
reporting of confidential data to PGP.
The number of units reporting has expanded.
Also, for many years, the database only allowed
base-loaded units to report. That weakened the
full potential of the database by not allowing
users to see cycling or peaking units. The barrier
has been removed. All operating modes can
report to PGP now.
Every generating unit reported is important. In the
last several years, PGP has moved from
collected data on groups of units from each
country to collecting individual unit data. This
unit-by-unit collection allows more specific peer-
unit analysis for benchmarking and goals. As an
example, here is a snap shot of units reporting to
the PGP database over the last five years:

Performance of Generating Plant: New Metrics for Industry in Transition – Executive Summary World Energy Council
12
For more reports from the PGP database,
please see the full PGP tri-annual Report.
Now that the PGP database collects both
design and operating information, it has the
capabilities to provide interesting and
sophisticated analyses on unit performance.
For example, there is a report on the
performance of coal-fired fossil steam units in
2009.
Reports like these allow plant owners to
benchmark and set goal for their units.
Essential data like these allow accurate and
meaningful evaluations of power plant
performance.
Status Of Data Collection Efforts
The WEC PGP started collecting unit-by-unit data
from its members in early 2007. The introduction
of the unit-by-unit database was slower than
expected. However, the pace has picked up. As
of July 31, 2010 the PGP database contains:
Years reported: 125
Units reported: 54,279
Total reported capacity: 8,697,084 MW
Average capacity: 160.23 MW
It is expected that more and more data will be
added to the PGP database as new electricity
companies contribute to the database. Are you
ready to join the global community and contribute
to the PGP database?
Conclusions
Key factors influencing plant performance should be identified and examined to allow a cost/benefit analysis of any activity/programme before its implementation.
To analyse plant availability performance, the
energy losses/outages should be scrutinised to
identify the causes of unplanned or forced energy
losses and to reduce the planned energy losses.
Reducing planned outages increases the number

Performance of Generating Plant: New Metrics for Industry in Transition – Executive Summary World Energy Council
13
of operating hours, decreases the planned
energy losses and therefore, increases the
energy availability factor. Reducing unplanned
outages leads to a safe and reliable operation,
and also reduces energy losses and increases
energy availability factor. At the same time it
reduces costs for. replacement electricity.
The access to worldwide generating plant
statistics will help power plant operators with the
availability records of their plants in the context of
global experience. New software for collecting
and new, powerful software for analyzing the
results is now available to bring the world
electricity producers closer together in a
cooperative manner. The results will be a
beneficial exchange of information to better the
quality of life for the world community.
What the Future Holds in Store
The Performance of Generating Plant database
will continue to grow and improve as more and
more electric companies worldwide report data to
it. The concerns of data confidentiality are now
removed as data can be reported directly to PGP.
Regional groupings of units will allow reports
without disclosing the country of origin. As the
database grows, it will be a more important tool
for increasing the energy output of units and
provide the many customers with reliable sources
of power.
The access to worldwide generating plant
statistics will help power plant operators with the
availability records of their plants to benchmark
them in the context of global experience.
3. Nuclear Power Generating Units This section of the report was produced by Work
Group 2 of the PGP Committee, Jiri Mandula,
IAEA
Since 1954, nuclear reactors have provided a
source of electricity generation and the
technology has been advancing since that time.
Today, nuclear energy is an important part of a
global energy mix. In 2009, nuclear power
supplied approximately 14% of the world‟s
electricity. For the duration that nuclear power
has been used to generate electricity, nuclear
power plants have accumulated more than
14 000 reactor-years of operating experience.
World energy demand is expected to more than
double by 2050, and expansion of nuclear energy
is a key to meeting this demand while reducing
pollution and greenhouse gases.
A growing number of countries are expressing
interest in introducing nuclear power. While
currently 29 countries use nuclear power for
electricity generation, more than 60 countries
have expressed such an interest in recent years
and 17 of them are actively preparing nuclear
power programmes to meet their energy needs.
Nuclear Power Information at the IAEA
The statistics presented in the report are based
on data collected by the International Atomic
Energy Agency (IAEA) for its Power Reactor
Information System (PRIS). The database
system covers two kinds of data: general and
design information on power reactors, and
performance data consisting of energy
production, energy unavailability and outages.
General and design information relates to all
reactors that are in operation, under construction,
or shutdown in the world. Performance data
cover operating reactors and historical data on

Performance of Generating Plant: New Metrics for Industry in Transition – Executive Summary World Energy Council
14
shutdown reactors since beginning commercial
operation.
The PRIS can be used to assess nuclear power
performance as it provides information on plant
utilization and planned and unplanned
unavailability due to internal and external causes.
Due to detailed classification of energy losses
and a comprehensive outage coding system, a
set of internationally accepted performance
indicators are calculated from the PRIS
performance data. The indicators can be used for
benchmarking, international comparison or
analyzes of nuclear power availability and
reliability from reactor specific, national or
worldwide perspectives. Special care should be
taken not to give priority to a single performance
indicator as this could distort an objective
overview. Performance indicators are a tool to
identify problem areas, where improvements are
necessary, but they do not provide either the root
cause or the solutions.
PRIS provides PRIS-Statistics the front-end tool
interface with on-line connection to PRIS through
the Internet and public web-site
www.iaea.org/pris.
Current Status of Nuclear Power
In July 2010 the nuclear industry is represented
by 439 operational nuclear power plants (NPP)
totaling 373 GWe of capacity. In addition there
are 5 operational units in long-term shutdown
with a total net capacity 2.8 GWe. There are 61
reactor units with a total capacity 59.2 GWe
under construction.
In 2010 three new units have been connected to
the grid, Rostov-3 in Russia, Rajasthan-6 in India
and Lingao-3 in China. Construction of eight new
reactor units has been started in 2010: Ningde-3,
Taishan-2, Changjiang-1 and Haiyang-2 in China,
Leningrad 2-2 and Rostov-4 in Russia, Ohma in
Japan and Angra-3 in Brazil.
Figure 1 shows that nuclear energy is
concentrated in Europe, North America and the
Far East (FE) where 410 of the total 439 reactors
are located.
Asia and Eastern Europe are expanding their
installed capacity by constructing new NPPs
whereas North America and Western Europe are,
in recent years, benefiting instead from power
uprates of existing units.
Current expansion in Asia can be illustrated by
facts that 39 of the 61 reactors under
construction are in Asia and, during the last 10
years, 27 of the last 36 grid connections were in
Asia.
Figure 1: Number of reactors by region
Nuclear plant operators are achieving high
availability through integrated operation and
maintenance programmes.
Currently, the global average EAF is around 80%
and more than half the world‟s units operate with
an EAF over 85%. Generally, as EAFs improve
and approaches the ceiling of 100%, each
incremental improvement becomes ever more
difficult and expensive. But there is still room for
improvement. Using the performance of the
world‟s best performers over the last five years to
define a practical limit yields a value around 95%.
Reactors by region
129
67
92
21
122
6 2
4
1
6
33
17
12
2 0
0
20
40
60
80
100
120
140
Europe - W Europe - C&E Asia - FE Asia - ME&S North
America
Latin America Africa
In operation Long-term shutdown Under construction

Performance of Generating Plant: New Metrics for Industry in Transition – Executive Summary World Energy Council
15
These achievements show the efforts made by
the nuclear industry for a reliable and safe
operation of nuclear power plants. These
improvements also reflect the impact of de-
regulation and privatisation of the electricity
market which have affected all electricity
producers, but mainly it is a result of optimised
operation and maintenance of nuclear power
plants.
4. Performance Indicators for Renewable Energy Sources
{Work Group 3, Chair: Francesco Starace, ENEL
Green Power, Italy)
The work presented here was created within
Work Group 3 (WG3) of the World Energy
Council's (WEC) Committee on the Performance
of Generating Plant (PGP). The main goal is to
analyze the formerly defined performance
indicators and the possibility to build databases
for benchmarking purposes producing original
guidelines for generating plants using Renewable
Energy Sources (RES).
The objective of the Work Group is to provide
information and enable benchmarking for
generating plants using renewable energy
sources. This is in order to help improve
efficiency of the systems and the design of new
projects, and enable potential project participants
to evaluate and make comparisons in terms of
their respective performance.
Over the years of work, a lot of mainly general
RES databases have been established but none
seems really satisfactory for our purpose. In fact,
as far as RES are concerned, there are no proper
performance indicators databases for
benchmarking purposes.
The Work Group has analyzed the causes for this
lack of information.
The first issue regarding RES performance
indicators is the lack of standard definitions for
the most important indicators. For example there
is an IEC working group, set up in 2007, with the
aim of producing a standard to describe a
common definition of unavailability categories for
wind power plants. Up to now there is no
international agreed definition of Availability.
Further detailed key performance indicators
definitions are necessary (involving international
organizations IEC/ISO).
There are few databases devoted to the
performance of renewable plants and they are
not well updated (Wind Stats Newsletter for wind,
IEA-PVPS Task 2 for PV, the new NERC (USA)
has just started in the beginning of 2010).
But, why is it so difficult? Why has it been
possible with conventional power plants and not
so with RES?
The first conclusion is obvious: RES business
model is not comparable to the one used for
conventional generation plants.
Performance not always 100% visible to
owners
Global service contracts with Manufacturers
(3-5 years)
Lack of business “maturity” in control-scada-
data collection platforms for RES
KPI definitions not well standardized
Owners not always have a “utility” mind
Strong competition, people are hesitant to
provide information.
“Young” business. RES companies mainly
oriented towards business development, not
operational excellence.
RES promoters are a highly fragmented
community (small investors, land owners,
banks, real state, utilities).

Performance of Generating Plant: New Metrics for Industry in Transition – Executive Summary World Energy Council
16
Technical difficulties to overcome
Several types of generation units per plant
(i.e. wind). A lot of data required for simple
plant performance analysis.
Data management task is very hard for a
medium size promoter dealing with different
technology and different data formats in each
single plant.
Generally, extreme condition locations:
complicated access, poor communications,
lack of performance data more probable.
New Aproach
A new approach is needed. Particularities of RES
business model make it not comparable with
conventional generation plants in terms of
performance indicators definition, treatment,
collection and reporting.
In most cases only a regulatory framework in
which performance data gathering is mandatory
can ensure the proper operation of databases.
5. Technology Transfer : How to Make it Happen
(Work Group 4, Chair: Dr. Terry Moss, Eskom,
South Africa)
Technology transfer is the process of sharing
technologies to ensure that developments are
accessible to a wider range of users who can
then further develop and exploit the technology
into new processes.
The recipients however, do not always fully
understand what is needed and the suppliers are
unaware of this.
Analytical studies and documented practical
experience demonstrate that plant performance
improvement is attributable to
25% improvement in technology
and
75% improvement in human technical and
managerial skills. This highlights the
importance of transferring the technology
to the people involved in the operation of
the plant.
The objective of Technology Transfer does not
take place in isolation and it is a combination of
macro as well as micro issues that need to be
addressed.
The contributions from the WEC members
highlight that solutions do exist and that some
very successful initiatives have taken place.
Technology Transfer
In order to address “Technology Transfer – How
to make it happen”, a clear understanding has to
be formed regarding the scope of Technology
Transfer. Two definitions indicate the extent that
is covered:
First Definition: Transmission and adaptation for
specific cultural, social, economic and
environmental influences of ideas, information,
methods, procedures, techniques, tools or
technology from the knowledge holders to
potential users.
Second Definition: The process of sharing
skills, knowledge, technologies, methods of
manufacturing, samples of manufacturing and
facilities among industries, universities,
governments and other institutions to ensure that
scientific and technological developments are
accessible to a wider range of users who can
then further develop and exploit the technology
into new products, processes, applications,
materials or services (Wikipedia).
Performance of Generating Plant: New Metrics for Industry in Transition – Executive Summary World Energy Council
17
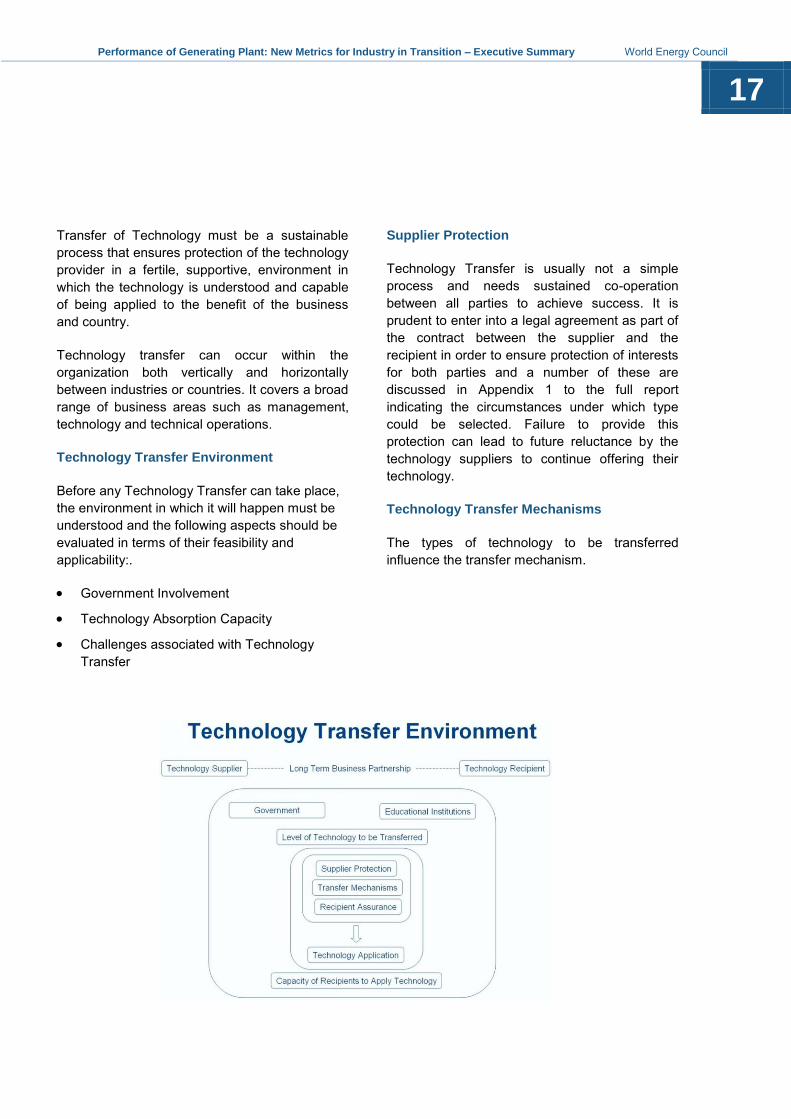
Transfer of Technology must be a sustainable
process that ensures protection of the technology
provider in a fertile, supportive, environment in
which the technology is understood and capable
of being applied to the benefit of the business
and country.
Technology transfer can occur within the
organization both vertically and horizontally
between industries or countries. It covers a broad
range of business areas such as management,
technology and technical operations.
Technology Transfer Environment
Before any Technology Transfer can take place,
the environment in which it will happen must be
understood and the following aspects should be
evaluated in terms of their feasibility and
applicability:.
Government Involvement
Technology Absorption Capacity
Challenges associated with Technology
Transfer
Supplier Protection
Technology Transfer is usually not a simple
process and needs sustained co-operation
between all parties to achieve success. It is
prudent to enter into a legal agreement as part of
the contract between the supplier and the
recipient in order to ensure protection of interests
for both parties and a number of these are
discussed in Appendix 1 to the full report
indicating the circumstances under which type
could be selected. Failure to provide this
protection can lead to future reluctance by the
technology suppliers to continue offering their
technology.
Technology Transfer Mechanisms
The types of technology to be transferred
influence the transfer mechanism.
Performance of Generating Plant: New Metrics for Industry in Transition – Executive Summary World Energy Council
18
Acquiring technological information through more
than one channel leads to increased technology
transfer, as demonstrated with the Eskom new-
build contracts being the OEM equipment
contracts, independent training suppliers and
government sponsored ASGISA capacity building
initiatives.
In the case of South Korea, transfer mechanism
progression indicated a maturing process:
Technology imports and local adaptation to
enhance efficiency
Technological licensing (use)
Foreign Direct Investment (FDI). This is not
always a preferred method for the receiving
country as it can be considered as „Buying
Out‟ the Country rights.
Mergers and acquisitions
Indigenous Research and Development
efforts
Technology licensing (manufacturing)
Strategic alliances
Foreign firms supply in specialised sub-
sectors of the industry.
Technology Transfer channels in use:
Co-operative research programs
Reverse engineering
Exchange of Scientific and technical
personnel
Science and technology conference
Trade shows and exhibits
Open literature (journals, magazines,
technical books and articles)
Commercial visits
Education and training of foreigners
Government assistance programs
The Technology Supplier undertakes to train staff
and management of local firms to source
equipment due to lower costs or ease of access.
The Technology Supplier at the end of the
contract releases some of its management staff
which is then absorbed into the local market.
The Technology Supplier invests in local
manufacturing facilities to meet higher quality
standards, improved reliability, and higher
production levels. These facilities remain after
the main project has been completed.
Recipient Assurance
There are a number of issues which technology
recipient will need to take into account:
Costs of Knowledge Transfer
Knowledge Management
Communication
Behavioural expectations
Cross-culture team building
Content
People
Culture
Process
Infrastructure
Recipient case study – Eskom:
In Eskom‟s case there is a shortage of skilled
labour to project manage, design, operate and
maintain the capital expansion project power
plants. In addition there is a need to develop up
to 25% more personnel to build capacity in the
South African economy.
Eskom‟s Knowledge and Skills Transfer process
is established to avail itself of the opportunity
presented during the new-build program to
develop the capacity of Eskom staff and targeted
groups in the aspects of Design and Project

Performance of Generating Plant: New Metrics for Industry in Transition – Executive Summary World Energy Council
19
Management with the objective to be able to
design and manage new build projects in the
future. The staff will be identified and developed
in terms of the main contract covering two
phases, initially concerning the handing over from
the Project and Design team of „Power Station
Design and Project Manage‟ manuals together
with an individual Knowledge Transfer phase in
which tacit knowledge is to be identified
separately and converted to explicit knowledge
for ease of transfer to take place.
Eskom has adopted the 4-Level Kirkpatrick
model for measuring the Learning Effectiveness:
1. Learner Satisfaction, the first level, is
measured using the smiley assessment form
indicating the experience the learner had in
the learning environment, usually the
classroom.
2. New Skills acquired, the second level, is
measured in the form of examinations e.g.
theory testing and /or structured observable
assessments, similar to the completion of a
trade test in terms of an electrician‟s
qualification.
3. Proven Competency, the third level, is
measured using assessments with both the
learner and the Line Manager.
4. Business Impact, the fourth level, is also
measured by assessing both the learner and
Line Manager separately.
The third and fourth levels while normally difficult
to measure are made considerably easier to
measure by measuring against the User
Requirement Specification which was fully
understood by Line Management and the Learner
before the Learning Intervention took place.
Conclusion
The survey of current practices of technology
transfer indicates that it is a complex,
multifaceted process that must be actively
managed at both the macro and micro to ensure
levels of success.
This is achievable as noted by the feedback from
the WEC members polled with a number of
design, manufacturing and operating plant
successes, however there are many cases where
known failure has occurred.
Sustainable transfer difficulty is experienced
generally when the supplier does not
understand the needs of the recipient who
has difficulty in expressing in sufficient detail
what is needed, this highlights the need for
the supplier and recipient to engage closely in
order to nurture a fuller understanding of
each other‟s position as lifetime partners to a
common goal.


Albania
Algeria
Argentina
Austria
Belgium
Botswana
Brazil
Bulgaria
Cameroon
Canada
China
Colombia
Congo (Democratic
Republic) Côte d'Ivoire Croatia
Cyprus Czech Republic Denmark Egypt (Arab Republic) Estonia Ethiopia Finland France Gabon Germany Ghana Greece Hong Kong, China Hungary Iceland
India
Indonesia
Iran (Islamic Republic)
Ireland
Israel
Italy
Japan
Jordan
Kazakhstan
Kenya
Korea (Republic)
Kuwait
Latvia
Lebanon
Libya/GSPLAJ
Lithuania
Luxembourg
Macedonia (Republic)
Mexico
Monaco
Mongolia
Morocco
Namibia
Nepal
Netherlands
New Zealand
Niger
Nigeria
Norway
Pakistan
Paraguay
Peru
Philippines
Poland
Portugal
Qatar
Romania
Russian Federation
Saudi Arabia
Senegal
Serbia
Slovakia
Slovenia
South Africa
Spain
Sri Lanka
Swaziland
Sweden
Switzerland
Syria (Arab Republic)
Taiwan, China
Tajikistan
Tanzania
Thailand
Trinidad & Tobago
Tunisia
Turkey
Ukraine
United Arab Emirates
United Kingdom
United States
Uruguay
Member committees of the World Energy Council
Designed and produced by Merchant (Brunswick Group).

World Energy Council
Regency House 1-4 Warwick Street
London W1B 5LT United Kingdom
T (+44) 20 7734 5996
F (+44) 20 7734 5926
www.worldenergy.org
For sustainable energy.
ISBN: 978 0 946121 01 4


