
Key Performance Indicators for Intelligent Transport Systems

Performance Impacts through
Intelligent Transport Systems An Assessment of how to Measure and Evaluate
Master’s Thesis within Business Administration
Authors: Patrick Hofmeister, Matthias Kadner
Tutors: Benedikte Borgström, Bo Ireståhl
Jönköping 2011-05-24

Master’s Thesis within Business Administration Title: Performance Impacts through Intelligent Transport Systems – An As-
sessment of how to Measure and Evaluate
Authors: Patrick Hofmeister, Matthias Kadner
Tutors: Benedikte Borgström, Bo Ireståhl
Date: 2011-05-31
Subject terms: Intelligent Transport Systems, Performance Measurement, Evaluation, Technology Adoption, Geo-fencing
Abstract This study assesses how to measure and evaluate performance impacts of Intelligent Transport Systems (ITS) in the transport chain.
The importance of transportation in global trade has increased significantly in the last decades. Cost pressure, rising customer demand for sophisticated logistics services, sus-tainability and security as well as safety issues have boosted the need for more efficient, effective and differentiated transport operations. Intelligent Transport Systems were found to have the potential to address these challenges in the transport chain. However, due to the novelty of the technology both ITS developers and users face huge uncer-tainty about the performance impacts of ITS. Evaluating ITS in the transport chain be-fore the rollout based on concrete measures is likely to reduce the uncertainty involved in ITS developments and enhance the adoption rate of the new technology. The increas-ing number of ITS projects, like the Secure Intermodal Transport Systems at Volvo Technology, create a need for a structured approach to measure and evaluate ITS.
A literature review concerning the characteristics of the transport industry, technology adoption, ITS and performance measurements served as a basis for the empirical study in which 8 semi-structured interviews with different stakeholders in the transport indus-try were conducted in order to find out how the performance impacts of ITS are per-ceived in the industry and how they could possibly be assessed. The focus group method was used to validate and apply the findings from the interview study to a Geo-fencing ITS-service.
The study has confirmed that the concept of ITS is still an emerging phenomenon in the transportation industry. There is no common understanding of ITS among researchers and practitioners in the transport industry and still a lack of knowledge regarding the performance impacts of ITS. Even though it could be found that ITS leverages mainly the service level that can be offered to the customer and that they increase the efficiency in the back office, the great variety of ITS-services calls for an individual assessment. Structuring the assessment into the phases of measurement design, implementation and use of the measures facilitates this process. For the different phases a set of activities critical for a successful assessment of ITS have been identified. Despite its usefulness for mitigating the uncertainty related to the new technology, the focus group validation uncovered that a comprehensive measurement for ITS is not appropriate from the out-set, but should be assessed based on the cost of the measurement, the ITS project prior-ity, the customer relations as well as the hierarchical structure in the provider firm.

Acknowledgement This thesis work would not have been possible without the support from various people. First of all, we would like to thank Volvo Technology for giving us the opportunity to write this thesis. We always benefited from the fantastic working conditions and the nice atmosphere in the office. Likewise, we would like to express our gratitude towards our supervisors at Volvo Technology, Marcus Enered and Fredrik Bode whom we could always approach for questions and discussions.
We are also very grateful for the critical feedback from our seminar group at Jönköping International Business School and our supervisors Benedikte Borgström and Bo Ireståhl who gave us academic support.
Moreover, we owe our deepest gratitude to all our interview partners and especially to Eva Knutson (Fraktkedjan Väst) and Magnus Gunnergård (Vehicle Communications) for their time and effort they put in the validation.
Finally, we are extremely thankful that Astrid Baumgarten proofread our thesis and gave us so many valuable comments.
Patrick Hofmeister and Matthias Kadner

List of Abbreviations CBR – Cost-Benefit Ratio
CVO – Commercial Vehicle Operations
EDI – Electronic Data Interchange
ETA – Estimated Time of Arrival
FAA – Federal Aviation Administration
FTE – Full-Time Equivalent
GPS – Global Positioning System
GSM – Global System for Mobile Communications
ICT – Information and Communication Technology
IT – Information Technology
ITS – Intelligent Transport Systems
JIT – Just-in-Time
KPI – Key Performance Indicator
NPV – Net Present Value
RFID – Radio Frequency Identification
SCM – Supply Chain Management
SCOR – Supply Chain Operations Reference Model
SITS – Secure Intermodal Transport System
TPL – Third Party Logistics
VehCo – Vehicle Communications
VTEC – Volvo Technology
XML – Extensible Markup Language

i
Table of Contents 1 Introduction .......................................................................... 1
1.1 Background ................................................................................... 1
1.2 Problem Area ................................................................................ 2
1.3 Purpose ......................................................................................... 2
1.4 Research Question ........................................................................ 3
1.5 Scope and Limitations ................................................................... 3
1.6 Volvo Technology .......................................................................... 3
1.7 SITS Project .................................................................................. 3
2 Theoretical Framework ........................................................ 5
2.1 Transportation ............................................................................... 5
2.1.1 The Scope of Supply Chain Management, Logistics and Transportation ........................................................................ 5
2.1.2 The Transportation System ................................................ 6
2.1.3 The Need for Information in Transportation ........................ 8
2.2 Adoption of Innovative Technology ............................................... 8
2.2.1 Technology and Innovation ................................................. 8
2.2.2 Technology Adoption and Diffusion .................................... 9
2.2.3 Impediments and Benefits of Adopting Innovative Technology .................................................................................. 10
2.3 Intelligent Transport Systems ...................................................... 10
2.3.1 The Concept of ITS ........................................................... 10
2.3.2 Key Technological Drivers of ITS ...................................... 11
2.3.3 ITS Application Areas ....................................................... 13
2.3.4 ITS Functions.................................................................... 15
2.4 Performance Measurement ......................................................... 18
2.4.1 Definition and Meaning in the Thesis ................................ 18
2.4.2 The Supply Chain Approach to Performance Measurement .............................................................................. 19
2.4.3 The Phases of Performance Measurement ...................... 20 2.4.3.1 Design of the Measurement ............................................................................. 20 2.4.3.2 Implementation of the Measurement .............................................................. 22 2.4.3.3 Use of the Measures ......................................................................................... 22
2.4.4 Pitfalls in Performance Measurement ............................... 24
3 Research Method ................................................................ 25
3.1 Research Strategy ....................................................................... 25
3.2 Quantitative and Qualitative Research ........................................ 26
3.3 Data Collection ............................................................................ 26
3.3.1 Literature Study ................................................................ 27
3.3.2 Interviews ......................................................................... 27
3.3.3 Observations..................................................................... 28
3.3.4 Personal Communication .................................................. 29
3.3.5 Focus Group ..................................................................... 29
3.4 Reliability, Validity and Objectivity ............................................... 29
3.4.1 Reliability .......................................................................... 29
3.4.2 Validity .............................................................................. 30
3.4.3 Objectivity ......................................................................... 30

ii
4 Empirical Research ............................................................ 31
4.1 Intelligent Transport Systems ...................................................... 31
4.1.1 Use of ITS ......................................................................... 31
4.1.2 System Testing and Implementation ................................. 32
4.1.3 ITS Impact Areas .............................................................. 33
4.1.4 Stakeholder Interaction ..................................................... 34
4.2 Performance Measurement ......................................................... 35
4.2.1 Use of KPI ........................................................................ 35
4.2.2 KPI Selection .................................................................... 37
4.2.3 KPI Categories.................................................................. 37
4.2.4 Data Collection ................................................................. 38
4.2.5 Data Evaluation ................................................................ 39
5 Analysis............................................................................... 41
5.1 Design of the Measurement ........................................................ 41
5.1.1 ITS-Service Definition ....................................................... 41
5.1.2 Stakeholder Analysis ........................................................ 42
5.1.3 Identification of Customer and Stakeholder Impact Areas .............................................................................. ............ 43
5.1.4 Design of Measurement Scenarios ................................... 44
5.1.5 KPI Design and Selection ................................................. 45
5.2 Implementation of the Measurement ........................................... 46
5.2.1 Stakeholder Involvement .................................................. 46
5.2.2 Data Collection ................................................................. 47
5.2.3 Function of the system ...................................................... 48
5.3 Use of the Measures ................................................................... 49
5.3.1 Evaluation of Results ........................................................ 49
5.3.2 Communication of Results ................................................ 50
5.3.3 Evaluation of Measurement .............................................. 51
5.4 Summary of the Measurement Process ...................................... 51
6 Validation ............................................................................ 52
6.1 Introduction to the Focus Group Validation ................................. 52
6.1.1 VehCo ............................................................................... 52
6.1.2 The Geofencing Service ................................................... 52
6.2 Empirical Results from the Validation .......................................... 52
6.2.1 Feasibility of a Comprehensive Measurement .................. 52
6.2.2 Proposed Activities with Regards to the Geofencing Service ........................................................................................ 53
6.3 Analysis of Focus Group Study ................................................... 55
6.3.1 Feasibility of a Comprehensive Measurement .................. 55
6.3.2 Analysis of the Proposed Activities With Regards to the Geofencing Service ............................................................... 56
7 Results ................................................................................ 57
7.1 The Performance Measurement Process .................................... 57
8 Conclusion .......................................................................... 60
9 Discussion, Recommendations and Further Research ................................................................................... 62

iii
9.1 Discussion ................................................................................... 62
9.2 Recommendations ...................................................................... 63
9.3 Further Research ........................................................................ 64
References ............................................................................... 65
iv
Figures Figure 2.1 The Scope of the Supply Chain, Logistics Chain and Transport
Chain . ............................................................................................... 5 Figure 2.2 An integrated transport chain . ...................................................... 7 Figure 2.3 ITS functions overview. ............................................................... 17 Figure 1.1 Research strategy in this master’s thesis. ................................... 25 Figure 5.1 Performance break down structure. ............................................ 44 Figure 6.1 Performance Measurement Decision Tree. ................................. 57 Figure 6.2 The Performance Measurement Process. ................................... 58

v
Tables Table 2.1 Application Areas of ITS ............................................................... 13 Table 2.2 ITS functions ................................................................................ 15 Table 2.3 Standard KPI for transport operators............................................ 21 Table 2.4 Comparison subjective/objective data .......................................... 22 Table 1.1 Interviews conducted during empirical research .......................... 28 Table 4.1 Use of ITS .................................................................................... 31 Table 4.2 System testing and implementation.............................................. 32 Table 4.3 ITS impact areas .......................................................................... 34 Table 4.4 Stakeholder Interaction ................................................................ 35 Table 4.5 Use of KPI .................................................................................... 36 Table 4.6 KPI Selection ................................................................................ 37 Table 4.7 KPI Categories ............................................................................. 38 Table 4.8 Data Collection ............................................................................. 39 Table 4.9 Data Evaluation ............................................................................ 40 Table 5.1 Cost associated with ITS-service ................................................. 50

vi
Appendix Appendix A: Interview Guideline 1 ............................................................... 72 Appendix B: Interview Guideline 2 ............................................................... 73 Appendix C: Managerial Guideline ............................................................... 74 Appendix D: Description of Performance Attributes ..................................... 79 Appendix E: The Economic Analysis Approach ........................................... 81

1
1 Introduction This chapter introduces the master’s thesis by describing the background and the prob-lem area of the thesis. The aim of the research is expressed in the purpose and the fol-lowing research question. Further, the scope and limitations of the thesis are presented. This chapter concludes with a brief presentation of Volvo Technology, the initiator of this master’s thesis and the project the thesis is related to.
1.1 Background As the global economy has become more complex in recent years, mainly due to geo-graphical dispersion of business, transportation has developed as the backbone of global trade. It has been found that usually transportation constitutes the largest single cost driver of logistics in most firms (Ballou, 1999 cited in Davidsson, Henesey, Ramstedt, Törnquist, & Wernstedt, 2005). But many companies have likewise acknowledged the strategic value of transportation in creating a competitive edge. Efficient and effective transport systems support logistics practices like Just-in-Time (JIT) in manufacturing or effective consumer response in retailing (Coyle, Bardi & Novack, 2000). Hence, the demand for sophisticated transportation systems is increasing. Actors involved in the transportation of goods strive to provide these services and satisfy their customers at the lowest possible cost. Other than that, the transportation industry also has to deal with security issues like cargo theft, pirate assaults and terrorist attacks. Furthermore, the sustainability of the transport system is considered more and more important and safety issues need to be addressed.
The critical function of transportation in the supply chain setup as well as the external pressure to provide an efficient, effective, secure and sustainable service calls for so-phisticated Information Technology (IT) systems. IT is considered the glue for a com-petitive supply chain, enabling the seamless flow of goods and information among the different actors involved. The key for success is seen in making the information avail-able for the relevant actors, at the right time in a way that can be easily used for decision making (Coyle, Bardi & Langley, 1992).
In recent years the term Intelligent Transport Systems (ITS) has emerged which refers to the application of Information Communication Technology (ICT) and its related infra-structure (Giannopoulos, 2009). Research has identified the potential of ITS to address the above mentioned issues of efficiency, effectiveness, safety and security. Likewise, logistics service developing companies like Volvo Technology (VTEC) have taken the opportunity to start developing a number of different ITS-services. Even though the possibilities of ITS have been recognised, they have not yet penetrated the market and can still be regarded as a new phenomenon. The novelty of ITS is supported by findings from a European study on the transport and logistics service industry. This study found that in the year 2007 in Europe only 7% of all firms in this sector adopted ITS-services. In the USA this adoption indicator is even lower where only about 1% of the firms were making use of ITS-services (European Commission, 2008).
Since ultimately ITS developing companies want to develop such services effectively and satisfy customer demand, it is important for them to be able to estimate how these services impact the performance of customers and stakeholders. Performance measure-ment results are needed in order to evaluate the potential of the services properly. One structured approach to performance measurement is to divide it into the phases of meas-

2
urement design, implementation of the measurement and use of the measures (Bourne, Mills, Wilcox, Neely, & Platts, 2000). Certain activities need to be executed in each phase in order to get precise measurement results.
1.2 Problem Area Recent studies have identified major bottlenecks and waste areas in transportation (Al-lenström & Linger, 2010). Some of them can be potentially enhanced by ITS. Among others, truck waiting time at the port can be reduced by an ITS-service which enables customs pre-clearance.
A lot of research has been dedicated to the assessment of ITS in general (Crainic, Gen-dreau, Potvin, 2009; Giannopoulos, 2009; Maccubbin, Staples, Kabir, Lowrance, Mer-cer, Philips & Gordon, 2008), however none of the authors addressed how to actually measure and evaluate the impacts of ITS before the market launch. Due to the newness of ITS there is a lack of knowledge about how ITS affects the performance of actors in the transportation business (Ecorys, 2005). Another shortcoming prevails in the assess-ment of the effects of information sharing for different actors in the transport chain (Sternberg, 2008). Furthermore, the existing frameworks for performance assessment focus on performance measurement as an on-going process to monitor business opera-tions and detect room for improvement (Bond, 1999; Kaplan & Norton, 1996; Neely, Gregory & Platts, 2005). However, literature on how to assess performance of a newly developed service before the rollout is rare.
This creates the need to assess how ITS developing companies should practically go about measuring and evaluating the impacts of ITS during the development process. Managerial guidelines should indicate what activities are essential for each phase of the performance assessment.
VTEC is currently working with a project named Secure Intermodal Transport System (SITS) aiming to improve efficiency and security in intermodal transport operations. One of the goals is to facilitate information sharing among actors in the transport chain that do not have direct business relations and therefore tend not to share information electronically. Projects like SITS, that make use of ITS and other technologies in order to increase the performance in a transport chain, create a need for an assessment of how to measure and evaluate these services (Volvo Technology AB, 2010).
The results of this thesis will be used during the SITS project, but shall also support practitioners and researchers in other ITS projects to measure and evaluate the potential of the new technology.
1.3 Purpose The purpose of this thesis is to assess how to measure and evaluate performance im-pacts in transport operations that are enabled through ITS. The aim is to identify impor-tant activities that ITS developing companies need to consider for a comprehensive measurement of new ITS-services.

3
1.4 Research Question RQ1: What are the critical activities for the performance measurement phases of design, implementation and use that ITS developing companies should consider when assessing new ITS-services?
1.5 Scope and Limitations The outcome of this thesis should give researchers and practitioners involved in the de-velopment of ITS-services a good idea of how to conduct the assessment of a new ITS-service. Even though the assessment might also be valuable for the users of ITS in the transportation industry, it primarily aims at supporting the developing companies to measure and evaluate the potential of the new service. Thus, the thesis is compiled from an ITS developer’s perspective, however the empirical part was primarily dedicated to find out about the users’ perception of ITS performance impacts.
Among the different potential areas of ITS, the focus of this research is on ITS in freight transportation.
Finally, the thesis focuses on the measurement design rather than the technical conduc-tion of the measurement and is not supposed to provide any specific measurement re-sults.
1.6 Volvo Technology VTEC is the centre of innovation, research and development within the Volvo Group. The mission is to develop existing and future technology areas of high importance to Volvo. The customers include all Volvo Group companies, Volvo Cars and some se-lected suppliers. VTEC participates in national and international research programmes, involving universities, research institutes and other companies. The competencies are many and include e.g. telematics, ergonomics, logistics, combustion, electronics and mechanics (Volvo Group, 2011).
One of VTEC’s missions is to secure the strategic concepts for the Volvo Group. Volvo Group is facing challenges and must like many other companies improve performance and continuously search for new markets and opportunities to gain higher profits in their business (Volvo Group, 2011).
Volvo Group has begun the journey from delivering stand-alone products to complete solutions. The intention of Volvo Group is to position itself in relation to its competitors and develop a closer relation to its customers. This master’s thesis is a part of Volvo Group’s intention to strengthen the understanding of their customer needs.
1.7 SITS Project VTEC is currently involved in a project called SITS. The SITS project aims to increase the efficiency and security in intermodal transport chains. In order to achieve this goal, the project involves a number of sub-activities. These sub-activities are to:
• Ensure that public and private security and safety are properly considered in the emerging transport solutions and in standards developed.

4
• Enhance cooperation between public and private stakeholders in the area of critical transport systems to enable supply chain visibility for deviation man-agement and security threat identification.
• Develop and propose harmonisation suggestions to national and international initiatives such as standardisation, projects and work in the area of ITS.
• Develop a goods’ transport framework to improve and harmonise communica-tion between stakeholders for increased transport efficiency, security and visibil-ity in the supply chain.

5
2 Theoretical Framework To fulfil the purpose of the thesis, the theoretical framework consists of four parts. It starts with an introduction into the field of transportation. Secondly, the topic of tech-nology adoption is introduced, followed by a study of ITS, their applications areas and functions. The theoretical framework concludes with a review of current performance measurement practices for the phases of measurement design, implementation and use of the measures as well as a summary of common pitfalls when it comes to performance measurement.
2.1 Transportation This section contextualises transportation within the concepts of Supply Chain Man-agement (SCM) and Logistics depicting its role and the most important actors in the transportation system. Further, the need for information in transportation is described.
2.1.1 The Scope of Supply Chain Management, Logistics and Trans-portation
There are three different concepts dealing with the flow of physical products which are delineated in Figure 2.1.
Figure 2.1 The Scope of the Supply Chain, Logistics Chain and Transport Chain (Woxenius & Rodrigue, 2011, on http://people.hofstra.edu/geotrans).
The supply chain integrates business processes from end user through original suppliers that provide products, services, and information that add value to the customer (Lam-bert, Stock & Ellram, 1998). It spans a set of inter-organisational logistics activities from basic extraction of raw material to retailing. Bowersox, Closs and Stank (1999) describe SCM broadly as a strategic endeavour to link inter-organisational business op-erations to increase performance. In other words it is about integrating inter-

6
organisational business processes in order to satisfy the end-customer at minimised sys-tem-wide costs.
The logistics chain can be seen as a part of the supply chain comprising ‘the process of strategically managing the procurement, movement and storage of material, parts and finished inventory (and the related information flows) through the organisation and its marketing channels in such a way that current and future profitability are maximised through the cost-effective fulfilment of orders’ (Christopher, 2005, p.4). A logistics chain could, for instance, include the assembly of a final product, its transportation to a distribution centre, the temporary storage and the final delivery to a retail store.
The transport chain is the connecting link within the supply chain. It can be seen as an intermediary function within the flow of goods from the supplier to the customer. Tradi-tionally, it is concerned with the movement of goods from a point of origin to a point of destination mainly adding value to the product in terms of time and place utility (Coyle, Bardi & Langley, 1996).
Nowadays however, transportation cannot only be seen as the simple movement of goods, but actually it comprises a vast number of services and activities, such as on-time pick-up, special equipment or communication depending on the mode of transpor-tation, the type of goods and the carrier (Coyle et al., 2000). Especially for more sophis-ticated logistics activities like JIT deliveries, where the punctual arrival of the goods is critical, timely and accurate information sharing between channel partners is seen as a prerequisite (Trappey, Trappey, Hou & Chen, 2004).
Comparing the definitions of SCM and logistics it becomes obvious that there is a strong interrelation between the two concepts, however, SCM stresses the importance of collaboration and coordination of the channel partners in order to provide goods and services in an efficient and effective way. The subject matter of the thesis will be con-sidered from a supply chain perspective since ITS-services in freight transportation are system-spanning and likely to enhance supply chain integration and coordination con-siderably. However, due to the scope of this thesis, only actors involved in the transpor-tation process will be examined. In order to understand why and where ITS are needed in the supply chain; the transportation system, the involved parties and the need for in-formation will be presented.
2.1.2 The Transportation System
Traditionally, the transport network can be described as a system of nodes and links (Manheim, 1979). Links refer to infrastructural units like urban roads, seaways, railway tracks and motorways, whereas nodes commonly denote transhipment points connecting the links in the transportation network. Consolidation centres, warehouses, ports, train terminals and airports for instance belong to that category (Manheim, 1979). The inher-ent characteristics of the infrastructure links call for different modes of transportation. Hence, the movement of freight typically involves one or more of the following basic modes: road, rail, air or water. Pipelines are also seen as a mode of transportation; how-ever, their use is limited to liquids, which is why they are disregarded within the scope of this thesis. As companies conduct business at globally dispersed locations, transpor-tation networks have become more complex often comprising more than one mode of transportation and several transhipment points. The combination of two or more modes of transportation is commonly known as intermodal transportation (Coyle et al., 2000).

7
Figure 2.2 exemplifies an integrated intermodal transport chain illustrating actors, ac-tivities and resources. The contractual agreement between consignor and consignee ini-tiates the transport process. Actors conducting the physical movement of goods are car-riers and terminal operators. Examples of typical terminals are ports, consolidation cen-tres or railway hubs. In some cases it has been observed that transport operators fulfil both haulage and transhipment functions (Sternberg, 2008).
Apart from the actors conducting the freight movement, there are other parties involved in the transportation of goods. As a result of the emerging demand for logistics services, the business of Third-Party-Logistics (TPL) has developed (Hertz & Alfredsson, 2003). According to Hertz and Alfredsson (2003) a TPL is an external provider who manages and controls the logistics activities on behalf of a shipper. The idea of TPL goes beyond the traditional freight forwarding business which is specialised in the organisation of lo-gistics processes and the selection of the appropriate transport operator for the goods owner. The arrows in Figure 2.2 indicate the relations among the different actors in the transport chain. The TPL integrates and facilitates information exchange among the dif-ferent actors in the transport chain. Typically an integrated transport chain comprises picking up of the goods from the consignor and delivering them by short haulage to a transhipment point or terminal. From there, goods are transferred to a long haulage transport, which can for instance be executed by rail. This transport is followed by an-other transhipment point and a short haulage transport, before the goods reach the con-signee (Woxenius, 1997). This illustrates that many different types of actors, activities and resources are required when transporting goods from the sender to the receiver (Woxenius, 1997).
Haulier
Road
Haulage
Road
HaulageTrans-
shipment
Trans-
shipmentTrans-
shipment
Trans-
shipmentRail
Haulage
Rail
HaulageRoad
Haulage
Road
Haulage
Lorry Terminal TerminalRail wagons Lorry
Infrastructure
Terminal
Company
Railway
Adminis-
tration
Terminal
CompanyHaulier
Forwarding
Agent
Consignee
Authorities
Consignor
TPLProvision of
Sophisticated
Services
Provision of
Sophisticated
Services
Control and
Planning
Control and
Planning
Actors
Resources
ActivitiesCustoms
Clearance
Customs
Clearance
Figure 2.2 An integrated transport chain (adapted from Woxenius, 1997).

8
In this thesis, the presented actors are regarded as the major stakeholders in the trans-portation chain. Moreover, authorities have to be regarded as important stakeholders in the transportation chain being among others responsible for the provision of infrastruc-ture as well as handling of customs duties. A stakeholder by definition is ‘a person, group, or organisation that has direct or indirect stake in an organisation because it can affect or be affected by the organisation's actions, objectives, and policies’ (Business Dictionary, 2011).
2.1.3 The Need for Information in Transportation
As the logistics system has increased considerably in its complexity over the last two decades, likewise the information required by the different stakeholders in the transpor-tation process has augmented (Tilanus, 1997). According to Coyle et al. (1992) high in-formation quality is achieved when right, accurate and understandable information is available where and whenever it is needed in the logistics process. Many studies have been undertaken to examine the information flow necessary for the shipment of goods (Coyle et al., 2000; Kanflo, 1999; Nyquist, 2007). Transportation information originates primarily from transport documents such as Bill of Lading, Proof of Delivery, invoices and specific goods’ documentation.
Kanflo (1999) identified 25 transaction steps that are generally necessary to process one shipment. Of course this varies depending on the range of transport, the actors involved and the goods being shipped. Nevertheless, it becomes evident that numerous transac-tion steps are needed for processing a shipment. Many of these transactions are still car-ried out manually (Kanflo, 1999; Nyquist, 2007). Kanflo (1997) found that freight for-warders and transport operators are struggling most when it comes to setting up efficient information handling systems.
Due to the emergence of sophisticated logistics activities like Merge-in-Transit, JIT or Just-in-Sequence deliveries, the demand for high quality information has increased sig-nificantly (Trappey et al., 2004). Many innovative companies have therefore started to develop ITS-services aiming at automating information exchange with the ultimate goal of creating paperless freight transportation benefiting authorities, terminal operators, carriers, shippers and logistics service providers (E-Freight, n. d.).
2.2 Adoption of Innovative Technology This section provides an introduction to the adoption of innovative technology. The lit-erature review describes the characteristics of innovative technologies, the process of adoption as well as the benefits and impediments associated with the adoption of inno-vative technologies.
2.2.1 Technology and Innovation
Technology is considered a strategic issue in business because in the long run the deci-sion to adopt or reject an innovation affects the firm’s ability to meet customer demand and stay competitive (Hultman, 2007). The term innovation, which is often used as a synonym for a new technology, refers to the ‘idea, practice or object that is perceived as new by an individual or other unit of adoption’ (Rogers, 1995, p. 11). According to Rogers (1995) technology usually has two components, a hardware aspect and a soft-ware aspect.

9
In transportation, ITS is one of the newest trends for more efficient and effective trans-port processes. Recent studies documented the low adoption of the ITS technology: in the year 2007 in Europe only 7% of all firms in the transport and logistics service indus-try adopted ITS-services (European Commission, 2008). In the USA, this figure only amounted to 1% in the same sector.
2.2.2 Technology Adoption and Diffusion
Technology adoption research deals with the question whether an industry, a firm or an individual applies a new technology and what factors influence that decision. Related to this, two different concepts of adoption and diffusion prevail in the literature. Even though often used synonymously, there is a difference between the two terms which is seen in the level of analysis (Hultman, 2007). Whereas the term diffusion is applied on a macro-level (Strang & Meyer, 1993), adoption rather describes a micro-level of analy-sis, i.e. firm or individual (Rogers, 1995).
The adoption process is traditionally seen as a linear, straightforward approach compris-ing a set of stages with the binary option of adoption or non-adoption (Cooper and Zmud, 1990; Prekumar and Roberts, 1999; Rogers, 1995). Based on that, Hultman (2007) delineates the process of adoption as a four stage model consisting of presenta-tion, evaluation, decision and implementation. He likewise extends the model by adding four secondary options after the initial decision to adopt or reject a technology (Hultman, 2007). In essence, he considers adoption as ‘the on-going process of embed-ded interaction by which a technology is developed and eventually decided on by an ac-tor, a decision that should be viewed as a status rather than a one-time decision’ (Hultman, 2007, p. 261).
In the decision stage the advantages and disadvantages of using the innovation are con-sidered and based on that it is decided whether to adopt or reject the technology (Roger, 1995). Rogers (1995) suggests five different forces influencing one’s decision to adopt or reject an innovation. He found that relative advantageousness, compatibility, triabil-ity and observability are positively related to the rate of adoption, whereas complexity of the technology correlates negatively with it.
1. Relative advantageousness refers to the ‘degree to which an innovation is per-ceived as better than the idea it supersedes’ (Rogers, 1995, p. 15).
2. Compatibility is seen as degree to which an innovation is ‘consistent with the ex-isting values, past experiences, and needs of potential adopters’ (Rogers, 1995, p. 15).
3. Triability is the ‘degree to which an innovation may be experimented with on a limited basis’ (Rogers, 1995, p. 16).
4. Observability is understood as the ‘degree to which the results of an innovation are visible to others’ (Rogers, 1995, p. 16).
5. Complexity is the ‘degree to which an innovation is perceived as difficult to un-derstand and use’ (Rogers, 1995, p. 16).
The managerial implications of Hultman’s study suggest that the success of an innova-tion is not necessarily equal to adoption (Hultman, 2007). According to him, the deci-sion to reject an innovation can be deemed a success as well. A company might con-
10
sider a project successful due to the fact that important lessons could be learnt, even if the technology was not implemented.
2.2.3 Impediments and Benefits of Adopting Innovative Technology
Different authors suggest a number of benefits, and impediments when it comes to adopting new technologies. Identified benefits commonly are improvements in produc-tivity, product quality and working conditions (Baldwin & Lin, 2001). Further new technologies can foster reductions in production costs, by reducing labour requirements and inventory levels. Other benefits are reduced energy consumption and increased equipment utilisation (Baldwin & Lin, 2001). Researchers also identify benefits on a strategic level that are supported by the adoption of new technologies. This can for in-stance be the ability to develop and fulfil the market needs or to create a competitive advantage over an opponent (Hultman, 2007).
Baldwin and Lin (2001) identified five influencing factors hindering the adoption of new technologies. Namely these factors are cost, hindering government policies, labour market imperfections, internal organisational problems and imperfections in the market for information. All of the above mentioned impediments influence the adoption of new technologies, however the most commonly mentioned and most important barrier is costs connected to these new technologies (Baldwin & Lim, 2001). Another reason for sluggish or unsuccessful technology adoption is the uncertainty about what benefits and opportunities the new technology can deliver (Nguyen, 2008). In a similar way Levy, Loebbecke and Powell (2003) claim that technology adoption often lacks a proper plan-ning and this results in a lower rate of successful implementations. Further emphasising the uncertainty, Hoppe (2002) argues that a firm will adopt a new technology only if the current estimation of the profitability exceeds the adopter’s reservation level. Moreover, the adopting company has to be convinced that the profitability is not likely to increase by waiting for the arrival of other innovations (Hoppe, 2002). The high uncertainty can be supported by figures illustrating the success rate of IT and ICT projects. About 30% of IT projects are cancelled before being finished and the general failure rate of ICT projects is claimed to be 70% (Hultman, 2007). Likewise, more than half of all ICT pro-jects require a budget of about 200% of the initial estimation (Hultman, 2007). Rogers (1995) sees another impeding factor in the necessity to reach a certain critical mass for new technologies. According to him, it is important that enough users adopt the new technologies in order to further increase the adoption rate and make the innovations self-sustaining. High costs, uncertainty combined with great potential for failure and other influencing factors thus impede the adoption of new technologies.
2.3 Intelligent Transport Systems The following section introduces the concept of ITS. Then, key technological drivers for the development of ITS are described. A broad overview of the existing application areas aims at identifying parts of the transport chain where ITS can be used. Finally, the most important functions that are supported by ITS are presented in detail in order to il-lustrate how ITS can impact business performance.
2.3.1 The Concept of ITS
The term Intelligent Transport Systems is used to describe the application of ICT and its related infrastructure (Giannopoulos, 2009). In other words, it is the integration of

11
communication and control systems that help authorities, operators and individual peo-ple to be informed better and support decision making (European Commission Extra Consortium for DG Energy and Transport, 2001). The components of ITS are not novel, but most of them have been established in the transport sector over years. What is new regarding ITS is the vision of integrating an array of systems to provide real-time in-formation in order to improve business operations, monitoring and information sharing among different stakeholders in the transport chain (Crainic et al., 2009).
Giannopoulos (2009) found in his review of the development of ITS over the last 15 years that ITS are indeed main facilitators of information sharing in transportation, but he also points out that the intelligence part of ITS needs to be improved drastically. He claims that the biggest challenge in the field of ITS is related to the question of how the vast amount of raw data can be converted into useful information and made available to the relevant parties irrespective of their size. Although the benefits of ITS are widely recognised by transport companies, authorities and logistic providers, some factors im-pede the commercial expansion of the system (Ecorys Transport, 2005; Giannopoulos, 2009). These impeding factors are:
• The lack of interoperability, harmonisation, standardisation • The relatively high initial investments required • The lack of knowledge of impacts for different stakeholders • The lack of economies of scale/critical mass required
The latter three go well in line with the impeding factors of new technologies found by Rogers (1995).
Basically, it can be differentiated between two segments of ITS, namely freight and pas-senger ITS, even though in certain areas overlappings may exist (Giannopoulos, 2009). Freight ITS refer to the integrated application of hardware, software and databases for a communication system that primarily aims at enhancing the transport of goods and the related information flows. In contrast, passenger ITS are determined to integrate differ-ent information systems to improve efficiency, safety and customer satisfaction of pub-lic transit. Within the scope of this thesis only freight ITS (hereafter referred to as ITS) are considered.
There is no doubt that the development of key technologies such as GPS and the Inter-net has fostered the growth of ITS in cargo transportation (Giannopoulos, 2009). Differ-ent authors suggest that ITS can be broadly categorised into different application areas (Crainic et al., 2009; Giannopoulos, 2009; US Department of Transportation, 2008). The classification of application areas helps the understanding of where in transport op-erations ITS can be used to leverage business performance. Taking a closer look at the capabilities, it becomes obvious that it is possible to define ITS more precisely based on the functions they fulfil.
2.3.2 Key Technological Drivers of ITS
The ability to connect isolated systems and integrate them into a big framework relies heavily on the following technological evolutions of the last two decades (Sternberg, 2008).

12
Geographic truck positioning is mainly enabled through Global Positioning System (GPS). A GPS receiver, attached to the vehicle receives frequent signals from satellites. Based on the transit time of each message and the location of the satellites, the vehicle location can be calculated. GPS is a facilitator for real-time tracking and tracing of goods, containers and vehicles which enhances monitoring, planning and security within the transport chain. Regarding ITS, GPS supports communication between freight, vehicle, infrastructure and decision-support system by providing accurate posi-tioning information of the target unit so that services such as advance arrival notifica-tion, real-time route planning or transport delay information become possible.
The evolution of ITS is also largely influenced by the advances in Internet technologies. The World-Wide-Web constitutes a virtual marketplace for organisations and allows companies to exchange information in a fast and accurate manner. There is no doubt that the Internet has revolutionised the way organisations engage in business and com-municate with each other. Through the development of Extensible Markup Language (XML) huge sets of data can be transferred between organisations (Power, 2005). It represents a structured mechanism for sending information so that receiving computers can not only read the code, but also the content of the transmission (Power, 2005).
Even if business transactions are increasingly carried out through Internet and E-Commerce, Electronic Data Interchange (EDI) can be considered as one of the initial enabling factors of supply chain collaboration (Crainic et al., 2009). According to Em-melhainz (1990) EDI refers to the standardised, inter-organisational transmission of business documents. Giannopoulos (2009) points out that major shippers, large carriers and infrastructure managers still rely on this technology mainly due to its inherent bene-fits of reducing manual data entry, increased transaction speed, lower communication costs and simplification of procedures.
Furthermore, mobile internet and standard mobile technologies, such as the Global System for Mobile Communications (GSM), facilitate the wireless transmission of mes-sages between in-transit vehicles and the home-base (Giannopoulos, 2009). By this means, both oral information and documents, i.e. indicating route information, can be exchanged efficiently among driver and headquarters as well as other relevant stake-holders. It is important to recognise that not all wireless communication standards are available everywhere. Therefore, it is advisable to have different systems, such as Wifi, 3G or GPRS, in place that mutually complement each other (Stefansson & Lumsden, 2008).
The ability of automatic vehicle and load unit identification mainly enabled by Radio Frequency Identification (RFID) is another critical driver for the ITS development (Giannopoulos, 2009). It is worth noting that RFID is not a novel concept but has been around since the 1940s (Holmqvist & Stefansson, 2007). Basically, a RFID system con-sists of three components: tags, readers and applications for processing the captured data (Holmqvist & Stefansson, 2007). Using RFID in a transportation environment of-fers the advantages of linking relevant information directly to the object and reading in-formation without necessarily being in sight of the object. Likewise, RFID tags are ca-pable of storing a vast amount of data including such information as the object’s serial number, colour or current price (Sternberg, 2008). The RFID technology has spread slowly mainly due to high start-up costs.

13
For data collection several different types of sensors can be used. Road sensors installed in road signs capture among others details about road traffic, vehicle adherence to speed limits or classification of passing vehicles. The recorded data are then transmitted mostly via cable but also wirelessly to the respective authorities for further processing. Another way of data collection is through on-board sensors installed at the vehicle or incorporated in the goods. By this means, detailed information about the functioning and attrition of the vehicle, like break usage or tire wear, can be gathered. It also allows a constant monitoring of the state of the goods, in terms of temperature for instance. Wireless technologies make sure that the data is communicated regularly to where the information is needed.
All these presented technologies constitute sophisticated, useful tools in themselves; however to reap the full benefits, they have to be combined to one integrated system (Stefansson & Lumsden, 2008). The ITS initiative has acknowledged this need for inte-gration to provide reliable, real-time information to the stakeholders in the transport chain for which the information is relevant.
2.3.3 ITS Application Areas
Because of its newness it appears difficult to understand in which areas ITS can be used to enhance business processes in the transport chain. For a better understanding of how ITS can be capitalised on in the transportation industry, they should be broadly classi-fied within their area of application. Recent literature on ITS applications in freight transport suggests different application areas for ITS which are summarised in Table 2.1 (Giannopoulos, 2009; Crainic et al., 2009, Wisconsin Department of Transportation, 2000).
Table 2.1 Application Areas of ITS
Application Areas of ITS Author
Commercial Vehicle Operation Systems, Freight
Operation Systems
Giannopoulos (2009), Crainic et al. (2009), Winconsin
Department of Transportation (2000), US Department
of Transportation (2008)
Fleet Management Systems Giannopoulos (2009), Crainic et al. (2009),
Intermodal Transport Operating Systems Giannopoulos (2009), US Department of
Transportation (2008)
Site-Specific Systems Giannopoulos (2009)
Transport and other Public Administration related
Systems
Giannopoulos (2009)
Giannopoulos (2009) advocates the broad categorisation of ITS into Commercial Vehi-cle Operations (CVO), also known as Freight Operation and Fleet Management Sys-tems. CVO are primarily associated with applications incorporated into trucks and cargo, generally speaking in the transport operator’s sphere of influence, with the main aim of monitoring goods, vehicle and driver in transit. In contrast, Fleet Management applications tend to improve resource planning and likewise asset utilisation of a trans-port operator’s fleet. The biggest goal for applications in this area has been to provide a

14
system for dynamic, real-time fleet coordination and re-routing to respond instantly to changing customer demands as well as road conditions and other external influencing factors (Giannopoulos, 2009).
Giannopoulos (2009) claims that for an evaluation of ITS-services a typology of the ap-plications is helpful and thus classifies the ITS even further. Freight Operation Systems, Intermodal Transportation Operating System, Site-Specific Systems as well as Trans-port and other Public Administration related Systems were considered the most distin-guishing application areas for ITS in freight operations.
First, there are Freight Operation systems which cover just like CVOs the set of applica-tions facilitating the general transport functions like scheduling, loading, consolidation of shipments and positioning. Other more sophisticated functions are presented and dis-cussed in the course of the paper. It is also worth noting that Giannopoulos (2009) dif-ferentiates between logistics systems used before, during and after the transport and di-vides them into on-board and home-based systems.
Another application area of ITS is intermodal transportation. ITS within that category are designed to be interoperable allowing seamless information sharing between all the parties involved in the intermodal transport chain. Along with other projects in this field the SMART-CM project constitutes a perfect example of how to develop an integrated solution to support the interaction of public administration, such as customs, transport operators and terminals. SMART-CM, an intermodal container transport platform, aims at providing a neutral service for secure and interoperable data communication between different stakeholders in the transport chain (SMART-CM, 2008). Other than that, ap-plications run by network operators to collect data on traffic flows can be attributed to this category.
In addition to that, Site-Specific Systems refer to those applications operated at termi-nals, ports or border crossings. One of the most prominent examples in this field is FRETIS, a comprehensive solution for terminal operations and management which was developed and implemented by the port of Thessaloniki. It consists of an array of mod-ules encompassing functions such as yard planning or exit control (Giannopoulos, 2009).
The fourth application area proposed by Giannopoulos (2009) which is relevant for the scope of the thesis is Transport and other Public Administration related Systems which basically comprise systems to enhance efficiency and security in public or private ad-ministrations such as customs. But not only authorities gain from those systems, market players might benefit as well.
Crainic et al. (2009) follow the traditional approach of classifying ITS broadly into CVO and Advanced Fleet Management Systems based on the scope of the system. Ac-cording to Crainic et al. (2009), CVO refer to applications for managing and automating operations at an institutional level whereas Advanced Fleet Management Systems aim at improvements on the carrier or business-to-business level (Crainic et al., 2009). In 2008, the US Department of Transportation identified 17 areas of ITS application dur-ing a cost-benefit analysis of ITS that have been recently deployed in the US (US De-partment of Transportation, 2008). At least two of them are concerned with the im-provement of freight operations: CVO and intermodal freight. The classification of ITS

15
into CVO was also followed by the Wisconsin Department of Transportation (2000) in their framework for the evaluation of benefits of ITS.
2.3.4 ITS Functions
In order to create an understanding about which business processes can be influenced by ITS, the most common functions and capabilities of ITS mentioned in the literature are described in this section. As already indicated when discussing different application ar-eas, ITS can fulfil a vast amount of different functions. Table 2.2 illustrates this variety listing numerous ITS functions mentioned by different authors in the field of ITS. Those functions can seldom be attributed to just a single application area but are found in di-verse contexts. When developing a new ITS-service, different functions are frequently combined to meet specific customer needs and reap the full benefits.
Table 2.2 ITS functions
Safety Information Exchange, Credentials Administration, Electronic Screening, AVL, CAD, Scheduling, Tracking, On-Board Monitoring of Cargo, Freight Tracking, Asset Tracking, Freight Terminal Processes (Tracking), Drayage Operations, Border-Crossing,
US Department of Transportation (2008)
Author Function
Giannopoulos, G.A. (2009) Automatic Vehicle Location (AVL), Computer aided Dispatch (CAD), Re-Routing, Re-Scheduling, Estimated Time of Arrival, Pre-clearance, Load Unit Identification, Electronic Dangerous Goods Documentation, Tracking & Tracing (T&T), Deviation Management, Proof of delivery, Electronic Document Transmission, Terminal management, Automatic Driver Identification, Cargo Anomaly and Threat Detection
Crainic et. al (2009) Electronic vehicle and Cargo Identification, Location and Tracking, Pre-Clearance, In-Motion Verification, Border Crossing, Pre-Approval, Re-Routing,
Stefansson and Lumsden (2009) Commercial Traffic Information, Real-Time Route Planning, Missing Goods Notification, Transport Delay Notification, Pre-Arrival Notification, Order Placement, Transport Booking, Variable Speed Limits, Dangerous Goods Documentation
Wisconsin Department of Transportation (2000)
Safety Assurance, Credential Administration, Electronic Screening
After an in-depth review of contemporary literature in the field of ITS (Crainic et al., 2009; Giannopoulos, 2009; Stefansson & Lumsden, 2009; Wisconsin Department of Transportation, 2000), the following functions were identified as the most relevant with regards to freight transportation in general and the SITS project environment. How these functions were selected is illustrated in Figure 2.3. Those functions rely heavily on the innovative technologies presented earlier in this section.

16
Vehicle Tracking and Tracing
This GPS-enabled service function allows real-time tracking of the vehicle during transport operations.
Cargo Tracking and Tracing
Making use of RFID/GSM (for individual items) and GPS (load units) the location of the cargo can be monitored constantly while stored or in transit.
Dynamic Re-routing
Based on real-time location of the vehicle, the road conditions and as well as the cus-tomer demand, vehicles can be re-routed dynamically.
Dynamic Re-Scheduling
This service function supports dynamic re-scheduling in case of unforeseen transport schedule deviations (i.e. a truck is not able to reach the planned ferry and is automati-cally scheduled on the next one); conversely, speeding-up the shipment can be done automatically (i.e. transport is classified as high priority on a ferry if delivery is critical).
Deviation Management/Estimated Time of Arrival (ETA)
The ETA function updates the supply chain actors automatically on the estimated arrival time at the next transhipment point.
Pre-Clearance
The pre-clearance service aims at clearing drivers, vehicles and cargo according to the border control requirements before entering the inspection facilities.
Pre-Approval
This function pre-approves vehicle, cargo and driver and permits access to certain areas without further inspection.
Automated Vehicle Identification
This function based on technologies such as RFID, license plate recognition and elec-tronic screening provides an automated service for identifying the in-transit vehicle.
Automated Load Unit Identification
Taking Automated Vehicle Identification one step further, Automated Load Unit Identi-fication allows cargo to be identified in detail by using RFID while stored or in transit.
Automated Driver Identification
The automated driver identification supports the administration and transmission of drivers' data/credentials.

17
Automatic vehicle location
Location and tracking
Automated vehicle location
Computer aided dispatch
Computer aided dispatch
Re-Scheduling
Scheduling
Re-Routing
Re-Routing
Real-time route planning
Estimated time of arrival
Pre-Arrival notification
Pre-ClearancePre-Clearance / Boarder
Crossing / ApprovalCredential administration
Credential administration
Load unit identification
Electronic vehicle and cargoidentification
Electronic dangerous goodsdocumentation
Goods type service / Dangerous goods notification
Tracking and tracing
Location and tracking
Tracking / freight tracing / Asset tracking
Deviation management
Transport delay notification
Proof of delivery
Electronic document transmission
Order placement service / Transport booking
Terminal management
Automatic driver identification
Cargo anomaly / threat detection
On board monitoringof cargo
Safety assurance
In motion verification
Electronic screening
Electronic screening
Commercial traffic operations
Missing goods notification
Variable speed limit service
Freight terminal processes / drayage control
Safety information service
Giannopoulos 2009
Crainic 2009
StefanssonLumsden 2009
US department of tranportation 2008
Wisconsin dpt. of transportation
Vehicle tracking and tracing
Load unit tracking and tracing
Dynamic re-routing
Dynamic re-scheduling
Deviation management /
estimatedtime of arrival
Pre-clearance
Pre-approval
Automated vehicleidentification
Automated loadunit identification
Automated driveridentification
Electronic DG documentation
Order placement / transport booking
Cargo monitoring / threat detection
Road information service
Proof of delivery
Figure 2.3 ITS functions overview.

18
Electronic Dangerous Goods Documentation
This function encompasses the identification and tracking of dangerous goods by RFID and GPS as well as the electronic exchange of the associated documents using EDI/XML.
Order Placement /Transport Booking
This service function provides electronic distribution of orders, typically in EDI or XML format, between relevant actors within the supply chain including a common tool for transport booking.
Cargo Monitoring Threat Detection
Cargo monitoring services using on-board sensors update the respective users on the state of the goods and alert them in case of deviations from certain target parameters. It also informs the respective parties in case people try to gain unauthorised access to the goods.
Road Information Service
The road information service provides the vehicle driver with important information on the road condition (including speed limits) and sends automatic warnings to the board computer in case of an unsafe situation ahead (accident, congestion, weather, construc-tion works etc.).
Access Control
Controls the vehicle access to certain restricted areas and alerts the driver or other actors in case of a breach.
Emergency Operations
This service is a tool that facilitates emergency operations by providing real-time infor-mation on i.e. dangerous goods being about to enter critical zones (i.e. tunnels).
2.4 Performance Measurement The review of performance measurement literature serves as a framework for the per-formance measurement process for ITS-services developed in this paper. It starts with a definition of performance measurement and its meaning in the thesis, followed by a de-scription of the supply chain approach to performance measurement. Additionally, this section provides an overview of the three performance measurement phases of design, implementation and use. Finally, common pitfalls in performance measurement are pre-sented.
2.4.1 Definition and Meaning in the Thesis
In the face of economic globalisation and fast changing business environments, compe-tition has increased remarkably in the recent past prompting organisations to take busi-ness opportunities to succeed (Chan & Qi, 2003). The need for improved performance, in turn, requires companies to measure and monitor performance (Keebler, Marodt, Durtsche & Ledyard, 1999). Thus, it is not surprising that a lot of research has been

19
dedicated to the area of performance measurement (Kaplan & Norton, 1996; Kerssens-Van Drongelen & Fisscher, 2003; Neely et al., 2005). Traditionally, performance meas-urement is regarded as the process of quantifying efficiency and effectiveness of an ac-tion (Neely et al., 2005). Many companies have acknowledged the benefits of perform-ance measurement which range from the identification of improvement potential and the evaluation of past actions, over improved communication to higher employee motiva-tion (Behn, 2003; Rohalstandas, 1995; Waggoner, Neely & Kennerly, 1999). Perform-ance measurement in its original sense is commonly understood as an on-going process and is usually part of a company’s continuous improvement process (Bond, 1999).
In this thesis, performance measurement is regarded from a slightly different angle. The general definition of performance measurement, being a process of quantifying effi-ciency and effectiveness of an action (Neely et al., 2005), is still very accurate; however the reasons for conducting the measurement are fundamentally different. The driving force behind the measurement is not the detection of process deficiencies but rather the assessment of how well a problem area can be improved through a certain action, in this case through the implementation of a new ITS-service. Instead of being part of an or-ganisation’s continuous improvement, it should be seen as a crucial part in system per-formance testing. Despite the different perception of performance measurement, many of the basic principles still apply in this context and are discussed in the following sec-tions.
2.4.2 The Supply Chain Approach to Performance Measurement
SCM has been defined in this thesis as the strategic approach to integrate inter-organisational processes to maximise customer value at the lowest system-wide cost. Coordination of supply chain activities is key for a successful implementation of this management strategy (Frohlich & Westbrook, 2001). This change in management think-ing has also altered the way companies need to assess performance. Several authors suggest that performance measurement can no longer be focused on internal processes but has to include the evaluation of system-wide activities (Cooper, Lambert & Pagh, 1997; Gunasekaran, Patel & Tirtiroglu, 2001; Holmberg, 2000). Following that reason-ing Chan et al. (2003) argue that performance measurement should take a holistic view that goes beyond organisational boundaries.
Due to the increasing demand for supply chain performance measurement frameworks, researchers have adjusted existing performance measurement tools to the supply chain context and developed new measurement systems that are designed to capture system-wide performance. One of the most popular measurement tools, the balanced scorecard invented by Kaplan and Norton (1992), was modified to the supply chain context by Brewer and Speh (2000). The Supply Chain Council developed a comprehensive Sup-ply Chain Operations Reference model (SCOR) which integrates Business Process Re-engineering, Benchmarking, and Best Practice Analysis into a cross-functional frame-work (Supply Chain Council, 2006). In line with the SCOR model, Chan and Qi (2003) proposed a process-based approach to measure supply chain performance. It is worth noting that all of the presented measurement systems are designed to facilitate continu-ous improvement.

20
2.4.3 The Phases of Performance Measurement
Performance measurement can be divided into the phases of design, implementation and use (Bourne et al., 2000). In the design phase it is crucial to identify the key objectives to be measured and design the metrics to be used. Implementation is seen as the phase in which systems and procedures are put in place to collect and process the data. Fi-nally, the measures should be used to both evaluate the purpose of the action and chal-lenge the underlying strategy (Bourne et al., 2000).
2.4.3.1 Design of the Measurement
The design phase of performance measurement can also be described as the planning or preparation of the measurement. Bourne et al. (2000, p. 760) claims that this phase is mainly about ‘translating views of customers and other stakeholders needs into business objectives and appropriate performance measures’.
Thus, the design phase is about finding out, together with the customers and other stakeholders, how they perceive performance with regards to the new ITS-service and select performance indicators accordingly. As stated earlier, performance is expressed in terms of efficiency and effectiveness. According to Mentzer and Konrad (1991, p. 34) effectiveness is ‘the extent to which a goal is accomplished’, whereas efficiency de-scribes ‘how well the resources expended are utilised’. In the transport context, effec-tiveness is about achieving pre-defined objectives such as delivery-on-time. Efficiency on the other hand expresses the ability to manage the resources, like labour and vehi-cles, economically. Langley and Holcomb (1992) added differentiation to the definition of performance. Based on that, Fugate, Mentzer and Stank (2010) suggest that logistics performance can be seen as a multi-dimensional construct comprising efficiency, effec-tiveness and differentiation. Traditionally, efficiency and effectiveness in a supply chain were seen as mutually exclusive goals (Fisher, 1997), but the research conducted by Fugate et al. (2010) showed that the performance dimensions rather reinforce each other. Lai, Ngai and Cheng (2002) thus argue that performance measurement in trans-port logistics should consider these three different performance aspects. They also state that different actors in the transport chain tend to be more interested in one performance dimension. Transport operators generally focus on operations efficiency, whereas ship-pers and consignees prioritise service effectiveness (Lai et al., 2002). These multiple in-terests must be addressed when assessing performance in transport logistics.
For a better understanding of performance attributes, the dimensions can be further bro-ken down into performance criteria. Literature on performance measurement is full of suggestions of what performance criteria should be considered (Caplice and Sheffi, 1994; Keebler et al., 1999; Supply Chain Council, 2006). Keebler et al. (1999) promote the use of quality, time and cost, whereas the Supply Chain Council (2006) attributes performance to the criteria of assets, cost, reliability, flexibility and responsiveness. Re-source utilisation and productivity are mentioned frequently and could be associated with the efficiency dimension of performance measurement (Caplice & Sheffi, 1994; Chan & Qi, 2003). Reliability and flexibility are found to be appropriate to cover the ef-fectiveness dimension (Supply Chain Council, 2006). Other performance criteria that could provide a competitive edge for a company, like security, safety or sustainability can be subsumed under differentiation. Some of these performance criteria, like produc-tivity, safety or sustainability were also applied by the US Department of Transportation (2008) in their assessment of deployed ITS-services in the US.

21
Based on the customers’ perception of performance, the appropriate measures need to be selected. It is suggested that the measurement system should be based on a few rele-vant measures (Gunasekaran et al., 2004). It is neither possible nor convenient to meas-ure everything. Instead, companies are advised to identify the measures that reflect the greatest impact on the business process. The focus must be on selecting a few good Key Performance Indicators (KPI) that measure only what is important.
But what is the right KPI for a certain process? Plenty of suggestions can be found of what to consider when selecting the KPI. A good measure is (Keebler et al., 1999; Tan-gen, 2004):
• Quantitative • Easy to understand • Defined and mutually understood • Encourages appropriate behaviour • Makes use of economies of effort • Designed in consultation with those whose performance is measured
In addition to that, research in the field of performance measurement advocates that KPI need to be aligned to strategy (Neely et al., 2005). The misalignment of KPI has been identified as one of the major barriers to an effective performance measurement system (Keebler et al., 1999). In order to decide what to measure, it makes sense to start defin-ing what to improve (Performance-Based Management Special Interest Group, 1995).
It is desirable to use standard indicators for logistics performance; however, due to the inherent characteristics of some companies and business processes, this is not always possible. Two of the advantages of using standard indicators are less cost for developing the KPI and a common understanding of the KPI, which means using standard indica-tors facilitate the interpretation and evaluation process and is more cost-effective (Odette, 2007).
Table 2.3 Standard KPI for transport operators (Odette, 2007)
Security
Efficiency
Alert
Security
Alert
Time
Main CriteriaNo. Indicator Description
1 Arrival precision Carrier arrives within agreed time window
2 Pick up discrepancy alert Carrier/Logistics Service Provider alerts (addresses pick up discripancies)
3 No. of incidents Carrier/LSP handles goods properly
4 Later delivery alter Carrier alerts (addresses later delivery)
5 Filling rate in transport equipment
Transport equipment is efficiently used
6 Stock accuracy LSP handles goods properlySecurity
Efficiency
Alert
Security
Alert
Time
Main CriteriaNo. Indicator Description
1 Arrival precision Carrier arrives within agreed time window
2 Pick up discrepancy alert Carrier/Logistics Service Provider alerts (addresses pick up discripancies)
3 No. of incidents Carrier/LSP handles goods properly
4 Later delivery alter Carrier alerts (addresses later delivery)
5 Filling rate in transport equipment
Transport equipment is efficiently used
6 Stock accuracy LSP handles goods properly
Some attempts have been made to recommend standardised KPI for carriers and logis-tics providers (McKinnon, 2009; Freight Best Practice, 2007; Odette, 2007). However,
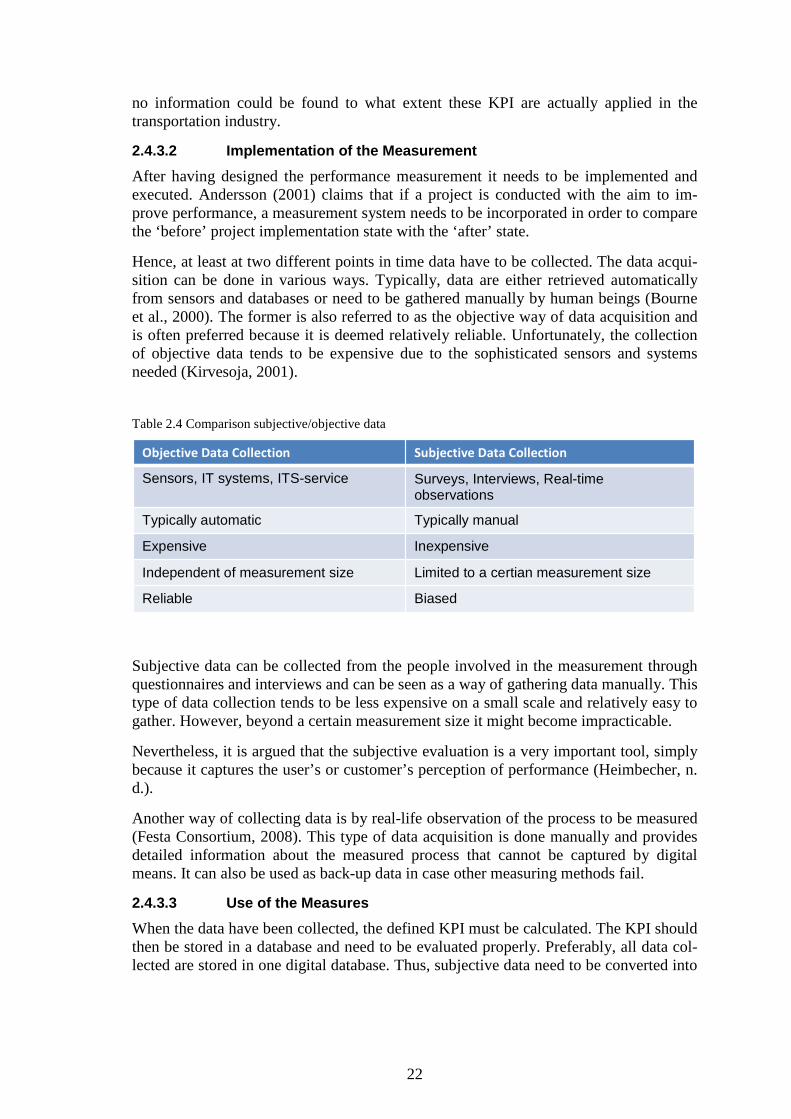
22
no information could be found to what extent these KPI are actually applied in the transportation industry.
2.4.3.2 Implementation of the Measurement
After having designed the performance measurement it needs to be implemented and executed. Andersson (2001) claims that if a project is conducted with the aim to im-prove performance, a measurement system needs to be incorporated in order to compare the ‘before’ project implementation state with the ‘after’ state.
Hence, at least at two different points in time data have to be collected. The data acqui-sition can be done in various ways. Typically, data are either retrieved automatically from sensors and databases or need to be gathered manually by human beings (Bourne et al., 2000). The former is also referred to as the objective way of data acquisition and is often preferred because it is deemed relatively reliable. Unfortunately, the collection of objective data tends to be expensive due to the sophisticated sensors and systems needed (Kirvesoja, 2001).
Table 2.4 Comparison subjective/objective data
Limited to a certian measurement sizeIndependent of measurement size
Objective Data Collection Subjective Data Collection
Sensors, IT systems, ITS-service Surveys, Interviews, Real-time observations
Typically automatic Typically manual
Expensive Inexpensive
Reliable Biased
Limited to a certian measurement sizeIndependent of measurement size
Objective Data Collection Subjective Data Collection
Sensors, IT systems, ITS-service Surveys, Interviews, Real-time observations
Typically automatic Typically manual
Expensive Inexpensive
Reliable Biased
Subjective data can be collected from the people involved in the measurement through questionnaires and interviews and can be seen as a way of gathering data manually. This type of data collection tends to be less expensive on a small scale and relatively easy to gather. However, beyond a certain measurement size it might become impracticable.
Nevertheless, it is argued that the subjective evaluation is a very important tool, simply because it captures the user’s or customer’s perception of performance (Heimbecher, n. d.).
Another way of collecting data is by real-life observation of the process to be measured (Festa Consortium, 2008). This type of data acquisition is done manually and provides detailed information about the measured process that cannot be captured by digital means. It can also be used as back-up data in case other measuring methods fail.
2.4.3.3 Use of the Measures
When the data have been collected, the defined KPI must be calculated. The KPI should then be stored in a database and need to be evaluated properly. Preferably, all data col-lected are stored in one digital database. Thus, subjective data need to be converted into

23
digital format and should be related to the objective data so that they can be analysed together (Festa Consortium, 2008).
There are number of advantages of storing data in a database. A database makes it easier to share data among actors and it helps to reduce redundancies. It also makes the col-lected data more consistent and standardised. The accessibility is increased and data se-curity can be enhanced (Stahlknecht & Hasenkamp, 2004).
A good example of a database in the field of performance measurement is the database suggested by the Federal Aviation Administration (FAA) of the U.S. Department of Transportation. This database serves as a tool to assess the performance impacts of new technologies and procedures on air traffic operators (US Department of Transportation Federal Aviation Administration, 1999).
Searching in the database can be done by keywords, a specific reference or measure-ment type. A researcher can look for which performance measures were associated with specific operations (for instance on route requirements for planes) and filter the database for those items. As a result, the database gives a listing of references of previous con-ducted studies, the performance measures, and the measurement techniques associated with the assessment of on route requirements for planes. With that information, the re-searcher can decide which measurement technique or performance measure best fits the requirements of the current research question.
Apart from storing the data, it also has to be interpreted correctly. The interpretation of subjective data needs to be done very carefully since this type of data can be easily bi-ased. The distortion in the subjective data collection can partly be attributed to the halo effect which describes the influence of a global evaluation on the evaluation of a par-ticular attribute (Nisbett & Wilson, 1977).
Furthermore, it has to be taken into account that performance can seldom be regarded as mono-causal, but has to be seen as the aggregated outcome of a set of actions. Thus, people conducting the measurement need to be aware of the fact that there could be other factors that influence performance. In case people are involved in the studied process, it has been observed that the mere fact of them being part of an experiment al-ters their behaviour and impacts the performance in a positive way (Campbell, Maxey & Watson, 1995). This phenomenon has been known as the Hawthorne Effect and must be considered when evaluating the measures.
For the ITS benefits evaluation there are basically two different approaches: the goal-oriented approach and the economic analysis approach (Wisconsin Department of Transportation, 2000). Following the goal-oriented approach, objectives and target val-ues need to be defined first. Then, specific measures are setup and the measurement is conducted. The performance of the ITS-service is finally determined by comparing the measurement results with the target values. Conversely, the economic analysis approach compares the measured benefits of ITS with the cost associated with the ITS-service. It focuses on assessing whether the benefits are economically beneficial.
Some of the most common methods used for Cost/Benefit Analysis are Cost-Benefit Ratio (CBR), Net Present Value (NPV) and the Payback Period (Californian Depart-ment of Transportation; Birnerová and Král, 2006). See Appendix E for an in-depth de-lineation of the different methods.

24
2.4.4 Pitfalls in Performance Measurement
There are several barriers to an effective performance measurement system. In certain assessments it is crucial to observe the measures over a long time period in order to ac-tually capture the performance change (Keebler et al., 1999). Long-term measurements, however, might require not only plenty of resources but also a great deal of patience to see the results of the study. As mentioned earlier, different performance interests prevail among the parties in the transport chain. These differences must be addressed carefully in order to show performance impacts for all the stakeholders involved in the transporta-tion process. Finally, the selection and design of KPIs, the data collection as well as the evaluation of the measurement results tend to take time and require plenty of both fi-nancial and human resources (Keebler et al., 1999).

25
3 Research Method This chapter describes how the research for this master’s thesis was conducted and ex-plains why a specific strategy was followed. First the research strategy that was applied in this thesis is presented. Second, the different sources of data are described and the reliability, validity and objectivity are discussed.
3.1 Research Strategy To answer the research question and fulfil the purpose of the thesis, the following re-search strategy has been used.
Em
pir
ica
lT
he
ore
tica
l
23
45
61Theoretical
Framework
Observations
and Interviews
Analysis
Validation
Results
Conclusion:
Management
Guidelines / Steps
for PM in
ITS
Time
Pro
ble
m
Figure 3.1 Research strategy in this master’s thesis.
Figure 3.1 shows the research approach of this thesis. It demonstrates which activities required theoretical- and which empirical input. Also, it illustrates the chronology of events during the research process. For instance, parts of the literature study were done simultaneously with executing interviews and observations.
Prior to executing the theoretical and empirical research, the problem was formulated. This included the formulation of the purpose, the background and the relevant research question. A brief introduction about trends in transportation and IT-technology was also given. The problem formulation and the research question are presented in Chapter 1.
The research was conducted on two different levels, a theoretical and an empirical. One part was to study literature that was relevant in order to answer the research question and to deepen the authors’ knowledge in the field. The focus of the literature study was on the topics of transport logistics, technology adoption, ITS and performance meas-urement, which set the frame for the thesis. The second part of the research comprised interviews and observations. In order to identify what is critical when assessing ITS per-formance impacts, interviews with stakeholders that already make use of ITS or poten-tially will do so in the future were conducted. It was important to get an understanding of their operations and their roles in the transport chain. The theoretical framework, be-ing one part of the research, is presented in Chapter 2. The results from the conducted interviews are presented in the empirical research section that can be found in Chapter 4.

26
With the input from theory and the findings from the empirical research, key activities for assessing ITS performance impacts are proposed. The different phases of perform-ance measurement and the important activities for each phase are described in Chapter 5.
To validate the proposed findings from the first round of empirical research, they were tested on one actual ITS-service, known as ‘Geofencing’, which is to be implemented at a haulier. The validation was conducted in a focus group consisting of the company de-veloping the Geofencing service and the particular haulier. Empirical findings from the focus group study and the analysis of the findings are summarised in Chapter 6.
Chapter 7 presents the results of combining the findings from the first round of empiri-cal research with the findings from the focus group study. Based on the analysis in Chapter 5 and Chapter 6, the performance measurement process is delineated.
The results are followed by a conclusion, reviewing the findings of the presented study. These concluding words can be found in Chapter 8.
The master’s thesis ends with a discussion, recommendations and further research sug-gestions. Strong and weak points of the thesis are discussed, recommendations about the applicability of the outcomes are made and further research with regards to the pre-sented study is suggested. These final remarks are summarised in Chapter 9.
3.2 Quantitative and Qualitative Research There are two different ways of gathering data. Quantitative methods generally use numbers, are deductive and need an initial hypothesis (Bryman & Bell, 2007). Qualita-tive research does not necessarily need a hypothesis to start with. It focuses on fewer individuals and is based on words and observations. Qualitative research seeks to under-stand social reality rather than focusing on statistical analysis and it aims at providing rich description of people and processes in their natural setting (Bryman & Bell, 2007).
Due to the novelty of ITS and a lack of theoretical knowledge about performance meas-urement with regards to ITS, a smaller number of stakeholders was interviewed in-depth. The aim was to get their perspective of ITS performance impacts and how they can be measured and evaluated. For that reason, it was decided to apply qualitative methods in order to get as detailed insights into the subject area as possible.
3.3 Data Collection A pre-understanding about the subject area was fostered by being exposed to experi-enced co-workers and by having personal communication with several employees at VTEC. However, great amounts of data needed to be gathered from other sources in or-der to be able to conduct the study. The collected data consist of both primary and sec-ondary data. Secondary data are data that were collected and documented previously, for a purpose other than the problem at hand. In contrast, primary data are data that are to be collected for the specific question that is to be analysed (Hox & Boeije, 2005). The source for the primary data is the input from interviews, observations and a focus group. Primary data were collected during the empirical research before proposing the critical measurement activities and also during the focus group validation. The literature study to formulate the theoretical framework collected secondary data from various sources.

27
3.3.1 Literature Study
The data collection began with the study of relevant literature, which was used to for-mulate the theoretical framework presented in Chapter 2. The data were collected from various sources. A variety of books and articles was used to form the background in transportation and performance measurement, mostly articles were used to summarise the latest developments in ITS. This approach was followed due to the fact that articles are usually more up-to-date than books and in the fast moving field of information tech-nology it is important to have current data. Furthermore, results from recent European Commission studies were used to contribute to the theoretical framework.
3.3.2 Interviews
In total, eight interviews with different stakeholders in transport operations were con-ducted. By interviewing different actors in the transport chain, the authors wanted to identify the stakeholders’ current use of ITS and performance measurement. The inter-view partners were selected with the aim to cover all the important roles, relevant within the scope of this thesis. With DHL and DB Schenker, two freight forwarders were in-cluded in the research. Volvo Logistics takes the role of a TPL and terminal operator. Likewise, Stena Line can be seen as a terminal operator, but also as an operator of fer-ries. Covering for the function of a haulier, Fraktkedjan Väst was included in the list of interviewees. To get the standpoint of an authority, Trafikverket served as an important source of input. Lastly, it was interesting to get the perspective of an ITS researcher and for that reason an interview with Per-Olof Arnäs from Chalmers University was con-ducted. With this selection of interviewees, the important areas of freight forwarders, hauliers, terminal operators, ferry operators, TPL providers, authorities and researchers were covered. The roles of these interviewees in the transport industry with regards to ITS are twofold: freight forwarders, hauliers, terminal operators, ferry operators as well as TPL providers can be seen as users of ITS-services, whereas researchers are rather seen as initiators. Authorities play a hybrid role by initiating and using ITS-services.
Most of the interviews were conducted with only one interview partner at the time; however both DB Schenker and Trafikverket decided to answer the interview questions in a team of two. This was not a problem at all; it rather turned out to be a good way to get even more knowledgeable input.
Table 3.1 shows a summary of the people that were interviewed. In order to give the reader a better understanding of the interviewees’ background, their function in the company is added.
In qualitative research, interviews can either be unstructured or semi-structured. Un-structured interviews make use of a brief set of notes to guide the interview and inter-viewees are allowed to respond and elaborate freely (Bryman & Bell, 2007). This type of interview almost has the character of a conversation. A semi-structured interview makes use of an interview guideline and the researcher has a list of rather specific ques-tions that have to be answered. However, the interviewee still has a lot of freedom in answering the questions. Semi-structured interviews give a great deal of flexibility for the interview process, but by and large the same questions with a similar wording will be used for all interviewees (Bryman & Bell, 2007).

28
Table 3.1 Interviews conducted during empirical research
Name Company Position Interview Date
Susanne
Jonasson
Volvo Logistics Logistics Developer 25.02.2011
Arne Hagberg Volvo Logistics IT-Demand Manager 10.03.2011
Christer
Kjellberg
Stena Line IT-Demand Manager 02.03.2011
Stina Axelsson DB Schenker IT Manager Terminal and Transpor 08.03.2011
Fredrik
Jonasson
DB Schenker IT Development Project Manager 08.03.2011
Steve Hanley-
Cook
DHL Vice President FTL & Intermodal
Business Development Operations
& Network
09.03.2011
Eva Knutson Fraktkedjan Väst IT-Demand Manager 17.03.2011
P.O. Arnäs Chalmers University Researcher/Consultant 17.03.2011
Anders
Ekmark
Trafikverket Project Manager Operation,
Railway
07.03.2011
Micael
Thunborg
Trafikverket Marketing Traffic Railway 07.03.2011
In this thesis, when interviewing the stakeholders engaged in the transport chain, semi-structured interviews were used. This gives the interviewees the chance to give more in-put on topics that are deemed important and they have the possibility to elaborate more when it seems appropriate. Likewise, the authors were able to ask additional questions when necessary. The decision to use semi-structured interviews turned out to be appro-priate due to the newness of the field of ITS. In most of the interviewed companies the use of ITS was in its initial stages which was why the questions were then asked in re-gards to conventional IT systems that are used and have already been implemented. As ITS is a further development of IT and ICT, this was deemed to be reasonable and the best approach to get valuable input to answer the research question.
For 7 of the 8 interviews the same interview guideline was used and only in one case the questions were differing from the template. For the interview with researcher Per-Olof Arnäs, the questions needed to be amended in order to fit the purpose of the interview. Since the position of a researcher differs, due to the fact that this actor will not actually make use of the systems in research, questions needed to be asked from a different per-spective. However, the questions were covering the same main categories to ensure the usability of the result in the later process. The amended interview guideline can be found in Appendix B.
3.3.3 Observations
To complement the interviews described in section 3.3.2, observations served as another source of data. The observations primarily aimed at understanding the processes and fa-cilitated to ask the right questions during the interviews. Likewise, they fostered the un-derstanding of the current use of ITS and helped at proposing important activities for a

29
measurement. The observations were done during an early stage of the research at the Stena Line ferry terminal in Gothenburg and encompassed an introduction into the processes at the check-in office as well as a tour along the quayside. The tour given by Paula Wiberg (Team Leader Stena Line Majabbe) facilitated the understanding of the operations connected to the check-in of trucks and the loading of the ferry.
3.3.4 Personal Communication
The authors had a number of personal conversations with colleagues at VTEC that served as a valuable source of data for this master’s thesis. M. Gunarsson gave input about problems that need to be considered during a measurement process and D. Zack-risson pointed out factors that can distort the results of a measurement process.
3.3.5 Focus Group
To validate the proposed findings from the literature study and the conducted inter-views, a focus group method was used. Together with the ITS developing company Ve-hCo and one of their customers empirical material was gathered. A focus group is a spe-cific form of group interview that explores one particular topic in detail and aims to fa-cilitate a discussion among the group participants (Bryman & Bell, 2007). The setting of a focus group is relatively unstructured and people that have knowledge about the phe-nomenon that is studied are encouraged to interact (Bryman & Bell, 2007). In a focus group the researcher, which at the same time is the moderator, provides a rather unstruc-tured setup and participants are supposed to uncover the issues of the topic area they are confronted with. In this way a wider variety of views can be observed and it can be seen how participants make sense of the phenomenon of study. This can lead to a more real-istic outcome than ordinary interviews or group interviews (Bryman & Bell, 2007).
The focus group conducted with VehCo and their customer was moderated by the two authors and a lot of freedom to elaborate on the topic of interest was given to the par-ticipants. The answers were documented in different ways. For some tasks the partici-pants were asked to write ideas on post-it notes, other answers were captured on previ-ously custom-made templates.
3.4 Reliability, Validity and Objectivity Every type of research has to be critically evaluated. Patton (2001) states that reliability and validity are important parts of every qualitative research. Thus, the following sec-tions will analyse the master’s thesis reliability, validity and objectivity.
3.4.1 Reliability
Reliability describes if a study conducted under the same circumstances would give the same results. According to Yin (2008), the goal of reliability is to minimise errors and keep the study unbiased. Even though the term reliability is commonly used to test or evaluate quantitative research, it is most often likewise used for qualitative methods (Golafshani, 2003). Some authors are more specific about the term reliability and use ‘dependability’ as the corresponding term for qualitative research (Lincoln & Guba, 1985). When referring to the reliability of an interview study, it refers to the degree of consistence of the executed interviews (Kvale, 1996). In this master’s thesis semi-structured interviews were used for the empirical research and, with one exception, the same interview guidelines that can be found in Appendix A, were used for all of the in-

30
terviews. All interviews were prepared, recorded and transcribed and after the transcrip-tion a copy was sent to the interviewees to confirm the content. Some of the interview-ees’ statements were amended and the revised transcript was used for the research. Fur-thermore, the results of the interviews were discussed among the two authors to ensure that both authors interpreted the answers in the same way. This procedure was followed in order to ensure a high reliability of the collected data.
3.4.2 Validity
According to Bryman and Bell (2007), there are two types of validity in qualitative re-search: internal validity and external validity. Internal validity refers to the match be-tween the researchers’ observations and the theoretical ideas they propose. The external validity describes how findings can be generalised for other cases (Bryman & Bell, 2007).
In this research, the interviews have been well prepared, and the interviewees have been informed about the purpose of the thesis before the interview was started. It was made clear what the focus of the research was, in order to enable the interviewees to suggest other interview partners in case they were not able to answer the questions. Following this approach increased the validity, since only actors that are knowledgeable in the top-ics that were of pivotal importance for this paper were interviewed.
Even though the measurement process was proposed based on the input of a number of different interviewees, with different roles in the transport chain, and a variety of litera-ture sources, the external validity was only validated on one specific service. This vali-dation was conducted as a focus group in cooperation with an ITS developing company and one of their customers. However, the study has shown that a lot of companies in transportation act alike, have a similar work culture and corresponding processes.
3.4.3 Objectivity
This master’s thesis was initiated by Volvo Technology and supervised by Jönköping International Business School. There is a risk that the initiator of the thesis might want to influence the direction of the research, to fulfil its demands. Paulsson (1999) points out that it is important to take advice from the initiator, but that all research decisions have to be taken by the researchers themselves. In this master’s thesis, the initiator gave important advice and input, but also gave the authors the ability to guide the thesis and decide how to conduct the research. The outcome of this thesis can not only be used by VTEC, but also by other companies that develop ITS-services.

31
4 Empirical Research The focus of this chapter is to present the findings from the empirical research con-ducted as described in the research strategy. The main answers are grouped into the two main topic areas of ITS and performance measurement presented in the theoretical framework. Further, the answers are clustered around the focus of the interview ques-tions. Additionally, the answers of different stakeholders are contrasted in the text and for a better overview, the main findings are summarised separately in a table for each focus area.
4.1 Intelligent Transport Systems The following section depicts the main findings from the empirical research regarding the use of ITS, system testing and implementation, ITS impact areas as well as stake-holder involvement.
4.1.1 Use of ITS
During the interviews it became apparent that the concept of ITS has not been fully es-tablished in the transport industry. Almost every interviewee struggled defining what ITS are and often referred to either ITS enabling technologies or traditional IT systems instead. Arne Hagberg (Volvo Logistics) indicated the extensive usage of RFID in the company’s transportation processes, whereas both DB Schenker and Eva Knutson (Fraktkedjan Väst) described the successful implementation of a mobile data device for truck drivers which fulfils functions such as mobile order management or mobile mes-sages. Only the Geo-fencing technology which among others aims at providing ETA and is currently tested by Fraktkedjan Väst in cooperation with the system provider Ve-hicle Communications (VehCo) can be considered an ITS by definition. Nevertheless, any party interviewed expressed a keen interest in the new technology and stated clearly that new services are absolutely needed for improved transportation processes. As one of the most desired function of ITS, ETA is mentioned frequently by the different stakeholders. For Stena Line, Volvo Logistics and Fraktkedjan Väst this function would considerably enhance the planning process for loading and unloading.
Table 4.1 Use of ITS
Function Main StatementsCompany Function Main StatementsCompany
Ferry /
Terminal
Operator
• Not exactly making use of ITS
• Difficult to define what ITS really are
• ETA interesting input since it enhances the planning for the port
Stena Line Ferry /
Terminal
Operator
• Not exactly making use of ITS
• Difficult to define what ITS really are
• ETA interesting input since it enhances the planning for the port
Stena Line
Logistics
Provider
• No real ITS in place
• Preliminary stage ITS like RFID techniques are used
• ETA interesting for better allocation of loading slots at the terminal
Volvo Logistics Logistics
Provider
• No real ITS in place
• Preliminary stage ITS like RFID techniques are used
• ETA interesting for better allocation of loading slots at the terminal
Volvo Logistics
Freight
Forwarder
• ITS are used to a certain extent
• System for information sharing between Schenker, truck drivers and
haulier (Mobile Data Project)
DB Schenker Freight
Forwarder
• ITS are used to a certain extent
• System for information sharing between Schenker, truck drivers and
haulier (Mobile Data Project)
DB Schenker
Freight
Forwarder
• Very fragmented IT infrastructure
• Tracking and Tracing (of the load unit) used to a large extent
• Scanning of Pick-Up and delivery
DHL Freight
Forwarder
• Very fragmented IT infrastructure
• Tracking and Tracing (of the load unit) used to a large extent
• Scanning of Pick-Up and delivery
DHL

32
Traffic
Authority
• Not really sure if ITS are used
• In railway RFID tags are used
• Various projects: secure parking places, city logistics, congestions charging,
road safety projects
Trafikverket Traffic
Authority
• Not really sure if ITS are used
• In railway RFID tags are used
• Various projects: secure parking places, city logistics, congestions charging,
road safety projects
Trafikverket
Haulier • No established ITS in place
• Planning to make use of ITS in the future
• Geofencing is currently tested on the company’s premises and should be
used to provide ETA
Fraktkedjan
Väst
Haulier • No established ITS in place
• Planning to make use of ITS in the future
• Geofencing is currently tested on the company’s premises and should be
used to provide ETA
Fraktkedjan
Väst
Logistics Phd. • ITS are difficult to define
• There are public and commercial systems that are targeted for different
markets
• What is important is the “intelligence” part of ITS, refers also to “active”
and “passive” goods
Per Olof Arnäs Logistics Phd. • ITS are difficult to define
• There are public and commercial systems that are targeted for different
markets
• What is important is the “intelligence” part of ITS, refers also to “active”
and “passive” goods
Per Olof Arnäs
4.1.2 System Testing and Implementation
Among the interviewees the common opinion prevailed that testing is an important step when implementing a new system, regardless of whether it is a conventional IT system or a new ITS-service. Most of the interviewees talked about the testing and implementa-tion of IT since they have not implemented any ITS-services yet. However, they ex-pressed major similarities with IT systems and thus referred to IT testing and implemen-tation when giving suggestions and examples regarding that question.
Many stakeholders pointed out that it is vital to test the system first on a small-scale scenario before the actual rollout. Likewise, Steve Hanley-Cook (DHL) described how DHL typically pilots new systems in one or two countries. There are different factors mentioned when it comes to the selection of the test scenario. According to Christer Kjellberg (Stena Line) it is vital to have accessibility to the location of the scenario. Ac-cessibility and proximity were also described as vital factors by Volvo Logistics and Eva Knutson (Fraktkedjan Väst). The latter even started with some simple system trials on the own premises when testing the Geofencing technology.
Test scenarios need to be designed carefully in order to make sure that they are repre-sentative for the business process that is supposed to be enhanced. DB Schenker sug-gested that they should be representative and cover the entire business operations. When they piloted the Mobile Data project they implemented the system first only in 50 trucks comprising city trucks, line-haul trucks and special vehicles such as refrigerated vehi-cles. Moreover, many interviewees pointed out that it is critical to cooperate with key accounts and partners when testing a new system. According to Christer Kjellberg (Stena Line) having a ‘closed loop business case’ is one of the critical factors in system testing.
Table 4.2 System testing and implementation
Function Main StatementsCompany Function Main StatementsCompany
Ferry /
Terminal
Operator
• Testing on small-scale scenario (i.e. eFreight)
• Scenario selection based on accessibility, customer involvement
• It is important to have a closed loop business case
Stena Line Ferry /
Terminal
Operator
• Testing on small-scale scenario (i.e. eFreight)
• Scenario selection based on accessibility, customer involvement
• It is important to have a closed loop business case
Stena Line

33
Logistics
Provider
• Flexible strategy when implementing new systems
• Test scenarios are selected based on proximity, size and
representativeness
• When complexity and the impact of the systems are unsure, a pilot is run
• Start with system components and learn how to make use of it
Volvo Logistics Logistics
Provider
• Flexible strategy when implementing new systems
• Test scenarios are selected based on proximity, size and
representativeness
• When complexity and the impact of the systems are unsure, a pilot is run
• Start with system components and learn how to make use of it
Volvo Logistics
Freight
Forwarder
• Based on customer requirements, management decides which ITS to
implement
• Representative samples (small, long-haul, refrigerated trucks) are picked
to test new systems
• Follow up and evaluate the implementation process
DB Schenker Freight
Forwarder
• Based on customer requirements, management decides which ITS to
implement
• Representative samples (small, long-haul, refrigerated trucks) are picked
to test new systems
• Follow up and evaluate the implementation process
DB Schenker
Freight
Forwarder
• Normally a new system is piloted in one or two countries that are
cooperating
DHL Freight
Forwarder
• Normally a new system is piloted in one or two countries that are
cooperating
DHL
Traffic
Authority
• No specific steps mentioned
• Testing is done with partners (EU, harbour, municipality) that are
interested in the use of the new system
Trafikverket Traffic
Authority
• No specific steps mentioned
• Testing is done with partners (EU, harbour, municipality) that are
interested in the use of the new system
Trafikverket
Haulier • Select only a few trucks at the beginning
• Start with trucks and routes where there is a lot of manual communication
needed; for Geofencing: first trials on the premises
• Select more complicated scenarios with bigger potential benefits
• Educate small groups of people
Fraktkedjan
Väst
Haulier • Select only a few trucks at the beginning
• Start with trucks and routes where there is a lot of manual communication
needed; for Geofencing: first trials on the premises
• Select more complicated scenarios with bigger potential benefits
• Educate small groups of people
Fraktkedjan
Väst
Logistics Phd. N.A.Per Olof Arnäs Logistics Phd. N.A.Per Olof Arnäs
4.1.3 ITS Impact Areas
The performance impacts through ITS are manifold and obviously depend on the func-tions and characteristics of the developed services. Some interviewees were able to name general areas where they expect ITS to impact their business. Most of them re-ferred to current IT or ITS projects when specifying how exactly ITS are able to en-hance the operations. Christer Kjellberg (Stena Line), for instance, identified internal ef-ficiency gains through the eFreight project in terms of reduced time spent on check-in/-out procedures at the ferry terminal if trucks could arrive as ‘pre-approved’ when reach-ing the terminal. Administration costs could be cut consequently. Likewise, he brought out that hauliers and freight forwarders could benefit from the specific project mainly due to reduced lead times. DB Schenker referred to the corporate goals of quality, effi-ciency and environment when it comes to the question of where ITS are most likely to impact the business. DB Schenker particularly aims at reducing the overall time of the transport process, whereas the hauliers tend to see the main benefit in the reduction of manual work. This goes in-line with the answers provided by Steve Hanley-Cook (DHL) who said that the impacts through ITS are twofold: a reduction in DHL’s and the hauliers’ front-office and back-office Full-Time Equivalent (FTE) requirements as well as a higher customer service provided.
Trafikverket is dedicated to increase the competitiveness of the Swedish market through improvements in the transportation infrastructure which could be realised through the use of ITS. Companies acting on the Swedish market and firms considering moving their business to Sweden could be seen as their customers for which they would like to enhance the service level. It is also mentioned that the implementation of ITS in an al-ternative mode, i.e. railway, could trigger a modal shift, in this case from road to rail-way. Eva Knutson (Fraktkedjan Väst) suggested that ultimately it is the customer, who buys the transportation service, that decides what are the main impact areas of the newly

34
developed ITS-service. However, it was commented that usually Fraktkedjan Väst pre-sents the whole package of benefits to the customers when trying to implement a new system. Moreover, both Christer Kjellberg (DHL) and Steve Hanley-Cook claimed that security impacts are rather seen as prerequisites than direct benefits that could be sold to the customers.
Table 4.3 ITS impact areas
Function Main StatementsCompany Function Main StatementsCompany
Ferry /
Terminal
Operator
• Difficult to rank impact areas
• Efficiency impacts (less time spent on check-in/-out procedures)
• Impacts for hauliers in terms of reduced lead times
• Security is seen as necessity
Stena Line Ferry /
Terminal
Operator
• Difficult to rank impact areas
• Efficiency impacts (less time spent on check-in/-out procedures)
• Impacts for hauliers in terms of reduced lead times
• Security is seen as necessity
Stena Line
Logistics
Provider
• ITS can give information about “real behaviour” that could be used for
root-cause analysis
• Potential cost savings through automated availability of information that
usually has to be paid for
• Reduce congestion/queuing at terminal through ETA
Volvo Logistics Logistics
Provider
• ITS can give information about “real behaviour” that could be used for
root-cause analysis
• Potential cost savings through automated availability of information that
usually has to be paid for
• Reduce congestion/queuing at terminal through ETA
Volvo Logistics
Freight
Forwarder
• Quality, Efficiency, Environment which are also the corporate goals
• Ranking of these impact areas might be difficult
• Schenker wants to reduce the overall time for the transport
DB Schenker Freight
Forwarder
• Quality, Efficiency, Environment which are also the corporate goals
• Ranking of these impact areas might be difficult
• Schenker wants to reduce the overall time for the transport
DB Schenker
Freight
Forwarder
• ITS mainly effects the level of customer service
• Reduction in manual communication
• Effecting FTE back-office and front-office requirements
• Security is a prerequisite
DHL Freight
Forwarder
• ITS mainly effects the level of customer service
• Reduction in manual communication
• Effecting FTE back-office and front-office requirements
• Security is a prerequisite
DHL
Traffic
Authority
• Modal shifts can be triggered
• Impacts on the reliability of train operations, i.e. through automated
clearance of cargo or ETA
• Increased attractiveness and competitiveness of the Swedish market
Trafikverket Traffic
Authority
• Modal shifts can be triggered
• Impacts on the reliability of train operations, i.e. through automated
clearance of cargo or ETA
• Increased attractiveness and competitiveness of the Swedish market
Trafikverket
Haulier • Customer decides what should be the most important impact areas
• Usually the whole package is presented
Fraktkedjan
Väst
Haulier • Customer decides what should be the most important impact areas
• Usually the whole package is presented
Fraktkedjan
Väst
Logistics Phd. • Consider the impacts on different levels: cargo, resources, infrastructure,
actors
Per Olof Arnäs Logistics Phd. • Consider the impacts on different levels: cargo, resources, infrastructure,
actors
Per Olof Arnäs
4.1.4 Stakeholder Interaction
All the interviewees mentioned that in system development there is typically a lot of in-teraction between system developers, key accounts and other stakeholders. The level of stakeholder involvement seems to depend on the complexity and specifications of the service. Per-Olof Arnäs pointed out that an aggregated ITS-service, consisting of com-ponents provided by different suppliers, tends to require more stakeholder involvement than an end-to-end solution, in which hard- and software come from only one supplier. Likewise, Steve Hanley-Cooks (DHL) stressed the fact that tailor-made services, i.e. for electronics manufacturers, require a lot of customer interaction. Both DB Schenker and Eva Knutson (Fraktkedjan Väst) emphasised the importance of getting the feedback from the users of the system, which could be the drivers or the people working at the administration office. Many interviewees pointed out that it is critical to assess the im-pacts for different potential stakeholders of the new ITS. Christer Kjellberg (Stena Line) claimed that the benefits of ITS need to be made clear and promoted accordingly to all

35
parties that have an interest in the system. Volvo Logistics suggested that new ITS should be initiated by the big players in the transportation industry. In the Mobile Data project that was the case when DB Schenker, as the world’s fifth biggest contract logis-tics provider, decided to develop the system and implement it into the hauliers’ trucks.
Table 4.4 Stakeholder Interaction
Function Main StatementsCompany Function Main StatementsCompany
Ferry /
Terminal
Operator
• The big picture has to be considered (European or global view)
• It is important to make the benefits clear to all parties
• Market the benefits of the new system
• Involve customers that are looking for improvements themselves
Stena Line Ferry /
Terminal
Operator
• The big picture has to be considered (European or global view)
• It is important to make the benefits clear to all parties
• Market the benefits of the new system
• Involve customers that are looking for improvements themselves
Stena Line
Logistics
Provider
• Interaction with technology suppliers when implementing new systems
• ITS should be initiated by big companies
• Governments should set up the database and infra-structure
Volvo Logistics Logistics
Provider
• Interaction with technology suppliers when implementing new systems
• ITS should be initiated by big companies
• Governments should set up the database and infra-structure
Volvo Logistics
Freight
Forwarder
• Work together with hauliers and involve them in implementation
• Get inputs from customers based on their requirements
• Authorities must be involved when it comes to legal issues
DB Schenker Freight
Forwarder
• Work together with hauliers and involve them in implementation
• Get inputs from customers based on their requirements
• Authorities must be involved when it comes to legal issues
DB Schenker
Freight
Forwarder
• Involvement of customers, i.e. electronics manufacturer when tailor-made
solutions are required
• When implementing the T&T system, no specifically close cooperation
with hauliers
DHL Freight
Forwarder
• Involvement of customers, i.e. electronics manufacturer when tailor-made
solutions are required
• When implementing the T&T system, no specifically close cooperation
with hauliers
DHL
Traffic
Authority
• Interaction with all the stakeholders are vital because there are so many
players that can benefit from ITS
• Trafikverket is the provider of the necessary infra-structure
Trafikverket Traffic
Authority
• Interaction with all the stakeholders are vital because there are so many
players that can benefit from ITS
• Trafikverket is the provider of the necessary infra-structure
Trafikverket
Haulier • Interaction with system developer that asks for customers requirements
• Involvement of drivers and customers that buy the transportation service
Fraktkedjan
Väst
Haulier • Interaction with system developer that asks for customers requirements
• Involvement of drivers and customers that buy the transportation service
Fraktkedjan
Väst
Logistics Phd. • Cooperation between ITS developing company and transport companies
• Depending on the business case of the services
• An aggregated ITS service tends to require more stakeholder involvement
Per Olof Arnäs Logistics Phd. • Cooperation between ITS developing company and transport companies
• Depending on the business case of the services
• An aggregated ITS service tends to require more stakeholder involvement
Per Olof Arnäs
4.2 Performance Measurement The following paragraphs present the main findings from the empirical research con-cerning the stakeholders’ use of KPI, KPI selection, KPI categories, measurement data collection as well as measurement data evaluation.
4.2.1 Use of KPI
The use of KPI in the transport chain seems to be highly dependent on the role of the stakeholder. Some actors do make extensive use of KPI, some use them to a certain ex-tent and others do not make use of KPI at the moment, but expressed an interest in do-ing so in the future. The freight forwarders DB Schenker and DHL make extensive use of KPI on various levels. Volvo Logistics as a TPL is using some KPI, but would like to increase the use and sophistication of the metrics. Likewise, Stena Line is already using KPI, however, only to a limited extent. Fraktkedjan Väst, having the position of a haul-ier is currently not using KPI, due to the fact that customers usually do not ask for that service.

36
Another role is played by the authorities. In this example Trafikverket mentioned that they are highly interested in KPI, but unable to gather the data themselves. As much as they would like to make use of KPI, they have to rely on other parties in the transport chain to provide the necessary data for them. These are for instance freight forwarders that transfer data concerning ‘fuel consumption’ or ‘ton kilometres driven’ to the au-thorities. However, Trafikverket is not the only stakeholder that has to rely on the provi-sion of data by other actors. Likewise, the big freight forwarders ask for KPI from their hauliers and Volvo Logistics does it alike. The stakeholders that are currently making use of KPI gave some examples of what they are measuring at the moment and how they make use of these measures. Stena Line is looking at measures supervising the check-in time at their terminals and the human resource requirements in the check-in of-fice. To check if orders were picked up on time and if the transport services were in-voiced correctly, are two measures that are used by Volvo Logistics. Interestingly, the results of these measures are only communicated when something goes wrong and the carriers are not informed if they have been working successfully. Likewise, DHL is in-terested in the pick-up time and delivery time of their goods and DB Schenker men-tioned the fuel consumption of the trucks they are using as an important measure.
Apart from asking for KPI for the measurement of the operational efficiency and effec-tiveness, it was asked what a suitable measure for the performance of a new ITS-service would be. Steve Hanley-Cook (DHL) mentioned that when looking at new IT and ITS-services the availability and robustness of these systems is of pivotal importance.
Table 4.5 Use of KPI
Function Main StatementsCompany Function Main StatementsCompany
Ferry /
Terminal
Operator
• Check in time
• Human resources in check in office
• How many bookings are made in 1/2 an hour (Paula Wiberg)
Stena Line Ferry /
Terminal
Operator
• Check in time
• Human resources in check in office
• How many bookings are made in 1/2 an hour (Paula Wiberg)
Stena Line
Logistics
Provider
• Trying to make use of KPI, process not yet mature
• Sometimes ask for transport KPI from the carriers
• Two main KPI in use: Rested Orders and CIC hit rate (measuring how many
invoices were correct)
Volvo Logistics Logistics
Provider
• Trying to make use of KPI, process not yet mature
• Sometimes ask for transport KPI from the carriers
• Two main KPI in use: Rested Orders and CIC hit rate (measuring how many
invoices were correct)
Volvo Logistics
Freight
Forwarder
• Use of KPI on corporate and project level
• Delivery / registration on time, which is also shared with hauliers
• Fuel consumption is measured by hauliers and reported to Schenker
DB Schenker Freight
Forwarder
• Use of KPI on corporate and project level
• Delivery / registration on time, which is also shared with hauliers
• Fuel consumption is measured by hauliers and reported to Schenker
DB Schenker
Freight
Forwarder
• KPI that are used depend on product, industry and customer
• Pick-up time and delivery time are measured
• KPI for ITS: Availability and robustness of the system
DHL Freight
Forwarder
• KPI that are used depend on product, industry and customer
• Pick-up time and delivery time are measured
• KPI for ITS: Availability and robustness of the system
DHL
Traffic
Authority
• KPI are measured by freight forwarders and hauliers and are shared with
Trafikverket
• Rely on information from different parties
Trafikverket Traffic
Authority
• KPI are measured by freight forwarders and hauliers and are shared with
Trafikverket
• Rely on information from different parties
Trafikverket
Haulier • No use of KPI yet
• Systems that could generate KPI are in place, but they are not used yet
Fraktkedjan
Väst
Haulier • No use of KPI yet
• Systems that could generate KPI are in place, but they are not used yet
Fraktkedjan
Väst
Logistics Phd. • For commercial systems profitability countsPer Olof Arnäs Logistics Phd. • For commercial systems profitability countsPer Olof Arnäs

37
4.2.2 KPI Selection
Different ideas were expressed about how to select relevant KPI. Christer Kjellberg (Stena Line) pointed out that KPI are selected based on former research and develop-ment projects that were undertaken in the past. Additionally, he suggested the selection of KPI by asking upper management about what their vision for the future of the com-pany is and align the measures according to that. In a similar way, Stina Axelsson and Fredrik Jonasson (DB Schenker) stressed that project level KPI have to be selected with regards to the project goal and need to be in coalition with these goals. They also pointed out that it is important to select relevant KPI at the very beginning of a project, but further KPI might be added later during the project. Eva Knutson (Fraktkedjan Väst) put the customer in the focus of the KPI selection. According to her the KPI need to be selected in line with what the customer is asking for. Anders Ekmark and Micael Thun-borg (Trafikverket) were also putting the purpose of a project at the centre of attention when it comes to selecting relevant KPI. They expressed that the purpose and the possi-ble benefits of a project have to be identified and based on that the KPI need to be se-lected. Additionally, they emphasised that due to the fact that different ITS-services have very different capabilities, the selection of the KPI strongly depends on what ITS-service is used. For them, the selection of which KPI they will actually make use of however depends on the information that is available for them from other parties.
Table 4.6 KPI Selection
Function Main StatementsCompany Function Main StatementsCompany
Ferry /
Terminal
Operator
• Based on former R&D projects (Port Pilot)
• Internally by asking managers what their vision for the future is
Stena Line Ferry /
Terminal
Operator
• Based on former R&D projects (Port Pilot)
• Internally by asking managers what their vision for the future is
Stena Line
Logistics
Provider
N.A.Volvo Logistics Logistics
Provider
N.A.Volvo Logistics
Freight
Forwarder
• Project level KPI are picked with reference to the project goal
• KPI are selected at very beginning of project and further KPI might be
added during the project
DB Schenker Freight
Forwarder
• Project level KPI are picked with reference to the project goal
• KPI are selected at very beginning of project and further KPI might be
added during the project
DB Schenker
Freight
Forwarder
N.A.DHL Freight
Forwarder
N.A.DHL
Traffic
Authority
• Depends on the information available from other parties
• The purpose of a project has to be identified, benefits have to be looked at
and have to be connected to certain KPI
• Depends on the ITS service
Trafikverket Traffic
Authority
• Depends on the information available from other parties
• The purpose of a project has to be identified, benefits have to be looked at
and have to be connected to certain KPI
• Depends on the ITS service
Trafikverket
Haulier • The KPI would be selected based on what the customer asks forFraktkedjan
Väst
Haulier • The KPI would be selected based on what the customer asks forFraktkedjan
Väst
Logistics Phd. • Time to invoice, administration costPer Olof Arnäs Logistics Phd. • Time to invoice, administration costPer Olof Arnäs
4.2.3 KPI Categories
Generally speaking no uniform KPI categories were mentioned and the formation of relevant categories seems to depend highly on the role of a stakeholder in the transport chain. Some stakeholders were not able to propose any KPI categories. Obviously the actors that do not make intensive use of KPI yet had a harder time to define these cate-gories. The clearest categorisation appears to be done by the freight forwarders. DB

38
Schenker differentiates between internal and external KPI categories. A similar catego-risation is mentioned by Steven Hanley-Cook (DHL), who separates between customer service-focused KPI and KPI that measure the processes in between the customer inter-action points. The external KPI mentioned by DB Schenker for instance, cater to the shippers, receivers and the hauliers that they are collaborating with. Steve Henley-Cook’s categorisation seems to go in a similar direction, since external KPI are oriented towards the customer and internal KPI are being used for root-cause analysis to find out why a customer did not get a consignment or what went wrong during the transport op-eration. In contrast to what the two freight forwarders use as a categorisation of KPI, Anders Ekmark and Micael Thunborg (Trafikverket) mentioned very different catego-ries. For Trafikverket KPI can aim towards two main categories: safety and environ-ment.
Table 4.7 KPI Categories
Function Main StatementsCompany Function Main StatementsCompany
Ferry /
Terminal
Operator
• KPI categories are the same as the impact areasStena Line Ferry /
Terminal
Operator
• KPI categories are the same as the impact areasStena Line
Logistics
Provider
N.A.Volvo Logistics Logistics
Provider
N.A.Volvo Logistics
Freight
Forwarder
• Internal KPI and external (shippers, hauliers, receivers) KPIDB Schenker Freight
Forwarder
• Internal KPI and external (shippers, hauliers, receivers) KPIDB Schenker
Freight
Forwarder
• Most KPI are oriented towards customer service (are goods collected and
are they delivered)
• Processes in the middle (between 3rd party pick up and delivery) are
measured as well (For example why customers did not get the consignment)
DHL Freight
Forwarder
• Most KPI are oriented towards customer service (are goods collected and
are they delivered)
• Processes in the middle (between 3rd party pick up and delivery) are
measured as well (For example why customers did not get the consignment)
DHL
Traffic
Authority
• Environment and safetyTrafikverket Traffic
Authority
• Environment and safetyTrafikverket
Haulier N.A.Fraktkedjan
Väst
Haulier N.A.Fraktkedjan
Väst
Logistics Phd. N.A.Per Olof Arnäs Logistics Phd. N.A.Per Olof Arnäs
4.2.4 Data Collection
When it comes to how the data for a measurement are collected, two main ways were commonly mentioned by the different stakeholders. The first is to extract data from IT systems that are in place, the second method is the collection through manual input. Stena Line currently has the possibility to take some measures from IT-systems, but to measure the actual check-in time for a truck at a terminal, a manual input would be re-quired. Likewise, Steve Hanley-Cook (DHL) explained that a great number of KPI can be extracted from various systems. However, also some hauliers have to report KPI manually due to missing interconnections of the IT-systems. A central database is used to collect relevant data at DB Schenker. Another important input source is to have con-versations with super-users, which are especially assigned users that have a close col-laboration with DB Schenker, and get subjective input from them. Volvo Logistics is in

39
the same way making use of KPI that can directly be taken from the system or are gen-erated through manual interaction. Since Trafikverket as an authority cannot measure the KPI themselves, the actual collection of data is done by other stakeholders. For them the focus is on ensuring a good communication with the different actors, rather than ac-tually collecting data during measurement processes themselves.
Table 4.8 Data Collection
Function Main StatementsCompany Function Main StatementsCompany
Ferry /
Terminal
Operator
• Manually taking the check-in time with a clock
• Taken from IT-systems
Stena Line Ferry /
Terminal
Operator
• Manually taking the check-in time with a clock
• Taken from IT-systems
Stena Line
Logistics
Provider
• Rested order KPI is taken from IT-system
• KPI calculation is not done automatically. Manual interaction is needed
Volvo Logistics Logistics
Provider
• Rested order KPI is taken from IT-system
• KPI calculation is not done automatically. Manual interaction is needed
Volvo Logistics
Freight
Forwarder
• Central data base where KPI can be extracted from
• Talking to the "super-users" can be a way of getting KPI input
DB Schenker Freight
Forwarder
• Central data base where KPI can be extracted from
• Talking to the "super-users" can be a way of getting KPI input
DB Schenker
Freight
Forwarder
• Generated from various systems
• Some carriers must report manually, not all carriers have systems that can
interact with the DHL system
DHL Freight
Forwarder
• Generated from various systems
• Some carriers must report manually, not all carriers have systems that can
interact with the DHL system
DHL
Traffic
Authority
• Data is provided by other partiesTrafikverket Traffic
Authority
• Data is provided by other partiesTrafikverket
Haulier N.A.Fraktkedjan
Väst
Haulier N.A.Fraktkedjan
Väst
Logistics Phd. N.A.Per Olof Arnäs Logistics Phd. N.A.Per Olof Arnäs
4.2.5 Data Evaluation
To evaluate the data collected, different suggestions were given by the interviewees. Arne Hagberg (Volvo Logistics) claimed that the data have to be used to identify win-win situations and in that way, find the actors that benefit from the ITS-service. A com-parison of the measurement results with the previously set project goal is a way of evaluation suggested by DB Schenker, which enables them to see how well the target has been reached. Another way to evaluate the collected data was proposed by Per-Olof Arnäs who claimed that the ‘before’ and ‘after’ state has to be compared. This means that the performance of the state without the ITS-service has to be compared to the per-formance state with the ITS-service and conclusions should be drawn based on that. It was also mentioned that sometimes the ‘before’ state might be hard to capture, due to the fact that in some cases the newly implemented ITS-service is the only source of data. Further, Per-Olof Arnäs pointed out that it is also important to evaluate the meas-urement results on a subjective basis. Objective data alone can be misleading in some cases. It was said that for instance the usability and acceptance of the ITS-service needs to be evaluated. Finally, an evaluation of the profitability of the ITS-service was sug-gested by Per-Olof Arnäs.

40
Table 4.9 Data Evaluation
Function Main StatementsCompany Function Main StatementsCompany
Ferry /
Terminal
Operator
N.A.Stena Line Ferry /
Terminal
Operator
N.A.Stena Line
Logistics
Provider
• Win-Win situations need to be identified from the dataVolvo Logistics Logistics
Provider
• Win-Win situations need to be identified from the dataVolvo Logistics
Freight
Forwarder
• Compare data with project goalDB Schenker Freight
Forwarder
• Compare data with project goalDB Schenker
Freight
Forwarder
N.A.DHL Freight
Forwarder
N.A.DHL
Traffic
Authority
N.A.Trafikverket Traffic
Authority
N.A.Trafikverket
Haulier N.A.Fraktkedjan
Väst
Haulier N.A.Fraktkedjan
Väst
Logistics Phd. • The “before” and “after” state has to be compared
• In some cases “before” might not be measurable. In those cases go to core
economic measures
• Subjective evaluations are important
• The usability and acceptance needs to be evaluated
•At the end of the day the profitability counts
Per Olof Arnäs Logistics Phd. • The “before” and “after” state has to be compared
• In some cases “before” might not be measurable. In those cases go to core
economic measures
• Subjective evaluations are important
• The usability and acceptance needs to be evaluated
•At the end of the day the profitability counts
Per Olof Arnäs

41
5 Analysis In the following chapter the findings from literature and the empirical study regarding ITS and Performance Measurement will be combined and analysed. Similarities and di-verging propositions will be identified. In order to address the proposed research ques-tion, the chapter is structured in the parts of design of the measurement, implementation of the measurement and use of measures, which are based on the three phases of per-formance assessment classified by Bourne et al. (2000). Suggestions for critical activi-ties in each phase will be discussed. This chapter concludes with a brief summary of the critical activities for measuring and evaluating the performance impacts of ITS.
5.1 Design of the Measurement The following section analyses the findings from both literature and empirical research regarding the design of the measurement which is seen as the preparation and planning of the measurement. It was found to be important to define the ITS-service, analyse the stakeholders, identify customer and stakeholder impact areas, design the measurement scenarios and select the KPI.
5.1.1 ITS-Service Definition
Defining the new service comprises the identification of application areas and function-alities of the service. Application areas could be based on the broad categorisation Giannopoulos (2009) suggested, or on the more specific categorisation, conceptualised by the US Department of Transportation (2008). Either way, it is important to identify the application area the service can enhance and the functions that it can deliver to give a clear definition of the service. Ambiguous definitions of ITS function can be an obsta-cle when trying to define the ITS-service precisely. Theory suggests a great variety of definitions for specific ITS functions (Crainic et al., 2009, Giannopoulos, 2009; Ste-fansson & Lumsden, 2009; Wisconsin Department of Transportation, 2000). These definitions are often fuzzy and even though the wording is different, some technically describe the same thing. As presented in Figure 2.3, researchers have different defini-tions for functions that intend to deliver the same capabilities. The constant emergence of new services, or the combining of already available services make a clear definition even more complex. The empirical research supports the difficulties identified from the literature, that are connected to the definition of the ITS function. During the interview, Arne Hagberg (Volvo Logistics) mentioned how ITS can be beneficial for congestion management at a loading terminal. Other interviewees labelled the same functionality with different words, such as ETA or pre-notification (Stena Line, Fraktkedjan Väst). Another challenge revealed during the empirical study was to define not only the func-tions of ITS, but also, if a certain service is in the field of ITS-services at all. More than one interviewee had problems to differentiate between ITS enabling technologies and actual ITS-services. To create a common understanding it is thus equally important to not only have a similar understanding about functions but also about ITS in general. This shows that it is critical to be able to define the new ITS-service clearly and to fos-ter a common definition and understanding of newly developed functions.
Thus, it is vital to start with a clear definition of the service and its capabilities when as-sessing the performance impacts. Defining the service clearly in the early stage of the design phase enables the next activities that follow later in the measurement process.

42
The clear understanding of the service capabilities will have major influence on other activities in the design phase of the measurement, for instance the stakeholder analysis, the identification of customers and the design of measurement scenarios, which will be touched upon in the following sections.
5.1.2 Stakeholder Analysis
Analysing and finding the stakeholders that have an interest in the ITS-service is an im-portant activity for successfully evaluating the service. The empirical research has shown that pointing out the impacts through ITS for all stakeholders is considered of utmost importance.
Due to the complexity of today’s transportation system (Woxenius, 1997), this has be-come a challenging task. It is not always easy to determine how shippers, TPL, transport operators, authorities and consignees are interconnected and would be affected by the implementation of ITS. There might be positive and negative impacts due to the new service. Thus, direct and indirect stakeholders as well as potential gainers and losers must be identified carefully, and need to be involved in the measurement process. Volvo Logistics advocated that ITS projects should be initiated by the big players in the trans-portation industry. Hence, getting leading logistics companies involved is of particular importance.
Normally, the stakeholder analysis should have been done already in a very early phase of the service development process so that the results from that stage can be picked up. However, it is important to scrutinise the findings regarding their validity at this junc-ture of the project. Even if the main customers should still be the same as at the initial stage of the project, other potential stakeholders can emerge as the service matures. As an example, already early in the SITS project, DSV and Stena Line had been identified as major stakeholders and partners. Of course, both DSV and Stena Line have an inter-est in knowing what kind of impacts the service has on their business. But apart from those partners in the project, there are other stakeholders such as hauliers or the authori-ties. Depending on the specific development of the ITS functions, their interest in-creases or decreases.
Furthermore, research has shown that certain factors impede the commercialisation of ITS (Giannopoulos, 2009). First, there is a lack of interoperability and standardisation between various technologies on the market. Actors in the transportation business need to be encouraged to find integrated solutions to fully capitalise on the capabilities of the existing technologies. Secondly, the implementation of new ITS commonly requires high initial investments (Baldwin & Lim, 2001; Giannopoulos, 2009). Therefore, it seems appropriate to split the costs among the parties that have a benefit from the ITS-service. Logically, everyone who is bearing a cost for something wants to know what the return on investment is. Thirdly, since ITS have not been evolving until recently, there is a lack of historical data and thus a lack of knowledge of how ITS impact differ-ent stakeholders (Giannopoulos, 2009). For a successful commercialisation and diffu-sion of the developed ITS-service it is therefore crucial that all the potential stake-holders know about the impacts of the service on their business. Finally, it was found that there is a critical mass required ICT to be commercialised (Giannopoulos, 2009). Literature on adoption research also stresses the necessity to reach a critical mass for ICT to be diffused (Rogers, 1995). All of these factors underline the importance of get-ting the stakeholders involved in the measurement and evaluation process of ITS.

43
Consequently, apart from reviewing the selection of customers and stakeholders identi-fied in the project planning phase, another stakeholder analysis needs to be conducted. This can be done by a brainstorming among the project team and key partners. Woxen-ius’ (1997) illustration of a typical transport chain, presented in the theoretical frame-work, gives an idea of which stakeholders to consider. The objective of this is twofold: on the one hand, direct and indirect stakeholders should be identified. On the other hand, it is important to define their role in the measurement process. Therefore, this step is closely linked to the design of the measurement scenario in which the data are col-lected.
5.1.3 Identification of Customer and Stakeholder Impact Areas
The literature review has revealed that performance is typically affected in three differ-ent dimensions: efficiency, effectiveness and differentiation (Langley & Holcomb, 1992). Likewise, it was found that different performance interests exist in transport lo-gistics (Lai et al., 2002). It is argued that shippers and consignees tend to demand high service effectiveness, whereas transport operators generally try to provide the transport service in the most efficient way (Lai et. al., 2002).
The empirical study has shown that the actors in the transport chain expect two main performance impacts through ITS. First, ITS are supposed to enhance the service effec-tiveness to the users’ customers. An example for that is given by Christer Kjellberg (Stena Line) who assumes that lead-times can be cut drastically when the new ITS-service developed in the SITS project will be in place at the terminal. A totally different type of effectiveness enhancement is anticipated by Trafikverket. They expect ITS to improve the infrastructure service level in Sweden which would benefit companies in Sweden and could attract new businesses.
Secondly, the interviewees estimated that ITS will affect the internal efficiency by re-ducing manual handling of paperwork and communication. This is stressed by Steve Hanley-Cook (DHL) saying that the implementation of ITS impacts DHL’s front-office and back-office FTE requirements.
Another interesting fact mentioned by two interviewees was that security impacts are rather seen as positive side-effects of ITS than actual performance gains that could be promoted to the customers (DHL, Stena Line). This implies that the measurement can-not only focus on capturing security aspects.
Even though some general deliverables of ITS could be identified, it has become appar-ent in the empirical research that the performance impacts through ITS are manifold and obviously depend on the functions and characteristics of the developed services. Hence, it is vital for the service developing company to find out how customers and other stakeholders perceive performance of the specific ITS-service, convert their views into service objectives and finally into appropriate performance measures (Bourne et al., 2000). Ranking the performance areas can be a difficult issue as experienced during the interviews, but should be done whenever possible. This is crucial in order to measure only what is important to the customer or stakeholder for which the service is to be evaluated, having in mind that the measurement process is a costly matter.

44
Metrics
Performance
Criteria
Dimensions
Stakeholder
Performance
DifferentiationEffectivenessEfficiency
ReliabilityProductivityUtlisation OtherSafety
SecurityFlexibility
KPI 1
KPI 2
Figure 5.1 Performance break-down structure.
The outcomes from the previously described activities set the foundation for finding the critical performance areas to be captured in the measurement. Customers and stake-holders need to be asked where they see the performance impacts through the new ser-vice. As experienced in the interviews the customers tend not to name performance di-mensions, criteria or relevant KPI directly but rather describe how they expect the ser-vice to alter business processes. Therefore, it is often the task of the service developing company to convert the customers’ view into performance attributes. A structured ap-proach as illustrated in Figure 5.1 is a facilitating tool for this process indicating how performance impacts can be captured. An ITS-service enhancing vehicle utilisation for instance can be measured by KPI 1, which in that case could be the truck’s filling rate calculated by dividing the truck space occupied by the total space available. A brief de-scription of the mapped attributes can be found in Appendix D.
5.1.4 Design of Measurement Scenarios
The design and selection of suitable measurement scenarios is another vital part of the measurement and evaluation of newly developed ITS-services. Since the measurement will be conducted before the rollout, it can be seen as a type of testing which is why test and measurement scenarios are deemed synonymous in this context.
During the empirical research it was a common opinion that new services need to be tested before the implementation and a lot of ideas were expressed about important in-fluencing factors for the selection of these measurement scenarios. Factors that influ-ence the selection of these scenarios are proximity, representativeness and partner in-volvement (DB Schenker; DHL; Stena Line). Generally speaking, it was said that they should be tested on small scale scenarios; however, the term small might be interpreted in different ways. For DHL a small scale scenario is for instance the transport opera-tions between Slovakia and Belgium, which for them has rather low volumes and thus lower risks connected to it. For other stakeholders small scale scenarios might look very different. A haulier that only operates in the region of Gothenburg might see a small scale scenario as a test pilot with only a few trucks. It is thus important to select the sce-narios depending on the stakeholders that are involved and interested in using the new services.

45
A number of authors suggest that when measuring the performance, it is important to take a holistic view at the operations stretching outside of the boundaries of the own company (Cooper & Lambert, 1997; Gunasekaran et al., 2001; Holmberg, 2000).
The interview studies revealed that several actors agree to what literature suggests and pick measurement scenarios based on the holistic view, including all important parties. Christer Kjellberg (Stena Line) described these scenarios as ‘closed looped business cases’ and DB Schenker referred to them as ‘representative samples that cover the whole business operations’. It thus becomes evident that looking outside of the bounda-ries of the own company and taking a holistic perspective is an important success factor for the selection of suitable scenarios. At this juncture, based on the stakeholder’s role in the measurement, measurement objects need to be identified. Is the focus of the measurement on the movement of the truck, the behaviour of the driver while driving, the loading and unloading at the terminal or any possible combination of them? Obvi-ously, this aspect is highly related to the KPI which is selected.
The selection and design of the measurement scenario is especially important due to the fact that it forms the base for the later data collection. If the scenario is not representa-tive for the later use of the system, the measurement outcomes only have a limited va-lidity. It becomes evident that the design of the measurement scenarios is also closely connected to the stakeholder involvement. In order to create the above mentioned ‘closed loop business cases’ (Stena Line), interacting with other stakeholders seems un-avoidable.
5.1.5 KPI Design and Selection
According to literature, performance measures are quantifications of efficiency, effec-tiveness and differentiation (Neely et al., 2005). The selected performance indicator should only measure what is important and is therefore named ‘key’ performance indi-cator. Characteristics of a good measure have been identified as followed (Keebler et al., 1999):
• Quantitative • Easy to understand • Defined and mutually understood • Encourages appropriate behaviour • Makes use of economies of effort • Designed in consultation with those whose performance is measured • Aligned to strategy or project goal
These principles should be followed when selecting the KPI. First, a KPI must be quan-titative and not only be based on subjective evaluations. This ensures comparability. Secondly, a good KPI must be easy to understand, so that it can be easily interpreted. Thirdly, it is vital that the metric is defined and mutually understood by the parties us-ing it. Together with its measurement partners and other customers, the service develop-ing company needs to define precisely, i.e. what is ‘on time’ delivery or ‘good condi-tion’. Steve Hanley Cook (DHL) expressly underlined this aspect saying that there is no international standard for KPI, instead everyone seems to have its own definition.
46
Next, appropriate behaviour should be encouraged by the selected KPI; in other words it must be possible to make a decision based on the measurement outcome. Moreover, the benefits of the measure should outweigh the cost of the measurement process.
One of the key principles is that the KPI should be selected and designed in consultation with those whose performance is measured. This has been touched upon already when describing how to identify the major impact areas of ITS. Following this reasoning, it is critical to figure out what performance attributes are of superior importance to the cus-tomer or stakeholder for which the service is evaluated so that the KPI can be picked accordingly. Due to the immaturity of research in the field of ITS and the huge diversity of potential services, the KPI selection and design needs to be done ad hoc for each and every service. The empirical research has also revealed that despite some attempts to standardise measures, there is no uniform use of KPI in the transportation industry.
Finally, both literature and interviewees claim that the selected KPI need to be aligned to the corporate or project strategy respectively (Neely et al., 2005; DB Schenker). If an ITS-service strives mainly to improve the carbon footprint of a certain transport process, then this should be reflected in the KPI selection somehow. However, as mentioned in section 5.1.3, that does not automatically mean that this is the only and most important KPI to choose.
Another aspect that was discovered during the interviews relates to the accessibility to the necessary data. Both DHL and Trafikverket apparently rely on other parties provid-ing data for the KPI calculation. This issue has to be addressed not only when selecting and designing the KPI, but also when deciding about the measurement scenario and the data acquisition.
5.2 Implementation of the Measurement The next section deals with the analysis of how to implement the measurement. The im-plementation of the measurement comprises the activities of involving the stakeholders, data collection and monitoring the function of the ITS. Here it is important to again stress the fact that it is not about implementing a measurement system for a continuous improvement process. The measurement in this case is executed with the aim to collect data about the performance impacts enabled by the new ITS-service.
5.2.1 Stakeholder Involvement
During the stakeholder analysis in the design phase of the measurement, important stakeholders have been identified. Spotting these important actors, however, is not enough. A next important step is to make sure that these actors are involved in the right way.
When involving the stakeholders to conduct the measurement, it seems to be vital to do this with those actors that will actually use the service later. The future users ought to be the ones included in the tests and the initiator of the measurement has to assure that every actor involved fulfils its role and tasks for the measurement.
During the measurement the processes need to be supervised, to check if the new sys-tems are used to the full potential. There is often a high resistance to change, especially at lower levels, where people are used to certain processes for a number of years. Mi-cael Thunborg (Trafikverket) illustrated this with an example saying that if for instance

47
a truck driver saves time due to a new ITS, he can either use the additional time he gained to drink a coffee or, as he should, use the time to transport another container. It is thus vital to supervise if the new systems are used to the full potential and are being used the way they are supposed to be used. Without this control, the results of the measurement have only a limited informative value.
It also has to be analysed who needs to be involved in the actual measurement to receive the desired measurement results. As Anders Ekmark (Trafikverket) mentioned, not all data can be collected where it is needed. This means that even though some stake-holders are impacted by a new system, they might not have to be included in the physi-cal measurement process. The responsibilities need to be communicated based on the role of the stakeholders in the measurement process.
The education of the actors involved in the measurement can be seen as another vital part in the stakeholder involvement during the implementation. Eva Knutson (Fraktked-jan Väst) stressed the importance of a good communication with the people that are the actual users of the new systems. If for instance truck drivers make use of a new system, it is important to have close contacts with them, in order to explain the purpose of the measurement and receive feedback about unanticipated problems.
To conclude, one critical activity is the correct involvement of the different stakeholders and to ensure that the systems are used to the full potential when implementing the measurement system.
5.2.2 Data Collection
One of the key activities during the implementation phase of the measurement process is to gather the necessary data to calculate the selected KPI. Both literature and empiri-cal research suggest that in order to evaluate the performance impact through a new ITS-service, at least two measurements must be carried out to compare the ‘before’ state with the ‘after’ state. However, Per-Olof Arnäs pointed out during the interview that in some case it might not be possible to capture a ‘before’ state.
Literature and empirical research suggest different ways of how to collect data. Typi-cally, the data acquired consist of objective and subjective data (Bourne et al., 2000). Objective data are data which are typically retrieved automatically from sensors, IT sys-tems or the ITS-service itself. However, sometimes manual intervention is needed to collect objective data. Christer Kjellberg (Stena Line) mentioned that to measure the ac-tual check-in time for a truck at a terminal, someone needs to take the time manually with a clock. If the time-keeping process has a pre-defined start and end-point, this can also be regarded as objective data.
Another way is to set up different sensors which capture data during the measurement process automatically, i.e. driver video to evaluate the driver’s behaviour within a field operational test. In addition, some sensors have already been installed in the vehicle or the infrastructure. If possible this kind of sensor data should be integrated into the other data. Several integration issues, such as data comparability and accessibility to the data could occur and need to be addressed properly (Festa Consortium, 2008). Apart from sensor data, objective data can be gathered through IT systems. Volvo Logistics, for in-stance, mentioned that the data for the calculation of the ‘Rested Orders’ KPI are ex-tracted from the company’s ERP system. Another source for data acquisition is the ITS-service itself. If for instance the Geofencing technology is applied in the development of

48
an ITS-service with the aim to prevent cargo theft, the number of alerts through the sys-tem could be valuable data for the evaluation of the service. Due to the high reliability and the ability to collect huge amounts of data, objective data acquisition is often the backbone of the measurement process.
Nevertheless, subjective data acquisition through interviewing or surveying the users of the ITS-service is a critical complement to the objective data acquired. DB Schenker stressed the importance of subjective data by saying that feedback from so-called ‘su-per-users’, which are administrators responsible for the system implementation at the customer side, is an important input for the evaluation of ITS. Likewise, Per-Olof Arnäs deemed subjective data as crucial in the evaluation of ITS. Literature recommends in-cluding subjective data in the measurement process because it reflects the users’ or cus-tomers’ perspective on the ITS-service (Heimbecher, n.d.). Another form of subjective data acquisition constitutes real-time observation. In this type of data acquisition the business process to be measured is monitored by an observer who registers details im-portant for the evaluation of the service that cannot be captured by digital means. It can also be used as back-up data in case other measuring methods fail.
5.2.3 Function of the system
Once the data collection begins, the functionality of the system needs to be constantly controlled. Even though the ITS-service should be technically mature before starting the measurement, it is still possible that some functions of the service do not work as an-ticipated. Thus, the new system has to be checked to determine if it is working the way it is supposed to and if necessary some parameters need to be amended. This step is im-portant, to get valid data for the last phase of the measurement, the use phase. The checking of the functionality of the system is not to be confused with the evaluation that will follow in the last measurement phase. Monitoring the functionality of the system is rather a pro-active approach to ensure the validity of the collected data that still need to be evaluated at a later point in time.
Steve Hanley-Cook (DHL) gave suggestions of how this functionality could be tested and mentioned two criteria that could be used; availability and robustness. Availability describes the quality of being at hand when needed and robustness describes how sturdy and strong the system is in constitution or construction (The Free Dictionary, 2011; Princeton University Dictionary, 2011). If the system is lacking either of these charac-teristics, it is likely that the gathered data are biased and do not represent the full poten-tial of the system.
If for instance an ITS-service is supposed to reduce administration time through auto-mated electronics goods documentation, but half of the time the transmission of the documents to another party fails, a truck driver might still need to transmit the docu-ments in a conventional way and leave the truck. In this case a lack of availability would negatively affect the validity of the collected data and would thus redundantise the measurement process.
Thus, it appears crucial to ensure the correct and stable functioning of the ITS-service, before and during the process of data collection.

49
5.3 Use of the Measures This section analyses how the performance measures are used to draw the right conclu-sions from them. It comprises the activities of evaluating the measures, communicating the measurement results and evaluating the measurement process.
5.3.1 Evaluation of Results
In order to be able to evaluate the measurement, the KPI need to be calculated from the raw data collected. Also, the measurement results cannot be looked at in isolation but need to be related to other values to draw reasonable conclusions from them. Compar-ing the level of performance ‘before’ and ‘after’ service implementation is necessary to reveal the change in performance. While doing this, different aspects need to be consid-ered. First, it should be reviewed whether the measurements have been conducted under comparable conditions. As an example: A new ITS-service supporting dynamic re-routing has been developed. Based on the stakeholder’s perspective, percentage delivery on-time has been identified suitable to capture the performance impact through that ser-vice. Two measurement rounds are conducted; the first one in June and the next one in December. Obviously, the weather and road conditions could affect the measurement results considerably.
Other factors like the use of other technologies or significant process changes which cannot be attributed to the implementation of the new ITS-service could also influence the evaluation of the results. Subjective data through user feedback or real-life observa-tions help to determine direct factors impacting the measurements. In addition to that, there are indirect factors that have to be considered when assessing performance. Per-formance measurement research has identified the Hawthorne Effect as one important reason for human beings’ improved performance in an experiment (Campbell et al., 1995). Likewise, subjective data should be analysed carefully keeping in mind that the results might have been affected by the Halo Effect (Nisbett & Wilson, 1977). Another factor that needs to be considered when evaluating the measurement result is the sys-tem’s functionality during the measurement process, mainly in terms of availability. In case the sensors only register every second measure, the validity of the acquired data is relatively low and the performance level will be affected in a negative way.
This list is by far not exhaustive, but should provide an overview of what might influ-ence the comparability of the measurement results.
After having calculated the variation in the KPI, the results must be evaluated. The mere KPI variation, i.e. a 5% reduction in back-office FTE requirements through making use of an ITS-service, leaves a lot of room for interpretation. Literature identified two dif-ferent approaches how to evaluate the potential of ITS-services: the economic analysis and the goal-oriented approach (Wisconsin Department of Transportation, 2000).
The former focuses on assessing whether the benefits through the ITS-service are eco-nomically beneficial (Wisconsin Department of Transportation, 2000). This goes in line with Per-Olof Arnäs’s statement claiming that at the end of the day, it is mainly profit-ability that matters in transportation business. Therefore, the KPI variation needs to be expressed in monetary terms. The KPI conversion into monetary terms seems to be eas-ier for efficiency KPI than for effectiveness or differentiation KPI. For a comprehensive evaluation of the ITS-service for a particular stakeholder, monetary and non-monetary
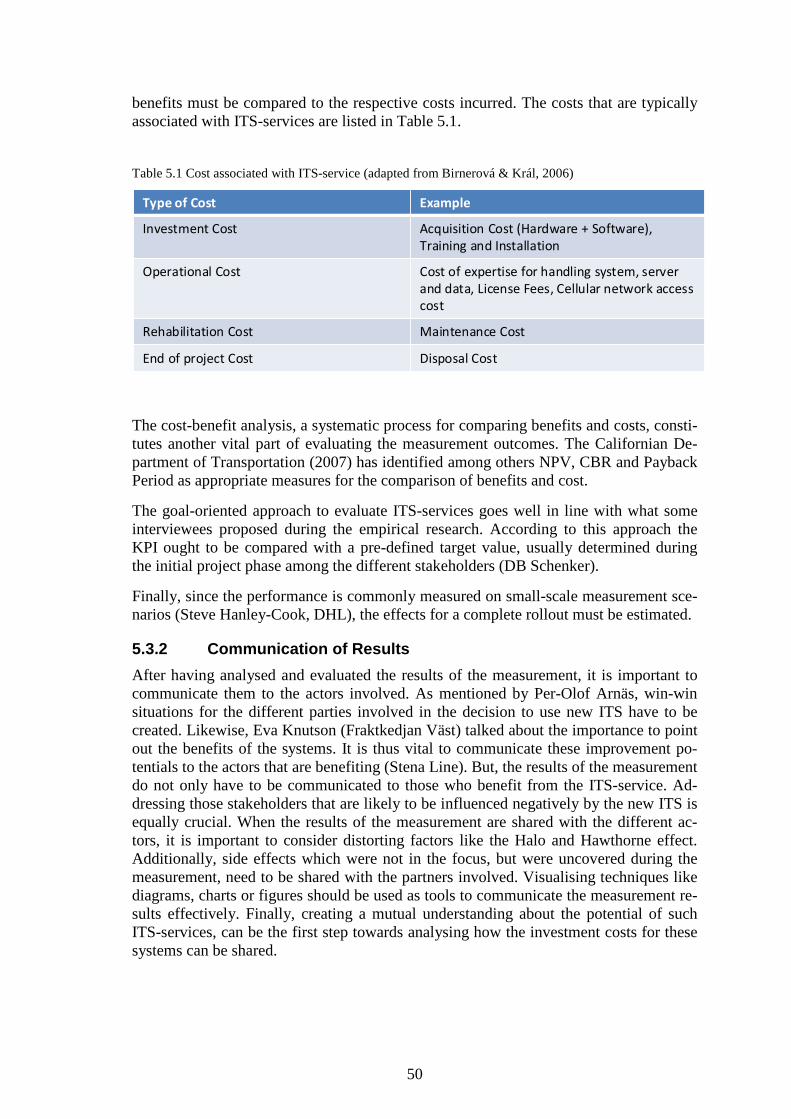
50
benefits must be compared to the respective costs incurred. The costs that are typically associated with ITS-services are listed in Table 5.1.
Table 5.1 Cost associated with ITS-service (adapted from Birnerová & Král, 2006)
Disposal CostEnd of project Cost
Type of Cost Example
Investment Cost Acquisition Cost (Hardware + Software),
Training and Installation
Operational Cost Cost of expertise for handling system, server
and data, License Fees, Cellular network access
cost
Rehabilitation Cost Maintenance Cost
Disposal CostEnd of project Cost
Type of Cost Example
Investment Cost Acquisition Cost (Hardware + Software),
Training and Installation
Operational Cost Cost of expertise for handling system, server
and data, License Fees, Cellular network access
cost
Rehabilitation Cost Maintenance Cost
The cost-benefit analysis, a systematic process for comparing benefits and costs, consti-tutes another vital part of evaluating the measurement outcomes. The Californian De-partment of Transportation (2007) has identified among others NPV, CBR and Payback Period as appropriate measures for the comparison of benefits and cost.
The goal-oriented approach to evaluate ITS-services goes well in line with what some interviewees proposed during the empirical research. According to this approach the KPI ought to be compared with a pre-defined target value, usually determined during the initial project phase among the different stakeholders (DB Schenker).
Finally, since the performance is commonly measured on small-scale measurement sce-narios (Steve Hanley-Cook, DHL), the effects for a complete rollout must be estimated.
5.3.2 Communication of Results
After having analysed and evaluated the results of the measurement, it is important to communicate them to the actors involved. As mentioned by Per-Olof Arnäs, win-win situations for the different parties involved in the decision to use new ITS have to be created. Likewise, Eva Knutson (Fraktkedjan Väst) talked about the importance to point out the benefits of the systems. It is thus vital to communicate these improvement po-tentials to the actors that are benefiting (Stena Line). But, the results of the measurement do not only have to be communicated to those who benefit from the ITS-service. Ad-dressing those stakeholders that are likely to be influenced negatively by the new ITS is equally crucial. When the results of the measurement are shared with the different ac-tors, it is important to consider distorting factors like the Halo and Hawthorne effect. Additionally, side effects which were not in the focus, but were uncovered during the measurement, need to be shared with the partners involved. Visualising techniques like diagrams, charts or figures should be used as tools to communicate the measurement re-sults effectively. Finally, creating a mutual understanding about the potential of such ITS-services, can be the first step towards analysing how the investment costs for these systems can be shared.

51
5.3.3 Evaluation of Measurement
As a last step the actual measurement process needs to be evaluated. This includes look-ing at the resources that were spent for the measurement processes and comparing them to the benefits unveiled by conducting the measurement. Typical cost drivers for the measurement process are among others human resources needed during design, imple-mentation and use of the measurement, data acquisition equipment, data storage, as well as the communication of measurement data.
If the measurement process is too expensive, pure estimation might be a more appropri-ate way to assess the performance of new ITS-services. Problems that were faced during the measurement process need to be analysed and considered in future measurement projects (M. Gunnarsson, personal communication, 2011-03-25). Therefore it is rec-ommended to document the lessons learned in order to prevent similar issues in the fu-ture. If for instance specific techniques for the data collection turned out not to be ap-propriate for the problem at hand, other methods should be used in the next measure-ment. Furthermore, the measurement process needs to be evaluated based on validity. It needs to be critically analysed if the duration of the measurement was long enough and if it was not influenced by other factors, such as seasonal variation (D. Zackrisson, per-sonal communication, 2011-02-02).
5.4 Summary of the Measurement Process Based on general performance measurement literature the assessment process was di-vided into the phases of measurement design, implementation and use of the measures.
The following activities have been identified as important:
Design
• ITS-Service Definition • Stakeholder Analysis • Identification of Impact Areas • Design of Measurement Scenarios • KPI Design and Selection
Implementation
• Stakeholder Involvement • Data Collection • Function of the System
Use
• Evaluation of Results • Communication of Results • Evaluation of Measurement

52
6 Validation To validate the proposed activities for the measurement and evaluation of new ITS-services, the focus group method was used. This chapter starts with an introduction to the focus group validation, followed by both a presentation and an analysis of the re-sults of the validation.
6.1 Introduction to the Focus Group Validation The focus group study was conducted at VehCo’s premises in cooperation with one of their customers, Fraktkedjan Väst. The aim was to get input about how valid the identi-fied activities are in a practical environment of an ITS developing company.
6.1.1 VehCo
VehCo provides mobile IT solutions for the transport industry. It was founded by three students at Chalmers School of Entrepreneurship in the year 2001. Ever since, VehCo solidly grew, and in recent years could expand with growth rates of about 50 per cent annually. VehCo’s customer target groups are mainly hauliers, truck depots and other companies with large fleets of trucks. VehCo has customers throughout Sweden, but also an increasing customer base in a number of other European countries. There are currently more than 40 employees in the company who work with sales, customer ser-vice, deliveries, and product development. The main product offered by VehCo is the Co-Driver system, which is installed in the cab and has a monitoring device in the back office. The device facilitates a communication between the driver and the office and has various application possibilities (Vehicle Communications, n. d.).
6.1.2 The Geofencing Service
The term Geofencing describes the possibility to virtually set a geographical area on a digital map and the function to automatically trigger an action (i.e. sending an email or SMS) when the area is left or entered by a vehicle or cargo equipped with the Geofencing service (Bogatu, 2008). Enabling technologies for the use of Geofencing are GPS and GSM. The vehicle or cargo needs to constantly know its own location and must be able to transfer messages wirelessly from any of these locations. Before the service can be used, the geo-fences need to be set up by the user of the service or the service provider.
6.2 Empirical Results from the Validation The empirical results from the focus group study are structured around two main topics: the feasibility of a comprehensive measurement and the applicability of the proposed activities necessary for a measurement process.
6.2.1 Feasibility of a Comprehensive Measurement
At an early stage of the discussion it became evident that the theoretical assumption of a comprehensive measurement was not appropriate for the Geofencing service at this juncture. Thus, the feasibility of a comprehensive measurement was debated. A com-prehensive measurement in this context is seen as the assessment of how business proc-esses are affected by the ITS service, backed up by measurement data rather than specu-

53
lation. A couple of issues regarding the feasibility of a comprehensive measurement process before the ITS-service rollout could be revealed.
In the specific case of VehCo and Fraktkedjan Väst, VehCo as the ITS-service develop-ing company requested, Fraktkedjan Väst, to test the service for a short period of time in order to gain first-hand experience regarding the impacts of the ITS-service. During this pilot phase, Fraktkedjan Väst runs the Geofencing service for one truck on a specific early morning delivery route of electronic goods from Fraktkedjan Väst’s hub in Möld-nal to three stores of their customers Electoskandia and Storel at different locations in Gothenburg. No concrete performance measurement figures are planned to be collected, instead the evaluation of the service is based on whether Fraktkedjan Väst as the cus-tomer perceives the service as valuable for its business processes or not. The reasons for VehCo and Fraktkedjan Väst to use this alternative approach for evaluating the potential of the Geofencing service are manifold.
First and foremost, it was stressed that the Geofencing service is just a small ITS project which at the moment does not have a high priority neither within VehCo nor within Fraktkedjan Väst. Thus, resources for a comprehensive measurement process are not available. The costs for a performance measurement were expected to be too high for the Geofencing service. Secondly, VehCo is a small emerging company that provides mobile IT solutions. Their organisational structure is described as flat which implies fast decision-making processes. Project leaders are usually not requested to report actual performance measurement results to the management before the service implementa-tion. If they assume the new service to be beneficial to the customer, it is just pushed into the market. Most often, VehCo assesses the performance of the newly developed service intuitively without backing it up with measurement figures. Thirdly, as a small-sized company, VehCo has not as many customers as for instance bigger companies like Volvo Technology, which according to them limits the need for a sophisticated meas-urement.
Nevertheless, it was expressed that a comprehensive measurement of the performance impacts through the Geofencing service would eventually be desirable for both VehCo and Fraktkedjan Väst. At the same time, it was emphasised that in other organisations, a structured approach to performance measurement is needed in order to prove the eco-nomic viability of the ITS-service before the complete rollout. VehCo also exemplified that in certain other situations a measurement might be useful. This was illustrated with the example that in the German VehCo subsidiary more resources tend to be dedicated to show accurate performance results to customers.
Further, the interviewees pointed out that the measurement process is a time-consuming and costly endeavour. Already the design of the measurement requires a lot of re-sources, not to mention the implementation of the measurement and the evaluation of the results.
6.2.2 Proposed Activities With Regards to the Geofencing Service
Apart from the feasibility of a performance measurement, the viability of the proposed measurement and evaluation activities with regards to the Geofencing service were dis-cussed during the focus group study. Even though neither VehCo nor Fraktkedjan Väst actually aimed at conducting a complete measurement at this juncture, they expressed that at a later stage and with more resources available, it would be desirable to conduct a

54
measurement. Hence, the applicability was discussed and will be presented in this sec-tion.
The proposed key activities were presented by the authors and subsequently analysed with regards to the Geofencing service. Defining the service, analysing which stake-holders are involved, identifying the impact areas for the different stakeholders, design-ing the measurement scenarios and selecting relevant KPI were confirmed to be impor-tant activities for a successful measurement process. However, involving the stake-holders during the measurement process and evaluating the results with a cost-benefit analysis turned out to be problematic for the assessment of the Geofencing service. In the following section, it will be elaborated on why some of these factors suggested by the authors seemed to be very relevant, and why some of them were problematic.
At the very beginning the application areas were defined and the service was named precisely. The classification of ITS by Giannopoulus (2009) was provided to the par-ticipants and VehCo stated that their Geofencing service operates in the areas of Freight Operations, Site Specific Systems and Transport and Other Public Administration Sys-tems. After the identification of the application areas, the service was named as: ‘Geofencing service for distribution and transport for steady locations’. The major func-tions that the service is able to fulfil is to provide an ETA prior to the arrival at the cus-tomer’s premises and to automatically measure the time that elapsed between arrival and departure of trucks at the customers’ premises.
Following the service definition, the authors asked the focus group participants to name the stakeholders that are likely to be affected by the Geofencing service. It was stated that it is important to identify the stakeholders and a number of different actors were discovered, such as VehCo and Fraktkedjan Väst themselves, the direct customers of Fraktkedjan Väst, Lindome Flytt AB as the owner of the trucks, the driver of the trucks and the receiving personnel at the customer’s site. The stakeholders were grouped in di-rect and indirect stakeholders and a common understanding was that the direct stake-holders should be in the focus of a potential measurement. If a measurement was con-ducted, the impacts for the direct stakeholders should be identified first. From VehCo’s perspective, the direct stakeholders in this case were Fraktkedjan Väst and their custom-ers.
It was expressed that the identification of impact areas should start with the direct stakeholders and if possible, potential benefits should then also be promoted to the indi-rect stakeholders. The main impact that Fraktkedjan Väst would have from the Geofencing service would be increased customer satisfaction by providing an automated ETA and an automated proof of delivery to their customers. Quickly designing and se-lecting KPI for the increased customer satisfaction through Geofencing turned out to be tricky and VehCo mentioned that a sophisticated KPI selection should be executed with more time and resources at hand. Designing the measurement scenarios for an actual performance measurement was also found to be an important activity, if a measurement was executed. For this specific case, the suggested measurement scenario was a distri-bution process with one of Fraktkedjan Väst’s trucks to three stores in the region of Gothenburg.
Stakeholder involvement turned out to be an activity that per se is not necessary in every case. VehCo described the Geofencing service as a ‘silent’ service. This means that the service can be tested without the customer noticing it and thus they might not

55
need to be involved in every case. If stakeholders are involved however, it was agreed that they need to be educated in the right way. VehCo illustrated that and said that if for example not all trucks of a transport company’s fleet are equipped with the Geofencing service, the receiver of the goods needs to know why they only get an ETA notification in some cases and understand that the measurement is still working according to plan.
When collecting the data for the measurement, VehCo agreed that also gathering sub-jective data is very important. It was said that objective data for measuring the Geofencing service could for instance be the elapsed time between arrival and departure of the truck. This information can be given by an automatic report created by the Geofencing service, however, if the report shows that the truck remains at the customer longer than intended, the answer to why this is the case cannot be extracted from the automated report.
An interesting comment was made about the suggestion to evaluate the measurement results with a cost-benefit analysis. It was said that this could be difficult for certain ITS-services since they are offered as additional services that can be provided by using already installed devices. The Geofencing service, for instance, is a service that can be offered to customers that already have the Co-Driver device installed in the vehicles. It is thus difficult to calculate the exact costs for the service, since the initial investment for the Co-Driver device was high, but the additional costs for the Geofencing service are marginal. Further, it was said that estimating performance impacts for other stake-holders based on the results from the measurement is difficult because customers usu-ally like to gain first-hand experience with the service and test the service on their own processes.
6.3 Analysis of Focus Group Study In the following, the findings from the focus group study are analysed regarding the fea-sibility of a comprehensive performance measurement and the applicability of the pro-posed activities.
6.3.1 Feasibility of a Comprehensive Measurement
In some cases, it does not seem to be practicable to do a comprehensive performance measurement in order to assess the potential of the newly developed service. Instead, a subjective assessment of the ITS-service by the direct customer was found to be com-mon practice. The example given by VehCo, where this type of assessment is preferred, shows that in some cases it might make sense to refrain from a sophisticated measure-ment process. This however, only seems to work if the customer relationships are very close. In the focus group study it became apparent that there seemed to be a very close collaboration between VehCo and Fraktkedjan Väst. For instance, VehCo has already equipped Fraktkedjan Väst’s trucks with their mobile computers Co-Driver which have been proved to be beneficial in Fraktkedjan Väst transport operations. Therefore, mutual trust in the new service offer existed which could be a reason why at this juncture it was not seen appropriate to conduct a comprehensive measurement.
Statements about diverse organisational culture in different subsidiaries across Europe indicated that county specific details might influence the decision to conduct a thorough performance measurement. The country in which the ITS developing company wants to promote their services might thus have an influence on the feasibility of conducting a
56
measurement. The authors’ assumption that the measurement process is a time-consuming and costly endeavour has been confirmed during the focus group study. For the low-priority Geofencing project the cost for the comprehensive measurement were expected to be too high.
Therefore, it should be analysed carefully during the service development process whether accurate measurement results are actually needed to demonstrate the ITS-service’s performance potential before the market implementation. Hence, every per-formance assessment process should start with a pre-evaluation of the need, effort and expected outcome of a comprehensive measurement.
Nevertheless, it was mentioned that a comprehensive measurement of the performance impacts is desirable for VehCo and Fraktkedjan Väst; not at this stage, but eventually it could be interesting to conduct a measurement. For this purpose, the critical activities can be used to structure the measurement approach which emphasises the important ac-tivities, avoids redundant activities and thus leads to a more effective and efficient as-sessment process.
If a decision is made in favour of a comprehensive measurement, resources should be allocated based on the tasks connected to the proposed activities.
6.3.2 Analysis of the Proposed Activities with Regards to the Geofencing Service
Most of the proposed critical activities were agreed to be important for a potential measurement of the Geofencing service; however, some turned out to be difficult to ap-ply in this specific case.
A common understanding was fostered by defining the service including the application area, the functions and the exact name of the service. Quickly designing and selecting the KPI however turned out to require more resources than expected. Thus a sophisti-cated KPI selection should be executed with more time and resources at hand. Apart from more extensive resource requirements, the above mentioned critical activities of the measurement’s design phase are applicable, given the assumption that a measure-ment would be executed.
When implementing the measurement system, the authors suggested that stakeholder involvement is of pivotal importance. However, the focus group study unveiled that this might not have to be the case for every ITS-service. VehCo described the Geofencing service as a ‘silent’ service, meaning that the service could be run and data could be gathered, without the other stakeholders noticing. Involving all of the stakeholders for a measurement might thus not be necessary for all ITS-services and needs to be specifi-cally assessed on a case-by-case basis.
During the focus group study it was expressed that the evaluation with a cost-benefit analysis can be difficult which concludes that for some ITS-services it might not be ad-visable to conduct a cost-benefit analysis in order to evaluate the measurement results.

57
7 Results This chapter presents the results of both the interview and the focus group study and outlines the proposed performance measurement process for new ITS-services.
7.1 The Performance Measurement Process As it was found in the focus group study, every comprehensive measurement process should start with assessing whether concrete measurement results are actually needed and what the efforts would be to obtain the measures. This process is delineated in Fig-ure 7.1. It shows that the decision whether to conduct a comprehensive measurement, which includes the analysis of business performance impacts based on concrete per-formance measures, (at least in the validation case) is influenced by a lot of different factors: the cost of measurement, the project’s priority, the customer relation as well as the organisational structure of the ITS developing firm.
In the Geofencing example VehCo and Fraktkedjan Väst opted for a more convenient, alternative approach to evaluate the viability of the ITS-service without collecting any measurement results regarding business performance impacts for Fraktkedjan Väst or their customers. The reasons for them not to assess the business performance impacts enabled through ITS were manifold, but mainly because the Geofencing project has not had highest priority in the company which is why there were not enough resources for a comprehensive measurement available.
Figure 7.1 Performance Measurement Decision Tree.
Nevertheless, the study has revealed that ITS is still a very unexplored field for both re-searchers and practitioners. Therefore, a lot of uncertainty is connected to ITS imple-mentations in transport operations. This uncertainty can be mitigated by supporting ITS

58
adoption decisions with measurement results showing the actual performance impacts through the new ITS-service at the customers.
In the following section, the performance measurement process will be depicted. Figure 7.2 shows graphically the critical activities for the measurement phases of design, im-plementation and use of the measures. The overlapping circles indicate that the assess-ment process is not a stringent hierarchical approach but an interplay of the three differ-ent phases. Normally though, the design sets the foundation for the measurement and should be conducted first. Then, the measurement needs to be implemented and con-ducted to collect the data required for calculating the performance measures. Finally, the measures must be used and evaluated to draw the right conclusions from them.
The activities for each phase are not necessarily in a pre-defined order and, depending on the project, have to be executed at different points in time. However, the actions should be taken top-down, meaning that the measurement design tends to start with the service definition. Most often, a number of iterations have to be made between the dif-ferent activities for a successful measurement and evaluation of ITS performance im-pacts.
Figure 7.2 The Performance Measurement Process.
Furthermore, the focus group study has revealed that some activities require special at-tention. Finding out the impact areas of ITS at the customers and selecting the KPI ac-cordingly turned out to be more difficult than expected. Especially, soft impacts like in-creased customer satisfaction are not easy to capture. Moreover, stakeholder involve-

59
ment in the measurement implementation was found to be impracticable in some cases. Finally, the evaluation of the measurement results can be complicated, especially when the performance impacts are difficult to convert into monetary terms and the exact costs related to the service are difficult to determine, as it was the case for the Geofencing service.
The managerial guideline, which can be found in Appendix C, describes the perform-ance measurement process in detail by listing the main tasks for each of the activities. Furthermore, different tools are suggested which should help executing the steps. Whenever input from other activities is needed, this is summarised under considera-tions. Finally, the expected outcome for each of the activities can be found at the end of each table.

60
8 Conclusion The conducted study has revealed interesting findings concerning ITS, its measurement and evaluation. In this chapter the main conclusions from the conducted study are summarised.
ITS is an immature field for both researchers and practitioners
This study has confirmed that the concept of ITS is still an emerging phenomenon in the transportation industry. The low adoption rates found in previous studies conducted in ITS research (European Commission, 2008) were supported by the empirical study where only one company was about to make use of an ITS-service by definition. In general a lot of confusion about ITS terminology was observed during the study. Like-wise, ambiguous definitions of ITS, their application areas and functions prevail in ITS literature.
Measuring the performance impacts of ITS reduces uncertainty
Keeping the novelty of ITS in mind, it is not surprising that both ITS developing com-panies and logistics providers lack a clear understanding of the actual performance im-pacts of ITS. Although it was found that ITS leverage mainly the service level that can be offered to the customer and that they increase the efficiency in the back office, the great variety of ITS-services calls for an individual assessment. This uncertainty about the impacts of the new technology can be mitigated by collecting concrete measurement results.
Structuring the measurement process into design, implementation and use
The critical activities for measuring and evaluating the performance impacts of ITS suggested in this paper provide a structured approach guiding the ITS developing com-pany through the measurement process. Based on general performance measurement lit-erature the assessment process was divided into the phases of measurement design, im-plementation and use of the measures. It was found that the assessment process is not a stringent hierarchical approach but an interplay of the three different phases. In total, 8 semi-structured interviews with different stakeholders in the transport industry were conducted to find out what is deemed important regarding the assessment of perform-ance impacts of ITS. The design phase is concerned with preparing the measurement process including the activities of service definition, stakeholder analysis, identification of impact areas, design of measurement scenarios as well as KPI design and selection. For the implementation of the measurement it was found to be important to involve the stakeholders, collect the data required for the calculation of the performance indicator and to monitor the function of the ITS-service to be assessed. In the last phase the measures should be used for the evaluation and communication of the measurement re-sults and the evaluation of the measurement process.
Validation revealed vulnerabilities of the measurement process
During a focus group study together with a small-sized ITS developing company and one of its customers, the key findings were validated and applied to one specific ITS-service. Whereas most of the critical activities were found to be suitable for a compre-hensive measurement process, some difficulties regarding KPI selection, stakeholder involvement as well as the evaluation of the measures were uncovered. Customer satis-
61
faction, one of the biggest impacts of ITS, was found to be difficult to capture. Despite its importance, stakeholder involvement during the measurement implementation was deemed problematic since sensitive information is shared with potential customers. Fi-nally, it could be revealed that a cost-benefit analysis as a common tool for evaluating the measurement results is not feasible in certain circumstances, for instance when it is difficult to assign all the costs related to the ITS-service.
Comprehensive measurement process not appropriate from the outset
The focus group validation also uncovered that a comprehensive performance meas-urement process is not appropriate under every circumstances. High measurement costs, very close customer relation, low project priority and flat organisational structures in the developing company are possible reasons why companies sometimes refrain from a proper performance measurement process. Instead, getting hands-on experience with the ITS-service during a pilot run followed by a subjective assessment was found common practice.
62
9 Discussion, Recommendations and Further Re-search
The last chapter of this master’s thesis discusses the methodology of the thesis as well as its strengths and weaknesses, gives recommendations for how to use the findings and suggests areas for further research.
9.1 Discussion The measurement process presented in this thesis has been developed based on different sources of input. A literature study was conducted and interviews, observations and a focus group study gave empirical contribution. The empirical input for the assessment was based on interviews with different actors in the transport chain and thus reflects the users’ perspective on the topic area. Due to constraints in time, the proposed critical ac-tivities for the measurement and evaluation were only validated in cooperation with one specific ITS developing company. This can bias the appraisement of the proposed measurement process and it is thus important to consider the position and environment of the ITS developing company involved in the focus group validation.
During the interviews it became evident that the field of ITS indeed is very new to most of the companies interviewed. Even though it would have been desirable to talk about how these companies practically make use of such systems, the research often had to be limited to intentions about how they plan to make use of ITS in the future. Further, in many cases, input was given about the use and implementation of IT-services due to a lack of real ITS-services. Here, the approach to use semi-structured interviews turned out to be very beneficial. It gave the interviewees the chance to elaborate freely and still get valuable input, despite the fact that some of the questions could not be answered di-rectly.
The proposed activities for measuring and assessing the performance of ITS-services are supposed to be used by ITS developing companies. Even though the data were col-lected from very different stakeholders in the transport chain, the important activities and the viability of an assessment are analysed from the perspective of ITS developing companies. This was done with regards to the background of VTEC as an ITS develop-ing company and in connection with the aim to use the results of this thesis in a later phase of the SITS project.
Further, the research conducted was based on the assumption that a comprehensive measurement needs to be conducted to estimate the performance impacts of ITS. This is supported by the fact that a lot of innovations do not turn out to be successful (Standish Group, 2005). Accurate measurement results can help to reduce uncertainty connected to the adoption of new technologies. Further, observability identified by Rogers (1995) as one of the forces influencing the decision to adopt a new technology, is enhanced by quantifying performance impacts. A measurement of the performance impacts of new innovations can thus help to decide whether or not to continue with the development and launch it on the market. As claimed by Hultman (2007) a decision to reject an inno-vation can be deemed as a success as well for both ITS developing company and its cus-tomers. Even if it seems contradictory, the decision to discontinue the implementation of a certain ITS-service with a customer due to measures indicating limited utility can turn out to be advantageous. By this, the ITS developing company can prevent the loss of credibility by offering unviable services, whereas the ITS user can avoid sunk costs

63
due to false investments. However, during the research process it was unveiled that de-spite the benefits of a measurement, for certain companies the complexity of such a measurement process might be too high and the required resources might not be avail-able. It was thus identified that in certain situations the use of alternative methods to es-timate the performance impacts of ITS is advisable.
9.2 Recommendations This master’s thesis provides a structured approach to measure and evaluate perform-ance impacts of ITS before the rollout. Since the validation case indicated that a sophis-ticated measurement is not suitable under the given circumstances, ITS developing companies are advised to scrutinise if a comprehensive measurement is required or not. For an extensive assessment ITS developing companies are recommended to apply the managerial guideline provided in Appendix C in order to get as precise measurement re-sults as possible. It is expected that following this structured approach would result in a more cost-efficient measurement process because it pinpoints the critical activities; in that way redundant activities can be avoided. Moreover, using the same methodology consistently implies that the measurement results related to one specific ITS-service presumably become more comparable for the innovator in the long run. And, even if the customer does not ask for sophisticated measurement results, knowing about the actual performance impacts of its own ITS-service can support internal decision-making, for instance in terms of further development of the service or potential add-ons.
Whereas the focus group validation has uncovered some issues regarding the applicabil-ity of the guideline to small-sized ITS developing firms characterised among others by flat hierarchies and very close customer relations, it is considered viable for major inno-vation companies like VTEC. Nevertheless, it should be assessed from case to case if sophisticated measures are needed taking into account the efforts and cost associated with the measurement process. Regarding the SITS project, VTEC is recommended to apply the guideline for an extensive measurement in the final phase of the project. Based on the evaluated performance measures, it is easier to figure out whether the in-novation is ready for the market or not. Identified benefits can be promoted to the cus-tomers and drawbacks associated with a service implementation can be addressed. Re-sources for the measurement process should be allocated previously according to the tasks indicated in the managerial guideline.
To use and make sense of the data collected during the measurement, it is recommended to store and document the measurement data in a meaningful way. This will enable ITS developing companies to transfer knowledge from previous measurement projects to fu-ture assignments. VehCo expressed that transferring previous measurement results to other projects or customers might be difficult in some cases, due to the fact that custom-ers want to experience the measurement on their own processes. However, research pro-jects made use of databases for the storage and transfer of measurement results (Festa Consortium, 2008). This also seems to be the right tool for handling the data in this con-text. The FAA database described in the literature can give an idea of how a database for the storage of ITS assessment-related data should be structured (US Department of Transportation Federal Aviation Administration, 1999). The database should at least comprise a description of the KPI, the formulas of how to calculate them, the unit of the measure, and the way of capturing the KPI. Furthermore, KPI should be attributed to one or more performance criteria, shown in the performance break down structure in
64
Figure 5.1. The database should include references on previous studies and filtering should be possible based on the requirements for the current research question. In the future, results from previous studies in the database could be used to estimate perform-ance gains for projects that are similar to those that have been executed in the past.
Furthermore, impacts of ITS projects should be stored in an industry-wide database to make it accessible for decision-makers in the transport industry and to enhance the gen-eral knowledge about the effects of ITS for the transport business.
9.3 Further Research The presented activities for measuring and evaluating the performance of ITS have been developed with input from different empirical sources, but were only validated with one company operating in the field of ITS. To further strengthen the research, the measure-ment process needs to be applied to other ITS developing companies and the feasibility of the proposed methodology should be analysed for other ITS developing companies. With more time and resources at hand, the proposed activities could be applied in detail and an actual measurement should be executed in order to gather data for the evaluation. Applying the measurement and evaluation process to other ITS developers would give the opportunity to further analyse the activities that were identified to be critical. KPI selection, stakeholder involvement and the evaluation of the measures should be in the focus of such a study, in order to analyse their validity for other companies or other ITS-services.
The technical component of the measurement, that is especially important during the phase of measurement implementation, likewise calls for future research. Sensor tech-nologies and ways to measure the functionality of new ITS could be an interesting field of study.
During the focus group study it was mentioned that in different markets customers ask for different levels of detail when it comes to estimating impacts of ITS. It was said that, for example in Germany, customers usually ask for more numerical estimations as compared to Sweden. A study analysing the applicability of performance measurement and evaluation depending on the country could further examine this phenomenon and give suggestions where a sophisticated performance measurement is most viable.
Since it was identified during the research that a sophisticated measurement and evalua-tion of the performance with regards to ITS is not common practise, the drawbacks for both ITS developing companies and their customers that refrain from conducting such measurements could be studied.
Due to the current lack of use of ITS in the field of transport operations most of the companies interviewed were not yet making use of ITS. This calls for further research. Executing a similar study, interviewing companies that specifically make use of ITS-services already could give further insights in how a performance measurement and evaluation can be executed in the best way.
The presented study focused on ITS-services for freight transportation. Public transport likewise makes use of new ITS-services and the study could be expanded to scrutinise the need for a sophisticated performance measurement and evaluation in that application area.

References
65
References Allenström, E., & Linger, M. (2010). Introducing Lean in Motor Carrier Firms through
Continuous Improvement. Master’s thesis, Chalmers University of Technology.
Anderson, J. (2001). Tools for Improved Performance in the Supply Chain –Experiences from a Software Development Project. Licentiate Thesis from Lund University.
Baldwin, J., & Lin, Z. (2001). Impedements to Advanced Technology Adoption for Ca-nadian Manufacturers. Micro Economic Analysis Devision, Statistics Canada. Retrieved 2011-04-26, from http://dsp-psd.pwgsc.gc.ca/Collection/CS11-0019-173E.pdf
Behn, R. D. (2003). Why Measure Performance? Different Purposes Require Different Measures. Public Administration Review, 63, 586-606.
Bond, T. C. (1999). The role of performance measurement in continuous improvement. International Journal of Operations & Production Management, 19, 1318-1334.
Bourne, M., Mills, J., Wilcox, M, Neely, A., & Platts, K. (2000). Designing, implement-ing and updating performance measurement systems. International Journal of Operations & Production Management, 20, 754-771.
Bowersox, D. J., Closs, D. J., & Stank, T. P. (1999). 21st Century Logistics: Making Supply Chain Integration a Reality. Council of Logistics Management, Oak Book.
Brewer, P. C., & Speh, T. H. (2000). Using the Balanced Scorecard to measure supply chain performance. Journal of Business Logistics, 1, 75.
Bryman, A., & Bell E. (2007). Business Research Methods (2nd ed.). New York: Ox-ford University Press.
Business Dictionary. (2011). Retrieved 2011-04-26, from http://www.businessdictionary.com/definition/stakeholder.html
Campbell, J., Maxey, V., & Watson, W. (1995). Hawthorne Effect: Implications for Prehospital Research. Annals of Emergency Medicine, 26(5), 590-594.
Californian Department of Transportation. (2007). Benefit-Cost Analysis. http://www.dot.ca.gov/hq/tpp/offices/ote/benefit_cost/calculations/types.html#bcratio
Caplice, C., & Sheffi, Y. (1994). A review and evaluation of logistics metrics. Interna-tional Journal of Logistics Management, 5(2), 11-28.
Chan, F. T. S., & Qi, H. J. (2003). Feasibility of performance measurement system for supply chain: a process-based approach and measures. Integrated Manufactur-ing System, 14(3), 179–190.
Christopher, M. (2005). Logistics and Supply Chain Management – Creating Value-Adding Networks (3rd ed.). Harlow: Pearson Education Ltd.
References
66
Cooper, M. C., Lambert, D. M., Pagh, J. D. (1997). Supply chain management – more than just a new name for logistics. International Journal of Logistics Manage-ment, 8(1), 1-14.
Council of Supply Chain Management Professionals (2011). Supply Chain Management Definitions. Retrieved 2011-28-02, from http://cscmp.org/aboutcscmp/definitions.asp
Coyle, J. J., Bardi, E. J., & Novack, R. A. (2000). Transportation (5th ed.). South-West College Publishing.
Coyle, J. J., Bardi, E. J., & Langley Jr., C. J., (1996). The management of Business Lo-gistics (6th ed.). Western Publishing Company.
Coyle, J. J., Bardi, E. J., & Langley, C. J. (1992). The management of Business Logis-tics. St Paul: West Publishing Company.
Crainic, T. G., Gendreau, M., & Potvin, J.-Y. (2009). Intelligent freight-transportation systems: Assessment and the contribution of operations Research. Transporta-tion Research Part C, 17, 541-557.
Davidsson, P., Henesey, L., Ramstedt, L., Törnquist, J., Wernstedt, F. (2005). An analy-sis of agent-based approaches to transport logistics. Transportation Research Part C, 13, 255–271.
Ecorys Transport. (2005). Ex ante Evaluation of the deployment programme for ITS (2007-2013) following the MIP TEMPO programme 2001-2006 [Final report]. Rotterdam: Ecorys Transport.
E-Freight. (n.d.) Project Background. Retrieved 2011-03-01, from http://www.efreightproject.eu/default.aspx?articleID=18776&heading=Background
Emerald Science. (2011). How to do Research Guides. Retrieved 2011-02-02, from http://www.emeraldinsight.com.bibl.proxy.hj.se/research/guides/methods/index.htm
Emmelhainz, M. A. (1990). Electronic Data Interchange: A Total management guide. New York: Van Nostrand Reinhold.
European Commission. (2008). ICT and e-Business Impact in the Transport and Logis-tics Service Industry(Impact Study No. 05/2008). Bonn / Brussels.
European Commission Extra Consortium for DG Energy and Transport. (2001). Intelli-gent Transport Systems. Results from the transport research programme (ISBN 92-894-1555-X) [Brochure]. Luxembourg: Office for Official Publica-tions of the European Communities.
FESTA consortium, (2008). Festa Handbook Version 2. [Field Operational Test Hand-book]. (Available from http://www.its.leeds.ac.uk/festa/downloads.php)
Fisher, M. L. (1997). What is the right supply chain for your product? Harvard Business Review, 75(2), 105-116.

References
67
Freight Best Practice. (2007). Performance Management for Efficient Road Freight Operations. Department of Transport.
Frohlich, M. T., & Westbrook, R. (2001). Arcs of integration: An international study of supply chain strategies. Journal of Operations Management, 19(2), 185-200.
Fugate, B. S., Mentzer, J. T., & Stank, T. P. (2010). Logistics Performance: Efficiency, Effectiveness, and Differentiation. Journal of Business Logistics, 31(1), 43-62.
Giannopoulos, G. A. (2009). Towards a European ITS for freight transport and logis-tics: results of current EU funded research and prospects for the future. Euro-pean Transport Research Review, 1, 147-161.
Golafshani, N. (2003). Understanding Reliability and Validity in Qualitative Research. The Qualitative Report, 8(4), 597-607.
Gunasekaran, A., Patel, C., & Tirtiroglu, E. (2001). Performance Measurement metrics in a supply chain environment. International Journal of Operations & Produc-tion Management, 21(1/2), 71-87.
Gunasekaran, A., Patel, C., & Tirtiroglu, E. (2001). Performance Measurement metrics in a supply chain environment. International Journal of Operations & Produc-tion Management, 21(1/2), 71-87.
Gunasekaran, A., Patel, C., & McGauhey, R. E. (2004). A framework for supply chain performance measurement. International Journal of Production Economics, 87, 333-347.
Heimbecher, J. (n.d.) Home truth: Data dilemmas. Retrieved 2011-03-24, from http://www.vehicledynamicsinternational.com/industry-blogs.php?BlogID=386
Hertz, S., & Alfredsson, M. (2003). Strategic development of third party logistics pro-viders. Industrial Marketing Management, 32 (2), 139-49.
Holmberg, S. (2000). A system perspective on supply chain measurement. International Journal of Physical Distribution and Logistics Management 30 (10), 847-868.
Holmqvist, J., & Stefansson, G. (2007). Mobile RFID a case from Volvo on innovation in SCM. Journal of Business Logistics. 27(2), 251-272.
Hoppe, H.C. (2002). The Timing of New Technology Adoption: Theoretical Models and Empirical Evidence. The Manchester School, 70(1), 56-76.
Hox, J.J., & Boeije, H.R. (2005). Data Collection Primary vs. Secondary. Encyclopedia
of Social Measurement, 1, 593-599.
Hultman, J. (2007). Rethinking adoption – Information and communications technology interaction within the Swedish automobile industry. Dissertation, Jönköping In-ternational Business School.
Kanflo, T. (1999). Information in Transportation Chains. Chalmers University of Tech-nology.

References
68
Kanflo, T. (1997). Information Flows in Logistics Channels. In Tilanus, B. (Ed.), Information Systems in Logistics and Transportation (p.169-188). New York: Pergamon.
Kaplan, R., & Norton, D. (1992). The Balanced Score Card – Measures that drive per-
formance. Harvard Business Review, 70(4), 71-79.
Kaplan, R. S., & Norton, D. P. (1996). Linking the balanced scorecard to strategy (re-printed from the balanced scorecard. California Management Review, 39(1), 53-79.
Keebler, J. S., Manrodt, K. B., Durtsche, D. A., & Ledyard, D. M. (1999). Measuring the business value of logistics in the supply chain. Council of Logistics Man-agement.
Kerssens-Van Drongelen, I. C., & Fischer, O. A. M. (2003). Ethical dilemmas in per-formance Measurement. Journal of Business Ethics, 45(1/2), 51-63.
Kirvesoja, H. (2001). Experimental ergonomic evaluation with user trials: EEE product development procedures. Licentiate Thesis from Oulu University.
Kvale, S. (1996). InterViews: An Introduction to Qualitative Research Interviewing (1st ed.). Sage Publications.
Lai, K. H., Ngai, E. W. T., & Cheng, T. C. E. (2002). Measures for evaluating supply chain performance in transport logistics. Transport Research Part E, 38, 439-456.
Lambert, D. M., Stock, J. R., & Ellram, L. M. (1998). Fundamentals of Logistics Man-agement. Boston: Irwin McGraw Hill.
Langley, C. J., & Holcomb, M. C. (1992). Creating Logistics Customer Value. Journal of Business Logistics, 13(2), 1-27.
Levy, M., Powell, P. & Yetton, P. (2001). SMEs: aligning IS and the strategic context. Journal of Information Technology, 16(3), 133-144.
Lincoln, Y. S., & Guba, E. G. (1985). Naturalistic Inquiry (1st ed.). Sage Publications.
Maccubbin, R. P., Staples, B. L., Kabir, F., Lowrance, C. F., Mercer, M. R., Philips, B. H., & Gordon, S. R. (2008). Intelligent Transportation Systems Benefits, Cost, Deployment, and Lessons learned. 2008 Update.
Manheim, M. L. (1979). Fundamentals of Transportation System Analysis. Cambridge, Massachusetts: MITS Press.
McKinnon, A. C. (2009). Benchmarking road freight transport - Review of a govern-ment-sponsored programme. Benchmarking: An International Journal, 16(5), 640-656.
Mentzer, J. T., & Konrad, B. P. (1991). An efficiency/effectiveness approach to logis-tics performance analysis. Journal of Business Logistics, 12(1), 33-61.

References
69
Neely, A. D., Gregory, M. J., & Platts, K. (2005). Performance measurement system de-sign: a literature review and research agenda. International Journal of Opera-tions & Production Management, 25(12), 1228-1263.
Nguyen, T. H. (2008). Information Technology Adoption in SMEs: an integrated framework. International Journal of Entrepreneurial Behavior & Research, 15(2), 162-186.
Nisbett, R. E., Wilson, T. D. (1977). The Halo Effect: Evidence for Unconscious Altera-
tion of Judgments. Journal of Personality and Social Psychology, 35(4), 250-256.
Nyquist, C. (2007). Improving Efficiency and Security in an Intermodal Transport Chain. Chalmers University of Technology.
ODETTE. (2007). Key Performance Indicators for Carriers & Logistics Service Pro-viders. Retrieved 2011-14-03, from https://forum.odette.org/publications.
Paulsson, U. (1999). Rapporter och uppsatser: med eller utan uppdragsgivare. Stu-dentlitteratur.
Performance-Based Management Special Interest Group. (1995). How to Measure Per-formance--A Handbook of Techniques and Tools. Retrieved 2011-03-07, from http://www.orau.gov/pbm/documents/handbook1.html
Power, D. (2005). Supply chain management integration and implementation: a litera-ture review. Supply chain management: An International Journal, 10(4), 252-263.
Prekumar, G. & Roberts, M. (1999). Adoption of new information technologies in rural small businesses. Omega, 27(4), 467-84.
Princeton University Dictionary. (2011). Retrieved 2011-03-16, from http://wordnetweb.princeton.edu/perl/webwn?s=availability
Rogers, E. M. (1995). Diffusion of innovations (4th. ed.). New York: Free Press.
Rohalstandas, A. (1995). Performance Measurement: A Business Process Benchmark-ing Approach. Chapman and Hall, New York, NY.
SMART-CM. (2008). Project Background. Retrieved 2011-02-15, from http://www.smart-cm.eu/Project/Objectives/tabid/73/Default.aspx
Stahlknecht, P., & Hasenkamp, U. (2004). Einführung in die Wirtschaftsinformatik (11 th ed.). Springer.
Standish Group. (2005). Chaos Report. West Yarmouth: The Standish Group.
Stefansson, G., & Lumsden, K. (2008). Performance issues of Smart Transportation Management systems. International Journal of Productivity and Performance Management, 58(1), 55–70.
Sternberg, H. (2008). Freight Transportation Operations and Information Sharing. Li-centiate thesis, Chalmers University of Technology.
References
70
Strang, D. & Soule, S. A. (1998). Diffusion in Organisations and Social Movements: From Hybrid Corn to Poison Pills. Annual Review of Sociology, 24, 265-90.
Supply Chain Council. (2006). Supply Chain Operations Reference Model. Retrieved 2011-02-15, from http://supply-chain.org/f/SCOR-Overview-Web.pdf
Tangen, S. (2004). Evaluation and Revision of Performance Measurement Systems Doctorial Thesis, Stockholm, Department of Production Engineering, Royale Institute of Technology.
The Free Dictionary. (2011). Retrieved 2011-03-16, from http://www.thefreedictionary.com/robust
Tilanus, B. (1997). Information systems in logistics and transportation (2nd ed.). Per-gamon Press.
Trappey, A. J. C., Trappey, C.V., Hou, J. L. & Chen, B. J. G. (2004). Mobile agent technology and application for online global logistics service. Industrial Man-agement & Data Systems, 104(2), 169-183.
US Department of Transportation Federal Aviation Administration. (1999). Air Traffic Control Specialist Performance Measurement Database. (DOT/FAA/CT-TN99/17). (Available from National Technical Information Service, Spring-field, Virginia 22161).
US Department of Transportation. (2008). Intelligent Transportation Systems: Benefits, Costs, Deployment, and Lessons Learned (no. FHWA-JPO-08-032). (Available from: http://www.its.dot.gov/).
Vehicle Communications. (n. d.). About VehCo. Retrieved 2011-04-04, from http://uk.vehco.com/about-vehco
Volvo Technology AB. (2010). Secure Intermodal Transport System (SITS) – for an ef-ficient and harmonised supply chain. [Project Proposal]. Göteborg: Volvo Technology AB.
Waggoner, D. B., Neely, A. D., & Kennerly, M. P. (1999). The focus that shape organ-izational performance measurement systems: an interdisciplinary review, In-ternational Journal of Production Economics, 60, 53-60.
Wisconsin Department of Transportation. (2000). A Framework for the evaluation of the benefits of Intelligent Transport Systems. Retrieved 2011-03-12, from http://ntl.bts.gov/lib/23000/23400/23404/45-20itsbenefits-f.pdf
Woxenius, J. (1997). Information Flows Along Integrated Transport Chains. In: Tilanus, C. B. (Ed.) Information Systems in Logistics and Transportation (pp. 137-155). Oxford: Pergamon.
Woxenius, J. & Rodrigue, J. P. (2011). The Scope of a Supply Chain, Logistics Chains and Transport Chains. The Geography of Transport Systems, Hofstra Univer-sity, Department of Global Studies & Geography, Retrieved 2011-02-16, from http://people.hofstra.edu/geotrans

References
71
Yin, R. K. (2008). Case Study Research: Design and Methods (4th ed.). Sage Publica-tions.

Appendix
72
Appendix A: Interview Guideline 1
1. Facesheet questions 1.1 Would it be ok if we record this interview for our purposes? 1.2 Can you tell us your name? 1.3 What is your position in the company? 1.4 What are your duties/task around your position? 1.5 How long have you been working in that position? 1.6 How long have you been working in that field?
2. ITS related questions 2.1 What are your steps when implementing new ITS-services? 2.2 Do you first implement/test them on a small scale scenario before using them for all of the operations? 2.3 How do you decide on these test scenarios? 2.4 Do you think it would be possible to rank impact areas when evaluating new ITS services? 2.5 Do you talk/interact with other stakeholders before implementing new ITS- services?
3. Key Performance Indicator (KPI) related questions 3.1 Do you make use of Key Performance Indicators? 3.2 How do you select relevant KPI? 3.3 Do you have KPI categories? 3.4 Do you have specific methods to gather data for the calculation of KPI?
4. Closing questions 4.1 Do you have any questions for us? 4.2 Would it be ok to contact you again in case further questions arise? 4.3 Can we send you a transcript of this interview to confirm the accuracy?

Appendix
73
Appendix B: Interview Guideline 2
1. Facesheet questions 1.1 Would it be ok if we record this interview for our purposes? 1.2 Can you tell us your name? 1.3 What is your profession? 1.4 What is your research area? 1.5 How long have you been working in that position? 1.6 How long have you been working in that area?
2. ITS related questions 2.1 How would you define Intelligent Transport Systems? 2.2 What are important steps when testing and implementing new ITS-services?
2.3 Do you think it would be possible to rank impact areas when evaluating new ITS services?
2.4 What kind of stakeholder interaction do you think is necessary before imple menting new ITS-services?
3. Performance Measurement related questions 3.1 How can performance improvements through ITS be measured? 3.2 What are tools and methods to capture these performance gains? 3.3 How would you evaluate the measurement outcomes? 3.4 Are there specific methods to gather data for the calculation of performance met- rics?
4. Closing questions 4.1 Do you have any questions for us? 4.2 Would it be ok to contact you again in case further questions arise? 4.3 Can we send you a transcript of this interview to confirm the accuracy?

Appendix
74
Appendix C: Managerial Guideline
The managerial guideline is meant to be a roadmap indicating critical activities in the process of performance measurement in the field of ITS and not a cookbook: it might need to be adjusted to the specific circumstances in order to increase the efficiency of the approach and avoid inconsistencies. Even though the guideline might also be useful for the users of ITS in the transportation industry, it primarily aims at supporting the developing companies to assess the potential of the new service. Due to the limited amount of time for the thesis work, only a couple of relevant tools for the assessment process can be suggested which however does not mean that people assessing ITS are limited to this narrow selection.
Service Definition
Tasks:
�Define the application area
�Determine the functions of the ITS-service within the application area
�Name the ITS-service
Considerations and tools:
• Hardware and software capabilities define the possibilities and limits of the ITS-service
Outcomes:
�Mutual understanding about the ITS-service
Stakeholder Analysis
Tasks:
�Identify the stakeholders
�Grouping in direct and indirect stakeholders
�Define the role of the stakeholders in the measurement process
Considerations and tools:
• Knowledge about the application areas can help to identify the stakeholders affected by
the ITS-service
•Stakeholders can be both actors that perceive the impacts through the ITS-service in a
positive or a negative way
•Some stakeholders might already be involved during the development of the ITS-service
and are thus easy to identify
•Brainstorming or workshops can be used as tools to identify the stakeholders
Outcomes:
�Direct and indirect stakeholders are identified
�Potential winners and potential losers are identified
�The roles for the different stakeholders are clear

Appendix
75
Identification of Impact Areas
Tasks:
�Find out where the stakeholders see the main impacts from the ITS-service
�Translate the identified impact areas into performance dimensions
�Rank the performance criteria based on the stakeholders perspective
Considerations and tools:
• All stakeholders affected by the ITS-service need to be identified prior to identifying the
impact areas
•Impacts on efficiency are usually easier to convert into monetary terms
•The performance break down structure can be used as a tool to identify the performance
dimension, the performance criteria and related metrics
Outcomes:
�Knowledge about impact areas that are of interest for the stakeholder
�Knowledge about the performance dimension in the focus
Design of Measurement Scenarios
Tasks:
�Decide for a closed loop scenario that will be used for the measurement
�Define the measurement objects
�Define the size of the measurement sample
�Decide for data collection methods
Considerations and tools:
• Prior to designing the measurement scenarios the functions of the service need to be
clear, the stakeholders involved in the measurement need to be identified and the impact
areas of interest need to be clear
•Scenarios should be selected based on proximity, accessibility, representativeness and
convenience
Outcomes:
�Representative measurement scenarios
KPI Design and Selection
Tasks:
�Choose the relevant KPI or set of KPI
�Define the selected KPI
�Define formula for the calculation
�Identify the data input required for calculating the KPI
Considerations and tools:
• Prior to selecting the KPI the test scenarios need to be defined and the performance
dimension and performance criteria influenced by the ITS-service need to be clear
•The selected KPI need to be “good” KPI
•The required input data for the KPI must be accessible
•The performance break down structure can be used as a tool to select relevant KPI
Outcomes:
�A selection of KPI that are clearly defined and mutually understood
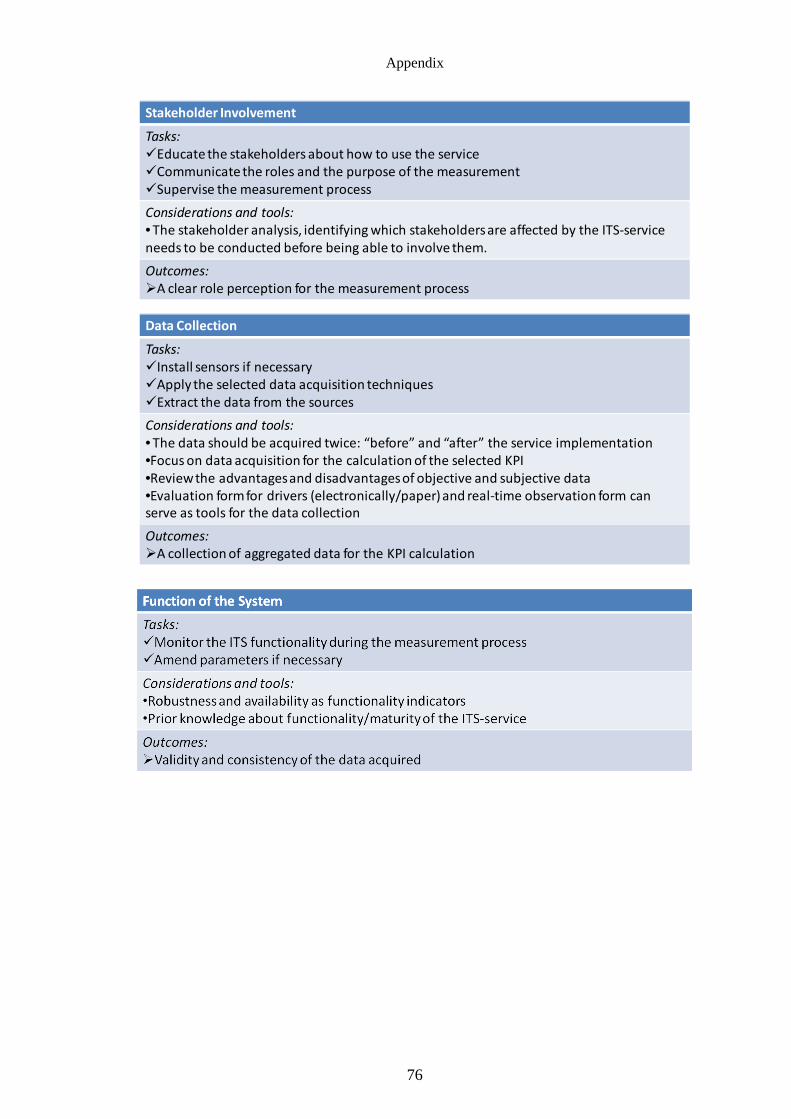
Appendix
76
Stakeholder Involvement
Tasks:
�Educate the stakeholders about how to use the service
�Communicate the roles and the purpose of the measurement
�Supervise the measurement process
Considerations and tools:
• The stakeholder analysis, identifying which stakeholders are affected by the ITS-service
needs to be conducted before being able to involve them.
Outcomes:
�A clear role perception for the measurement process
Data Collection
Tasks:
�Install sensors if necessary
�Apply the selected data acquisition techniques
�Extract the data from the sources
Considerations and tools:
• The data should be acquired twice: “before” and “after” the service implementation
•Focus on data acquisition for the calculation of the selected KPI
•Review the advantages and disadvantages of objective and subjective data
•Evaluation form for drivers (electronically/paper) and real-time observation form can
serve as tools for the data collection
Outcomes:
�A collection of aggregated data for the KPI calculation
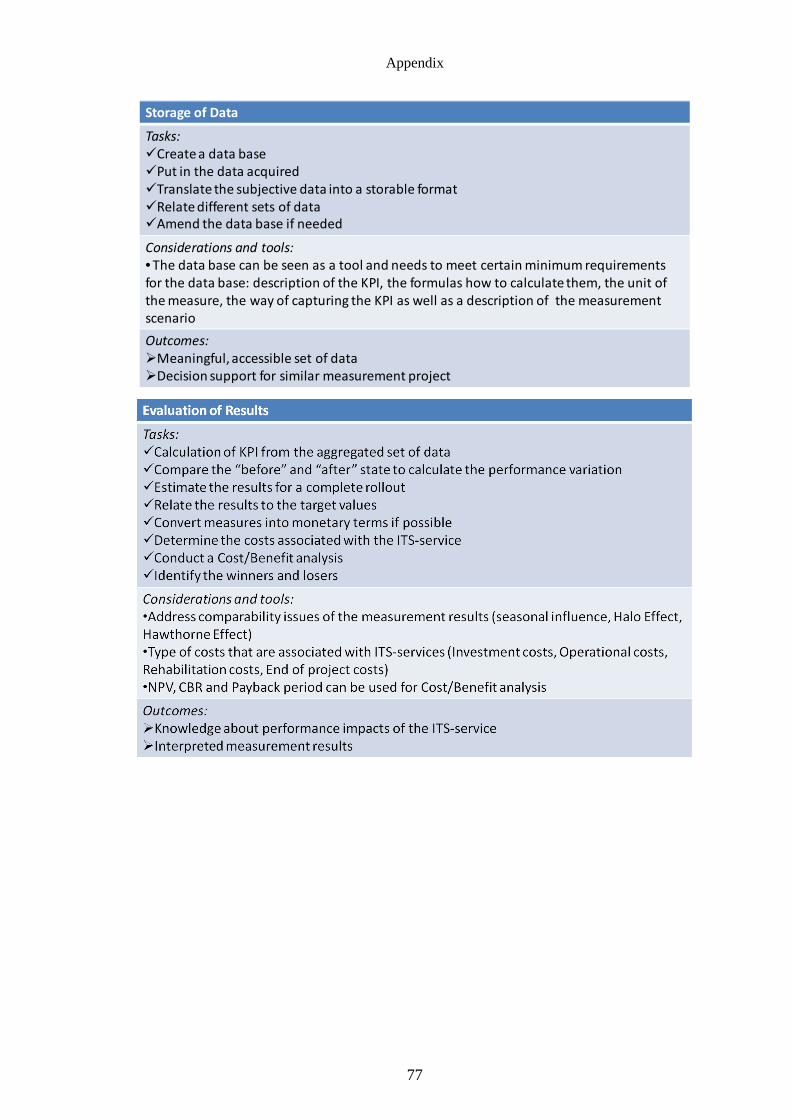
Appendix
77
Storage of Data
Tasks:
�Create a data base
�Put in the data acquired
�Translate the subjective data into a storable format
�Relate different sets of data
�Amend the data base if needed
Considerations and tools:
• The data base can be seen as a tool and needs to meet certain minimum requirements
for the data base: description of the KPI, the formulas how to calculate them, the unit of
the measure, the way of capturing the KPI as well as a description of the measurement
scenario
Outcomes:
�Meaningful, accessible set of data
�Decision support for similar measurement project

Appendix
78

Appendix
79
Appendix D: Description of Performance Attributes
Performance:
Performance measurement is defined as the process of quantifying effectiveness and ef-ficiency of action. Basically all the different logistics performance criteria are embraced by the three performance dimensions of efficiency, effectiveness and differentiation.
Efficiency:
Efficiency measures how well resources are utilised. It is described as the ability to pro-vide the desired product/service mix at a level of cost that is accepted to the customer. The performance of a logistics function can thus be improved by minimising the ratio of resources against derived results.
Effectiveness:
Effectiveness is concerned with the extent to which goals are accomplished, in other words, the ration between the actual output and the expected output. It has been de-scribed as the ability to achieve pre-defined objectives, for example meeting customer demands in critical areas.
Differentiation:
Compared to other competitors the logistics activities are perceived differentially supe-rior in a certain market segment.
Utilisation:
Utilisation refers to the ratio of actual capacity used to maximum capacity available. It encompasses asset (facility, equipment, vehicle) and time utilisation.
Productivity:
Productivity describes the ratio of inputs (i.e. fuel or labour) to outputs (i.e. km driven, order processed).
Reliability:
Reliability is considered the “ability of one specific event or activity to perform a re-quired function under stated conditions for a stated period of time.
Flexibility:
Flexibility describes the ability of one specific activity to adapt to the varying functional requirements or respond to the changes.
Security/Safety:
Supply Chain security is defined as the application of policies, procedures, and technol-ogy to protect supply chain assets (product, facilities, equipment, information, and per-sonnel) from theft, damage, or terrorism and to prevent the introduction or unauthorised contraband, people or weapons of mass destruction into the supply chain. Security is concerned with intentional fault whereas safety refers to the state of being safe against unintentional fault such as accident, weather or other external influences.

Appendix
80
Sustainability:
Sustainability in a transportation context can be defined as the ability to meet today’s transportation needs without compromising the ability of future generations to meet their transportation needs.

Appendix
81
Appendix E: The Economic Analysis Approach
1. For the calculation of the CBR the total discounted benefits are divided by the total discounted costs.
∑
∑
=
=
+
+=n
ii
i
n
ii
i
d
Cd
B
CBR
0
0
)1(
)1(
n = the number of years over which benefits and costs are analysed
Bi = the benefits of the service in year i, i=0 to n Ci = the costs of the service in year i d = the discount rate
A CBR bigger than 1 indicates that the benefits of having the ITS-service in place out-weigh the cost associated with it. However, it is important to keep in mind that the CBR does not consider the magnitude of the benefits and cost.
2. For the calculation of the NPV the aggregated discounted cost are subtracted from the aggregated benefits of the ITS-service.
∑∑== +
−+
=n
ii
in
ii
i
d
C
d
BNPV
00 )1()1(
n = the number of years over which benefits and costs are analysed Bi = the benefits of the project in year i, i=0 to n Ci = the costs of the project in year i d = the discount rate
A positive NPV indicates that the benefits of the ITS-service outweigh the costs associ-ated with it. It needs to be noted that a large ITS-service could have a significantly posi-tive NPV, even if the CBR is just above 1. This could easily lead to misinterpretations.
3. In some cases it is interesting to know how long it would take an investment to pay off. This is commonly known as the payback period. The first year in which the accu-mulated benefits exceed the accumulated costs is the payback period. It is assumed that

Appendix
82
after this period, the benefits will exceed the costs (Californian Department of Transpor-tation, 2007).
Yeari Benefits Costs
0
1
2
n
Yeari Benefits Costs
0
1
2
n
00
)1( d
B
+ 00
)1( d
C
+
00
11
)1()1( d
B
d
B
++
+ 00
11
)1()1( d
C
d
C
++
+
00
11
22
)1()1()1( d
B
d
B
d
B
++
++
+ 00
11
22
)1()1()1( d
C
d
C
d
C
++
++
+
ii
n
i d
B
)1(0 +∑=
ii
n
i d
C
)1(0 +∑=


