Performance, Fatigue and Recovery in Soccer · 2019. 6. 12. · Silva, J. (2011). Performance,...
446
Performance, Fatigue and Recovery in Soccer Functional and biochemical analysis of professional players during a soccer season Academic dissertation submitted with the purpose of obtaining a doctoral degree in Sports Sciences according to the Decree-Law 74/2006 from March 24 th Supervisor: Prof. Dr. António Natal Campos Rebelo Co-Supervisor: Prof. Dr. José Fernando Magalhães Pinto Pereira João Renato Marques e Silva Porto, 2012
Transcript of Performance, Fatigue and Recovery in Soccer · 2019. 6. 12. · Silva, J. (2011). Performance,...

Performance, Fatigue and Recovery in Soccer
Functional and biochemical analysis of professional
players during a soccer season
Academic dissertation submitted with the purpose of obtaining a doctoral
degree in Sports Sciences according to the Decree-Law 74/2006 from
March 24th
Supervisor:
Prof. Dr. António Natal Campos Rebelo
Co-Supervisor:
Prof. Dr. José Fernando Magalhães Pinto Pereira
João Renato Marques e Silva
Porto, 2012

Silva, J. (2011). Performance, Fatigue and Recovery in Soccer - Functional and
biochemical analysis of professional soccer players during a soccer season.
Doctoral Thesis in Sport Sciences. Centre of Research, Education, Innovation
and Intervention in Faculty of Sport, University of Porto.
KEYWOORDS: SOCCER SEASON, TRAINING STATUS, SOCCER
PHYSIOLOGY, PROFESSIONAL PLAYERS, TIME-MOTION ANALYSIS,
HORMONAL STATUS, OXIDATIVE STRESS, MUSCLE DAMAGE.

III
Acknowledgments
It is a pleasure to thank the many people who made this thesis possible.
First I want to thank my advisor Prof. Dr. Antonio Natal and to my co-advisor
Prof. Dr. José Magalhães. It has been an honour to be their Ph.D. student. I
appreciate all their contributions of time, ideas to make my Ph.D. experience
productive and stimulating.
Second but not least I want to thanks
Prof. Dr. António Ascensão for the comments, good advice and support, for
which I am extremely grateful.
Prof. Dr. André Seabra for all is engagement in the statistical analysis and is
availability.
Prof. Dr. Laura for all is accessibility and commitment in the laboratory
procedures.
Prof. Dr. Peter Krustrup for receiving me in his University.
My studies would not have been possible without the collaboration and
cooperation of the technical staff which I worked in the last years. My enormous
debt of gratitude can hardly be repaid to my good friends António Conceição
“TONI” and Luis Baltazar. I thank them for the understanding, endless patience
and encouragement when it was most required.
To Eduardo Oliveira, Inés Aleixo, Emmanuel Passos and Liliana Brochado for
all their help and technical support in the laboratory.
To the office people of the FADE for the support, understanding and availability.

IV
To the soccer players involved in the study for their committed participation.
To all my friends that constantly asked me “are you done yet?”. Thank you for
your encouragement, support and most of all your humor.
Afinally
I want to give thanks to my parents, brothers and all my familly. Parents thanks
for the admirable qualities that you installed in me and for the good foundation
to meet life. You taught me about hard work and self-respect, about persistence
and about how to be independent. Both have always expressed how proud they
are of me and how much they love me. I too am proud of them and love them
very much. To my brothers Tiago, Pedro and sister, Ana, what can I say A. You
are my biggest treasure. To my family thanks for THEIR LOVE and for being a
FAMILY.
Last but not least, a big thank you to my wife, Margarida. Without her I would be
a very different person today, and it would have been certainly much harder to
finish a PhD. Still today, learning to love her and to receive her love makes me
a better person.
V
This thesis is based on the following reviews (R-I and R-II) and studies (S-I, S-
II, S-III, S-IV, and S-V) which are referred to in the text by their Roman
numerals:
R-I.
Silva, JR., Magalhães, J., Ascensão, A., Rebelo, A. Changes in soccer players’
physiological and physical characteristics throughout the season - A Review.
R-II.
Silva, JR., Magalhães, J, Ascensão, A., Rebelo, A. Strength and Muscle Power
training in Soccer - A Review.
S-I.
Silva, JR., Magalhães, J., Ascensão, A., Oliveira, E., Seabra, A., Rebelo, A.
(2011). Individual match playing time during the season affects fitness-related
parameters of male professional soccer players. J Strength Cond Res 25 (10):
2729-2739.
S-II.
Silva, JR., Ascensão, A., Marques, F., Rebelo, A., Magalhães, J.(2012)
Neuromuscular function, hormonal and redox status, muscle damage of high-
level soccer players throughout a season competition. Under review
S-III.
Silva, JR., Magalhães, J., Ascensão, A., Seabra, A., Rebelo, A. (2012) Training
status and match activity of professional soccer players throughout a season.
Under review. J Strength Cond Res [Epub ahead of print]
S-IV.
Magalhães, J., Rebelo, A., Oliveira, E., Silva, JR., Marques, F., Ascensão, A.
(2010). Impact of Loughborough Intermittent Shuttle Test versus soccer match on
physiological, biochemical and neuromuscular parameters. Eur J App Physiol 108
(1): 39-48.

VI
S-V.
Silva, JR., Ascensão, A., Marques, F., André Seabra., Rebelo, A., Magalhães, J.
Neuromuscular function, hormonal and redox status, muscle damage of
professional soccer players during the 72-h recovery after a high-level
competitive match. Under review.

VII
Abstract
Training and matches, in particular, represent a major source of stress during the soccer competitive season. Soccer physiology-related factors show that players need a well-developed physical fitness in order to cope with the soccer-specific demands. However, little is known regarding the alterations and putative relationships between soccer players’ physical fitness, hormonal environment and oxidative status, muscle damage and inflammatory markers under demanding soccer competitive stress conditions. In this dissertation, a series of studies (5) comprising distinct experimental designs involving semi-professional and professional players under scenarios of acute and chronic exposure was used to analyse the impact of soccer competition and training on several distinct physical fitness parameters, hormonal and redox status, muscle damage and inflammation markers. In studies I, II and III we investigated, (i) the effects of an entire soccer season on physical fitness, game physical performance, hormonal and oxidative status, muscle damage and inflammatory parameters in a team of professional male soccer players; (ii) the association between these parameters and the influence of individual match playing time (IMPT); (iii) changes in match activity and fatigue development during official soccer games in different moments of a season; (iv) and the influence of training status on match activity and fatigue. Performance in 5m and 30m sprint (T5 and T30), countermovement jump (CMJ), change of direction speed (COD; T-test), knee extensors (KE) and flexors (KF) isokinetic strength, hamstrings/quadriceps strength ratio (H/Q) and bilateral differences (BD), and Yo-Yo intermittent endurance test 2 (YYIE2) were evaluated throughout the season. IMPT was also quantified. Plasma testosterone (T), cortisol (C), creatine kinase (CK), superoxide dismutase (SOD), glutathione peroxidase (GPX) and reductase (GR) activities, myoglobin (Mb), C-reactive protein (CRP), uric acid (UA), protein sulfhydryls (-SH), malondialdehyde (MDA) contents and total antioxidant status (TAS) were measured. In studies IV and V the aims were to investigate (i) the impact of Loughborough Intermittent Shuttle Test (LIST) versus soccer match on heart rate (HR), muscle damage (CK e Mb), redox status (TAS, UA, MDA and -SH), blood leukocytes counts and neuromuscular function (20 meters sprint, CMJ, KE and KF) throughout recovery, and (ii) the impact of an official high-level competitive match on hormonal (T, C), redox status (TAS, UA, SOD, GPX, GR, MDA and -SH), muscle damage (CK and Mb) and inflammatory (CRP) parameters, and on neuromuscular function (T5, T30, COD, CMJ, KE and KF). In general, data collected present an interesting scenario regarding players’ physical fitness and match activity (MA) throughout the season. Professional players showed an improved MA and expressed low levels of fatigue during the match towards the end-of-season. The interrelationship between neuromuscular parameters (NP) and between NP and game-physical performance highlighted the relevance of muscle strength and power in soccer. Moreover, IMPT influenced physical, hormonal and oxidative-related markers. Despite the increase in certain stress bio-markers during season and post-match recovery periods, higher standards players seem to cope with soccer demands

VIII
throughout the season and show lower post-match performance impairments and faster recovery kinetics than lower level players. Keywords: soccer season, training status, soccer physiology, professional players, time-motion analysis, hormonal status, oxidative stress, muscle damage.

IX
Resumo Os treinos e os jogos, em particular, representam um elevado fator de stresse fisiológico nos jogadores de alto nível. Como tal, os jogadores de futebol necessitam de um elevado nível de condição física para responder às exigências que lhe são colocadas durante um exigente período competitivo. Contudo, pouco se sabe sobre as alterações e as relações que se estabelecem entre a condição física (CF), a atividade física do jogador no jogo (AFJ), o ambiente hormonal e oxidativo, marcadores de lesão/agressão muscular esquelética (LAME) e inflamatórios em jogadores profissionais de futebol durante exigentes condições competitivas. Nesta dissertação, 5 estudos com distintos desenhos experimentais, envolvendo jogadores semi-profissionais e profissionais em cenários de exposição aguda e crónica, foram realizados para analisar o impacto da época desportiva em distintos parâmetros da CF, na resposta hormonal e oxidativa e em marcadores inflamatórios e de LAME. Nos estudos I e II e III foram estudadas, (i) alterações de performance de testes de CF e no padrão de AFJ, na resposta hormonal e oxidativa e em marcadores inflamatórios e de LAME; (ii) correlações entre as alterações funcionais e bioquímicas e o tempo individual de jogo ao longo da época (TIJ); (iii) alterações no padrão AFJ e no desenvolvimento de fadiga (DF) durante o jogo e em diferentes momentos da época desportiva; (iv) a influência do estado de treino no padrão AFJ e no DF durante o jogo. A performance em sprint de 5 e 30 metros (T5 e T30), salto contra-movimento (SCM), sprint com mudança de direção (SMD; T-test), momento máximo de força dos músculos extensores e flexores do joelho (MMFE e MMFF) e no Yo-Yo Intermittent Endurance Test Level 2 (YYIE2) foram avaliados durante a época desportiva. O TIJ foi quantificado. Os níveis plasmáticos de testosterona (T) e cortisol (C), a atividade das enzimas creatina quinase, (CK), superóxido dismutase (SOD), glutationa peroxidase (GPX) e reductase (GR), o conteúdo de mioglobina (Mb), proteína C-reativa (CRP), ácido úrico (UA), grupos sulfídricos proteicos (-SH), malondialdehydo (MDA) e estado antioxidante total (TAS) foram determinados. Os estudos IV e V tiveram como principais objetivos investigar, (i) o impacto do Loughborough Shuttle Intermitente Test (LIST) versus jogo amigável de futebol ao nível da frequência cardíaca (FC) marcadores de LAME, estado redox, contagem de leucócitos e função neuromuscular (T20, SCM, MMFE e MMFF) durante o período de recuperação, (ii) o impacto de um jogo oficial de futebol profissional na resposta hormonal (T e C) e redox (TAS, UA, SOD, GPX, GR, MDA, -SH), em marcadores de LAME (CK, Mb) e inflamação (CRP) e na função neuromuscular (T5 e T30, SCM, SMD, MMFE, MMFF). Em geral, os resultados sugerem um cenário interessante no que respeita ao nível do estado de treino e da AFJ ao longo da época. Foi observada uma melhoria da AFJ e menor DF durante os jogos realizados perto do final da época. A relação entre diferentes parâmetros da função neuromuscular e entre estes e a AFJ, observadas nos estudos efetuados, realçam a importância da função neuromuscular no futebol de alta competição. O TIJ influencia alguns parâmetros físicos, marcadores hormonais e de stresse oxidativo. Os resultados observados sugerem que apesar do aumento de indicadores de
X
stresse durante períodos de treino, competição e após o jogo, os futebolistas profissionais demonstram possuir uma capacidade efetiva para responder e tolerar as exigências colocadas pela época desportiva. Da mesma forma, aparentam evidenciar uma menor deterioração da performance e uma recuperação mais rápida após o jogo comparativamente à que tem sido descrita em futebolistas de menor nível competitivo. Palavras-chave: época desportiva, estado de treino, fisiologia do futebol, alto rendimento, análise tempo-movimento, resposta hormonal, stresse oxidativo, lesão muscular.

Table of Contents
Acknowledgments III
List of Publications V
Abstract VII
Resumo IX
General Introduction 13
Theoretical Background 29
Review I
Changes in soccer players’ physiological and physical 31
characteristics throughout the season.
Review II
Strength and muscle power training in soccer. 99
Experimental Work 145
Study I
Individual match playing time during the season affects
fitness-related parameters of male professional soccer players. 147
J Strength Cond Res 25 (10): 2729-2739.

Study II
Neuromuscular function, hormonal and redox status, muscle
damage of high-level soccer players throughout a season
competition. Under Review 189
Study III
Training status and match activity of professional soccer players
throughout a season. J Strength Cond Res [Epub Ahead of Print] 229
Study IV
Impact of Loughborough Intermittent Shuttle Test versus soccer
match on physiological, biochemical and neuromuscular parameters. 269
Eur J App Physiol 108 (1): 39-48.
Study V
Neuromuscular function, hormonal and redox status, muscle damage
of professional soccer players after a high-level competitive match.
Under Review 309
General Discussion 345
Conclusions 381
References 385
Appendix 411

13
General Introduction

14

15
General Introduction
Soccer has been a topic of intense research in the last decade. The activity of
top level soccer players during the competitive season entails one week cycles
of training, taper, competition and recovery (Reilly & Ekblom, 2005). However,
this cycle is altered by several irregularities in the competitive fixture list, match
day being not necessarily consistent during in season (Reilly & Ekblom, 2005).
Moreover, professional players in the top clubs may have additional
commitments, such as cup and other knock-out matches, playing for their club
in continental leagues or representing their country in international matches
(Reilly & Ekblom, 2005).
Activities specific to matches are characterized by periods of high-intensity
interspersed with periods of low-intensity exercise. The activity periods vary in
intensity and duration and are punctuated by recovery pauses when activity is
light or the player is static (Drust et al., 2007). Superimposed on this irregular
and unpredictable activity profile are actions directly related to play, e.g.,
physical challenges with opponents in contesting possession of the ball and
jumps to head the ball (Carling et al., 2005).
Data concerning physiological factors shows that players might possess a well-
developed physical fitness in order to cope with the soccer’s physiological
demands (e.g., aerobic and anaerobic power, muscle strength and agility)
(Bangsbo, 1994; Kraemer et al., 2004; Reilly et al., 2008; Reilly & Ekblom,
2005; Svensson & Drust, 2005). Although the majority of reports on players’
physical and physiological characteristics are essentially descriptive, they
provide a logical framework to gain insight into factors determining success in
the game (Drust et al., 2007; Reilly & Gilbourne, 2003). Data reveal that in spite
of evidence of anthropometric predispositions for the different playing positions
within soccer (Carling & Orhant, 2010b), the game demands sufficient skill that
substantial deviations from this profile remain compatible with performance of a
high standard (Shephard, 1999). Different studies suggest that elite soccer
players cover 8 to 13 km during matches (Bangsbo et al., 2006; Bangsbo et al.,
1991) at a mean intensity close to the anaerobic threshold (AT) (Stolen et al.,

16
2005). Moreover, energy expenditure during a match averages 70-75% of
maximal oxygen consumption (VO2max) (Bangsbo et al., 2006; Reilly &
Ekblom, 2005), which suggests that performance at the elite level may, in part,
be determined by aerobic fitness (Reilly & Ekblom, 2005). The component of
the aerobic fitness has been extensively assessed in a laboratory setup
applying valid and reliable protocols (Dittrich et al., 2011). In this regard
VO2max and anaerobic threshold (AT) assessed by ventilatory threshold (VT)
and/or lactate threshold (LT) are two of the most frequently used parameters in
monitoring aerobic fitness of soccer players in laboratory. The determination of
soccer players’ VO2max is important, as the oxygen transport system
strengthens the ability to exercise during the 90-min (Bangsbo, 1994) and to
recover between the short bouts of high-intensity exercise of the game (Dupont
et al., 2005; Hoff, 2005; Tomlin & Wenger, 2001). Research on this topic has
shown that professional soccer players have VO2max values ranging from 52 to
66 ml.kg-1.min-1, depending on the point in the soccer season when the analysis
were performed (Casajus, 2001; Clark et al., 2008; Edwards et al., 2003a;
Haritodinis et al., 2004; Heller et al., 1992; Kalapotharakos et al., 2011; Mercer
et al., 1997; Metaxas et al., 2006; Mohr et al., 2002). The AT is defined as the
highest exercise intensity, at which the production and clearance of lactate
promotes an equilibrium in lactate concentration (Stolen et al., 2005). Several
methods have been implemented to determine AT, including blood lactate and
ventilatory measurements. LT and VT have been advocated as physiological
parameters more sensible to detect changes in players’ fitness than VO2max
(Clark et al., 2008; Edwards et al., 2003a; Helgerud et al., 2001). In this regard,
different physiological parameters during sub-maximal exercise in laboratory
(e.g., speed at LT, heart rate or percentage of VO2max at fixed blood lactate
concentrations) have been determined in professional players throughout the
soccer season. In this regard, the percentage of VO2max at 4mmol lactate
concentration was shown to be equivalent to 77 to 78% of VO2max during in-
season and at 75% of VO2max at the start of season (Brady et al., 1997; Clark
et al., 2008; Edwards et al., 2003a; Kalapotharakos et al., 2011; Mohr et al.,
2002). In addition, maximal aerobic speed, which reflects the maximum aerobic
17
capacity, and combines VO2max and running economy into a single factor
(Billat & Koralsztein, 1996), along with time to exhaustion during maximal
incremental tests (Arent et al., 2010; Edwards et al., 2003a; Haritodinis et al.,
2004; Metaxas et al., 2006; Mohr et al., 2002) have also been used has
physical fitness parameters in players motorization. The energy cost of a run
(running economy) is usually expressed as oxygen cost per meter, or minute at
a defined intensity and is measured at sub-maximal work-rates (Stolen et al.,
2005). Although not frequently, assessment of running economy has also been
used in soccer physiology research and training control, with significant
improvements been reported during pre-season training (Bogdanis et al., 2009;
Bogdanis et al., 2011; Helgerud et al., 2001; Impellizzeri et al., 2006).
Nevertheless, the previous laboratory assessments in addition to require
expensive equipment and being time consuming, involved exercise modes that
are not truly team-sport relevant limiting test specificity (Dittrich et al., 2011).
With this concern, field tests have been used in order to provide results that are
specific to the sport and so, may be more valid than laboratory tests (Svensson
& Drust, 2005). Research using specific endurance field tests (e.g., Yo-Yo tests)
has shown that soccer players possess high levels of aerobic fitness (Edwards
et al., 2003b; Oliveira, 2000; Rampinini et al., 2009a; Rampinini et al., 2009b;
Randers et al., 2007) with higher performances been reported at higher
standards of competition (Edwards et al., 2003b; Rampinini et al., 2009a;
Rampinini et al., 2009b; Randers et al., 2007).
As previously stated, professional players need a well-developed physical
fitness in order to cope with soccer-specific physiological demands (Bangsbo,
1994; Kraemer et al., 2004; Reilly et al., 2008; Reilly & Ekblom, 2005; Svensson
& Drust, 2005). The importance of possessing a well-developed neuromuscular
system in order to deal with the soccer-specific activities in high-level
competition is supported by the individual levels of neuromuscular performance
(e.g., sprint and jump abilities) as well by the activity profile of players in the
match (Bloomfield et al., 2007; Cometti et al., 2001; Dauty & Potiron Josse,
2004; Little & Williams, 2005; Mujika et al., 2008; Reilly et al., 2000). In fact,
despite low to medium intensity running is the predominant activity patterns of

18
soccer players, muscle power-based efforts such as sprints, jumps, duels, and
kicking, which are mainly dependent on maximal strength and anaerobic power
of the neuromuscular system (Cometti et al., 2001), are essential factors to
successfully perform in soccer. Values ranging from 38 to 55-cm and from 37 to
40-cm have been observed in professional players’ performance on jumping
exercises such as the countermovement and squat jump, respectively
(Bogdanis et al., 2011; Casajus, 2001; Clark et al., 2008; Kotzamanidis et al.,
2005; Malliou et al., 2003; Mercer et al., 1997; Ronnestad et al., 2008; Sedano
et al., 2011; Thomas & Reilly, 1979). Among other neuromuscular qualities,
good in-line and shuttle sprint ability has also been reported as important
requirements for high-level soccer performance (Aziz et al., 2005; Cometti et al.,
2001; Dauty & Potiron Josse, 2004; Little & Williams, 2005; Lopez-Segovia et
al., 2010; Ostojic, 2003; Wisloff et al., 2004; Wong et al., 2010). Therefore,
literature consistently asserts that soccer players’ performance is closely related
to the efficiency of different energy-related systems (Stolen et al., 2005). The
importance of soccer players’ fitness has been highlighted since early
investigations into soccer performance (Jacobs et al., 1982; Karlsson, 1969;
McMaster & Walter, 1978; Raven et al., 1976; Reilly & Thomas, 1976; Thomas
& Reilly, 1979; Withers et al., 1982). This was highlighted in review publications
focusing on the different soccer determinants, such as the physiological
characteristics of soccer players (Reilly & Gilbourne, 2003; Shephard, 1999;
Stolen et al., 2005; Svensson & Drust, 2005), soccer players’ biomechanics
(Lees & Nolan, 1998), determinants of soccer players’ performance (Bangsbo et
al., 2007; Bangsbo et al., 2006; Reilly et al., 2008), and soccer specific training-
induced effects (Hill-Haas et al., 2011; Hoff, 2005; Hoff & Helgerud, 2004; Iaia
et al., 2009a). Nevertheless, despite the fact that a considerable number of
review papers have analysed distinct aspects of soccer physiology, reviews
concerning the knowledge provided by investigations regarding the time-line of
the alterations in soccer specific and no-specific endurance and neuromuscular
parameters throughout the season have not yet been composed (review I and
II). Although the information of players’ physiological and functional
characteristics is a matter of undeniable interest, the understanding of how

19
these characteristics change throughout the season is important for coaches,
medical departments and researchers since can be valuable information for
soccer training periodization and monitoring.
Studies on soccer physiology showed that during training and competition,
players undergo a great deal of stress (Bangsbo et al., 2006). Both preseason
and in-season practices and soccer matches generate strains to various
physiological systems of the player (e.g., musculoskeletal, nervous and
cardiovascular) (Bangsbo et al., 2006; Brites et al., 1999; Filaire et al., 2003;
Kraemer et al., 2004; Malm et al., 2004a, 2004b; Rebelo et al., 1998a). These
high demands are confirmed by players’ activity pattern analysis during the
matches (Bloomfield et al., 2007; Mohr et al., 2003; Rampinini et al., 2007b;
Randers et al., 2010; Rienzi et al., 2000), as well as by the examination of the
performance and/or biochemical responses to friendly matches or specific
protocols performed in laboratory and field conditions, and the subsequent
recovery period (Ascensao et al., 2008; Ispirlidis et al., 2008; Krustrup et al.,
2006b; Nicholas et al., 2000; Small et al., 2008; Small et al., 2009). Therefore, it
is important that an adequate balance between training, competition and
recovery is achieved so that the desired training-adaptations might occur. In
fact, high volumes of training and/or competition interspersed by insufficient
recovery may induce fatigue (Filaire et al., 2003), and ultimately an
overreaching state (Kraemer & Ratamess, 2005; Petibois et al., 2002). In this
way, to prevent performance declines and to ensure that training programs are
effective is necessary to include regular performance tests as a component of
training control (Filaire et al., 2001). Results from field tests provide information
on specific performance changes related to the sport (Svensson & Drust, 2005).
Moreover, fitness tests in association with physiological data should be used to
monitor changes in players’ fitness and to guide their training prescription
(Svensson & Drust, 2005). Thus, the regular evaluation of players’ physical
performance and recovery capacity in order to detect or avoid fatigue can be a
matter of special importance, as soccer players should be able to successfully
perform in competitive seasons of around 10-11 months duration.

20
In order to achieve a higher efficiency of the training monitoring, research
protocols aimed to study physical performance should include specific
performance variables (e.g., game physical performance), biochemical and
muscle-status markers (Bishop et al., 2008) and analyze fatigue and recovery
state. Thus, in addition to sport-specific performance parameters, hormonal,
oxidative and muscle damage markers have been suggested as important bio-
markers for training monitoring in different athletic populations (Bishop et al.,
2008; Kraemer & Ratamess, 2005; Margonis et al., 2007; Rebelo, 1999).
Therefore, to better understand the recovery pattern of the player under such
demanding competitive stress conditions, a longitudinal coverage of physical
performance and biochemical profile at several time points throughout the
season may be useful (S-I and S-II). However, there is a lack of research
concerning the effects of an entire season on physical fitness, physiological and
biochemical status of professional players engaged in professional soccer.
Regarding physical fitness evaluated by physical tests, most of the studies
relied on particular functional or physiological data such as anthropometrics
(Casajus, 2001; Clark et al., 2008; Kraemer et al., 2004; Mercer et al., 1997),
VO2max and anaerobic threshold measurements (Casajus, 2001; Clark et al.,
2008; Mercer et al., 1997; Metaxas et al., 2006), specific intermittent endurance
test (Bangsbo et al., 2008; Rebelo, 1999), exercise performance in incremental
treadmill tests until exhaustion (Casajus, 2001), muscle power through jump
and sprint tests (Aziz et al., 2005; Casajus, 2001; Malliou et al., 2003) and lower
limb strength evaluated by isokinetic devices (Malliou et al., 2003; Mercer et al.,
1997). However, inconsistency has been reported in the literature regarding the
impact of training and competition in the variation of certain fitness parameters
throughout the season (Aziz et al., 2005; Caldwell & Peters, 2009; Casajus,
2001; Clark et al., 2008; Edwards et al., 2003a; Faude et al., 2011; Kraemer et
al., 2004; Malliou et al., 2003; Mercer et al., 1997; Metaxas et al., 2006).
As previously emphasized, different studies reported evidence that the
demands of competitive soccer may impose strains at physiological and
psychological levels (Faude et al., 2011; Kraemer et al., 2004; Rebelo et al.,
1998; Reilly & Ekblom, 2005). In fact, disturbances in mood state (e.g.,

21
increases tension, and anger) during competition periods have been described
(Filaire et al., 2003; Faude et al., 2011; Rebelo, 1999). Also, data reported the
occurrence of inadequate immune function associated with periods of high
physical stress (Malm et al., 2004a; Rebelo et al., 1998a; Reinke et al., 2009).
Moreover, alterations in anabolic-catabolic hormonal environment (Handziski et
al., 2006; Kraemer et al., 2004) and increased levels of oxidative stress were
reported after high-intensity periods of soccer training (pre-season) (Arent et al.,
2010). These reports highlight that during the soccer season, players’ physical
performance is not only determined by appropriate conditioning but also by the
ability to recover and regenerate following multiple stress stimuli (i.e., training
and competition) (Kraemer et al., 2004). However, there are some
contradictions regarding the idea that players may accumulate ‘‘fatigue’’ as the
season progresses, leading to performance impairments (Reilly & Ekblom,
2005). In fact, even though soccer players should be able to successfully
perform throughout a long competitive period, the integrative analysis of the
longitudinal changes in players’ physical fitness, in addition to changes in stress
bio-markers during the season and recovery period, are still scarce. In fact, little
is known regarding the putative relationships between soccer players’ physical
fitness, hormonal environment and oxidative status under demanding soccer
competitive stress conditions (soccer season; S-II). On the other hand, one of
the less understood and more scarcely studied phases of the soccer season is
the off-season period. Therefore, studies investigating if off-season allows
players to recover their organic homeostasis are needed (S-II). Moreover,
despite the growing number of match commitments in national and international
contexts, the influence of the individual match playing time during season on the
referred parameters has never been reported (S-I and S-II). Knowledge
clarifying this gap in literature may allow improving the management of training
periodization, competition scheduling, and, eventually, of specific ergogenic
interventions (e.g., antioxidants supplementation).
Players’ game-physical performance has been investigated through match
analysis systems. This technology is widely used in professional soccer to study
tactical and physical performance of players and referees (Abt & Lovell, 2009).

22
Research with some of the most up-to-date technologies such as the multi-
camera methods (Abt & Lovell, 2009; Rampinini et al., 2007b; Randers et al.,
2010), global position systems (Randers et al., 2010) and video based time-
motion analysis (Mohr et al., 2003; Randers et al., 2010) revealed detailed
information about players` movement patterns during games (Bloomfield et al.,
2007; Krustrup et al., 2005; Mohr et al., 2003). Moreover, these methods allow
the identification of performance decrements during soccer games, and thereby
the study of game-induced fatigue (Randers et al., 2010). Regarding physical
fitness alterations during the season, these methodological interventions were
able to detect that seasonal variations in game-physical performance occur
during the season (Mohr et al., 2003; Rampinini et al., 2007b). However, the
number of studies focusing on seasonal variations in game-physical
performance is scarce and most of the studies only considered three time points
of the season (beginning, middle and end of season) (Mohr et al., 2003;
Rampinini et al., 2007b). Therefore, studies dealing with a higher number of
time points for data collection throughout the season are needed to better
comprehend the seasonal variations in game-related physical parameters.
Moreover, research of seasonal alterations in fatigue patterns (e.g., temporary
fatigue during the match) of soccer players has never been reported (S-III).
The official match represents a major source of physical demand and
physiological stress during the competitive season (Impellizzeri et al., 2005). A
study performed by Impellizzeri et al. (2005), in which rating of perceived
exertion (RPE) was used to quantify the internal training load (RPE-Tld),
showed that in weeks comprising two official matches, the RPE-Tld can
represent about 50% of total weekly training load decreasing to 25% in weeks
with only one match performed. During a 90-minute game, elite-level players
may cover approximately 10-13 km (Abt & Lovell, 2009; Bangsbo et al., 2006;
Bangsbo et al., 1991; Di Salvo et al., 2007; Mohr et al., 2003; Odetoyinbo et al.,
2009; Rampinini et al., 2007b) with a sprint bout occurring approximately every
90 seconds, each lasting an average of 2–4 seconds (Bangsbo et al., 2006;
Bangsbo et al., 1991; Mohr et al., 2005; Vigne et al., 2010). The previous data
concerning player match activity, in addition to the already mentioned evidence

23
that match is performed at an average intensity close to the anaerobic threshold
(80–90% of maximal heart rate) (Stolen et al., 2005) with an energy expenditure
averaging 70-75% of maximal oxygen consumption (VO2max) (Bangsbo et al.,
2006; Reilly & Ekblom, 2005), suggest that performance at the elite level may,
in part, be determined by aerobic fitness (Reilly & Ekblom, 2005). Within this
endurance context, numerous explosive bursts of activity are required, including
jumping, kicking, tackling, turning, sprinting, changing pace, and sustaining
forceful contractions to maintain balance and control of the ball against
defensive pressure (Stolen et al., 2005). Data revealed that several signs of
fatigue can be manifested temporally during (Bangsbo et al., 2006; Mohr et al.,
2003, 2005) and toward the end of the game (Bangsbo et al., 2006; Mohr et al.,
2003, 2005), and persist afterwards (Ascensao et al., 2008; Mohr et al., 2004;
Rebelo et al., 1998b) with a time-dependency for the fitness parameter
evaluated. Moreover, biochemical analyses have shown increases in muscle
damage markers (Ascensao et al., 2011; Ascensao et al., 2008; Ispirlidis et al.,
2008), a robust pro- and anti-inflammatory cytokine response (Andersson et al.,
2010a; Ispirlidis et al., 2008), increased catabolic (Ispirlidis et al., 2008), and
pro-oxidant states (Ascensao et al., 2008) immediately after “friendly” soccer
matches and throughout the post-match recovery period. A considerable
amount of studies used friendly matches and soccer specific protocols
performed in laboratory as a model to reproduce the overall physical demands
of the game. Data emerging from high-level competitive games are scarce.
Moreover, analysis concerning the impact of distinct models of soccer
performance (friendly match vs. soccer specific protocol) in functional,
physiological and biochemical parameters is needed (S-IV). In addition, the
analysis of high-level official soccer matches is interesting for both coaches and
researchers as these truly represent the real context of physiological stress.
Moreover, although associations between pro-oxidant redox status,
inflammation, muscle damage and physical performance have been established
in high-level male (Ispirlidis et al., 2008; Rampinini et al., 2011) and female
players (Andersson et al., 2010a; Andersson et al., 2010c) and low-level male
soccer players (Ascensao et al., 2011; Ascensao et al., 2008; Fatouros et al.,

24
2010) after friendly matches, they have not been yet examined in the same
cohort of male professional players during the post-match recovery period that
follows a high-level competitive official match (S-V). In addition, there is some
evidence that players of higher standards may possess a higher ability to cope
with the physiological stress of the match (Andersson et al., 2008; Ascensao et
al., 2008; Fatouros et al., 2010; Odetoyinbo et al., 2009; Rampinini et al., 2011)
and/or periods of intensified training (Michalczyk et al., 2008; Nakagami et al.,
2009).
It has been observed through time-motion analysis that performance during the
match is dependent on multiple factors, such as standard and type of
competition, playing position and player physical capacity (Bangsbo et al., 1991;
Krustrup et al., 2003a; Krustrup et al., 2005; Mohr et al., 2003; Rampinini et al.,
2007b). Recent studies observed that game-related physical performance
changes throughout the season (Mohr et al., 2003; Rampinini et al., 2007b) and
is related to player’s training status (Krustrup et al., 2003a; Krustrup et al., 2005;
Rampinini et al., 2007a). However, it is important to highlight that even though
data from laboratory and field tests provide a good indication of general and
soccer-specific fitness, individual test results should not be used to conclusively
predict performance in match-play because of the complex nature of
performance in competition (Svensson & Drust, 2005). Nevertheless, some
studies shown that soccer players’ performance in the Yo-Yo intermittent
recovery test both in males (Krustrup et al., 2003a) and females (Krustrup et al.,
2005), in incremental field tests (shorter version of the University Montreal
Track Test) (Rampinini et al., 2007a) and in the repeated shuttle sprint ability
test (Rampinini et al., 2007a) could be good indicators of game-related physical
performance. However, it is important to note that data on non-locomotive
activity, as well as unorthodox movements (e.g., shuffling, diving), soccer
specific movements (e.g., heading, blocking), and accelerations and
decelerations should be taken into account (Bloomfield et al., 2007). In fact, a
massive metabolic load is imposed on players, not only during the more intense
parts of the game, but every time acceleration occurs, even when speed is low
(Osgnach et al., 2010). As so, it is not surprising that studies regarding soccer

25
players’ activity patterns and soccer’s physiological demands point toward the
fact that a well-developed neuromuscular system may be of relevant importance
in order to maintain or increase players’ performance during the game and
particularly during the most intense periods of the match. Soccer players’
muscle strength (Arnason et al., 2004; Cometti et al., 2001) and performance in
sport-specific muscle power efforts (Cometti et al., 2001; Mujika et al., 2008)
were reported to be related to the competitive level of the player. Moreover,
improvements in coordination specificities (Buchheit et al., 2010b) and a greater
agility (Durandt et al., 2006) have been positively associated with performance
and the ability to delay fatigue. In fact, rapid force production is considered
essential for a wide range of athletes (Aagaard & Andersen, 2010; Hoff &
Helgerud, 2004; Nummela et al., 2006), and high neuromuscular capacity may
improve endurance performance (Aagaard & Andersen, 2010). In addition,
some research (Bogdanis et al., 2011; Nunez et al., 2008; Wong et al., 2010)
showed that training of the neuromuscular function and soccer specific
endurance can be combined. This is advised since it can promote, among other
factors, improvement in non-specific and soccer specific endurance and
neuromuscular parameters. Despite these suggestions and the consensus
amongst experts that high stress is imposed on the neuromuscular system
during soccer games, until now, no studies have addressed whether or not
muscle strength and power can be indicators of game-related physical
performance. Therefore, studies aiming to respond to whether physical
conditioning evaluated in field and laboratory tests is related with match
performance and fatigue development are required (S-III).
Hence, although an extraordinary growth in the number of scientific
investigations concerning soccer has been observed in the last decades, still
more is needed in order to elucidate soccer player performance, fatigue and
recovery-related factors during and after the match and throughout the season.
Moreover, in the context of professional soccer this knowledge is even scarcer.
Taking into account the above mentioned scientific context concerning soccer
physiology, the main purpose of this dissertation is to analyse performance,
26
fatigue and recovery of the soccer player during the season. This will be
investigated through the analysis of functional and biochemical alterations
induced by training and competition.
This goal is supported by all the specific aims of the papers produced on the
compass of this dissertation that were, respectively:
To review (Review I and II):
(i) changes in soccer players’ physiological and physical characteristics
throughout the season.
(ii) the effect of different training methodologies on soccer players’
physiological and functional characteristics.
To investigate (Paper I):
(i) the effects of an entire season on physical fitness parameters in a
team of professional male soccer players.
(ii) the influence of match playing time during the season on physical
parameters of professional male soccer players.
To investigate (Paper II):
(i) the impact of an entire soccer season on hormonal and redox status,
muscle damage and inflammation and neuromuscular function of
professional soccer players.
(ii) the association between individual match playing time of professional
soccer players and neuromuscular function, hormonal and redox
status, muscle damage and inflammation.
To analyse (Paper III):
(i) match activity and fatigue development during official soccer games
in different moments of a season.
(ii) the influence of training status on match activity and fatigue
development of professional soccer players.

27
To investigate (Paper IV):
(i) the impact of Loughborough Intermittent Shuttle Test (LIST) versus
soccer match on heart rate (HR), muscle damage, redox status, blood
leukocytes and neuromuscular function throughout 72 h recovery.
To examine (Paper V):
(i) the impact of an official match on hormonal and redox status, muscle
damage and inflammation and neuromuscular function of professional
soccer players.

28
29
THEORETICAL BACKGROUND

30

31
Review I
TITLE: Changes in soccer players’ physiological and physical characteristics
throughout the season
RUNNING HEAD: Seasonal variations in physical fitness
Authors:
João R. Silva1,4, José Magalhães2,3, António Ascensão2,3, António Rebelo1,4.
Affiliations:
1 University of Porto, Faculty of Sport, Department of Soccer, Porto, Portugal
2 University of Porto, Faculty of Sport, Department of Sports Biology, Porto,
Portugal
3 Research Center in Physical Activity, Health and Leisure (CIAFEL)
4 Center of Research, Education, Innovation and Intervention in Sport (CIFI2D)

32

33
Contents
Abstract
1. Introduction
2. Changes in physiological and physical parameters throughout the
competitive season
2.1 Anthropometry
2.2 Endurance capacity
2.2.1 Maximal oxygen consumption
2.2.2 Anaerobic Threshold
2.2.3 Running economy
2.2.4 Performance in maximal incremental tests
2.2.4.1 High intensity intermittent exercise
2.2.5 Sub-maximal intermittent exercise
2.3. Neuromuscular function
2.3.1 Jump ability
2.3.2 Sprint ability
2.3.3. Change of direction speed
2.3.4. Strength
2.4. Game-related physical parameters
3. Off-season induced changes in physiological and physical parameters
3.1 Anthropometry
3.2 Endurance-physiological parameters
3.3 Soccer specific endurance
3.4 Neuromuscular function
4. Conclusions
5. References

34
Abstract
This review focuses on the different antropometric, physiological and
performance alterations that occur during the annual soccer training cycle
(preseason, in-season and off season). From the considerable amount of
research in this field, it has been observed that VO2max increases during
preseason and is maintained during in-season. Moreover, there is some
evidence that a VO2max threshold occurs in which no observations of
significant increments were stated in soccer players. In addition, maximal
aerobic speed (MAS) and different physiological parameters measured at sub-
maximal exercise performance were shown to improve during preseason (3.1-
9.1% and 4.5-21.6%, respectively). Moreover, although the majority of
investigations did not report in-season VO2max improvements, MAS and acute
physiological adaptations during submaximal exercise performance may
increase during this period. In addition, soccer specific endurance (SSE) follows
a similar trend of adaptation. Faster and greater SSE improvements were
observed during preseason. Also high average increments in SSE have been
reported during in-season without significant modifications in VO2max and
smaller physiological adaptations in sub-maximal exercise. Moreover, game-
related physical parameters in high-intensity categories showed great increases
during in-season. Adaptations of players’ neuromuscular systems have been
measured in sprints, COD and jump tests—with higher evidence in those jumps
involving stretch-shortening cycle activities (SSC)—and all body movement
interactions (jumps with arm swing). Data suggests that when early
improvements are obtained (from PPS to BCP), they can be maintained and
even further improved during in-season. This suggests that neuromuscular
adaptations affecting SSC mechanisms may occur during in-season. This
previous evidence highlights the high sensitivity and ability of field tests in the
monitoring of players during training. Moreover, isoinertial assessment seems to
be more effective evaluating players’ neuromuscular adaptations. In conclusion,
probably other endurance physiological determinants (e.g., VO2 kinetics and the
ability to maintain an acid-base balance) can occur during the season and thus
contribute to SSE increments. Moreover, among other factors, adaptation at the

35
neuromuscular level and the improvement in pacing strategies throughout the
season cannot be excluded as mechanisms that could be responsible for the
increase in-season game-physical performance. The off-season period appears
to result in decrements of a variety of physiological and functional parameters.
1. Introduction
Soccer match-specific activity is characterized by periods of high-intensity
exercise interspersed with periods of low-intensity exercise. The physiological
demands of soccer require from players a high level of physical fitness (e.g.,
aerobic and anaerobic power, muscle strength and agility (Bangsbo, 1994;
Kraemer et al., 2004; Reilly et al., 2008; Reilly & Ekblom, 2005; Svensson &
Drust, 2005). Although reports of players’ physical and physiological
characteristics are essentially descriptive, they nevertheless provide insights
into factors determining success in the game (Reilly & Gilbourne, 2003). There
are important reviews concerning physiological characteristics of soccer players
(Reilly & Gilbourne, 2003; Shephard, 1999; Stolen et al., 2005; Svensson &
Drust, 2005), soccer biomechanics (Lees & Nolan, 1998), determinants of
players’ performance (Bangsbo et al., 2007; Bangsbo et al., 2006; Reilly et al.,
2008) and specific training-induced effects (Hill-Haas et al., 2011; Hoff, 2005;
Hoff & Helgerud, 2004; Iaia et al., 2009a). Preseason and in-season practices
and soccer matches may impose strains on various physiological systems of
the player (e.g., musculoskeletal, nervous and metabolic) (Bangsbo et al., 2006;
Brites et al., 1999; Filaire et al., 2003; Kraemer et al., 2004; Malm et al., 2004a,
2004b; Rebelo et al., 1998). In fact, a high frequency and volume of training
practices and a high number of competitive matches combined with insufficient
time allowed to recover may induce fatigue (Filaire et al., 2003). To prevent
performance decline and to ensure that training programme are effective, it is
necessary to include regular performance tests as a component of training
control (Filaire et al., 2001). This way, the knowledge of players’ physiological
and functional characteristics is not only a matter of undeniable interest, as the
understanding of how these characteristics altered throughout training is
important for coaches, medical departments and researchers.

36
Therefore, in this paper we intend to analyse the alterations observed
throughout the season (off season, preseason and in-season) along
physiological parameters as well as in the physical performance of soccer
players. Even though we do not intend to compare training methodologies, the
experimental designs of the studies analysed will be referred to in order to allow
the reader full access to research related to seasonal alterations in soccer
players’ physiological status and physical fitness. The search for scientific
literature relevant to this review was performed using US National Library of
Medicine (PubMed), MEDLINE and SportDiscus databases. Literature searches
were undertaken using several keywords including ‘soccer,’ ‘elite soccer,’
‘seasonal alterations,’ ‘performance analysis,’ ‘soccer competition,’ ‘soccer
physiology,’ ‘strength training,’ ‘isokinetic strength,’ ‘one repetition maximum,’
‘neuromuscular performance,’ ‘fatigue,’ ‘recovery,’ ‘field tests,’ ‘intermittent
endurance,’ ‘maximal power,’ ‘muscular power,’ ‘jump ability,’ ‘sprint ability,’
‘agility,’ ‘change of direction,’ ‘training period,’ ‘detraining,’ ‘off season,’ ‘in
season,’ ‘preseason,’ and ‘competition period.’ Relevant literature was also
screened for additional articles arising from the reference list of included
studies. Given the wide range of this review, other researchers have been
included.
2. Changes in physiological and functional parameters throughout the
season
2.1 Anthropometry
Although there are anthropometric predispositions for the different playing
positions within soccer (Carling & Orhant, 2010), the game demands sufficient
skill that substantial deviations from this profile remain compatible with
performance of a high standard (Shephard, 1999). Changes in anthropometric
variables such as Body Mass (BM), Body Fat (BF) and Lean Body Mass (LBM)
throughout the season are presented in table 1.
The majority of investigations did not report alterations in players’ BM during
preseason and in-season periods (Aziz et al., 2005; Carling & Orhant, 2010;

37
Casajus, 2001; Kalapotharakos et al., 2011; Mercer et al., 1997; Metaxas et al.,
2006; Silva et al., 2011). However, an increase in BM values from prior-
preseason (PPS) (Edwards et al., 2003; Ostojic, 2003) and from the beginning
of the competition period (BCP) (Ostojic, 2003) to end-of-competition period
(ECP) were observed.
The high training volume normally administered during preseason period can be
associated with alterations in players’ BF and LBM. In this matter, some
investigations reported that both professional and semi-professional players
experience decreases in BF during preseason (Caldwell & Peters, 2009;
Kalapotharakos et al., 2011; Mercer et al., 1997). The observed preseason
decrements in BF could be maintained towards the middle-competition period
(MCP) or even further, with a decline in the ECP (Caldwell & Peters, 2009;
Casajus, 2001; Kalapotharakos et al., 2011; Ostojic, 2003). Nevertheless,
findings from studies with professional players did not corroborate this evidence
(Aziz et al., 2005; Heller et al., 1992; Metaxas et al., 2006; Reinke et al., 2009;
Silva et al., 2011). Curiously, a 6.9% increase in BF of professional players
from MID to ECP was observed in a study by Carling and Orhant (2010).
Regarding LBM of professional soccer players, there are also contradictions
regarding alterations of this parameter during preseason and in-season periods.
Although certain studies did not observe any significant change in LBM between
different time points of the season (Casajus, 2001; Metaxas et al., 2006;
Ostojic, 2003), increases in LBM from PPS to BCP (Reinke et al., 2009), and
from BCP to MCP (Heller et al., 1992) were observed.
Carling and Orhant (2010) examined elite players and confirmed the early
observations of Casajus (2001) that observed no seasonal variations in BM of
players with different positional roles. Nevertheless, the same was not observed
in BF and LBM. Across all players, there were significant in-season variations in
BF (between start- and mid-season and between mid- and end-season; 5.7%
decrease and 6.9% increase, respectively) and in LBM (between start and mid-
season and between start and end-of-season, 1.4% and 1.3% increase,
respectively) (Carling & Orhant, 2010). Further analysis showed that variations
differed across field positions. Defenders increased LBM in 2.4% from PPS to
38
ECP, and midfielders increased LBM in 5% from PPS to MCP. Also, midfielders’
BF decreased 8% from PPS to MCP and increased 9% from MCP to ECP
(Carling & Orhant, 2010). These variations in body composition was not
associated with players’ participation time (combined training and match
exposure time), and did not differ across seasons (Carling & Orhant, 2010).
The different investigations suggest that no unique and specific pattern of
variation during preseason and in-season occurs. Factors related to training
(e.g., type of strength training) and competition fixtures (e.g., extend of
preseason and/or in-season period) and diet (e.g., Mediterranean diet) (Ostojic,
2003) may explain the different results observed in body composition of soccer
players throughout the season.
2.2 Endurance capacity
Data from time-motion analysis showed that elite soccer players cover 8 to 13-
km during a competitive match (Bangsbo et al., 1991; Bradley et al., 2009; Di
Salvo et al., 2007; Di Salvo et al., 2009; Rampinini et al., 2007b) at a mean
intensity close to the anaerobic threshold (AT) (Stolen et al., 2005). Moreover,
energy expenditure during match play averages 70-75% of maximal oxygen
consumption (VO2max), which suggests that a high level of physical
performance in soccer may, in part, be determined by aerobic fitness (Bangsbo
et al., 2006; Reilly & Ekblom, 2005).
The determination of VO2max and anaerobic threshold (AT) assessed by
ventilatory threshold (VT) and/or lactate threshold (LT) are two of the most
frequent parameters of monitorization of aerobic fitness of soccer players in
laboratory. For endurance sports, three main factors – VO2max, LT and
efficiency – appear to play key roles in endurance performance (Joyner &
Coyle, 2008). VO2max and LT interact to determine the VO2 performance, which
represents the maximal oxygen consumption that can be sustained for a given
period of time (Joyner & Coyle, 2008). Efficiency interacts with the performance
VO2 to establish the speed or power that can be generated at this oxygen
consumption (Joyner & Coyle, 2008). The energetic cost of a run (running
economy), is usually expressed as oxygen cost per meter, or minute at a

39
defined intensity and is measured at sub-maximal work-rates (Stolen et al.,
2005). The causes of variability in RE are not well understood, but it seems
likely that anatomical traits, mechanical skill, neuromuscular skills, and storage
of elastic energy are important factors [see refrs. in (Hoff & Helgerud, 2004)].
Changes in soccer players’ aerobic capacity has also been examined by
maximal aerobic speed and time to exhaustion during maximal incremental
tests performed in laboratory. In order to increase the ecological validity of the
measurements, maximal and sub-maximal soccer specific field tests (e.g., Yo-
Yo Intermittent Endurance and Recovery tests) have been widely used to
monitor soccer player training status. These soccer-specific endurance tests
have been advocated as tests that enhance the specificity of the evaluation
(Svensson & Drust, 2005).
Although we do not intend to compare the effects of different training programs
on physiological and physical characteristics of soccer players, the studies
analysed in this review will be referred to in order to provide full coverage of
seasonal alterations. High intensity training (HIT) comprises different modes of
high-intensity exercise, namely high-intensity aerobic training (HIA), speed
endurance training (SE) and repeated sprint ability training (RSA). Generally the
common factor between these different modes relies in the high physiological
stress and the sharing of some similar physiological and functional training-
induced adaptations, imposed by the acute and chronic effects of the high-
intensity exercise bouts.
2.2.1 Maximal oxygen consumption
Although no differences between professional and amateur players has been
reported (Rampinini et al., 2009a), higher values of VO2max have been
positively associated with team level/success within the same league (Apor,
1988). The determination of soccer player’s VO2max is therefore important, as
the oxygen transport system strengthens the ability to exercise during the 90-
min (Bangsbo, 1994) and to recover between the short bouts of high-intensity
exercise of the game (Hoff, 2005). As can be depicted in table 2, different
studies verified VO2max changes throughout the season. During preseason

40
training players appear to regain their oxygen capacity and maintain it
throughout the season. Actually, studies with players from different competitive
level showed improvements in VO2max from PPS to BCP (Aziz et al., 2005;
Caldwell & Peters, 2009; Kalapotharakos et al., 2011; Mercer et al., 1997;
Metaxas et al., 2006). Also, higher values of VO2max were observed in MCP
(Aziz et al., 2005; Caldwell & Peters, 2009; Haritodinis et al., 2004;
Kalapotharakos et al., 2011; Metaxas et al., 2006; Mohr et al., 2002b) and ECP
(Aziz et al., 2005; Caldwell & Peters, 2009; Haritodinis et al., 2004; Magal et al.,
2009; Metaxas et al., 2006) than in PPS. Moreover, increments in VO2max
(from PPS to BCP, MCP and ECP) seems to be independent of the position role
(Metaxas et al., 2006). Nevertheless, seasonal variations in VO2max were not
entirely confirmed in other investigations (Clark et al., 2008; Edwards et al.,
2003).
High-intensity aerobic training, both in general (interval running; HIA-IR)
(Helgerud et al., 2001; Impellizzeri et al., 2006) and specific modes (small-sided
games; HIA-SSG) (Impellizzeri et al., 2006), induces the increase in VO2max
throughout the preseason. Impellizzeri et al., (2006) observes that high-level
Junior players performing HIA-IR or HIA-SSG, increased 7.4% and 6.4% the
VO2max, respectively. Helgerud et al., (2001) found in preseason a 10.7%
increment in VO2max after a HIA-IR program. Also, elite U-17 players, who
performed a HIA program (2 sessions per week of a soccer specific dribbling
circuit; HIA-SSDC), during 10-wks (6-wks preseason plus 4-wks in-season) had
a 10.1% improvement in VO2max (McMillan et al., 2005b). As already
mentioned, the majority of longitudinal studies (Aziz et al., 2005; Casajus, 2001;
Heller et al., 1992; Metaxas et al., 2006; Mohr et al., 2002a; Silvestre et al.,
2006) and studies analysing the adaptations from specific training
methodologies (Impellizzeri et al., 2006) did not detect significant further
improvements after the initial increase in VO2max found after preseason. In
fact, Impellizzeri et al., (2006) observed that a 8-wk period of HIA starting at the
BCP did not produce any further significant increase in VO2max (HIA-IR group:
0.84%; HIA-SSG group: 0.65%) after the initial increment observed during
preseason (8.2% and 7.1%, respectively). Nevertheless, Ferrari Bravo et al.,

41
(2008) trained in-season amateurs players for 7-wks with HIA-IR or RSA and
observed an increase in VO2max after the training program (6.6% and 5%,
respectively). Also, Jensen et al. (2009) observed that U-20 elite players
performing during the last 12wks of the competitive season a lower weekly
volume of HIT (30-min session per week of HIA-SSG, with a ratio
exercise/recovery of 2:1, e.g. 3-min play/1.5-min recovery) than reported in
previous study results - a 5.4% increase in VO2max. Nevertheless, Sporis et
al., (2008b) observed that elite U-19 players performing HIA, 3 times a week,
during 13-wks (6-wks of preseason and 7-wks of in-season) enhanced the
VO2max in 5.3%, with the greater part of increment being achieved (5.1%) after
the first 6-wks of the preseason period (Sporis et al., 2008b).
In general, different studies showed improvements in VO2max after a relatively
short period of time (e.g., preseason training), while no further increments in this
parameter were observed in-season. Moreover, no increase was oberved in
VO2max when soccer players already possess VO2max values around 61-62
ml.kg-1.min. In fact, the referred increases in VO2max found in different standard
of players during in-season (Caldwell & Peters, 2009; Ferrari Bravo et al., 2008;
Jensen et al., 2009; Magal et al., 2009) occurred under this threshold.
Additionally, when professional players begin the competitive season with
values above this threshold no improvements in VO2max throughout the season
were reported (Clark et al., 2008; Edwards et al., 2003). The general
observation of no improvements in VO2max after preseason suggests that there
is a certain threshold of soccer players’ VO2max above which it is very hard to
induce VO2max that may be related with soccer training-specific constrains,
(e.g., insufficient training stimulus targeting VO2max).
2.2.2 Anaerobic Threshold
The anaerobic threshold (AT) is defined as the highest exercise intensity, HR or
VO2, in which the production and clearance of lactate is equal (Stolen et al.,
2005). Several methods exist to determine AT, including measurement of blood
lactate and ventilatory measurements. Lactate threshold (LT) and ventilatory
42
threshold (VT) have been advocated as physiological parameters more sensible
to detect changes in players’ fitness than VO2max (Clark et al., 2008; Edwards
et al., 2003; Helgerud et al., 2001). Moreover, LT might change without changes
in VO2max, and a higher LT means, theoretically, that players can maintain a
higher average intensity in an activity without accumulation of lactate (Helgerud
et al., 2001).
Studies examining changes in physiological parameters at sub-maximal
intensities through different periods of a soccer season are presented in table 3.
During preseason, the ability of high-level players’ to perform sub-maximal
exercise improves (Brady et al., 1997; Clark et al., 2008; Edwards et al., 2003;
Kalapotharakos et al., 2011; Mohr et al., 2003; Zoppi et al., 2006) and is
maintained throughout the MCP (Brady et al., 1997; Clark et al., 2008; Mohr et
al., 2002b) and ECP (Brady et al., 1997; Clark et al., 2008). Also, further
improvements from BCP to MCP have been observed (Casajus, 2001).
Nevertheless, increases in preseason (Dunbar, 2002) and between BCP and
MCP were not corroborated by others (Brady et al., 1997; Dunbar, 2002; Heller
et al., 1992; Kalapotharakos et al., 2011) and neither were decrements from
MCP to ECP (Brady et al., 1997; Dunbar, 2002).
A large variety of physiological parameters can be motorized during sub-
maximal exercise (table 3). Certain parameters were shown to be sensitive in
one but not in other studies with players of similar standard. Improvements in
BCP and MCP performances were detected by different parameters such as
percentage of VO2max and percentage of maximal heart rate at a lactate
concentration of 4 mmol-1 (%VO2max4mmol and %HRmax4mmol, respectively)
(Kalapotharakos et al., 2011), velocity at a lactate concentration of 4 mmol-1
(V[La]4mmol) (Kalapotharakos et al., 2011), heart rate measures at different
running speeds (Mohr et al., 2002) and speed at lactate threshold (LTspeed)
(Brady et al., 1997; Zoppi et al., 2006).
McMillan et al., (2005a) observed that U-19 elite players increased the V[La]4mmol
from PPS to early weeks of in-season (13.62 to 14.67 km.h-1, respectively).
Although improvements in speed at ventilator threshold (VTspeed) from BCP to

43
MCP were reported (Casajus, 2001) these were not confirmed in other studies
of professional players (Heller et al., 1992). Moreover, the same evidence as
been observed in LTspeed between PPS and MCP (Brady et al., 1997). Also, no
improvement in preseason in the velocity at a lactate concentration of 2 and 3
mmol-1 during sub-maximal exercise was examined (Dunbar, 2002).
Regarding the effect of high-intensity aerobic training programs (HIA), it was
reported that elite U-18 players performing HIA-IR (Helgerud et al., 2001;
Impellizzeri et al., 2006) and HIA-SSG (Impellizzeri et al., 2006) had a 21.6%
(Helgerud et al., 2001) and 4.5% improvements in LTspeed (Impellizzeri et al.,
2006) during preseason, respectively. Also, improvements were observed of
15.9% (Helgerud et al., 2001) and 7.6% in LTVO2 (8% and 7.2% for HIA-IR and
HIA-SSG group, respectively)(Impellizzeri et al., 2006) during preseason.
Prolongation of the training program for more than 8-wks after BCP resulted in
further increases in LTspeed (4.7%) and in LTVO2 (4%; combined groups)
(Impellizzeri et al., 2006), which suggested that the further improvement in LT,
but not in VO2max, were probably related to central factors (i.e., VO2max),
being rapidly restored in a relatively shorter time (4-wks), and peripheral factors
(i.e., muscle oxidative enzymes) may require a longer time to improve (a further
8-wk period) (Impellizzeri et al., 2006).
2.2.3 Running economy (RE)
Changes in soccer players’ running economy (RE) have been analysed mainly
in studies investigating the training-induced effects of high-intensity strength
(HIS) and/or high-intensity aerobic training (HIA). HIA during preseason resulted
in RE improvements (6.7%; (Helgerud et al., 2001); 1.4% with HIA-IR and HIA-
SSG modes (Impellizzeri et al., 2006)). Also, preseason HIA and/or HIS
performed by elite junior players’ have resulted in the increase of RE (4.7 %)
both at the lactate threshold and at a fixed running velocity in a treadmill test
(Helgerud et al., 2003; Hoff & Helgerud, 2003). Other groups of researchers
(Bogdanis et al., 2011) examined the strength training effects of hypertrophy (H;
4 sets of 12 repetitions with 70% of 1RM, 3 times per week) or neural (N; 4 sets

44
of 5 repetitions with 90% of 1RM) adaptations programs during 6-week
preseason of professional players. Nevertheless, the weekly cycle also involved
a considerable amount of interval training and small group play that as
previously mentioned are effective methodologies targeting endurance
development. Although both groups increased RE (10.9 % and 4.2 %, for N and
H, respectively), only N improved significantly. Although without statistical
significance (p=0,07), Impellizerri et al., (2006) observed that a further 8-wk
period of HIA-IR or HIA-SSG during in-season produced an additional
improvement of 1.4% in RE at LT (Impellizzeri et al., 2006). In this matter,
Macmillan et al., (2005b) did not found any change in RE after 10-wks of HIA
(6-wks in preseason plus 4-wks in in-season). Nevertheless, given that RE has
been assessed by treadmill running, and significant differences exist between
this assessment mode and soccer specific activity during training and matches,
there is some conviction that soccer specific work economy may improve
somewhat during season, with relevant gains not detectable by conventional
treadmill testing (Helgerud et al., 2001; McMillan et al., 2005b).
2.2.4 Performance during maximal incremental tests
Performance changes during maximal incremental tests performed in laboratory
have been monitored throughout measures of time to exhaustion (table 4) and
records of maximal aerobic speed. Time to exhaustion (T) has been observed
to increase from PPS to BCP (Metaxas et al., 2006). Also, different studies
observed improvements in T from PPS to MCP (Haritodinis et al., 2004;
Metaxas et al., 2006; Mohr et al., 2002) and/or ECP (Edwards et al., 2003;
Haritodinis et al., 2004; Metaxas et al., 2006). Even though former studies
observed that these improvements occur in parallel to increments in VO2max,
Edwards et al., (2003) detected that professional soccer players increased T but
not VO2max from PPS to ECP. The researchers suggested that in a highly
trained state, players may be able to supplement additional exercise
performance time through enhanced anaerobic energy systems (Edwards et al.,
2003).

45
Velocity at VO2max (Maximal Aerobic Speed; MAS) reflects the maximum
aerobic capacity and combines VO2max and running economy into a single
factor (Billat & Koralsztein, 1996). MAS is a good indicator of aerobic
performance (Billat & Koralsztein, 1996), and its determination gives a practical
assessment of aerobic demands during running performance (Kalapotharakos
et al., 2011). Recent investigations observed that improvements in MAS after
preseason training (9.1 %) remained until the MCP (Kalapotharakos et al.,
2011). Dupont et al., (2004) observed that professional soccer players
performing 2 weekly sessions of high-intensity training, during 10-wks of in-
season, increased MAS in 8.8 %. Others professional players performing 2
sessions per week of HIS and SE during 8-wks of preseason obtained a 3.1%
improvement in MAS (Wong et al., 2010).
2.2.4.1 High intensity intermittent exercise
Recent studies have shown that the level of competitiveness of the player is
related with the intermittent exercise performance during games (Mohr et al.,
2003), in soccer-specific endurance tests, as the Yo-Yo tests (Mohr et al., 2003;
Rampinini et al., 2009a), and in repeated sprint ability tests with
(RSSA)(Rampinini et al., 2009b) or without (RSA)(Aziz et al., 2008) changes of
direction. Also a positive relationship was analysed between team success in
the league and intermittent exercise performance in Yo-Yo Intermittent
Endurance Test level 2 (YYI2) (Randers et al., 2007). Moreover, performance in
Yo-Yo intermittent recovery test level 1 (YYIR1) (Krustrup et al., 2003), YYIE2
(Bradley et al., 2010) and in RSSA (Rampinini et al., 2007b) have shown to be
good indicators of game-related physical performance.
A summary of studies examining changes in high intensity intermittent exercise
tests through different periods of a soccer season is presented in table 5. It has
been observed that professional players improve the performance in YYIR2 and
YYIR1 tests from PPS to middle of preseason period (Krustrup et al., 2003;
Krustrup et al., 2006) with further improvement in the BCP in YYIR2 (Iaia et al.,
2009b; Krustrup et al., 2006), YYIR1 (Krustrup et al., 2003), YYIE2 (Bradley et
al., 2009; Silva et al., 2011), and in the Intermittent Field Test (IFT (Rebelo &

46
Soares, 1997). Moreover, it was observed that improvements obtained in YYIR2
(Iaia et al., 2009b; Krustrup et al., 2006), in YYIE2 (Bradley et al., 2009) and in
the Probst test (Nunez et al., 2008) during preseason are maintained in MCP.
As may be expected, studies in the tracking of professional and semi-
professional players found increased performance on YYIR1 (Krustrup et al.,
2003), YYIE2 (Bradley et al., 2010; Silva et al., 2011) and Probst tests (Nunez
et al., 2008) at ECP than in PPS. Similarly, Oliveira (Oliveira, 2000) observed
that elite players improved YYIE2 performance 4-months and 7-months after
PPS (21.9 and 30.1%, respectively). Also, further performance improvements in
IFT could be observed from BCP to MCP (Rebelo & Soares, 1997).
Nevertheless, Bradley et al., (2010) did not found any change in YYIE2
performance from PPS to MCP.
Some researchers observed that high intensity training (HIT) increases soccer
specific endurance (SSE) during preseason. Wong et al., (2010) found a 19.7 %
improvement in the performance of professional players in the YYIR1 test after
a concurrent training program of speed-endurance and high-intensity strength
(HIS). Bogdanis et al., (2011) observed that professional players increase
performance in YYIE2 and Hoff`s dribbling track test (DTT) after preseason
strength training-based in hypertrophy (H) and neural (N) methods.
Interestingly, the authors report that although SSE evaluated by the DTT
improved similarly in H and N groups (10 % and 9.6 %, respectively), there was
a trend (p=0.067) to better performance in the YYIE2 in the N (29.4 %) than H
(21.5 %) group. Moreover, improvement in fatigue resistance measured by a
RSA test was only evident in N. There are reports that preseason HIT enhances
performance and physiological improvements when evaluated by other forms of
running exercises. Sporis et al., (2008a, 2008b) observed high-level junior
players performing 6-wks of high-intensity aerobic training (HIA) in the form of a
situational drill (HIA-SD) during preseason. This training intervention improves
performance during in-line (200, 400, and 800, 1200 and 2400-m) and in shuttle
running exercises (Sporis et al., 2008a, 2008b). Furthermore, the same group of
researchers observed that professional players performing preseason (8-wks)
HIA-SD were able to tolerate a higher maximal blood lactate concentration

47
during the 300y shuttle run test (14.1%) and improve test performance (2.2%)
(Sporis et al., 2008a). Others report that high-level juniors players improve the
time to perform 4 repetitions of the Ekblom’s circuit test after the application of a
training program of HIA-IR or HIA-SSG (12.2% and 13%, respectively)
(Impellizzeri et al., 2006). Moreover, further 8-wks of HIA-IR or HIA-SSG
training during in-season enhanced Ekblom’s test performance (2.4% and 3.2%,
respectively) (Impellizzeri et al., 2006). Similarly, Ferrari Bravo et al., (2008)
observed that high-level junior and lower-level senior players improved YYIR1
performance after 7-wks of HIT during in-season. However, although the two
different modes of HIT examined (HIA-IR and RSA) were effective in improving
YYIR1 performance (12.5 vs. 28.1%, respectively), only the RSA group
improved RSA performance (2.1%; Ferrari Bravo et al., 2008). According to the
researchers, differences in the functional adaptations between the 2 modes of
HIT (HIA-IR vs. RSA) may be related to enhancements in anaerobic metabolism
and not with the ability to recover between sprints (Ferrari Bravo et al., 2008).
Also, Jensen et al., (2009) observed that HIT (12-wks HIA-SSG) induced in-
season 15.2% increases in YYIR2 and improves fatigue time (difference
between fastest and slowest sprint time) during an RSA test. In this matter,
better performance in the end than before the start of the HIA-SSG program
and the beginning of the season (0.19-s vs. 0.24-s and 0.30-s) was analysed in
the RSA test (Jensen et al., 2009).
Regarding repeated shuttle sprint ability (RSSA; 6 × 40-m, turns at 20-m, 20-s
recovery) Impellizzeri et al., (2008) observed that elite players improved
different parameters in an RSSA test performance throughout the season.
Namely, best sprint (RSSAbest), mean time of the sprints (RSSAmean) and fatigue
index during the RSSA (RSSAdecrement) improved after preseason training, 1 %,
2.2 % and 22.7 %, respectively. Nevertheless, a small but likely 0.8 %
worsening in RSSAmean occurred from BCP to MCP and persisted until the ECP.
Nevertheless, Mercer et al., (1997) did not observe any significant improvement
in RSSAbest and RSSAmean of professional players during a different version of
RSSA (8x50-m shuttle sprints, turns at 25-m, 30-s recovery) after preseason
period. Given that no information regarding preseason training were reported in

48
the previous study, we may hypothesise that differences between studies can
be related with the physiological adaptations (e.g., neural adaptations) obtained
during preseason. As already described (Bogdanis et al., 2009), different
training methodologies (e.g., type of strength training) may influence RSA
performance.
2.2.5 Sub-maximal intermittent exercise
Alterations in the ability to perform sub-maximal intermittent exercise have been
examined. Precisely, soccer players %HRmax achieved at the 6-min point of the
YYIR1, decreased from PPS to the middle of preseason, BCP and ECP
(Krustrup et al., 2003). Also, a decrease in the % HRmax and blood lactate
concentrations at the end a sub-maximal version of the YYIR1 (5-min) were
observed after 12 weeks of in-season HIA-SSG (87.3% to 81.3% HRmax and
from 5 to 2.5 mmol.l-1 correspondingly) (Jensen et al., 2009).
2.3. Neuromuscular function
Muscle power-based efforts such as sprints, jumps, duels, and kicking, which
are mainly dependent on maximal strength and anaerobic power of the
neuromuscular system, are essential factors to successfully performing in
soccer (Cometti et al., 2001). During the match, players perform a wide range of
soccer specific activities (e.g., sprints, jumps) that demand players to be able to
sustain and produce forceful contractions (Stolen et al., 2005) that result in
higher stresses on the neuromuscular system in order to cope with this
essential efforts. This match-induced stresses in neuromuscular function has
been verified by the post-match performance reductions in measures of
strength and muscle-power efforts (Andersson et al., 2010a; Andersson et al.,
2008; Ascensao et al., 2008; Fatouros et al., 2009; Ispirlidis et al., 2008;
Krustrup et al., 2011; Magalhaes et al., 2010; Rampinini et al., 2011).
Recent studies observed that agility (Mujika et al., 2008; Reilly et al., 2000),
strength and short distance sprint speed (Cometti et al., 2001; Dauty & Potiron
Josse, 2004) are related to player standard. Also, a positive relation with team
success in the same league was reported for jump ability (Arnason et al., 2004).
49
Some contradictions regarding improvements in anaerobic and neuromuscular
function during soccer season have been described (Aziz et al., 2005; Caldwell
& Peters, 2009; Clark et al., 2008; Malliou et al., 2003; McMillan et al., 2005a;
Mercer et al., 1997). The inconsistencies observed during longitudinal studies
strengthen when analysing studies focusing training-effects of HIT (Dupont et
al., 2004; Ferrari Bravo et al., 2008; Sporis et al., 2008a, 2008b), muscle
strength training (ST) (Chelly et al., 2009; Gorostiaga et al., 2004; Kotzamanidis
et al., 2005; Maio Alves et al., 2010; Mujika et al., 2009; Ronnestad et al., 2008;
Ronnestad et al., 2011; Sedano et al., 2011; Thomas et al., 2009; Wong et al.,
2010) and concurrent endurance and strength training (Lopez-Segovia et al.,
2010; Nunez et al., 2008; Wong et al., 2010).
2.3.1 Jump ability
Concerning jump ability (table 6), there are reports of performance
improvements in countermovement jump with arm-swing (CMJWAS) of
professional players (Mercer et al., 1997) and in CMJWAS and squat jump with
arm-swing (SJWAS) of semi-professional players (Caldwell & Peters, 2009)
during preseason, that were maintained throughout in-season. Moreover, semi-
professional (Caldwell & Peters, 2009) and professional players (Aziz et al.,
2005) showed further performance improvements from BCP to MCP in
CMJWAS and SJWAS, respectively. Also an improved CMJWAS (5%) was also
observed in elite U-19 players after in-season ST (Sedano et al., 2011).
Regarding countermovement jump performance (CMJ), although Silva et al.,
(2011) observed a preseason enhancement followed by a decrement during in-
season (from BCP to MCP), other studies do not observe alterations in jump
ability exercise during different moments of the season (Casajus, 2001; Malliou
et al., 2003; Mercer et al., 1997). Regarding variations resulting from strength
training (ST), Bogdanis et al., (2009) examined preseason improvements (5.3-
10%) that were not confirmed by other studies with senior (Ronnestad et al.,
2008) and U-19 elite players (Maio Alves et al., 2010). Sedano et al., (2011)
and Thomas et al., (2009) reported improvements in CMJ after ST performed
50
during in-season of elite U-19 (8%) and semi-professional players (5-7%),
respectively.
Concerning the squat jump (SJ), longitudinal studies did not show any
performance change throughout the season (Casajus, 2001; Malliou et al.,
2003; Thomas & Reilly, 1979). This lack of preseason variation in SJ in
professional players was also confirmed in a ST investigation (Ronnestad et al.,
2008). Nevertheless, others (Maio Alves et al., 2010) observed that ST
improved preseason SJ performance in elite U-19 players. Also, Thomas and
Reilly (1979) analysed jump ability variations during horizontal jumps and
observed increases in standing board jump during in-season, from BCP to MCP
and ECP.
In a study of Clark et al, (2008), improvements in CMJ performance and in the
average height during CMJ20-s(cm) of professional players were only evident from
PPS to MCP in the second of three seasons examined. Moreover, Casajus
(2001) did not observe changes in anaerobic power from BCP to MID during the
CMJ15-s test. As such, it seems that the maximal mechanical power and ability to
sustain fatigue during the repeatedly performance of CMJ did not significantly
change throughout the season. However, different research examining jump
ability performances changes, suggests that jumps involving stretch-shortening
cycle activities (SSC) and all body movement interactions (use of arms) had
more propensity to improve. This is not surprising, due to the greater specificity
of this types of jumps (e.g., SSC, coordinate the different body segments).
2.3.2 Sprint ability
The change in sprint ability throughout the season has been analysed in a wide
range of sprint distances (table 7). Preseason performance improvements in 15-
m sprint of semi-professional (Caldwell & Peters, 2009), and in 50-m sprint of
professional players (Ostojic, 2003) have been reported. Nevertheless, others
did not observe improvements in professional players performance after this
season period in 5-m (Aziz et al., 2005; Silva et al., 2011), 20-m (Aziz et al.,
2005) and 30-m (Silva et al., 2011; Zoppi et al., 2006) sprints.

51
Studies examining preseason strength training programs (ST) observed that
professional players improved 10-m and 40-m sprint (ranging from 1 to 2%)
(Bogdanis et al., 2009). Nevertheless, others observed that professional players
10-m and 40-m sprint times improved in one but not in other group of the
players involved in the investigation (Ronnestad et al., 2008). Another study
performed during preseason, found that high-level junior players improved 5-m
(7-9%) and 10-m sprint times (3.1-3-2%), independently of performing one or
two weekly strength sessions per week (Maio Alves et al., 2010).
Data from longitudinal studies highlighted that there may be a tendency for
players to improve their sprint performance throughout the season.
Improvements were observed from BCP to MID in the 15-m and 30-m sprint
performance of semi-professional (Caldwell & Peters, 2009) and professional
players (Silva et al., 2011), respectively. Also, professional players improved
sprint performance in 5-m and 20-m from PPS to ECP (Aziz et al., 2005) and in
50-m (Ostojic, 2003) from BCP to ECP, have been reported. An improvement in
sprint performance was also observed in academic players in 10-m and 30-m
distances (Magal et al., 2009) and in semi-professional players in 15-m
(Caldwell & Peters, 2009) from BCP to ECP. Nevertheless, others did not find
alterations in 36.5-m (Silvestre et al., 2006) and 40-m (Magal et al., 2009) sprint
times of academic players during in-season (from BCP to ECP).
ST studies reported an in-season reduction in 10-m sprint time (0.32%) of elite
U-19 players (Sedano et al., 2011). Nevertheless, this was not observed in
semi-professional in a variety of sprint distances (5-m, 10-m, 15-m and 20-m
sprints) (Thomas et al., 2009).
In spite of the wide range of sprint distances evaluated, data suggest that sprint
ability may improve throughout the preseason and further in-season.
2.3.3. Change of direction speed
According Jones et al., (2009), tests of agility that do not include a perceptual or
decision making component can be referred as measures of change of direction
speed (COD) and can be defined as the ability to decelerate, reverse or change
movement direction and accelerate again. These type of tests can also be

52
described as movements in which no immediate reaction to a stimulus is
required, thus the direction change is pre-planned (Brughelli et al., 2008). In this
matter, COD evaluated by Illinois agility run test (IART) was shown to improve
in professional (Mercer et al., 1997) and semi-professional players during
preseason (table8) (Caldwell & Peters, 2009). Nevertheless, this was not
confirmed in professional players performing the t-test (Silva et al., 2011).
Strength training (ST) interventions during preseason induced a performance
improvement in COD evaluated by Zig-Zag test (≈1.3-2.5%), T-test (≈1.2-2.1%),
and IART (≈0.6-1%) (Bogdanis et al., 2009). Nevertheless, COD performance of
elite junior players evaluated by the 505 Agility test did not improve (Maio Alves
et al., 2010).
Regarding season alterations, certain reports suggested that professional
(Mercer et al., 1997) and semi-professional players (Caldwell & Peters, 2009)
may maintain increases in COD performance acquired during preseason during
in-season . Also, when not improved during preseason, COD ability has been
shown to develop during in-season (MCP and ECP) in regard to the beginning
and end-of-preseason (Silva et al., 2011). Also, it was reported that semi-
professional players performing in-season ST, show an increase in COD speed
(5-10% 505 test) (Thomas et al., 2009). As such, it seems that generally, COD
ability may improve during preseason period (Bogdanis et al., 2009; Caldwell &
Peters, 2009; Mercer et al., 1997) and can be maintained or further improved
throughout the competitive period (Caldwell & Peters, 2009; Silva et al., 2011;
Thomas et al., 2009).
2.3.4. Strength
Isokinetic strength evaluation of soccer players lower limbs have been currently
used in different studies despite the discrepancy in the angular velocities
analysed. This methodology allows identifying eventual muscular and functional
limitations (Ayalon et al., 2002; Croisier et al., 2008). Nevertheless, despite the
popularity of isometric and isokinetic test in research, the literature indicates
that they are inferior to isoenertial measures in predicting performance or
tracking changes longitudinally (Harris et al., 2007). However, longitudinal

53
researches regarding seasonal alterations in professional players’ strength had
relied exclusively on evaluations with isokinetic dynamometers (table 9). These
investigations showed that no alterations occur during preseason in knee
extensors (KE) and flexors (KF) strength at angular velocities of 60º/s-1 (Malliou
et al., 2003; Mercer et al., 1997), 90º/s-1 (Silva et al., 2011) and in KE at 180º/s-1
(Malliou et al., 2003). Nevertheless, Kraemer et al., (2004) observed a
significant decrease in KE from the BCP to MID in academic starter soccer
players. Also, both starter and non-starter players had a decrease in KE from
BCP to ECP. However, significant differences between the KF of starter and
non-starter players were observed in beginning and in the middle of the
competitive period.
Results regarding strength training (ST) interventions seem to highlight that
isoenertial measures have a great sensitivity in tracking longitudinal changes. In
fact, two studies examining the effects of strength training in preseason showed
that professional players improved 1RM in Half-Squat ranging 11-17.3%
(Bogdanis et al., 2009) and 23-26% (Ronnestad et al., 2008). Moreover,
improvements in maximum strength (1RM) per lean leg volume (LLV; 1RM/LLV)
(Bogdanis et al., 2009) and in the relative force (maximum force divided per
body weight) (Manolopoulos et al., 2006) after high-intensity ST and complex
ST interventions have been observed. In this respect, Bogdanis et al., (2009)
found that the increases in 1RM/LLV were only obtained in players performing
neural adaptations models, since no increments in 1RM/LLV were observed in
players performing hypertrophy mode of ST. It was suggested that strength
increments during preseason resulted in strength growths without increments in
muscle volume (Bogdanis et al., 2009).
2.4. Game-related physical parameters
Match analysis is a widely used instrument in professional soccer to study
tactical and physical performance of players (Abt & Lovell, 2009). This
instrument allows careful analysis of performance during a game that is
dependent of a large multiplicity of factors (e.g. training status) (Andersson et
al., 2010b; Bangsbo et al., 1991; Bradley et al., 2009; Gregson et al., 2010;

54
Mohr et al., 2003; Rampinini et al., 2007a; Rampinini et al., 2007b) and that
seasonal changes in game-related physical performance occur throughout the
season (Mohr et al., 2003; Rampinini et al., 2007b). Mohr et al., (2003), using
video-based time-motion analysis, observed that elite players covered a
significantly greater total distance (TD) during games played in the ECP than in
the MCP and BCP (5.8% and 3.7%). Rampinini et al., (2007b), using the multi-
camera method, (ProZone [Leeds, England]) also observed that elite players
covered a higher TD in games played at the ECP than at BCP (2.9%).
Nevertheless, a significantly higher TD was also performed in MCP than at the
BCP (2%) (Rampinini et al., 2007b).
The distance covered in high-intensity running (HI) during the match has been
proposed to be of great importance for performance in elite soccer because this
parameter clearly distinguishes players of different standards (Mohr et al.,
2003). Studies analysing alterations in HI throughout the season observed that
higher distances in HI are performed during games played in ECP that in the
MCP and BCP (Mohr et al., 2003; Rampinini et al., 2007b). Mohr et al., (2003)
observed an increase in HI (>15-km.h–1), from ECP to MCP and BCP (29.4%
and 19%). In the same order, Rampinini et al., (2007b) detected a change in HI
(>14.4-km.h–1) of 7.6% and 11.5%, respectively.
Although Morh et al., (2003) did not observe differences in sprinting (>30-km.h-
1) during the different time points of the season, Rampinini et al., (2007b)
observed that a higher distance was covered in very high-intensity running
(>19.8-km.h–1) in the ECP than in the MCP and BCP (17.9% and 20.2%).
Nevertheless, differences between studies are probably related to the pre-
defined thresholds of the different intensity categories of each match analysis
system. In fact, contradictions regarding the definitions used for high intensity
categories can be observed in literature. Also, both discrepancies between
systems in the accuracy of the determination of the distance covered at HI
(Randers et al., 2010) and in the accuracy of the intensity of the pre-defined
thresholds with players individualized thresholds of physiological stress (second
ventilatory threshold) have been reported (Abt & Lovell, 2009).

55
3. Off-season induced changes in physiological and functional parameters
3.1. Anthropometry
Regarding off-season alterations in professional players BM (table1), both
increases (Sotiropoulos et al., 2009) and decreases in BM have been reported
(Reinke et al., 2009). To comprehend alterations in BM, complementary
analysis of players BF and LBM should be performed. Semi-professional
(Caldwell & Peters, 2009) and professional players (Reinke et al., 2009)
experience changes in %BF during the season. Also, a decrease in LBM of
professional players usually occurs during off season period (Reinke et al.,
2009). Research regarding the effect of training programs in avoiding fitness
decrements during this period has been matter of analysis. Sotiropoulos et al.,
(2009) observed that even though players who followed an oriented training
program also had increases in BF, they had lower increases in weight and BF
compared to the players that did not follow any organized training program.
3.2. Endurance-physiological parameters
Deconditioning during off-season resulted in VO2max decrements in players of
different standards (table2) (Caldwell & Peters, 2009; Mohr et al., 2002;
Sotiropoulos et al., 2009). Sotiropoulos et al., (2009) observed that the
accomplishment of organized training program during a four-week off-season
period did not prevent decreases in VO2max, but did allow lower reductions in
VO2max than in those players that did not performed an organized activity
(1.4% vs. 6.1% less, respectively). Moreover, Christensen et al., (2011)
observed that only 2-wks of inactivity during off-season were reported to slower
VO2 kinetics (75% MAS) with a larger time constant ( 21.5+2.9 vs. 23.8+3.2-s,
pre vs. post, respectively) and larger mean response time (45.0+1.8 vs.
46.8+2.2-s, pre vs. post, respectively). Also, a decrease in muscle oxidative
capacity was evident by the reductions of muscle pyruvate dehydrogenase
(17%) and maximal activity of citrate synthase (12%) and 3-hydroxyacyl-CoA
(18%; Christensen et al., 2011). Also, evidence of off-season deconditioning is
reflected in decreases in time to exhaustion during incremental tests

56
(Sotiropoulos et al., 2009). Players’ ability to perform exercise of sub-maximal
intensity also appears to be affected (table3). Mohr et al., (2002) observed
significant increases in elite players’ heart rate (bpm) at the different running
speeds of 10, 14 and 17 km.h. These detraining effects may influence players’
preparation during preseason and, in a certain way, affect performance level
especially in the first matches of competitive season (Kraemer et al., 2004).
3.3 Soccer Specific Endurance (SSE)
As observed in particular physiological endurance-related parameters,
detraining impairs performance during SSE tests (table 5). In fact, Krustrup et
al., (2006) report a 11% decrement in YYIR2 performance throughout off-
season. The off-season inducing performance reductions in intermittent
exercise was also confirmed in elite players YYIE2 (38% decrease) (Oliveira,
2000). Moreover, other investigations examined that after the first 2 weeks of
inactivity during off-season significant performance reductions in YYIR2 test
(29%) and in the repeated sprint performance (2%) occurred (Christensen et al.,
2011).
3.4 Neuromuscular Function
Detraining effects are also evident in soccer players’ neuromuscular system. A
performance decline in 15-m and COD ability (Illinois agility test) of semi-
professional players (Caldwell & Peters, 2009) and in 50-m sprint time of
professional players (Ostojic, 2003) have been described. Regarding
impairments in the performance of jump ability there are some contradictions in
literature. In fact, although no significant alterations in isokinetic knee extensors
strength and in CMJ and SJ were examined after the offseason period of
professional players (Malliou et al., 2003), a decrement was reported in
CMJWAS of semi-professional players (Caldwell & Peters, 2009). Probably
these differences in results regarding jump ability are be related to the length of
the detraining period and/or with differences regarding jump kinetics and
kinematics.

57
4. Conclusions
A distinct feature is presented in relation to the physiological and functional
adaptations during preseason training. The majority of studies shows VO2max
increases during preseason (average increments ranging 5 to11%) that are
maintained into in-season. Also, above a threshold of 62 ml.kg-1.min, no
observations of significant increments were stated. MAS improves during
preseason (3.1-9.1%), and improvements of different magnitude (4.5-21.6%)
were also observed in sub-maximal exercise performance. Regarding in-season
alterations, although the majority of investigations did not report in-season
VO2max improvements, other endurance parameters, such as MAS and acute
physiological adaptations during submaximal exercise performance, seem to
increase during this period. In addition, soccer specific endurance (SSE) follows
a similar trend of adaptation. Faster and greater SSE (e.g. endurance
intermittent tests and game-physical performance) improvements were
observed during preseason. Also great average increments in SSE (e.g. Yo-Yo
tests) have been reported during in-season without significant modifications in
VO2max and smaller physiological adaptations in sub-maximal exercise. This
highlights the high sensitivity and ability of field measures in the training
monitorization of players. Moreover, game-related physical parameters in high-
intensity categories showed great increases during in-season. This may
suggest that other endurance physiological determinants (e.g., VO2 kinetics and
ability to maintain acid-base balance) that have been demonstrated to be
associated with the ability to increase performance (Christensen et al., 2011)
and carry out high-intensity intermittent exercise (Rampinini et al., 2009a;
Rampinini et al., 2009b) can occur during the season and so, contribute to SSE
increments. Some studies have found correlations between VO2max and
performance in RSA (Rampinini et al., 2009a) and YYIR tests (Rampinini et al.,
2009b). Nevertheless, although the recently reported correlations between
changes in SSE field tests (e.g., YYIET2) and changes in physical game
performance (e.g., high-intensity running) during the season this was not
evident for VO2max (Bradley et al., 2011).
58
Adaptations of players’ neuromuscular systems have been measured
throughout sprint, COD and jump tests, with higher evidence in those jumps
involving stretch-shortening cycle activities (SSC) and all body movement
interactions (jumps with arm swing). Data provides evidence that when early
improvements are obtained (from PPS to BCP), they can be maintained and
even further improved during in-season. This suggests that neuromuscular
adaptations affecting SSC mechanisms may occur during in-season.
Muscle-power base efforts and SSE have been shown to have a greater
tendency to improve during in-season than the usually motorized physiological
endurance parameters (e.g., VO2max and AT). As such, investigations to clarify
which adaptations (e.g., motor unit recruitment and synchronization; muscle
morphology; soccer-activity efficiency) and interactions are related with players’
increments in SSE performance measured by field tests and game-related
physical parameters (high-intensity running) are urgent. For example, although
positive adaptations in running economy have mainly been reported and
investigated during preseason, there are recent reports of increased RE (75%
of MAS) in professional players after performing 2 weeks of intense HIT
performed as soon the competitive season finishes (Christensen et al., 2011).
Moreover, in addition to the fact that investigations on these matters is scarce,
their lack of specificity in assessing RE is clear, which may suggest that soccer
specific work economy may improve somewhat, with relevant gains not
detected by less specific or ecological methods. Furthermore, recent reports
highlight that enhancement in neuromuscular function can be a determinant in
improving short and long-term endurance capacity (Aagaard & Andersen,
2010). Nevertheless, the increase in game-physical activity towards the end-of-
season can result, at least in part, from an improvement in some form of pacing
strategies by professional players. As such, the development and improvement
of a generic (across all outfield positions) pacing strategy cannot be excluded
(Edwards & Noakes, 2009). Nevertheless, there are contradictions regarding
the concept of team sport players pacing their effort during matches (Aughey,
2010).
59
The off-season period appears to result in decrements of a variety of
physiological and functional parameters. Moreover, it seems that such
decrements are more evident in muscle power ability than in muscle strength.
Furthermore, due to the lack of research conducted during off-season, it seems
that the analysis of the efficiency of players performing training protocols in
order allow them to recover from the stressful season, and in addition, avoiding
a great magnitude of detraining effects is needed.
In conclusion, although an extraordinary growth in the number of scientific
investigations concerning soccer has been observed in the last decades, there
is yet much to elucidate regarding the physiological factors related with soccer
players’ performance changes throughout the season.
5. References
Aagaard, P., & Andersen, J. L. (2010). Effects of strength training on endurance
capacity in top-level endurance athletes. Scandinavian Journal of
Medicine & Science in Sports, 20, 39-47.
Abt, G., & Lovell, R. (2009). The use of individualized speed and intensity
thresholds for determining the distance run at high-intensity in
professional soccer. J Sports Sci, 27(9), 893-898.
Andersson, H., Karlsen, A., Blomhoff, R., Raastad, T., & Kadi, F. (2010a).
Active recovery training does not affect the antioxidant response to
soccer games in elite female players. Br J Nutr, 1-8.
Andersson, H., Raastad, T., Nilsson, J., Paulsen, G., Garthe, I., & Kadi, F.
(2008). Neuromuscular fatigue and recovery in elite female soccer:
effects of active recovery. Med Sci Sports Exerc, 40(2), 372-380.
Andersson, H. A., Randers, M. B., Heiner-Moller, A., Krustrup, P., & Mohr, M.
(2010b). Elite female soccer players perform more high-intensity running
when playing in international games compared with domestic league
games. J Strength Cond Res, 24(4), 912-919.

60
Apor, P. (1988). Successful Formulae for Fitness Training. In T. Reilly, A. Less,
K. Davids & J. Murphy (Eds.), In: Science and Football (pp. 95-106):
E&F. N. Spon, London/New York.
Arnason, A., Sigurdsson, S. B., Gudmundsson, A., Holme, I., Engebretsen, L.,
& Bahr, R. (2004). Physical fitness, injuries, and team performance in
soccer. Med Sci Sports Exerc, 36(2), 278-285.
Ascensao, A., Rebelo, A., Oliveira, E., Marques, F., Pereira, L., & Magalhaes, J.
(2008). Biochemical impact of a soccer match - analysis of oxidative
stress and muscle damage markers throughout recovery. Clin Biochem,
41(10-11), 841-851.
Aughey, R. J. (2010). Australian football player work rate: evidence of fatigue
and pacing? Int J Sports Physiol Perform, 5(3), 394-405.
Ayalon, M., Barak, Y., & Rubinstein, M. (2002). Qualitative analyses of the
isokinetic moment curve of the knee extensors. Isokinetics and Exercise
Science, 10, 145-151.
Aziz, A., Tan, F., & Teh, K. (2005). Variation in selected fitness attributes of
professional soccer players during a league season. In T. Reilly, D.
Araújo & J. Cabri (Eds.), Science and Football V (pp. 134-138):
London/New York: E and FN Spon.
Aziz, A. R., Mukherjee, S., Chia, M. Y., & Teh, K. C. (2008). Validity of the
running repeated sprint ability test among playing positions and level of
competitiveness in trained soccer players. Int J Sports Med, 29(10), 833-
838.
Bangsbo, J. (1994). The physiology of soccer - with special reference to intense
intermittent exrcise. Acta Physiol Scand., 150, suppl. 615.
Bangsbo, J., Iaia, F. M., & Krustrup, P. (2007). Metabolic response and fatigue
in soccer. Int J Sports Physiol Perform, 2(2), 111-127.
Bangsbo, J., Mohr, M., & Krustrup, P. (2006). Physical and metabolic demands
of training and match-play in the elite football player. J Sports Sci, 24(7),
665-674.
Bangsbo, J., Norregaard, L., & Thorso, F. (1991). Activity profile of competition
soccer. Can J Sport Sci, 16(2), 110-116.

61
Billat, L. V., & Koralsztein, J. P. (1996). Significance of the velocity at VO2max
and time to exhaustion at this velocity. Sports Med, 22(2), 90-108.
Bogdanis, G. C., Papaspyrou, A., Souglis, A., Theos, A., Sotiropoulos, A., &
Maridaki, M. (2009). Effects of hypertrophy and a maximal strength
training programme on speed, force and power of soccer players. In T.
Reilly & F. Korkusuz (Eds.), Science and Football VI. The proceedings of
the sixth world congress on science and football. (pp. 290-295):
Routledge.
Bogdanis, G. C., Papaspyrou, A., Souglis, A. G., Theos, A., Sotiropoulos, A., &
Maridaki, M. (2011). Effects of Two Different Half-Squat Training
Programs on Fatigue During Repeated Cycling Sprints in Soccer
Players. J Strength Cond Res.
Bradley, P. S., Mascio, M. D., Bangsbo, J., & Krustrup, P. (2011). The maximal
and sub-maximal versions of the Yo-Yo intermittent endurance test level
2 are simply reproducible, sensitive and valid. Eur J Appl Physiol.
Bradley, P. S., Mohr, M., Bendiksen, M., Randers, M. B., Flindt, M., Barnes, C.,
et al. (2010). Sub-maximal and maximal Yo-Yo intermittent endurance
test level 2: heart rate response, reproducibility and application to elite
soccer. Eur J Appl Physiol.
Bradley, P. S., Sheldon, W., Wooster, B., Olsen, P., Boanas, P., & Krustrup, P.
(2009). High-intensity running in English FA Premier League soccer
matches. J Sports Sci, 27(2), 159-168.
Brady, K., Maile, A., & Ewing, B. (1997). An investigation into the fitness of
professional soccer players over two seasons. In T. Reilly, J. Bangsbo &
M. Hughes (Eds.), Science and Footbal III (pp. 118-222): London: E &
FN Spon.
Brites, F. D., Evelson, P. A., Christiansen, M. G., Nicol, M. F., Basilico, M. J.,
Wikinski, R. W., et al. (1999). Soccer players under regular training show
oxidative stress but an improved plasma antioxidant status. Clin Sci
(Lond), 96(4), 381-385.

62
Brughelli, M., Cronin, J., Levin, G., & Chaouachi, A. (2008). Understanding
change of direction ability in sport: a review of resistance training studies.
Sports Med, 38(12), 1045-1063.
Caldwell, B. P., & Peters, D. M. (2009). Seasonal variation in physiological
fitness of a semiprofessional soccer team. J Strength Cond Res, 23(5),
1370-1377.
Carling, C., & Orhant, E. (2010). Variation in body composition in professional
soccer players: interseasonal and intraseasonal changes and the effects
of exposure time and player position. J Strength Cond Res, 24(5), 1332-
1339.
Casajus, J. A. (2001). Seasonal variation in fitness variables in professional
soccer players. J Sports Med Phys Fitness, 41(4), 463-469.
Chelly, M. S., Fathloun, M., Cherif, N., Ben Amar, M., Tabka, Z., & Van Praagh,
E. (2009). Effects of a back squat training program on leg power, jump,
and sprint performances in junior soccer players. J Strength Cond Res,
23(8), 2241-2249.
Christensen, P. M., Krustrup, P., Gunnarsson, T. P., Kiilerich, K., Nybo, L., &
Bangsbo, J. (2011). VO2 Kinetics and Performance in Soccer Players
after Intense Training and Inactivity. Med Sci Sports Exerc.
Clark, N., Edwards, A. M., Morton, R., & Butterly, J. (2008). Season-to-season
variation of physiological fitness within a squad of professional male
soccer players. Journal of Sports Science and Medicine, 7, 157-165.
Cometti, G., Maffiuletti, N. A., Pousson, M., Chatard, J. C., & Maffulli, N. (2001).
Isokinetic Strength and Anaerobic Power of Elite, Subelite and Amateur
Soccer Players. Int J Sports Med, 22, 45-51.
Croisier, J. L., Ganteaume, S., Binet, J., Genty, M., & Ferret, J. M. (2008).
Strength imbalances and prevention of hamstring injury in professional
soccer players: a prospective study. Am J Sports Med, 36(8), 1469-1475.
Dauty, M., & Potiron Josse, M. (2004). Correlations and differences of
performance between soccer players, professionals, young players and
amateurs, from the 10-meter sprint test and knee isokinetic assessment.
Science & Sports, 19 75-79.

63
Di Salvo, V., Baron, R., Tschan, H., Calderon Montero, F. J., Bachi, N., &
Pigozzi, F. (2007). Performance characteristics according to playing
position in elite soccer. Int J Sports Med, 28, 222-227.
Di Salvo, V., Gregson, W., Atkinson, G., Tordoff, P., & Drust, B. (2009).
Analysis of high intensity activity in Premier League soccer. Int J Sports
Med, 30(3), 205-212.
Dunbar, G. (2002). An examination of longitudinal change in aerobic capacity
trough the playing year in english professional soccer players, as
determined by lactate profiles. In W. Spinks, T. Reilly & J. Murphy (Eds.),
In: Science and Football IV (pp. 73-75): E&F. N. Spon, London/New
York.
Dupont, G., Akakpo, K., & Berthoin, S. (2004). The effect of in-season, high-
intensity interval training in soccer players. J Strength Cond Res, 18(3),
584-589.
Edwards, A. M., Macfadyen, A. M., & Clark, N. (2003). Lactate and ventilatory
thresholds reflect the training status of professional soccer players where
maximum aerobic power is unchanged. Journal of Sports Science and
Medicine, 2, 23-29.
Edwards, A. M., & Noakes, T. D. (2009). Dehydration: cause of fatigue or sign
of pacing in elite soccer? Sports Med, 39(1), 1-13.
Fatouros, I. G., Chatzinikolaou, A., Douroudos, II, Nikolaidis, M. G., Kyparos, A.,
Margonis, K., et al. (2009). Time-Course of Changes in Oxidative Stress
and Antioxidant Status Responses Following a Soccer Game. J Strength
Cond Res.
Ferrari Bravo, D., Impellizzeri, F. M., Rampinini, E., Castagna, C., Bishop, D., &
Wisloff, U. (2008). Sprint vs. interval training in football. Int J Sports Med,
29(8), 668-674.
Filaire, E., Bernain, X., Sagnol, M., & Lac, G. (2001). Preliminary results on
mood state, salivary testosterone:cortisol ratio and team performance in
a professional soccer team. Eur J Appl Physiol, 86(2), 179-184.

64
Filaire, E., Lac, G., & Pequignot, J. M. (2003). Biological, hormonal, and
psychological parameters in professional soccer players throughout a
competitive season. Percept Mot Skills, 97(3 Pt 2), 1061-1072.
Gorostiaga, E. M., Izquierdo, M., Ruesta, M., Iribarren, J., Gonzalez-Badillo, J.
J., & Ibanez, J. (2004). Strength training effects on physical performance
and serum hormones in young soccer players. Eur J Appl Physiol, 91(5-
6), 698-707.
Gregson, W., Drust, B., Atkinson, G., & Salvo, V. D. (2010). Match-to-match
variability of high-speed activities in premier league soccer. Int J Sports
Med, 31(4), 237-242.
Haritodinis, K., Koutlianos, N., Koudi, E., Haritonidou, M., & Deligiannis, A.
(2004). Seasonal variation of aerobic capacity in elite soccer, basketball
and volleyball players. Journal of Human Performance, 46, 289-302.
Harris, N., Cronin, J., & Keogh, J. (2007). Contraction force specificity and its
relationship to functional performance. J Sports Sci, 25(2), 201-212.
Helgerud, J., Engen, L. C., Wisloff, U., & Hoff, J. (2001). Aerobic endurance
training improves soccer performance. Med Sci Sports Exerc, 33(11),
1925-1931.
Helgerud, J., Kemi, O. J., & Hoff, J. (2003). Pre-season concurrent strength and
endurance development in elite soccer players. . In J. Hoff & J. Helgerud
(Eds.), Football (soccer): New developments in physical training research
(pp. 55-66). Trondheim,: NTNU.
Heller, J., Procházka, L., Bunc, V., Dlouhá, R., & Novotný, J. (1992). Functional
capacity in top league football players during the competitive season. J
Sports Sci(10), 152.
Hill-Haas, S. V., Dawson, B., Impellizzeri, F. M., & Coutts, A. J. (2011).
Physiology of small-sided games training in football: a systematic review.
Sports Med, 41(3), 199-220.
Hoff, J. (2005). Training and testing physical capacities for elite soccer players.
J Sports Sci, 23(6), 573-582.
Hoff, J., & Helgerud, J. (2003). Maximal strength training enhances running
economy and aerobic endurance performance. In J. Hoff & J. Helgerud

65
(Eds.), Football (soccer): New developments in physical training research
(pp. 39-55). Trondheim,: NTNU.
Hoff, J., & Helgerud, J. (2004). Endurance and strength training for soccer
players: physiological considerations. Sports Med, 34(3), 165-180.
Iaia, F. M., Rampinini, E., & Bangsbo, J. (2009a). High-intensity training in
football. Int J Sports Physiol Perform, 4(3), 291-306.
Iaia, F. M., Rostgaard, T., Krustrup, P., & Bangsbo, J. (2009b). Seasonal
changes in intermittent exercise perfromance of soccer players evaluated
by the Yo-Yo intermittent recovery test level 2. In T. Reilly & F. Korkusuz
(Eds.), Science and Football VI. The proceedings of the sixth world
congress on science anf football (pp. 357-359): Routledge.
Impellizzeri, F. M., Marcora, S. M., Castagna, C., Reilly, T., Sassi, A., Iaia, F.
M., et al. (2006). Physiological and performance effects of generic versus
specific aerobic training in soccer players. Int J Sports Med, 27(6), 483-
492.
Impellizzeri, F. M., Rampinini, E., Castagna, C., Bishop, D., Ferrari Bravo, D.,
Tibaudi, A., et al. (2008). Validity of a repeated-sprint test for football. Int
J Sports Med, 29(11), 899-905.
Ispirlidis, I., Fatouros, I. G., Jamurtas, A. Z., Nikolaidis, M. G., Michailidis, I.,
Douroudos, I., et al. (2008). Time-course of changes in inflammatory and
performance responses following a soccer game. Clin J Sport Med,
18(5), 423-431.
Jensen, J., Randers, M., Krustrup, P., & Bangsbo, J. (2009). Intermittent high-
intensity drills improve in-seasonal performance of elite soccer players.
In T. Reilly & F. Korkusuz (Eds.), Science and Football VI. The
procedings of the Sixth World Congress on Science and Football (pp.
296-301): Routledge.
Jones, P., Bampouras, T. M., & Marrin, K. (2009). An investigation into the
physical determinants of change of direction speed. J Sports Med Phys
Fitness, 49(1), 97-104.
Joyner, M. J., & Coyle, E. F. (2008). Endurance exercise performance: the
physiology of champions. J Physiol, 586(1), 35-44.
66
Kalapotharakos, V. I., Ziogas, G., & Tokmakidis, S. P. (2011). Seasonal Aerobic
Performance Variations in Elite Soccer Players. J Strength Cond Res.
Kotzamanidis, C., Chatzopoulos, D., Michailidis, C., Papaiakovou, G., &
Patikas, D. (2005). The effect of a combined high-intensity strength and
speed training program on the running and jumping ability of soccer
players. J Strength Cond Res, 19(2), 369-375.
Kraemer, W. J., French, D. N., Paxton, N. J., Hakkinen, K., Volek, J. S.,
Sebastianelli, W. J., et al. (2004). Changes in exercise performance and
hormonal concentrations over a big ten soccer season in starters and
nonstarters. J Strength Cond Res, 18(1), 121-128.
Krustrup, P., Mohr, M., Amstrup, T., Rysgaard, T., Johansen, J., Steensberg,
A., et al. (2003). The yo-yo intermittent recovery test: physiological
response, reliability, and validity. Med Sci Sports Exerc, 35(4), 697-705.
Krustrup, P., Mohr, M., Nybo, L., Jensen, J. M., Nielsen, J. J., & Bangsbo, J.
(2006). The Yo-Yo IR2 test: physiological response, reliability, and
application to elite soccer. Med Sci Sports Exerc, 38(9), 1666-1673.
Krustrup, P., Ortenblad, N., Nielsen, J., Nybo, L., Gunnarsson, T. P., Iaia, F. M.,
et al. (2011). Maximal voluntary contraction force, SR function and
glycogen resynthesis during the first 72 h after a high-level competitive
soccer game. Eur J Appl Physiol.
Lees, A., & Nolan, L. (1998). The biomechanics of soccer: a review. J Sports
Sci, 16(3), 211-234.
Lopez-Segovia, M., Palao Andres, J. M., & Gonzalez-Badillo, J. J. (2010). Effect
of 4 months of training on aerobic power, strength, and acceleration in
two under-19 soccer teams. J Strength Cond Res, 24(10), 2705-2714.
Magal, M., Smith, R. T., Dyer, J. J., & Hoffman, J. R. (2009). Seasonal variation
in physical performance-related variables in male NCAA Division III
soccer players. J Strength Cond Res, 23(9), 2555-2559.
Magalhaes, J., Rebelo, A., Oliveira, E., Silva, J. R., Marques, F., & Ascensao,
A. (2010). Impact of Loughborough Intermittent Shuttle Test versus
soccer match on physiological, biochemical and neuromuscular
parameters. Eur J Appl Physiol, 108(1), 39-48.

67
Maio Alves, J. M., Rebelo, A. N., Abrantes, C., & Sampaio, J. (2010). Short-
term effects of complex and contrast training in soccer players' vertical
jump, sprint, and agility abilities. J Strength Cond Res, 24(4), 936-941.
Malliou, P., Ispirlidis, I., Beneka, A., Taxildaris, K., & Godolias, G. (2003).
Vertical jump and knee extensors isokinetic performance in professional
soccer players related to the phase of the training period. Isokinetics and
Exercise Science, 11, 165-169.
Malm, C., Ekblom, O., & Ekblom, B. (2004a). Immune system alteration in
response to increased physical training during a five day soccer training
camp. Int J Sports Med, 25(6), 471-476.
Malm, C., Ekblom, O., & Ekblom, B. (2004b). Immune system alteration in
response to two consecutive soccer games. Acta Physiol Scand, 180(2),
143-155.
Manolopoulos, E., Papadopoulos, C., & Kellis, E. (2006). Effects of combined
strength and kick coordination training on soccer kick biomechanics in
amateur players. Scand J Med Sci Sports, 16(2), 102-110.
McMillan, K., Helgerud, J., Grant, S. J., Newell, J., Wilson, J., Macdonald, R., et
al. (2005a). Lactate threshold responses to a season of professional
British youth soccer. Br J Sports Med, 39(7), 432-436.
McMillan, K., Helgerud, J., Macdonald, R., & Hoff, J. (2005b). Physiological
adaptations to soccer specific endurance training in professional youth
soccer players. Br J Sports Med, 39(5), 273-277.
Mercer, T. H., Gleeson, N. P., & Mitchell, J. (1997). Fitness profiles of
professional soccer players before and after pre-season conditioning. In
T. Reilly, J. Bangsbo & M. Hughes (Eds.), Science and Footbal III (pp.
112-117): London: E & FN Spon.
Metaxas, T., Sendelides, T., Koutlianos, N., & Mandroukas, K. (2006). Seasonal
variation of aerobic performance in soccer players according to positional
role. J Sports Med Phys Fitness, 46(4), 520-525.
Mohr, M., Krustrup, P., & Bangsbo, J. (2002). Physiological characteristics and
exhaustive exercise performance of elite soccer players during a season.
Med Sci Sports Exerc, 34(5), S24.

68
Mohr, M., Krustrup, P., & Bangsbo, J. (2003). Match performance of high-
standard soccer players with special reference to development of fatigue.
J Sports Sci, 21(7), 519-528.
Mujika, I., Santisteban, J., & Castagna, C. (2009). In-season effect of short-term
sprint and power training programs on elite junior soccer players. J
Strength Cond Res, 23(9), 2581-2587.
Mujika, I., Santisteban, J., Impellizzeri, F., & Castagna, C. (2008). Fitness
determinants of sucess in men`s and women`s football. J Sports Sci, 1-8.
Nunez, V. M., Da Silva-Grigoletto, M. E., Castillo, E. F., Poblador, M. S., &
Lancho, J. L. (2008). Effects of training exercises for the development of
strength and endurance in soccer. J Strength Cond Res, 22(2), 518-524.
Oliveira, J. (2000). Endurance evaluation in intermittent sports. Unpublished
Doctoral Thesis, University of Porto.
Ostojic, S. (2003). Seasonal alterations in body composition and sprint
performance of elite soccer players. J Exerc Physiol Online, 6(3), 24-27.
Rampinini, E., Bishop, D., Marcora, S. M., Ferrari Bravo, D., Sassi, R., &
Impellizzeri, F. M. (2007a). Validity of simple field tests as indicators of
match-related physical performance in top-level professional soccer
players. Int J Sports Med, 28(3), 228-235.
Rampinini, E., Bosio, A., Ferraresi, I., Petruolo, A., Morelli, A., & Sassi, A.
(2011). Match-Related Fatigue in Soccer Players. Med Sci Sports Exerc.
Rampinini, E., Coutts, A. J., Castagna, C., Sassi, A., & Impellizzeri, F. (2007b).
Variation in top level soccer match performnance. Int J Sports Med, 28,
1018-1024.
Rampinini, E., Sassi, A., Azzalin, A., Castagna, C., Menaspa, P., Carlomagno,
D., et al. (2009a). Physiological determinants of Yo-Yo intermittent
recovery tests in male soccer players. Eur J Appl Physiol.
Rampinini, E., Sassi, A., Morelli, A., Mazzoni, S., Fanchini, M., & Coutts, A. J.
(2009b). Repeated-sprint ability in professional and amateur soccer
players. Appl Physiol Nutr Metab, 34(6), 1048-1054.
Randers, M., Rostgaard, T., & Krustrup, P. (2007). Physical match performance
and Yo-Yo IR2 test results of successful and unsuccessful football teams

69
in the Danish Premier League. Journal of Sports Science and Medicine,
6, 70-71.
Randers, M. B., Mujika, I., Hewitt, A., Santisteban, J., Bischoff, R., Solano, R.,
et al. (2010). Application of four different football match analysis systems:
a comparative study. J Sports Sci, 28(2), 171-182.
Rebelo, A. N., Candeias, J. R., Fraga, M. M., Duarte, J. A., Soares, J. M.,
Magalhaes, C., et al. (1998). The impact of soccer training on the
immune system. J Sports Med Phys Fitness, 38(3), 258-261.
Rebelo, A. N., & Soares, J. M. C. (1997). Endurance capacity of soccer players
pre-season and during the playing season. In T. Reilly, J. Bangsbo & M.
Hughes (Eds.), Science and footbal III (pp. 106-111): London: E & FN
Spon.
Reilly, T., Drust, B., & Clarke, N. (2008). Muscle fatigue during football match-
play. Sports Med, 38(5), 357-367.
Reilly, T., & Ekblom, B. (2005). The use of recovery methods post-exercise. J
Sports Sci, 23(6), 619-627.
Reilly, T., & Gilbourne, D. (2003). Science and football: a review of applied
research in the football codes. J Sports Sci, 21(9), 693-705.
Reilly, T., Williams, A. M., Nevill, A., & Franks, A. (2000). A multidisciplinary
approach to talent identification in soccer. Journal of Sports Sciences,18,
695-702.
Reinke, S., Karhausen, T., Doehner, W., Taylor, W., Hottenrott, K., Duda, G. N.,
et al. (2009). The influence of recovery and training phases on body
composition, peripheral vascular function and immune system of
professional soccer players. PLoS ONE, 4(3), e4910.
Ronnestad, B. R., Kvamme, N. H., Sunde, A., & Raastad, T. (2008). Short-term
effects of strength and plyometric training on sprint and jump
performance in professional soccer players. J Strength Cond Res, 22(3),
773-780.
Ronnestad, B. R., Nymark, B. S., & Raastad, T. (2011). Effects of in-season
strength maintenance training frequency in professional soccer players. J
Strength Cond Res, 25(10), 2653-2660.

70
Sedano, S., Matheu, A., Redondo, J. C., & Cuadrado, G. (2011). Effects of
plyometric training on explosive strength, acceleration capacity and
kicking speed in young elite soccer players. J Sports Med Phys Fitness,
51(1), 50-58.
Shephard, R. J. (1999). Biology and medicine of soccer: an update. J Sports
Sci, 17(10), 757-786.
Silva, J. R., Magalhaes, J. F., Ascensao, A. A., Oliveira, E. M., Seabra, A. F., &
Rebelo, A. N. (2011). Individual Match Playing Time During the Season
Affects Fitness-Related Parameters of Male Professional Soccer Players.
J Strength Cond Res.
Silvestre, R., Kraemer, W. J., West, C., Judelson, D. A., Spiering, B. A.,
Vingren, J. L., et al. (2006). Body composition and physical performance
during a National Collegiate Athletic Association Division I men's soccer
season. J Strength Cond Res, 20(4), 962-970.
Sotiropoulos, A., Travlos, A. K., Gissis, I., Souglis, A. G., & Grezios, A. (2009).
The effect of a 4-week training regimen on body fat and aerobic capacity
of professional soccer players during the transition period. J Strength
Cond Res, 23(6), 1697-1703.
Sporis, G., Ruzic, L., & Leko, G. (2008a). The anaerobic endurance of elite
soccer players improved after a high-intensity training intervention in the
8-week conditioning program. J Strength Cond Res, 22(2), 559-566.
Sporis, G., Ruzic, L., & Leko, G. (2008b). Effects of a new experimental training
program on V.O2max and running performance. J Sports Med Phys
Fitness, 48(2), 158-165.
Stolen, T., Chamari, K., Castagna, C., & Wisloff, U. (2005). Physiology of
soccer: an update. Sports Med, 35(6), 501-536.
Svensson, M., & Drust, B. (2005). Testing soccer players. J Sports Sci, 23(6),
601-618.
Thomas, K., French, D., & Hayes, P. R. (2009). The effect of two plyometric
training techniques on muscular power and agility in youth soccer
players. J Strength Cond Res, 23(1), 332-335.

71
Thomas, V., & Reilly, T. (1979). Fitness assessment of English league soccer
players through the competitive season. Br J Sports Med, 13(3), 103-
109.
Wong, P. L., Chaouachi, A., Chamari, K., Dellal, A., & Wisloff, U. (2010). Effect
of preseason concurrent muscular strength and high-intensity interval
training in professional soccer players. J Strength Cond Res, 24(3), 653-
660.
Zoppi, C. C., Hohl, R., Silva, F. C., Lazarim, F. L., Neto, J. M., Stancanneli, M.,
et al. (2006). Vitamin C and e supplementation effects in professional
soccer players under regular training. J Int Soc Sports Nutr, 3, 37-44.

72

73
Table1. Summary of studies examining changes in soccer player’s anthropometry characteristics throughout a soccer season.
Study Level/Country n (years) S Test Training Period
ECP1 PPS EPS/BCP MCP ECP2
Reinke et al. (2009) Professional/German 10 (r:20-36) T BM(kg) 90.1 + 5.6 88.3+5.9* 88.5+4.0*
Edwards et al., (2003) Professional/England 12 (26.2+3.3) T BM 79.3 + 9.36 77.2 + 6.34Ω
Sotiropoulos et al. (2009) Professional/Greek 28 (23.2+2.55) EG BM 78.14 +4.77 78.74 + 5.00*
20 (24.4.+2.97) CG 76.48 + 2.65 77.90 + 2.82*
Ostojic (2003) Elite/Serbia 30 (23.5±3.1) T BM 77.8±6.3 78.0±6.1 76.8±6.1 74.8±6.0Ω†
Aziz et al., (2005) Elite/Singapore 41 (25.7+3.9) T BM 70.6 + 10.3 69.7 + 10.1 69.4 + 9.8 69.7 + 10.1
Metaxas et al. (2006) Elite U-19/Greek 10 (18.2+0.9) CD BM 70 + 4.9 70.2 + 4.2 70.4 + 4 70.1 + 4.4
12 (18.1+1) MF 69.5 + 5.1 69.4 + 5.1 69.6 + 4.7 69.5 + 5.5
10 (18.2+0.9) AT 69.5 + 5.6 68.8 + 5.1 72.7 + 4.7 69.4 + 5.6
Casajus (2001) Elite/Spain 15 (25.8+3.2) T BM 78.6 + 6.60 78.5 + 6.45
Mercer et al. (1997) Professional 15 (24.7+3.8) BM 78.1 + 9.2 77.6 + 8.7
Kalapotharakos et al.
(2011)
Elite/Greek 12 (25+5) T BM 74.2 + 6.5 74.6 + 6.5 74.2 + 6.6
Silva et al. (2011) Elite/Portugal 18 (25.7+4.6) T BM 76.5 + 9.2 76.2 + 9.3 76.3 + 8.4 77.7 + 9.1
Reinke et al. (2009) Professional/German 10 (r:20-36) T BF(Kg) 10.3+5.6 11.1+5.4 9.4+4.6
Edwards et al. (2003) Professional/England 12(26.2+3.3) T %BF 12.3+3.11 11.8+2.4 Ω
Sotiropoulos et al. (2009) Professional/Greek 28 (23.2+2.55) EG %BF 7.92+1.68 8.17+1.81*
20 (24.4.+2.97) CG 7.77+1.79 8.59+1.80*
Caldwell and Peters
(2009)
Semi-
professional/England
13 (24+4.4) %BF 14.3+3.1 14.9+3.0* 14.5+3.2 Ω
14.3 + 3.2
Ω†
14.0 + 3.3 Ω‡
Ostojic (2003) Elite/Serbia 30 (23.5±3.1) T %BF 11.5±2.1 10.9±2.4 10.2±2.9 Ω
9.6±2.5 Ω†‡
Aziz et al. (2005) Elite/Singapore 41 (25.7+3.9) T %BF 11.0±2.7 10.6±2.3 10.3±2.3 10.4±2.3

74

75
Table1. Contd.
Study Level/Country n (years) S Test Training Period
ECP1 PPS EPS/BCP MCP ECP2
Metaxas et al. (2006) Elite U-19/Greek 10 (18.2+0.9) CD %BF 14.1±2 14.3±2 15.2±3.2 14±1.9
12 (18.1+1) MF 15±3 15.2±3.2 14.8±2.4 15±3
10 (18.2+0.9) AT 15.2±3.2 14.4±3.1 14.1±2.4 15.1±3.4
Casajus (2001) Elite/Spain 15 (25.8+3.2) T %BF 8.6±0.91 8.2±0.91 †
Heller et al. (1992) Elite / Czech 12 (23.5+3.9) T %BF 6.5±2.5 6.5±2.5
Mercer et al. (1997) 1st division/ ND 15 (24.7+3.8) %BF 17.3±3.7 16.2±3.4
Ω
Kalapotharakos et al. (2011) Elite/Greek 12 (25+5) T %BF 10.5±2.5 8.7±1.8 Ω
8.3±1.44 Ω
Silva et al. (2011) Elite/Portugal 18 (25.7+4.6) T %BF 9.8±3.7 9.5±2.7 9.3±3 9.1±3.1
Reinke et al. (2009) Professional/German 10 (r:20-36) T LBM(kg) 74.4+4.2 72.2+3.2 * 73.9+3.7 Ω
Ostojic (2003) Elite/Serbia 30 (23.5±3.1) T LBM 68.8±5.3 69.5±4.9 69.1±6.4 67.6±5.3
Casajus (2001) Elite/Spain 15 (25.8+3.2) T LBM 71.9+6.01 72.1+5.77
Metaxas et al. (2006) Elite U-19/Greek 10 (18.2+0.9) CD LBM 61±4.6 60.1±3.7 59.8±4.7 60.2±3.9
12 (18.1+1) MF 58.9±3.7 58.8±2.9 59.3±3.7 59±3.2
10 (18.2+0.9) AT 58.7±2.9 58.5±3.1 62.4±3.7 58.8±2.3
Heller et al. (1992) Elite/ Czech 12 (23.5+3.9) T LBM 70.4±2.9 72.3±3.2 †
Values are mean + SD; S – sample; ECP1 – end of competition period; PPS – Prior preseason; EPS/BCP - end preseason period/beginning
competition period; MCP – Middle competition period; ECP2 – end of competition period 2; r – ranging; Czech – czech republic; T- team; EG –
experimental group; CG – control group; CD – central defender; MF – midfielder; AT – attacker; BM- Body mass (kg); %BF- percentage body fat; LBM-
lean body mass; *sig. dif from ECP1;
Ω sig. dif from PPS;
† sig. dif from EPS/BCP;
‡sig. dif from MCP;

76

77
Table2. Summary of studies examining changes in soccer players VO2max (ml.kg-1.min or in percentage variation) through different
periods of a soccer season
Study Level/Country n (years) S D/E
Training Period
ECP1 PPS EPS/BCP MCP ECP2
Haritodinis et al.
(2004)
Elite/Greek 12 (25+5.3) T D 52.4 + 4.1 59.8 + 3.7Ω 57.6+ 4.7
Ω
Kalapotharakos et al.
(2011)
Elite/Greek 12 (25+5) T D 58.1 + 3.11 60.8 + 2.66 Ω
61.2 + 2.3 Ω
Metaxas et al. (2006) Elite U-19/Greek 10(18.2+0.9) CD D ≈ 53 ↑19.3%Ω ↑22.9%
Ω ↑17.6%
Ω
12(18.1+1) MF ≈ 54 ↑19.5% Ω
↑22.1% Ω
↑17.7% Ω
10(18.2+0.9) AT ≈ 52 ↑24.6% Ω
↑27.2% Ω
↑21% Ω
Mohr et al. (2002) Elite/Danmark 11(24.0+1.0) T D 58.1 + 0.9 55.4 + 0.7* 59.0 + 0.8 Ω
Clark et al. (2008) Elite/England 42(25+3.5) T D ≈ 62 ≈ 61
≈ 62 ≈ 62.5 ≈ 61
≈ 61 ≈ 63 ≈ 61.5
Casajus (2001) Elite/Spain 15(25.8+3.2) T D 66.5 66.4
Heller et al. (1992) Elite/ND 12(23.5+3.9) T D 60.1 + 2.8 59.3 + 3.1
Mercer et al. (1997) Professional/ND 15(24.7+3.8) T E20mMSRT 56.8 + 4.9 62.6 + 3.8 Ω
Caldwell and Peters
(2009)
Semi-professional
/England
13(24+4.4) T EMSFT 58 + 1.9 56 + 1.2* 58 + 1.6 Ω
59 + 2.3† 58 + 2.2
‡
Aziz et al. (2005) Elite/Singapore 41(25.7+3.9) T EBT 52.7 + 3.4 55.7 + 3.1 Ω
55.5 + 3.0 Ω
52.7 + 3.4 Ω
Edwards et al. (2003) Professional/England 12(26.2+3.3) T D 62.1 + 4.9 63.3 + 5.7

78

79
Table2. Contd
Study Level/Country n (years) S D/E
Training Period
ECP1 PPS EPS/BCP MCP ECP2
Silvestre et al. (2006) NCAAI/USA 25(19.9.+1.3) T EYo-Yo 59.8 + 3.3 60.9 + 3.4
Magal et al. (2009) NCAAIII/USA 12(20.+0.9) T D 51.05 + 5.97 54.64 + 4.9†
Sotiropoulos et al.
(2009)
Professional/Greek 28 (23.2+2.55) EG D 57.66 + 2.56 56.85 + 2.52*
20 (24.4.+2.97) CG D 58.08 + 2.60 54.52 + 2.80*
Values are mean + SD; S - sample; D/E – Direct (D) or estimated measurement (E) of VO2max; ECP1 – end of competition period; PPS – Prior
preseason; EPS/BCP - end preseason period/beginning competition period; MCP –Middle competition period; ECP2 – end of competition period 2;
NCAA - National Collegiate Athletic Association Division; T- team; CD – central defender; MF – midfielder; AT – attacker; EG – experimental group; CG
– control group; ↑ - increments in relation to PPS; E20mMSRT – estimated by performing the 20 meters Maximal Multistage shuttle run test (National
Coaching Foundation, Leeds, UK); EMSFT – estimate by performing Multistage Fitness Test AA1CD; National Coaching Foundation, Leeds, EBT-
estimated by performance of Beep” test (CD Australian Sports Commission); UK; EYo-Yo – estimated by performance of Yo-Yo endurance tests; x- not
specified; ≈ - approximately; *sig. dif from ECP1;
Ω sig. dif from PPS;
† sig. dif from EPS/BCP;
‡sig. dif from MCP;
α sig. dif from ECP2

80

81
Table3. Summary of studies examining changes in physiological parameters at sub maximal intensities through different periods of a
soccer season
Study Level/Country n (years) Parameter Training Period
ECP1 PPS EPS/BCP MCP ECP2
Mohr et al. (2002) Elite/Denmark 11(24.0+1.0) HRbpm/ Speed 10 km.h 132 + 4 140 + 5* 128 + 4 0.8Ω
HRbpm/ Speed 14 km.h 160 + 5 167 + 3* 158 + 4 0.8Ω
HRbpm/ Speed 17 km.h 176 + 3 181 + 3* 175 + 3Ω
Clark et al. (2008) Elite/England 42(25+3.5) AT%VO2max 80.5% ↑
81.05% 84.2%Ω ↑
81.3% 85.2%Ω ↓6%
‡
Casajus (2001) Elite/Spain 15(25.8+3.2) VATSpeed (km.h) 12.4 + 1.5 13.1 + 1.0†
VATHR(bpm) 164 + 6 168 + 6†
VATVO2 50.2 + 8.0 52.7 + 8.5
Dunbar (2002) 1st division/England 11 (ND) V[La]2mmol-1 14.3 + 1.4 14.5 + 1.2 14.8 + 1.5 13.9 + 1.7
V[La]3mmol-1 15.4 + 1.2 15.4 + 1.1 15.7 + 1.6 15.0 + 1.5
Kalapotharakos
et al. (2011)
Elite/Greek 12 (25+5) V[La]4mmol-1 12.3 + 0.9 13.6 + 0.5 Ω
13.6 + 0.4 Ω
%VO2max4mmol-1 75.5% 77.7% Ω
78.3% Ω
%HRmax4mmol-1 87.2% 89% Ω
89.1% Ω
Heller et al. (1992) Elite/Czech 12(23.5+3.9) VAT Speed (km.h) 14.2 + 0.6 13.9 + 0.2
VAT%HRmax 92.2% 90.8%
VAT%VO2max 79.4% 81.1%
Brady et al. (1997) Professional/
Scotland
19 LT Speed (km.h) 13.4 13.7 13.4 + 1.4
13 LT Speed (km.h) 12.8 13.6Ω 14.1
Ω 13.8
Ω

82

83
Table3. Contd
Study Level/Country n (years) Parameter Training Period
ECP1 PPS EPS/BCP MCP ECP2
Zoppi et al. (2006) 10
(18.2+0.8)
LTSpeed (km.h) 10.5 ± 1.9 13.8 ± 1.3Ω
Edwards et al. (2003) Professional/
England
12(26.2+3.3) LTVO2 51.47 + 4.2 53.49 + 3.5Ω
VATVO2 50.73+ 4.8 52.59 + 4.3 Ω
Magal et al. (2009) NCAAIII/USA 12(20+0.9) VAT%VO2max 78.25 + 8.46 79.61 + 9.52
Values are mean + SD; ECP1 – end of competition period; PPS – prior pre-season; EPS/BCP - end pre-season period/beginning competition period;
MCP –middle competition period; ECP2 – end of competition period 2; Czech – Czech republic; HRbpm/Speed 10 km.h – heart rate beats per minute
at speeds of 10/14/17 km.h; [La] Speed 10-14-17 km.h – blood lactate concentration at different speeds of 10/14/17 km.h; AT%VO2 – percentage of VO2max at
the lactate and ventilator threshold; VATSpeed (km.h) - velocity at ventilatory anaerobic threshold; VATHR(bpm) – heart rate (bpm) at the ventilatory anaerobic
threshold; VATVO2 – VO2(ml.kg-1
.min-1
) at the ventilatory anaerobic threshold; V[La] 2mmol.l-1 - velocity at a blood lactate concentration of 2 mmol.l-1
; V[La]
3mmol.l-1 - Velocity at a blood lactate concentration of 3 mmol.l-1
; ; V[La] 4mmol.l-1 - Velocity at a blood lactate concentration of 4 mmol.l-1
; VAT%HRmax –
percentage of maximum Heart Rate at the ventilatory anaerobic threshold; VAT%VO2max – percentage of VO2max at the ventilatory anaerobic threshold;
LT Speed (km.h) – speed at the lactate threshold; LTVO2 – oxygen consumption at the anaerobic threshold; ↑ - higher values than in PPS; ↓- 6% lower values
than in MCP; *sig. dif from ECP1;
Ω sig. dif from PPS;
† sig. dif from EPS/BCP;
‡ sig. dif from MCP;

84
85
Table4. Summary of studies examining changes in time to exhaustion (min) during maximal incremental lab tests through different
periods of a soccer season
Study Level/Country n (years) S Training Period
ECP1 PPS EPS/BCP MCP ECP2
Haritodinis et al.
(2004)
Elite/Greek 12 (25+5.3) T 14.6 + 0.7 16.4 + 0.6 Ω 15.9 + 0.8
Ω
Metaxas et al. (2006) Elite U-19/Greek 10(18.2+0.9) CD X ↑ Ω
↑ Ω
↑ Ω
12(18.1+1) MF X ↑ Ω
↑ Ω
↑ Ω
10(18.2+0.9) AT X ↑ Ω
↑ Ω
↑ Ω
Mohr et al. (2002) Elite/Denmark 11(24.0+1.0) T 5.67 + 0.18 5.45 + 0.17 * 5.91 + 0.12
*Ω
Edwards et al.(2003) Professional/
England
12(26.2+3.3) T 3.4 + 0.54 3.8 + 0.68 Ω
Arent et al. (2010) NCAAI /USA 12(19.5+1.5) T 16.44 + 1.9 17.32 +1.6 Ω
Values are mean + SD; S – sample; ECP1 – end of competition period; PPS – Prior pre-season; EPS/BCP - end pre-season period/beginning competition period; MCP
–Middle competition period; NCAA - National Collegiate Athletic Association Division; ECP2 – end of competition period 2; T- team: CD – central defender; MF –
midfielder; AT – attacker; x- not specified; ↑ - higher values than in PPS;*sig. dif from ECP1; Ω
sig. dif from PPS;

86

87
Table5. Summary of studies examining changes in high intensity intermittent exercise tests through different periods of a soccer season
Study Level/Country n (years) TEST
(m)
Training Period
ECP1 PPS MPS EPS/BCP MCP ECP2
Rebelo and Soares (1997) Elite/Portugal 11 IFT 1821 1904Ω 1992
Ω†
Krustrup, Mohr et al.
(2006)
1st league/Denmark 15 YYIR2 600+8 928+21
Ω 1033+45
Ω 964+39
Ω
1st/2
nd league/Denmark 20 873+43 780+35*
Iaia et al. (2009) Professional/Denmark 12 (22.4 + 3.7) YYIR2 742.4 1160+39Ω 1068+52
Ω
Silva et al. (2011) Elite/Portugal 18 (25.7+4.6) YYIE2 1120 2250Ω 1640
Ω†
Bradley et al. (2010) Elite/Danish 10 (ND- adult) 2732 2760
Elite U-19/English 15 (under 19) 2171+519 2411+593Ω 2560+574
Ω 2381+571
Ω
Krustrup et al. (2003) Elite/ ND 10 YYIR1 1760+59 ≈2160Ω 2211+70
Ω 2103+68
Ω
Nunez et al. (2008) Semi-professional/Spain 15 (28.2+3.4) Probst 2006+207 3480+368Ω 3620+454
Ω
Values are mean + SD; ECP1 - end of competition period; PPS – Prior preseason; MPS – Middle preparation period; EPS/BCP - end preseason period/beginning
competition period; MCP –Middle competition period; ECP2 – end of competition period; ND- not defined; IFT – intermittent field test (Bangsbo and Lindquist 1992);
YYIR2 – Yo-Yo intermittent recovery test level 2; YYIR1 - Yo-Yo intermittent recovery test level 1; YYIE2 - Yo-Yo intermitten endurance test level 2; ≈ - approximately;
*sig. dif from ECP1;
Ω sig. dif from PPS;
† sig. dif from EPS/BCP;

88

89
Table6. Summary of studies examining changes in jump ability (cm) through different periods of a soccer season
Study Level/Country n (years) Test(cm) Training Period
ECP1 PPS EPS/BCP MID ECP2
Clark et al. (2008) Elite/England 42(25+3.5) CMJ ≈ 48 ≈ 49.5
≈ 49 ≈ 52.5Ω ≈ 51
≈ 52 ≈ 52.5 ≈ 49.5
Silvestre et al. (2006) NCAAI/USA 25(19.9+1.3) CMJ 61.9+7.1 63.3+8.0
Mercer et al. (1997) Professional 15(24.7+3.8) CMJ 44.1+7.4 44.8+6.8
Casajus (2001) Elite/Spain 15(25.8+3.2) CMJ 41.4+2.7 40.8+2.7
Malliou et al. (2003) Professional/Greek 18(27.2+3.2) CMJ 39.2+3.7 39.1+4.3 38.5+4.4
Silva et al. (2011) Elite/Portugal 18(25.7+4.6) CMJ 42.4+4.04 44.8+4.5 Ω
42.84+4.4† 42.23+4.38
†
Caldwell and Peters (2009) Semi-professional/England 13(24+4.4) CMJWAS 57+4 54+3.2* 56+3.7Ω 57+3.4
Ω† 57+3.4
Ω†
Mercer et al. (1997) Professional 15(24.7+3.8) CMJWAS 54.6+8.5 52.7+8.2Ω
Casajus (2001) Elite/Spain 15(25.8+3.2) SJ 39.0+3.3 39.2+3.1
Malliou et al. (2003) Professional/ Greek 19(27.2+3.2) SJ 37.8+3.7 38.2+4.2 37.4+4.3
Thomas and Reilly (1979) Professional/England 31 (r: 18-29) SJ 55.6+7.1 54+6.3 54.3+7
Casajus (2001) Elite/Spain 15(25.8+3.2) SJWAS 47.8+2.9 46.7+2.8
Aziz et al. (2005) Elite/Singapore 41(25.7+3.9) SJWAS 55+5 59+5Ω 62+6
Ω † 62+6
Ω
Casajus (2001) Elite/Spain 15(25.8+3.2) CMJ15-s(watts-kg-1) 26.1+3.7 27.8+2.9
Clark et al. (2008) Elite/England 42(25+3.5) CMJ20-s (mean) ≈ 42 ≈ 43
≈ 43.5 ≈ 48.5 Ω
≈ 47.5
≈ 48.5 ≈ 49 ≈ 46
Thomas and Reilly (1979) Professional/England 31(r: 18-29) SBJ 211+17.4 225+11.6† 225+15.2
†
Values are mean + SD; ECP1 – end of competition period; PPS – Prior pre-season; EPS/BCP - end pre-season period/beginning competition period; MCP –Middle
competition period; ECP2 – end of competition period 2; r – ranging; ≈ - approximately; CMJ – countermovement jump; CMJWAS – countermovement jump with arm
swing; SJ – squat jump; SJWAS - Squat jump with arm swing; CMJ15s-20s – countermovement jump performed during 15-20 seconds; SBJ – standing broad jump; *sig.
dif. from ECP1; Ω sig. dif. from PPS;
†sig. dif. from EPS/BCP;

90

91
Table7. Summary of studies examining changes in sprint ability exercises through different periods of a soccer season
Study Level/Country N (years) Test Training Period
ECP1 PPS1 EPS/BCP1 MID1 ECP2 PPS2
Aziz et al. (2005) Elite/Singapore 41(25.7+3.9) T5(s) 1.04+0.06 1.03+0.06 1.02+0.07 1.00+0.05Ω
Silva et al. (2011) Elite/Portugal 18 (25.7+4.6) T5(s) 1.032±0.1 1.056 ±0.05 1.017±0.06 1.033 ± 0.07
Silvestre et al.
(2006)
NCAAI/USA 25(19.9.+1.3) T9.1(s) 1. 7+0.1 1.7+0.01
Magal et al. (2009) NCAAIII/USA 12(20.+0.9) T10(s) 2.03+0.15 1.96+0.11†
Caldwell and Peters
(2009)
Semi-professional/
England
13(24+4.4) T15(s) 2.43+0.9 2.51+0.1* 2.49+0.1 Ω
2.44+0.1Ω †
2.43+0.08Ω†
Aziz et al. (2005) Elite/Singapore 41(25.7+3.9) T20(s) 3.04+0.16 3.01+0.10 3.00+0.11 2.95+0.09 Ω
Magal et al. (2009) NCAAIII/USA 12(20.+0.9) T30(s) 4.72+0.26 4.51+0.24†
Silva, et al. (2011) Elite/Portugal 18 (25.7+4.6) T30(s) 4.16±0.18 4.217±0.15 4.14±0.14† 4.16 ± 0.17
Zoppi et al. (2006) Professional/Brazil 5(18.3+0.5) 30 m (m.s) 7.1±1.0 7.8±0.8
Silvestre et al.
(2006)
NCAAI/USA 25(19.9.+1.3) T36.5(s) 5+0.2 5+0.2
Magal et al. (2009) NCAAIII/USA 12(20.+0.9) T40(s) 5.86+0.52 5.79+0.31
Ostojic (2003) Elite/Serbia 30(23.5±3.1) T50(s) 7.5±0.6 7.3±0.6Ω 7.2±0.5
Ω 7.1±0.5
Ω† 7.6±0.5
Ω†‡ α
Values are mean + SD; ECP1 – end of competition period; PPS – Prior pre-season; EPS/BCP - end pre-season period/beginning competition period; MCP –Middle
competition period; ECP2 – end of competition period 2; T5-50 – 5 to 50 meters sprint time; *sig. dif from ECP1;
Ω sig. dif from PPS1;
† sig. dif from EPS/BCP1;
‡sig. dif
from MCP1; α sig. dif from ECP2;

92

93
Table8. Summary of studies examining change of direction speed through different periods of a soccer season
Study Level/Country n (years) COD Test Training Period
ECP1 PPS EPS/BCP MID ECP2
Mercer et al. (1997) Amateurs 15(24.7+3.8) Illinois Agility run 16.5+0.4 16+0.4Ω
Caldwell and Peters
(2009)
Semiprofessional/
England 13(24+4.4)
Illinois Agility run 14.73+0.37 14.97+0.38* 14.76+0.38Ω 14.68+0.34
Ω 14.63+0.37
Ω
Silva et al.(2011) Elite/Portugal 18 (25.7+4.6) T-test Agility run 8.71±0.33 8.74±0.36 8.41±0.27Ω †
8.49±0.27Ω †
Magal et al. (2009) NCAAIII/USA 12(20.+0.9) pro-agility test (5-10-5) 4.96+0.19 4.80+0.33
Values are mean + SD; ECP1 – end of competition period; PPS – Prior pre-season; EPS/BCP - end pre-season period/beginning competition period; MCP –Middle
competition period; ECP2 – end of competition period 2; *sig. dif from ECP1;
Ω sig. dif from PPS;
† sig. dif from EPS/BCP1

94
95
Table 9. Summary of studies examining changes in strength parameters through different periods of a soccer season
Study Level/
Country
n(years) S Test Training Period
ECP1 PPS EPS/BCP MID ECP2
Mercer et al.
(1997)
Professional/
ND
15(24.7+3.8) T IS (1.05rad/s;Nm) KER 226+28 223+23
KEL 222+21 218+32
KFR 139+26 139+24
KFL 145+35 139+32
H/Qright 61+8 62+10
H/Qleft 65+13 63+09
BDext 2+09 3+10
BDflex 4+28 0+18
Silva et al. (2011) Elite/Portugal 18 (25.7+4.6) IS (90º/s; Nm) KED 238.9 ±39.8 240.7 ± 51.4 239.1 ± 45 243.9 ± 52.8
KEND 241.7 ± 39 241.3 ± 47 241.8 ± 40 243.8 ± 53.3
KFD 131.22 ± 22 131.58 ± 21.9 135.36 ±25.1 138.03 ±24.2
KFND 128.9 ±19 128.561 ±23.4 133.01 ± 20.1 133.86 ± 23.6
H/QD 54.91 ± 6 54.65± 5 56.6 ± 8.5 Ω*
56.4 ± 7.3 Ω†
H/QND 53.4 ± 4.9 53.2 ± 5.2 55.02 ± 5.4 Ω*
54.9± 6.1 Ω†
BDext 5.76 ± 5.36 5.57 ± 5.42 5.70 ± 4.95 8.54 ± 4.91
BDflex 6.64 ± 6.3 5.59 ± 4.7 7.66 ± 5.4 7.6 ± 5.8
Malliou et al.
(2003)
Professional/
Greek
19(27.2+3.2) T IS(60º/s;Nm) KER 233.8+26.9 234+30 229+22
KEL 230.9+25 227+28 222+33
IS(180º/s;Nm) KER 155.4+16 150+13 157+12
KEL 162+16 155.9+18 157.8+15

96

97
Table9. Contd
Study Level/
Country
n(years) S Test Training Period
ECP1 PPS EPS/BCP MID ECP2
Kraemer et al.
(2004)
NCAAI/USA 11(19.91+30.9) S IS(1.05rad/s;Nm) KE 240.31+ 11.12 214.11+9.08† 211.48 +8.43†
11 S KF 152 + 9.27** 136 + 8.21** 139 + 6.85
14(18.71+0.9) NS KE 227.40+10.60 213.12+11.03 204.73+7.40†
14 NS KF 126.67+6.65 119.16+7.23 131.55 + 4.78
Values are mean + SD; S - sample; ECP1 – end of competition period; PPS – Prior pre-season; EPS/BCP - end pre-season period/beginning
competition period; MCP –Middle competition period; ECP2 – end of competition period 2; T- team; S- starter players; NS- non-starter players; IS –
isokinetic dynamometer; KERight- Peak Torque Knee extensor right leg; KELeft - Peak Torque Knee extensor left leg; KED- Peak Torque Knee
extensor dominant leg; KEND- Peak Torque Knee extensor non-dominant leg; KFRight- Peak Torque Knee flexor right leg; KFLeft - Peak Torque
Knee flexor left leg; KFD - Peak Torque Knee flexor dominant leg; KFND - Peak Torque Knee flexor non-dominant leg; H/Qright- Hamstrings
quadriceps strength ratio right leg; H/Qleft- Hamstrings quadriceps strength ratio left leg; BDext – bilateral strength differents in extension; BDflex –
bilateral strength differents in flexion; RHG – right hand grip strength; LHG – Left hand grip strength; ; Ω sig. dif from PPS;
† sig. different from EPS/BCP;
** sig. dif. Between groups

98

99
Review II
TITLE: Strength and muscle power training in soccer
Authors:
João R. Silva1,4, José Magalhães2,3, António Ascensão2,3, António Rebelo1,4.
Affiliations:
1 University of Porto, Faculty of Sport, Department of Soccer, Porto, Portugal
2 University of Porto, Faculty of Sport, Department of Sports Biology, Porto,
Portugal
3 Research Center in Physical Activity, Health and Leisure (CIAFEL)
4 Center of Research, Education, Innovation and Intervention in Sport (CIFI2D)

100
101
Contents
Abstract
1. Strength and muscle power
2. Strength and muscle power training in soccer
2.1 Physiological adaptations
2.2 Adaptations in sport specific efforts
2.2.1 Sprint ability
2.2.2 Jump ability
2.2.3 Change of direction ability
2.2.4 Sport specific skills
2.3 Comparing different modes of intervention
3. Strength and endurance training
3.1 Strength and endurance training in soccer
4. References

102
Abstract
Data regarding the activity pattern of soccer players and soccer’s physiological
demands have shown that high-level physical performance requires a well-
developed neuromuscular system in order to cope with several essential power-
based efforts during games and trainings, i.e., jumping, accelerations,
decelerations and changes of direction while sprinting. Neuromuscular
improvements may be of relevant importance to increase players’ performance
during the game and particularly during the most intense periods. Research with
different athletic populations have shown that improvements at the
neuromuscular level not only result in an enhanced neuromuscular performance
as well as in an optimized short and long term endurance capacity. Although
research is scarce, coaches, medical staffs and players have contributed to an
increase in the number of investigations in the field of strength and muscle
power interventions in soccer. This progress in scientific knowledge has
generally shown that distinct strength and muscle power training programs can
induce significant performance improvements in a wide range of non-specific
and soccer specific-neuromuscular parameters. Moreover, it has been shown
that the training of neuromuscular function and soccer specific endurance can
be combined and advised since it can promote, among other factors,
improvements in non-specific and soccer specific-endurance and
neuromuscular parameters.
1. Strength and muscle power training
Strength training has become an integral component of the physical preparation
for enhancement of sports performance (Young, 2006). While strength is
defined as the integrated result of several force-producing muscles performing
maximally, either isometrically or dynamically during a single voluntary effort of
a defined task (Hoff & Helgerud, 2004), power is a product of force and the
inverse of time, i.e., the ability to produce as much force as possible in the
103
shortest possible time (Hoff & Helgerud, 2004). According with Schmidtbleicher
(1992), maximal muscle strength and power are not distinct entities, as power
performance is influenced by training methods that maximize both strength and
stretch-shorten cycle activity (SSC).
Scientific literature examining the mechanisms underlying strength adaptations
effects is marked largely by references to the role of muscle mass (Gabriel et
al., 2006). The strength and performance improvements as result of
hypertrophy programs are usually related to an increase in cross-sectional area
of the muscle. However, increases in muscular strength without noticeable
hypertrophy have served as the first line of evidence for the neural involvement
in acquisition of muscular strength (Gabriel et al., 2006). As such, training
programs targeting neural adaptations focus the increase in the capacity of the
neuromuscular system to produce force and improve performance by the
promotion of physiological adaptations related to increases in motor unit
recruitment and in rate coding (Gabriel et al., 2006). Although both muscle
hypertrophy and neural adaptations are the basis for development of muscle
strength (Toigo & Boutellier, 2006), their respective mechanisms of adaptation
in the neuromuscular system are distinct (Hakkinen et al., 2003). In fact “more
strength,” i.e., the adaptational effect, did not necessarily result of increased
muscle mass, since several distinct adaptations can lead to the same effect
(Toigo & Boutellier, 2006). Moreover, the trainable effects of explosive-type
strength training causing enhanced explosive force production, result primarily
by the increased neural activation of the trained muscles, i.e., probably related
to increases of number and/or firing frequencies of active motor units as well as
of changes in the recruitment pattern of the motor units (Hakkinen et al., 1985).
Also, gains in explosive muscle strength after heavy-resistance strength training
programs have been attributed to enhanced contractile rate of force
development, impulse, and efferent neuromuscular drive of human skeletal
muscle (Aagaard et al., 2002).
One of the central goals of strength training in a high competition sport, in this
specific case in soccer, is related to the capacity of improving players’ specific-
relevant athletic activities that are inherent to their sport. With this concern,

104
methodologies that consist of a combination of weight training, plyometric
training, and sport-specific force-based actions, have being used. This type of
methodological interventions have been applied with the belief that these
modes of strength training allow optimal power development and transfer of
training adaptations to athletic activity (Ebben & Watts, 1998). In fact, soccer
entails a varied range of actions, involving breaking and propulsive forces and
distinct contraction modes and velocities that require all force-velocity potential
of neuromuscular system. One possible advantage of the adoption of training
modes that comprise stretch-shorten cycle activity in soccer, among other
factors, is related to adaptation to the eccentric component of the SSC actions
present in a wide range of soccer-explosive specific efforts. This type of
contraction is usually associated to muscle damage which may delay recovery
of the condition player`s capacity to successfully perform during periods of
heavy match commitments (Ascensao et al., 2008; Ebbeling & Clarkson, 1989;
Ispirlidis et al., 2008; Magalhaes et al., 2010; Reilly et al., 2008; Silva et al.,
2011b; Twist & Eston, 2005). This would imply that muscles adapt to training
regimes that engage them in stretch shortening cycles and will be less impaired
with repeated exposure (Reilly et al., 2008).
2. Strength and muscle power training in soccer
The effects of different modes of strength training in soccer players has been
matter of increased research in the last decade. The effects of combined high-
intensity strength training (S) and plyometric training (S+P; 4 sets x 5RM squats
+ 10-min rest + 4 stets x 8 rep CMJ) (Ronnestad et al., 2008), combined S and
sprint training (S+SP; e.g. 4 sets x 5RM squats + 10-min rest + 4 x 40m
sprints)(Kotzamanidis et al., 2005) and complex strength training (CT) programs
(Maio Alves et al., 2010; Manolopoulos et al., 2006; Mujika et al., 2009) have
been investigated. Although some similarity between modes of strength and
muscle power training exist (combined weight and plyometric or sprint training
vs. complex training), there are also important differences. In this review, as
early defined by Ebben and Watts (1998), complex training refers to training

105
protocols comprising the alternation of biomechanically comparable exercises in
the same workout and sport specific drills (e.g., 6 rep. of calf extension exercise
at 90% 1RM + 5 sec. rest + 8 vertical jumps or /+ 5sec. rest + 3 high ball
header’s). Moreover, the effect of CT involving explosive exercises (plyometric)
and soccer specific skills (soccer kicking), with or without resistive loads (e.g.,
kicking against resistance imposed by rubber bands) in biomechanical,
neuromuscular and in performance parameters, has been analysed
(Manolopoulos et al., 2006). These methods have been used because of a
belief that favours specific power development, due to continued neural and
morphological adaptations typically associated with advanced training (Ebben &
Watts, 1998). Also, the effect of other strength training methodologies, such as
electrostimulation training (EMS), in soccer players’ physical fitness has been
analyzed (Billot et al., 2010).
The short-term impact of different strength and/or muscle power training modes,
H vs. S (Bogdanis et al., 2009), S vs. S+P (Ronnestad et al., 2008), S vs. S+SP
(Kotzamanidis et al., 2005), CT vs. SP (Mujika et al., 2009) has also been
matter of research. Moreover, the effects of plyometric training performed on
different ground surfaces (grass vs. sand), and of different plyometric training
techniques (Drop jumps vs. CMJ) has been also investigated (Impellizzeri et al.,
2008; Sedano et al., 2011; Thomas et al., 2009).
These training programs primarily have analysed the effects of different short-
term protocols, implemented in distinct season time-lines and with different
weekly volumes. In this matter, research has been developed in preseason
(Bogdanis et al., 2009; Impellizzeri et al., 2008; Maio Alves et al., 2010;
Ronnestad et al., 2008) and in-season periods (Billot et al., 2010; Chelly et al.,
2009; Gorostiaga et al., 2004; Mujika et al., 2009; Sedano et al., 2011; Thomas
et al., 2009). Also, training programs examining soccer players’ functional and
muscle structure (e.g., myosin heavy chain composition) adaptations to high
intensity strength training performed in the isokinetic contraction mode have
also been implemented in the off-season period (Andersen et al., 1994). The
length of the muscle strength and/or power training program ranged from 4-wks
(Impellizzeri et al., 2008), 5wks (Billot et al., 2010), 6-wks (Bogdanis et al.,

106
2009; Maio Alves et al., 2010; Thomas et al., 2009), 7-wks (Mujika et al., 2009;
Ronnestad et al., 2008), 8-wks (Chelly et al., 2009), 9-wks (Kotzamanidis et al.,
2005), 10 wks (Manolopoulos et al., 2006; Sedano et al., 2011), 11-wks
(Gorostiaga et al., 2004) to 12-wks of intervention (Aagaard et al., 1993; Trolle
et al., 1993). These studies frequently examined the training-induced
performance effects of 2 (Chelly et al., 2009; Gorostiaga et al., 2004;
Kotzamanidis et al., 2005; Maio Alves et al., 2010; Ronnestad et al., 2008;
Ronnestad et al., 2011; Thomas et al., 2009) to 3 sessions (Billot et al., 2010;
Bogdanis et al., 2009; Impellizzeri et al., 2008; Manolopoulos et al., 2006;
Sedano et al., 2011) of strength and muscle power training per week.
Nevertheless, the short-term effect of a lower weekly volume programs (1
session per week) (Maio Alves et al., 2010; Mujika et al., 2009; Ronnestad et
al., 2011) and the training-induced adaptations of different weekly training
volumes (1 vs. 2 sessions per week) has been analyzed (Maio Alves et al.,
2010). In addition, the effects of the training frequency ( one session per week
vs. one session every second week) on the maintenance of the strength and
performance pre-season gains throughout the in-season period has also been
examined (Ronnestad et al., 2011).
2.1 Physiological adaptations
Different strength-related methodological interventions are able to induce
adaptations in distinct qualities of players’ neuromuscular systems (table1).
Enhanced dynamic (Aagaard et al., 1993; Andersen et al., 1994; Billot et al.,
2010; Bogdanis et al., 2009; Chelly et al., 2009; Kotzamanidis et al., 2005;
Ronnestad et al., 2008; Ronnestad et al., 2011; Trolle et al., 1993) and static
maximum force production (Aagaard et al., 1993; Billot et al., 2010; Trolle et al.,
1993) and as well as increased muscle power outputs, during different physical
attributes, have been reported (Aagaard et al., 1993; Andersen et al., 1994;
Bogdanis et al., 2009; Chelly et al., 2009; Gorostiaga et al., 2004; Ronnestad et
al., 2008; Ronnestad et al., 2011; Trolle et al., 1993). Increments in one
repetition maximum (1RM) in isoinertial modes as the half-squat exercise

107
(Bogdanis et al., 2009; Bogdanis et al., 2011; Chelly et al., 2009; Kotzamanidis
et al., 2005; Ronnestad et al., 2008; Ronnestad et al., 2011), in hamstrings leg
curls, and in the one leg step up bench exercises (Kotzamanidis et al., 2005)
were analysed. Moreover, increments in maximal isometric voluntary
contraction (MIVC) in the leg press task after CT training (Manolopoulos et al.,
2006) and in knee extension task after electrostimulation (Billot et al., 2010) and
isokinetic training (Aagaard et al., 1993; Trolle et al., 1993) were also examined.
Improvements in 1RM per lean leg volume (LLV) 1RM/LLV after high-intensity
(S) and hypertrophy (H) strength training (Bogdanis et al., 2009) and in the
relative force (maximum force divided per body weight) after CT have been
reported (Manolopoulos et al., 2006).
According to Harris et al., (2007), training studies should use a specific
isoenertial loading scheme, and test protocols should assess performance over
the force-velocity continuum to gain a greater understanding of the effect of load
on muscular function. Moreover, certain neuromuscular-related qualities such
as impulse, rate of force development, and explosive strength can predict
athletic performance better and hence its development should be targeted
(Harris et al., 2007). One such muscle strength and power training-induced
adaptation is an observed increase (moving up) in the force-velocity
relationships and mechanical parabolic curves between power and velocity after
high-intensity training programs, both in the type of isoinertial (Chelly et al.,
2009) and isokinetic exercises (Aagaard et al., 1993). However, contradictory
results were observed when (Bogdanis et al., 2009) applying the same
methodology for analysis alterations in force-velocity relationships (cycling force
velocity tests in a cycle ergometer against resistive loads ranging from 2% to
10% of body mass), after H or S training. In fact, only maximal force increased,
while maximal cycling speed corresponding to zero load (V0) and the rate at
which the highest value of power is achieved (Vopt) remained unchanged
(Bogdanis et al., 2009). Nevertheless, Ronnestad et al., (2008) and Gorostiaga
et al., (2004) observe increases in force-velocity curve after high-intensity
strength training and/or explosive-type strength training, respectively. In
Ronnestad et al., (2008), the results regarding the squat jump tests with loads

108
of 20, 35 and 50 Kg were used for analysis of the effect of S and S+P programs
on force-velocity relationships. When the researchers pooled the groups to
increase the statistical power, increases in all measures of peak power were
observed. It seems that high-intensity strength training significantly increases
performance in professional soccer players at both the high force end (observed
increases in 1RM and sprint acceleration) and the high velocity end
(improvements analyzed in peak sprint velocity and the 4 bounce tests (4BT)),
but only as long as the subjects perform concurrent plyometric and explosive
exercises during their soccer sessions (Ronnestad et al., 2008). However,
Gorostiaga et al., (2004) using the CMJ performance with loads of 20, 30, 40,
50, 60 and 70 kg, observed that increases were primarily observed in the low-
force portions of the load vertical jumping weight curve (CMJ, CMJ20kg; CMJ30kg)
after low-frequency, low-intensity explosive-type strength training. The analysis
of load-vertical jumping height relationships have been shown to characterize
the force-velocity relationship in CMJ jumps (Viitasalo, 1985).
Improvements in explosive strength and in rate of force development evaluated
during isometric leg press after CT were observed (Manolopoulos et al., 2006).
Also, after soccer-specific strength and skill training (soccer kick) interventions,
an increase in electromyography (EMG) activity of certain muscles (vastus
medialis) involved in the task were analyzed (Manolopoulos et al., 2006).
2.2 Adaptations in sport specific efforts
In soccer, as in other sports, the effectiveness of a strength/power training
program aims to translate into improvement in the sport-specific actions that
require good levels of muscle strength and power. In fact, even though low to
medium intensity running are the predominant activities during the match,
power-based efforts such as sprints, jumps, duels, and kicking, which are
mainly dependent on maximal strength and anaerobic power of the
neuromuscular system, are essential skills to successfully perform in soccer
(Cometti et al., 2001). In fact, a high degree of stress is set on soccer players
neuromuscular systems in order to cope with this essential power-based efforts

109
required during training and competition. In this matter, different strength-related
training interventions have shown to work as a powerful training stimulus in the
promotion of adaptations through a large range of explosive sport specific skills
(e.g., jump, COD; table 1) (Bogdanis et al., 2009; Chelly et al., 2009; Gorostiaga
et al., 2004; Impellizzeri et al., 2008; Kotzamanidis et al., 2005; Maio Alves et
al., 2010; Mujika et al., 2009; Ronnestad et al., 2008; Ronnestad et al., 2011;
Sedano et al., 2011) and explosive soccer-specific skills (soccer kick) (Billot et
al., 2010; Sedano et al., 2011). These improvements were confirmed in
observations of a positive transfer into the acceleration, maximum speed, COD,
diverse forms of jump ability exercises, and in the eccentric component of the
stretch shortening cycle of players. As an example, in Ronnestad et al., (2008)
although the performance of high-intensity strength (S) and S plus Plyometric
(P) training did not reveal improvements in certain functional parameters, when
the groups were pooled the results revealed that from a large diversity of
functional parameters, only CMJ performance did not improve after training.
2.3.1 Sprint Ability
Regarding adaptations in sprint qualities (e.g., acceleration and maximal
speed, table 1), improvements in 5-m (Chelly et al., 2009; Maio Alves et al.,
2010), 10-m (Bogdanis et al., 2009; Impellizzeri et al., 2008; Manolopoulos et
al., 2006; Sedano et al., 2011), 15-m (Maio Alves et al., 2010; Mujika et al.,
2009), 20-m (Impellizzeri et al., 2008), 30-m (Kotzamanidis et al., 2005), 40-m
(Bogdanis et al., 2009; Ronnestad et al., 2008; Ronnestad et al., 2011) and
splits time from 30-m to 40-m (Ronnestad et al., 2008) were reported after
different training interventions. Others did not observe improvements in 5-m
(Gorostiaga et al., 2004; Thomas et al., 2009), 10-m (Billot et al., 2010; Thomas
et al., 2009), 15-m (Gorostiaga et al., 2004; Thomas et al., 2009), 20-m
(Thomas et al., 2009) and 30-m sprint performance (Kotzamanidis et al., 2005).
The observed change differences in sprint performance between studies may
be related with a wide range of circumstances as player training status, players’
background and/or training modes. In the training program applied in the study
110
of Thomas et al,. (2009) players performed solely one type of plyometric
exercise, while in the study of Billot et al., (2010) players were just submitted to
EMS training, which has an evident lower level of specificity. As such, these
previous limitations existent in the interventional protocols may have
contributed, at least in part, to a lack of transfer of training adaptations to
dynamic and complex activities, that require the coordination and force
production of different body muscles as is the case of sprint performance.
2.3.2. Jump ability
Research focusing on the training-effects of different strength-related
interventions, reported an enhancement in jump performance (table 1).
Improvements in squat jump (SJ) (Chelly et al., 2009; Impellizzeri et al., 2008;
Kotzamanidis et al., 2005; Maio Alves et al., 2010; Ronnestad et al., 2011), 4-
bounce test (4BT)(Ronnestad et al., 2008), 5- jump test (5-JT)(Chelly et al.,
2009), countermovement jump test (CMJ)(Bogdanis et al., 2009; Gorostiaga et
al., 2004; Impellizzeri et al., 2008; Kotzamanidis et al., 2005; Sedano et al.,
2011; Thomas et al., 2009), in CMJ with free arms (Sedano et al., 2011) and in
eccentric utilization ratio (CMJ/SJ)(Impellizzeri et al., 2008) have been
observed. Nevertheless, contradictory reports regarding improvements in SJ
after plyometric training (Sedano et al., 2011) and in CMJ performance after
high-intensity strength protocols (Chelly et al., 2009; Ronnestad et al., 2011)
can be found in literature. Also, no significant increments in CMJ were observed
after CT involving workouts with high (Maio Alves et al., 2010) or low loads
(Mujika et al., 2009) and in drop jumps from a 40 cm height (DJ40)(Kotzamanidis
et al., 2005) after S and S+Sp.
2.3.3 Change of direction speed (COD)
According to the literature, it is difficult to discern which force/power qualities
(e.g., horizontal and lateral) and technique factors influence event- or sport-
specific COD ability (Brughelli et al., 2008). Regarding training-induced
111
adaptations in the COD speed, Bogdanis et al.,(2009) observed that both
hypertrophy (H) and high-intensity (S) modes of strength training were effective
in increasing COD evaluated through different COD tests (Table 1).
Nevertheless, the improvements in COD that were evaluated by the 505 agility
test performance after different plyometric training techniques (Thomas et al.,
2009) were not found after CT (Maio Alves et al., 2010). Also, in a study of
Mujika et al., (2009) where players perform CT, no improvements in COD
evaluated by agility 15-m test were observed. The differences in results can be
related with diverse factors, such as the period of the season when the
intervention was carried out, the structure of the training intervention, soccer
players’ previous training status and as already mentioned, the players’ training
background. In fact, as an example, the study of Maio Alves et al.,(2010) was
implemented in preseason and the research of Thomas et al.,(2009) was
carried out during in season. Consequently, the accumulated effect of COD
actions performed during trainings and games may influence the results. In this
matter, recent results observed that COD has a tendency to improve towards
the soccer competition period in professional players (Silva et al., 2011b). Also,
although from the same age groups, the differences in players’ competitive level
(elite vs. semi-professional) between former studies should not be ignored.
Moreover, the fact that Mujika et al.,(2009) did not examine COD improvements
after in-season CT may be related to only six sessions of CT being performed in
a seven week period. This fact may suggest that higher training volumes may
be necessary to induce adaptations in COD.
2.3.4 Sport specific skills
One of the most important indicators of a successful soccer kick is the speed of
the ball. Studies involving amateur soccer players observed that CT
(Manolopoulos et al., 2006) and EMS training (Billot et al., 2010) resulted in
increases in ball speed with (Billot et al., 2010; Manolopoulos et al., 2006) and
without run up (table 1) (Billot et al., 2010). In addition, elite under 19 players
performing plyometric training improve ball speed with the dominant and non-
112
dominant leg (Sedano et al., 2011). Nevertheless, other studies involving elite
soccer players, performing different modes of strength training (high intensity or
low intensity isokinetic strength training or functional training-loaded kicking
movements without the ball) did not result in significant improvements in ball
speed (Aagaard et al., 1993; Trolle et al., 1993). In fact, although some groups
increased certain strength parameters, these did not result in a positive
transference to consecutive gains in ball speed.
2.4 Comparing different modes of muscle strength and power
interventions
Recent research has examined physiological and performance alterations
resulting from distinct modes of strength training in players of the same
standard (table 1). Bogdanis et al.,(2009) analyzed the training effects of H and
S programs on speed, muscle mass, force and power production. Data from this
research (Bogdanis et al., 2009) have shown that significant increases in
muscle mass of the lower limbs only occurred in H group. One the other hand,
S type of strength training was more effective in increase maximum strength by
lean leg volume and the functional capacity of soccer players in sprint and COD
tests (Bogdanis et al., 2009). These improvements were not associated with
increases in muscle volume and were attributed to neural adaptations, i.e.,
changes in the pattern of motor unit recruitment and increase rate coding
(Bogdanis et al., 2009; Gabriel et al., 2006). In another study, Bogdanis et al.,
(2011) examined alterations in the total work over a repeated cycle ergometer
sprint test (10 x 6-sec sprint with 24-sec passive recovery) after H and S
training. Data reveal that even though both groups improved test performance,
the S group had a significantly greater improvement in total work during the
second half (sprint 6-10; 8.9 ± 2.6%) compared with the first half of the sprint
test (sprint1-5; 3.2 ± 1.7%). The distinct results observed after H and S training
may highlight that S training results in an high capability to sustain fatigue
during a repeated sprint test (Bogdanis et al., 2011). In addition, mean power
output (MPO) expressed per lean leg volume (LLV) was better maintained

113
during the last 6 sprints post-training only in the S group and there was no
change in MPO per LLV in the H-group over the 10 sprints (Bogdanis et al.,
2011). According to these results, the researchers concluded that training
protocols targeting neural adaptations may be superior to hypertrophy
protocols, not only due to increased strength without changes in muscle mass,
but above all because it appears to promote higher adaptations in soccer-
specific field tests (Bogdanis et al., 2009; Bogdanis et al., 2011) and increase
fatigue resistance during repeated sprint exercise (Bogdanis et al., 2011).
The analysis of the impact of high vs. low intensity isokinetic strength vs.
functional strength showed that the players who performed a high load, low
angular velocity program had a higher improvement in maximal isometric and
isokinetic strength and also in peak power outputs measured at different knee
angles and angular velocities (Aagaard et al., 1993; Trolle et al., 1993). Even
though the increases in dynamic muscle strength were generally observed at
the specific velocities used in the training programs, the high load/low velocity
group also improved muscle force and power at high knee extension velocities
(Aagaard et al., 1993; Trolle et al., 1993). According the researchers, the
greater training adaptations in a wide range of velocities, examined in the high
load/low velocity strength training program, may be hypothetically related to
changes in neural and morphological factors (e.g., increases in rate of force
development, increases in muscle mass and/or increases in angle of fiber
pennation).
The training-induced adaptations of high-intensity strength training (S) vs. S
plus plyometric (P) training programs (S+P)(Ronnestad et al., 2008) and S vs. S
plus sprint training (SP) programs (S+SP)(Kotzamanidis et al., 2005) were also
examined. In the study of Ronnestad et al., (2008) although no significant
differences between groups were observed, the group of players who
performed S+P improved in a higher range of functional parameters.
Kotzamanidis et al.,(2005) observed that only soccer players who performed
sprint training in addition to the strength training (S+SP) improved jump and
sprint performance. As such, it seems that combining heavy and light training
schemes may be an effective mode for improving muscular function and may be

114
particularly useful where force application is required in a range of functional
tasks (Harris et al., 2007). Moreover, data suggest that combining resistance-
and speed-training programs and resistance and plyometric training programs
in the same session seems to be more effective than the resistance training
program per se. Thus, strength training designs should focus both the
intramuscular and intermuscular aspects of athletic performance. In fact,
hypertrophy and general power exercises can enhance sports performance, but
optimal transfer from training also requires a specific exercise programs
(Young, 2006). Also, as observed by Mujika et al., (2009) there is evidence that
a low volume of combined forms of strength/power training is more effective in
improving sprint performance (15-m sprint time) than the sole performance of
lower volumes of sprint training.
As already mentioned, soccer players are usually involved in weekly matches of
the national leagues and very often in international commitments, limiting the
time for fitness training. Maio Alves et al.,(2010) examined the effect of the
performance of higher (2 sessions peer week) and lower (1 session peer week)
weekly volume of CT in sprint, jump and COD ability of high-level junior players.
The authors observed that there were not significant differences between
groups, even though higher percentages of improvements were analyzed in the
group subject to a lower weekly volume. Recently, Ronnestad et al., (2011)
examined that the performance of one high-intensity strength training session
per week during the first 12-wks of in-season period was enough to maintain the
initial pre-season (two wks sessions throughout 10 wks ) gain in strength, jump
and sprint performance. On the other hand, a lower in-season volume (one
session each second week) only maintained the initial gains in jump
performance, i.e., strength and sprint performance decrease (Ronnestad et al.,
2011).
There is also evidence that adaptations resulting from explosive strength
training in the mode of plyometric training can differ as result of the ground
surface used during training (sand vs. grass) (Impellizzeri et al., 2008). In this
matter, Impellizzeri et al.,(2008) observed that plyometric training performed on
grass produced greater effects in CMJ and in the eccentric utilization ratio

115
CMJ/SJ than when performed on sand. On the other hand, a trend towards
higher adaptations was observed in SJ in the group that performed the training
program on sand. Additionally, plyometric training performed on sand surfaces
was shown to induce lower levels of muscle soreness than when performed on
grass. Soccer players are affected by fatigue during and after the game
(Bangsbo et al., 2007; Krustrup et al., 2011; Mohr et al., 2005; Rampinini et al.,
2011; Reilly et al., 2008). Moreover, the observed reduction in soccer players’
ability to produce force towards the end of the match and in the periods
subsequent to the match (Andersson et al., 2008; Ascensao et al., 2008; Greig,
2008; Ispirlidis et al., 2008; Krustrup et al., 2011; Magalhaes et al., 2010;
Rampinini et al., 2011; Rebelo et al., 1998) follows the increase in some indirect
markers of muscle damage (Andersson et al., 2008; Ascensao et al., 2011;
Ascensao et al., 2008; Ispirlidis et al., 2008; Magalhaes et al., 2010) and are
also characterized by longer periods of muscle soreness (Ascensao et al.,
2011; Ascensao et al., 2008; Ispirlidis et al., 2008; Magalhaes et al., 2010;
Thompson et al., 1999). In view of that, it may be expected that during periods
in which players are submitted to high volumes and intensity of training (e.g.,
preseason) as well as in periods in which athletes who recover from injury and
are trying to regain physical capacity, this kind of surface (sand) might be a
good alternative for the execution of plyometric programs. In fact, in addition to
improving neuromuscular capabilities, it has shown to produce lower levels of
muscle soreness (Impellizzeri et al., 2008).
3. Strength and endurance training
There is consensus in the literature that soccer players’ performance is
intimately associated to the efficiency of different energy-related systems. In
fact, the preparation for elite soccer competition requires that athletes develop
high levels of physical fitness. With this aim, soccer players perform intense
training programs with multiple goals of increasing strength, power, speed,
speed endurance, agility, aerobic fitness and game skills. Nevertheless,
contradictory results have been examined in different athletic populations
concerning the effectiveness of the simultaneous stress of different

116
physiological systems during training cycles in order to increase neuromuscular
and endurance-related parameters (Docherty & Sporer, 2000; Gorostiaga et al.,
2004; Hakkinen et al., 2003; Kraemer et al., 1995; Lopez-Segovia et al., 2010;
Nunez et al., 2008; Wong et al., 2010). According to Hakkinen et al., (2003) the
physiological stimuli directed at skeletal muscles as a result of strength training
and endurance training is divergent in nature. The compatibility between
endurance training and strength training may depend upon the methodology
applied for the improvement of strength and endurance (Docherty & Sporer,
2000; Hakkinen et al., 2003). Thus, the magnitude of the observed antagonism
as result of combined strength and endurance training may differ based on the
nature of the resistance training program and the target goal (Docherty &
Sporer, 2000; Hakkinen et al., 2003). In fact, when the modes of strength and
endurance training focus on the same location of adaptation (e.g., peripheral
adaptations), the muscle is required to adapt in distinctly different physiological
and anatomical ways which may reduce the adaptation of one of the systems
(Docherty & Sporer, 2000). In addition, the volume and frequency of training
may also influence the amount of incompatibility observed (Hakkinen et al.,
2003). Some authors have proposed a hypothesis to explain the interference
phenomenon or incapability of achieve/maintain higher levels of strength when
strength and endurance are simultaneously trained. This hypothesis suggests
that combined training leads to excessive fatigue, increment in catabolic
environment, differences in motor unit recruitment patterns, possible shift in
fiber type and conflict in the direction of adaptation pathways required to the
muscle (Docherty & Sporer, 2000; Hakkinen et al., 2003; Kraemer et al., 1995).
3.1 Strength and endurance training in soccer
Data from different studies highlight that enhancements in neuromuscular
function can be a determinant in improving short and long-term endurance
capacity in different athletic populations (Aagaard & Andersen, 2010; Nummela
et al., 2006; Paavolainen et al., 1999a; Paavolainen et al., 1999b; Saunders et
al., 2006). Moreover, soccer players with greater neuromuscular capabilities

117
were shown to perform at high levels in certain game-related physical
parameters (Silva et al., 2012).
The summary of changes in physiological and functional parameters resulting of
performance of concurrent strength and endurance training are present in table
2. In a study of Wong et al., (2010) professional male soccer players performed
2 sessions per week of high-intensity resistance training and speed endurance
throughout the 8-wks of preseason training. The training program resulted in
significant improvements in endurance fitness, soccer-specific endurance (SSE)
and soccer-specific-neuromuscular parameters (SSN). Helgerud et al.,(2002)
applied concurrent high-intensity aerobic long-interval training and maximal
strength training for neural adaptation during 8-wks of preseason. This type of
training protocol resulted in improvements in VO2max (8.9%), running economy
(4.7) and 1RM during half squat strength exercise (52%). Also, this training
intervention resulted in certain SSN adaptations assessed by 10-m sprint
performance (0.06-s improvement) and vertical jumping height (3-cm
increments). Another group of research (Bogdanis et al., 2011) examined the
strength training-effects of hypertrophy (H) and high-intensity strength training
(S) programs in professional soccer players during preseason where the weekly
cycle also involved a considerable amount of interval training and small-sided
games. These seem to be effective methodologies targeting endurance fitness
and SSE development [for a review see (Hill-Haas et al., 2011; Iaia et al.,
2009)]. The authors observed that both aerobic fitness parameters (e.g.,
VO2max and MAS) and SSE evaluated by the YYIET and Hoff`s dribbling track
test significant improved in both groups. Nevertheless, the question regarding
the compatibility of endurance and strength is highlighted in the distinct results.
In fact, only S improved RE significantly, and a trend to a better performance in
the YYIET in the S than in H group was reported.
In the research of Nunez et al., (2008), semi-professional male soccer players
performed both endurance and strength sessions in order to develop players’
physical fitness throughout the season (4 cycles of 12 weeks). In the endurance
and strength block the ratio between the different physical fitness sessions were
2:1 (endurance block composed of 2 endurance training sessions and 1

118
strength training session and vice versa). This type of periodization was
effective in improving both the endurance performance assessed by the Probst
test as well as SSN evaluated through different jump exercises throughout the
different season time-points. The results suggested that no conflict of
adaptations occur when high volumes and low volumes of the different physical
capacities were simultaneously combined during a soccer training cycle.
Also, Lopez-Segovia et al., (2010) examined the training-induced adaptations in
elite U-19 players during 4 months of the season. The training program
consisted of 4 training sessions per week, in which 2 were focused on
development of physical condition. In these 2 sessions the training content was
focused on the improvement of players’ aerobic performance. Training was
complemented with one or two specific-strength training session per week
performed at the start of the training session. This type of periodization
improved loaded CMJ and the speed of movement in full squats with loads
ranging from 20kg to 40kg. Nevertheless, significant decrements in different
sprint abilities were examined. According to the researchers, the high volume of
aerobic work performed by the team might explain the lack of improvement in
the former sprint variables. Regarding soccer players’ endurance fitness, it was
observed that MAS increased by 3.2% after the intervention period (Lopez-
Segovia et al., 2010). Gorostiaga et al., (2004) observed a similar pattern
response in sub-maximal blood lactate values in both the explosive strength
training plus soccer training group and in the group performing only soccer
training. These findings suggest that concurrent explosive-type strength training
and soccer training did not interfere with the development of endurance
(Gorostiaga et al., 2004).
It seems logical to conclude that in soccer, the training of neuromuscular
function and soccer specific endurance can be combined and advised since it
can promote, among other factors, improvements in non-specific and soccer
specific endurance and explosive performance. Nevertheless, compatibility
seems to be greater when high-intensity or explosive strength is combined with
high-intensity endurance training.
119
4. References
Aagaard, P., & Andersen, J. L. (2010). Effects of strength training on endurance
capacity in top-level endurance athletes. Scandinavian Journal of
Medicine & Science in Sports, 20, 39-47.
Aagaard, P., Simonsen, E. B., Andersen, J. L., Magnusson, P., & Dyhre-
Poulsen, P. (2002). Increased rate of force development and neural drive
of human skeletal muscle following resistance training. J Appl Physiol,
93(4), 1318-1326.
Aagaard, P., Trolle, M., Simonsen, E., Bangsbo, J., & Klausen, K. (1993). High
speed knee extension capacity of soccer players after different kinds of
strength trainning. In T. Reilly, J. Clarys & A. Stibbe (Eds.), Science and
Footbal II (pp. 92-94). London: F & FN Spon.
Andersen, J. L., Klitgaard, H., Bangsbo, J., & Saltin, B. (1994). Myosin heavy
chain isoforms in single fibres from m. vastus lateralis of soccer players:
effects of strength-training. Acta Physiol Scand, 150(1), 21-26.
Andersson, H., Raastad, T., Nilsson, J., Paulsen, G., Garthe, I., & Kadi, F.
(2008). Neuromuscular fatigue and recovery in elite female soccer:
effects of active recovery. Med Sci Sports Exerc, 40(2), 372-380.
Ascensao, A., Leite, M., Rebelo, A. N., Magalhaes, S., & Magalhaes, J. (2011).
Effects of cold water immersion on the recovery of physical performance
and muscle damage following a one-off soccer match. J Sports Sci,
29(3), 217-225.
Ascensao, A., Rebelo, A., Oliveira, E., Marques, F., Pereira, L., & Magalhaes, J.
(2008). Biochemical impact of a soccer match - analysis of oxidative
stress and muscle damage markers throughout recovery. Clin Biochem,
41(10-11), 841-851.
Bangsbo, J., Iaia, F. M., & Krustrup, P. (2007). Metabolic response and fatigue
in soccer. Int J Sports Physiol Perform, 2(2), 111-127.
Billot, M., Martin, A., Paizis, C., Cometti, C., & Babault, N. (2010). Effects of an
electrostimulation training program on strength, jumping, and kicking
capacities in soccer players. J Strength Cond Res, 24(5), 1407-1413.

120
Bogdanis, G. C., Papaspyrou, A., Souglis, A., Theos, A., Sotiropoulos, A., &
Maridaki, M. (2009). Effects of hypertrophy and a maximal strength
training programme on speed, force and power of soccer players. In T.
Reilly & F. Korkusuz (Eds.), Science and Football VI. The proceedings of
the sixth world congress on science and football. (pp. 290-295):
Routledge.
Bogdanis, G. C., Papaspyrou, A., Souglis, A. G., Theos, A., Sotiropoulos, A., &
Maridaki, M. (2011). Effects of Two Different Half-Squat Training
Programs on Fatigue During Repeated Cycling Sprints in Soccer
Players. J Strength Cond Res.
Brughelli, M., Cronin, J., Levin, G., & Chaouachi, A. (2008). Understanding
change of direction ability in sport: a review of resistance training studies.
Sports Med, 38(12), 1045-1063.
Chelly, M. S., Fathloun, M., Cherif, N., Ben Amar, M., Tabka, Z., & Van Praagh,
E. (2009). Effects of a back squat training program on leg power, jump,
and sprint performances in junior soccer players. J Strength Cond Res,
23(8), 2241-2249.
Cometti, G., Maffiuletti, N. A., Pousson, M., Chatard, J. C., & Maffulli, N. (2001).
Isokinetic Strength and Anaerobic Power of Elite, Subelite and Amateur
Soccer Players. Int J Sports Med, 22, 45-51.
Docherty, D., & Sporer, B. (2000). A proposed model for examining the
interference phenomenon between concurrent aerobic and strength
training. Sports Med, 30(6), 385-394.
Ebbeling, C. B., & Clarkson, P. M. (1989). Exercise-induced muscle damage
and adaptation. Sports Med, 7(4), 207-234.
Ebben, W. P., & Watts, P. (1998). A review of combined weight training and
plyometric training modes: Complex training. Strength Cond J 20, 18-27.
Gabriel, D. A., Kamen, G., & Frost, G. (2006). Neural adaptations to resistive
exercise: mechanisms and recommendations for training practices.
Sports Med, 36(2), 133-149.
Gorostiaga, E. M., Izquierdo, M., Ruesta, M., Iribarren, J., Gonzalez-Badillo, J.
J., & Ibanez, J. (2004). Strength training effects on physical performance

121
and serum hormones in young soccer players. Eur J Appl Physiol, 91(5-
6), 698-707.
Greig, M. (2008). The influence of soccer-specific fatigue on peak isokinetic
torque production of the knee flexors and extensors. Am J Sports Med,
36(7), 1403-1409.
Hakkinen, K., Alen, M., Kraemer, W. J., Gorostiaga, E., Izquierdo, M., Rusko,
H., et al. (2003). Neuromuscular adaptations during concurrent strength
and endurance training versus strength training. Eur J Appl Physiol,
89(1), 42-52.
Hakkinen, K., Komi, P. V., & Alen, M. (1985). Effect of explosive type strength
training on isometric force- and relaxation-time, electromyographic and
muscle fibre characteristics of leg extensor muscles. Acta Physiol Scand,
125(4), 587-600.
Harris, N., Cronin, J., & Keogh, J. (2007). Contraction force specificity and its
relationship to functional performance. J Sports Sci, 25(2), 201-212.
Helgerud, J., Kemi, O. J., & Hoff, J. (2002). Pre-season concurrent strength and
endurance development in elite soccer players. In J. Hoff & J. Helgerud
(Eds.), Football (soccer): new developments in physical training research
(pp. 55-66). Trondheim: NTNU.
Hill-Haas, S. V., Dawson, B., Impellizzeri, F. M., & Coutts, A. J. (2011).
Physiology of small-sided games training in football: a systematic review.
Sports Med, 41(3), 199-220.
Hoff, J., & Helgerud, J. (2004). Endurance and strength training for soccer
players: physiological considerations. Sports Med, 34(3), 165-180.
Iaia, F. M., Rampinini, E., & Bangsbo, J. (2009). High-intensity training in
football. Int J Sports Physiol Perform, 4(3), 291-306.
Impellizzeri, F. M., Rampinini, E., Castagna, C., Martino, F., Fiorini, S., &
Wisloff, U. (2008). Effect of plyometric training on sand versus grass on
muscle soreness and jumping and sprinting ability in soccer players. Br J
Sports Med, 42(1), 42-46.
Ispirlidis, I., Fatouros, I. G., Jamurtas, A. Z., Nikolaidis, M. G., Michailidis, I.,
Douroudos, I., et al. (2008). Time-course of changes in inflammatory and

122
performance responses following a soccer game. Clin J Sport Med,
18(5), 423-431.
Kotzamanidis, C., Chatzopoulos, D., Michailidis, C., Papaiakovou, G., &
Patikas, D. (2005). The effect of a combined high-intensity strength and
speed training program on the running and jumping ability of soccer
players. J Strength Cond Res, 19(2), 369-375.
Kraemer, W. J., Patton, J. F., Gordon, S. E., Harman, E. A., Deschenes, M. R.,
Reynolds, K., et al. (1995). Compatibility of high-intensity strength and
endurance training on hormonal and skeletal muscle adaptations. J Appl
Physiol, 78(3), 976-989.
Krustrup, P., Ortenblad, N., Nielsen, J., Nybo, L., Gunnarsson, T. P., Iaia, F. M.,
et al. (2011). Maximal voluntary contraction force, SR function and
glycogen resynthesis during the first 72 h after a high-level competitive
soccer game. Eur J Appl Physiol.
Lopez-Segovia, M., Palao Andres, J. M., & Gonzalez-Badillo, J. J. (2010). Effect
of 4 months of training on aerobic power, strength, and acceleration in
two under-19 soccer teams. J Strength Cond Res, 24(10), 2705-2714.
Magalhaes, J., Rebelo, A., Oliveira, E., Silva, J. R., Marques, F., & Ascensao,
A. (2010). Impact of Loughborough Intermittent Shuttle Test versus
soccer match on physiological, biochemical and neuromuscular
parameters. Eur J Appl Physiol, 108(1), 39-48.
Maio Alves, J. M., Rebelo, A. N., Abrantes, C., & Sampaio, J. (2010). Short-
term effects of complex and contrast training in soccer players' vertical
jump, sprint, and agility abilities. J Strength Cond Res, 24(4), 936-941.
Manolopoulos, E., Papadopoulos, C., & Kellis, E. (2006). Effects of combined
strength and kick coordination training on soccer kick biomechanics in
amateur players. Scand J Med Sci Sports, 16(2), 102-110.
Mohr, M., Krustrup, P., & Bangsbo, J. (2005). Fatigue in soccer: a brief review.
J Sports Sci, 23(6), 593-599.
Mujika, I., Santisteban, J., & Castagna, C. (2009). In-season effect of short-term
sprint and power training programs on elite junior soccer players. J
Strength Cond Res, 23(9), 2581-2587.
123
Nummela, A. T., Paavolainen, L. M., Sharwood, K. A., Lambert, M. I., Noakes,
T. D., & Rusko, H. K. (2006). Neuromuscular factors determining 5 km
running performance and running economy in well-trained athletes. Eur J
Appl Physiol, 97(1), 1-8.
Nunez, V. M., Da Silva-Grigoletto, M. E., Castillo, E. F., Poblador, M. S., &
Lancho, J. L. (2008). Effects of training exercises for the development of
strength and endurance in soccer. J Strength Cond Res, 22(2), 518-524.
Paavolainen, L., Hakkinen, K., Hamalainen, I., Nummela, A., & Rusko, H.
(1999a). Explosive-strength training improves 5-km running time by
improving running economy and muscle power. J Appl Physiol, 86(5),
1527-1533.
Paavolainen, L. M., Nummela, A. T., & Rusko, H. K. (1999b). Neuromuscular
characteristics and muscle power as determinants of 5-km running
performance. Med Sci Sports Exerc, 31(1), 124-130.
Rampinini, E., Bosio, A., Ferraresi, I., Petruolo, A., Morelli, A., & Sassi, A.
(2011). Match-Related Fatigue in Soccer Players. Med Sci Sports Exerc.
Rebelo, N., Krustrup, P., Soares, J., & Bangsbo, J. (1998). Reduction in
intermittent exercise performance during a soccer match. Journal of
Sport Sciences, 16, 482-483.
Reilly, T., Drust, B., & Clarke, N. (2008). Muscle fatigue during football match-
play. Sports Med, 38(5), 357-367.
Ronnestad, B. R., Kvamme, N. H., Sunde, A., & Raastad, T. (2008). Short-term
effects of strength and plyometric training on sprint and jump
performance in professional soccer players. J Strength Cond Res, 22(3),
773-780.
Ronnestad, B. R., Nymark, B. S., & Raastad, T. (2011). Effects of in-season
strength maintenance training frequency in professional soccer players. J
Strength Cond Res, 25(10), 2653-2660.
Saunders, P. U., Telford, R. D., Pyne, D. B., Peltola, E. M., Cunningham, R. B.,
Gore, C. J., et al. (2006). Short-term plyometric training improves running
economy in highly trained middle and long distance runners. J Strength
Cond Res, 20(4), 947-954.

124
Schmidtbleicher, D. (1992). Training for power events. In P. V. Chem (Ed.),
Strength and Power in Sports (pp. 381-395). Boston: Blackwell Scientific.
Sedano, S., Matheu, A., Redondo, J. C., & Cuadrado, G. (2011). Effects of
plyometric training on explosive strength, acceleration capacity and
kicking speed in young elite soccer players. J Sports Med Phys Fitness,
51(1), 50-58.
Silva, J., Magalhaes, J., Ascensao, A. A., Seabra, A., & Rebelo, A. (2011a).
Training status and match activity of professional soccer players
throughout the season. J Strength Cond Res [Epub ahead of print]
Silva, J. R., Magalhaes, J. F., Ascensao, A. A., Oliveira, E. M., Seabra, A. F., &
Rebelo, A. N. (2011b). Individual Match Playing Time During the Season
Affects Fitness-Related Parameters of Male Professional Soccer Players.
J Strength Cond Res, 25 (10), 2729-2739
Thomas, K., French, D., & Hayes, P. R. (2009). The effect of two plyometric
training techniques on muscular power and agility in youth soccer
players. J Strength Cond Res, 23(1), 332-335.
Thompson, D., Nicholas, C. W., & Williams, C. (1999). Muscular soreness
following prolonged intermittent high-intensity shuttle running. J Sports
Sci, 17(5), 387-395.
Toigo, M., & Boutellier, U. (2006). New fundamental resistance exercise
determinants of molecular and cellular muscle adaptations. Eur J Appl
Physiol, 97(6), 643-663.
Trolle, M., Aagaard, P., Simonsen, E., Bangsbo, J., & Klausen, K. (1993).
Effects of strength trainning on kicking performance in soccer. In T.
Reilly, J. Clarys & A. Stibbe (Eds.), Science and Footbal II (pp. 95-97).
London: F & FN Spon.
Twist, C., & Eston, R. (2005). The effects of exercise-induced muscle damage
on maximal intensity intermittent exercise performance. Eur J Appl
Physiol, 94, 652-658.
Viitasalo, J. (1985). Measurement of force-velocity characteristics for sportsmen
in field conditions. In D. Winter, R. Norman, R. Wells, K. Hayes & A.

125
Patla (Eds.), Biomechanics IX-A (pp. 96-101): Human Kinetics,
Champaign.
Wong, P. L., Chaouachi, A., Chamari, K., Dellal, A., & Wisloff, U. (2010). Effect
of preseason concurrent muscular strength and high-intensity interval
training in professional soccer players. J Strength Cond Res, 24(3), 653-
660.
Young, W. (2006). Transfer of strength and power training to sports
performance. International Journal of Sports Physiology and
Performance, 1, 74-83.

126

127
Table1. Physiological and functional adaptations to Strength and Muscle Power training
Study
Level/
Country/
n (age)
Type of training F/D P Physiological
adaptations
Performance
changes
Bogdanis et al.,
(2009)
Professional/
Greek/
9 (22.9 + 1.1)
HIST: 8-12 upper and lower body exercises + 4 sets of half-squats at
90%1RM / 5rep / 3min rest between sets / emphasis on maximal
mobilization during concentric action
3x/
wk/
6wks
PS
↑17.3% 1RM†
↑16.3% 1RM/LLV†
↑6.2% PPO †
↑5.7%F0(kg)
↔Vopt(ver.min-1); V0(ver.min
-1);
LLV
↑≈1.6 % 10m sprint †
↑ ≈1.9% 40m sprint
↑≈2.5% 10x10m Zig-
Zag test (45º COD) †
↑≈2.1% T-TEST †
↑ ≈1% Illinois†
↑≈10% CMJ†
Hypertrophy Training: 8-12 upper and lower body exercise + 4 sets
of half-squat at 70%1RM / 12rep / 1.5min rest / emphasis on both
eccentric and concentric action with controlled movement speed
↑ 4.2% LLV
↑ 11%1RM
↑ 6.6% 1RM/LLV
↑4.1% PPO (W)
↔Vopt(ver.min-1); V0(ver.min
-1);
F0(kg)
↑≈1% 10m sprint
↑≈1.9% 40m sprint
↑≈1.3% 10x10m Zig-
Zag test (45º COD)
↑≈1.2% T-TEST
↑ ≈0.6% Illinois
↑≈5.3%CMJ
Bogdanis et al.,
(2011)
Professional/
Greek/
9 (22.9 + 1.1)
The same HIST training protocol adopted in the previous study 3x/
wk/
6wks
PS
↑ 5.4%Total work in RSA
↑10.9%RE
↑4.9%VO2max
↑7%MAS
↑29.4%YYIET
↑ 10%DTT
The same hypertrophy strength training protocol adopted in the
previous study
↑ 4.5% Total work in RSA
↑6.2%VO2max
↑5.8%vVO2max
↔ RE
↑21.5%YYIET
↑9.6% DTT

128
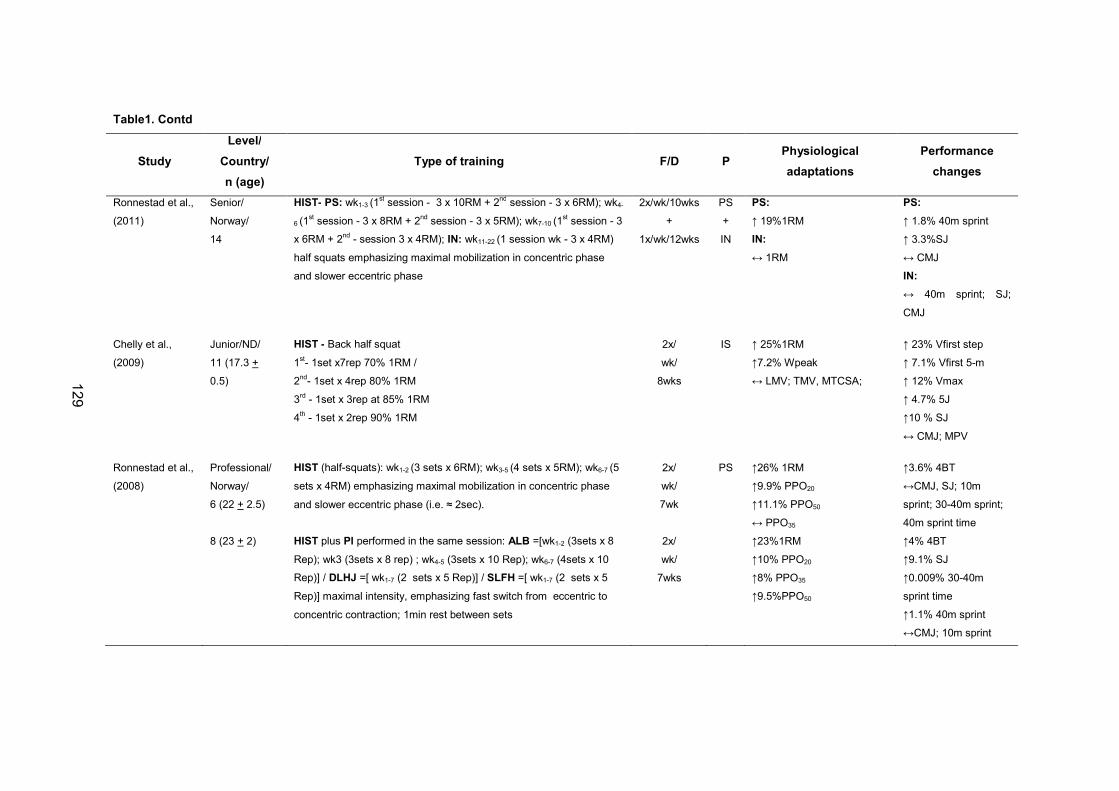
129
Table1. Contd
Study
Level/
Country/
n (age)
Type of training F/D P Physiological
adaptations
Performance
changes
Ronnestad et al.,
(2011)
Senior/
Norway/
14
HIST- PS: wk1-3 (1st session - 3 x 10RM + 2
nd session - 3 x 6RM); wk4-
6 (1st session - 3 x 8RM + 2
nd session - 3 x 5RM); wk7-10 (1
st session - 3
x 6RM + 2nd
- session 3 x 4RM); IN: wk11-22 (1 session wk - 3 x 4RM)
half squats emphasizing maximal mobilization in concentric phase
and slower eccentric phase
2x/wk/10wks
+
1x/wk/12wks
PS
+
IN
PS:
↑ 19%1RM
IN:
↔ 1RM
PS:
↑ 1.8% 40m sprint
↑ 3.3%SJ
↔ CMJ
IN:
↔ 40m sprint; SJ;
CMJ
Chelly et al.,
(2009)
Junior/ND/
11 (17.3 +
0.5)
HIST - Back half squat
1st- 1set x7rep 70% 1RM /
2nd
- 1set x 4rep 80% 1RM
3rd - 1set x 3rep at 85% 1RM
4th - 1set x 2rep 90% 1RM
2x/
wk/
8wks
IS
↑ 25%1RM
↑7.2% Wpeak
↔ LMV; TMV, MTCSA;
↑ 23% Vfirst step
↑ 7.1% Vfirst 5-m
↑ 12% Vmax
↑ 4.7% 5J
↑10 % SJ
↔ CMJ; MPV
Ronnestad et al.,
(2008)
Professional/
Norway/
6 (22 + 2.5)
HIST (half-squats): wk1-2 (3 sets x 6RM); wk3-5 (4 sets x 5RM); wk6-7 (5
sets x 4RM) emphasizing maximal mobilization in concentric phase
and slower eccentric phase (i.e. ≈ 2sec).
2x/
wk/
7wk
PS ↑26% 1RM
↑9.9% PPO20
↑11.1% PPO50
↔ PPO35
↑3.6% 4BT
↔CMJ, SJ; 10m
sprint; 30-40m sprint;
40m sprint time
8 (23 + 2) HIST plus Pl performed in the same session: ALB =[wk1-2 (3sets x 8
Rep); wk3 (3sets x 8 rep) ; wk4-5 (3sets x 10 Rep); wk6-7 (4sets x 10
Rep)] / DLHJ =[ wk1-7 (2 sets x 5 Rep)] / SLFH =[ wk1-7 (2 sets x 5
Rep)] maximal intensity, emphasizing fast switch from eccentric to
concentric contraction; 1min rest between sets
2x/
wk/
7wks
↑23%1RM
↑10% PPO20
↑8% PPO35
↑9.5%PPO50
↑4% 4BT
↑9.1% SJ
↑0.009% 30-40m
sprint time
↑1.1% 40m sprint
↔CMJ; 10m sprint

130
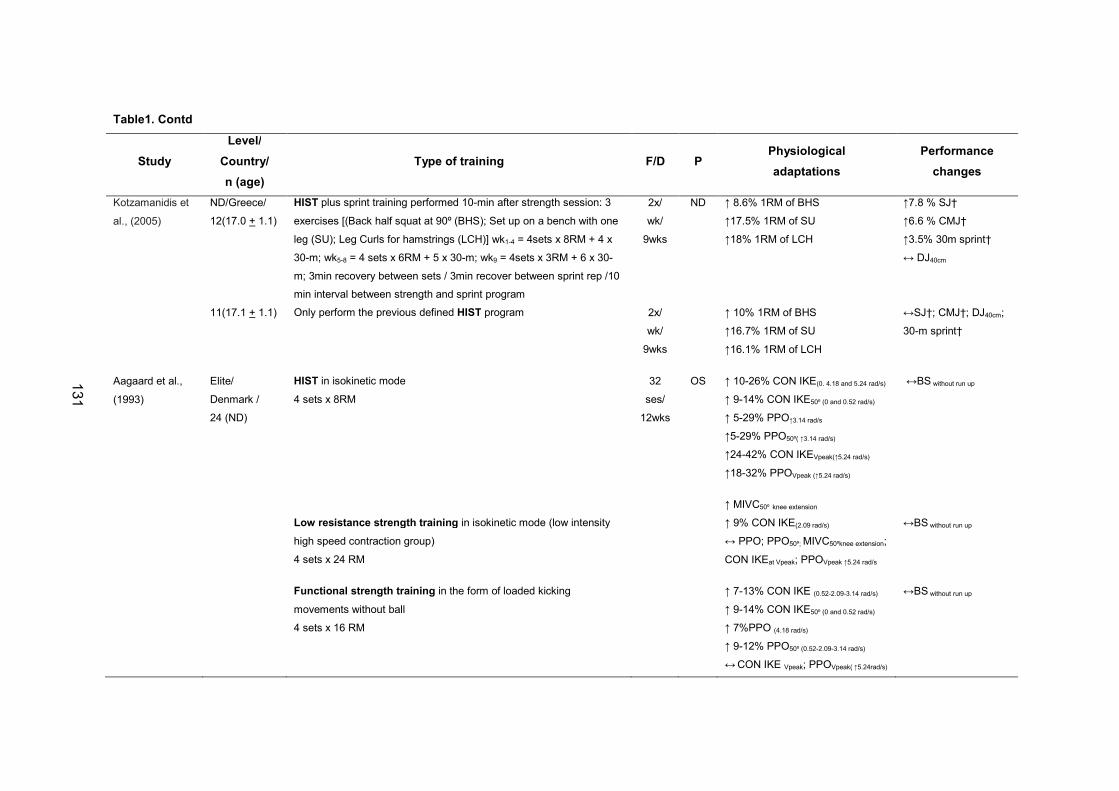
131
Table1. Contd
Study
Level/
Country/
n (age)
Type of training F/D P Physiological
adaptations
Performance
changes
Kotzamanidis et
al., (2005)
ND/Greece/
12(17.0 + 1.1)
HIST plus sprint training performed 10-min after strength session: 3
exercises [(Back half squat at 90º (BHS); Set up on a bench with one
leg (SU); Leg Curls for hamstrings (LCH)] wk1-4 = 4sets x 8RM + 4 x
30-m; wk5-8 = 4 sets x 6RM + 5 x 30-m; wk9 = 4sets x 3RM + 6 x 30-
m; 3min recovery between sets / 3min recover between sprint rep /10
min interval between strength and sprint program
2x/
wk/
9wks
ND ↑ 8.6% 1RM of BHS
↑17.5% 1RM of SU
↑18% 1RM of LCH
↑7.8 % SJ†
↑6.6 % CMJ†
↑3.5% 30m sprint†
↔ DJ40cm
11(17.1 + 1.1) Only perform the previous defined HIST program 2x/
wk/
9wks
↑ 10% 1RM of BHS
↑16.7% 1RM of SU
↑16.1% 1RM of LCH
↔SJ†; CMJ†; DJ40cm;
30-m sprint†
Aagaard et al.,
(1993)
Elite/
Denmark /
24 (ND)
HIST in isokinetic mode
4 sets x 8RM
32
ses/
12wks
OS ↑ 10-26% CON IKE(0. 4.18 and 5.24 rad/s)
↑ 9-14% CON IKE50º (0 and 0.52 rad/s)
↑ 5-29% PPO↑3.14 rad/s
↑5-29% PPO50º( ↑3.14 rad/s)
↑24-42% CON IKEVpeak(↑5.24 rad/s)
↑18-32% PPOVpeak (↑5.24 rad/s)
↑ MIVC50º knee extension
↔BS without run up
Low resistance strength training in isokinetic mode (low intensity
high speed contraction group)
4 sets x 24 RM
↑ 9% CON IKE(2.09 rad/s)
↔ PPO; PPO50º; MIVC50ºknee extension;
CON IKEat Vpeak; PPOVpeak ↑5.24 rad/s
↔BS without run up
Functional strength training in the form of loaded kicking
movements without ball
4 sets x 16 RM
↑ 7-13% CON IKE (0.52-2.09-3.14 rad/s)
↑ 9-14% CON IKE50º (0 and 0.52 rad/s)
↑ 7%PPO (4.18 rad/s)
↑ 9-12% PPO50º (0.52-2.09-3.14 rad/s)
↔ CON IKE Vpeak; PPOVpeak( ↑5.24rad/s)
↔BS without run up

132
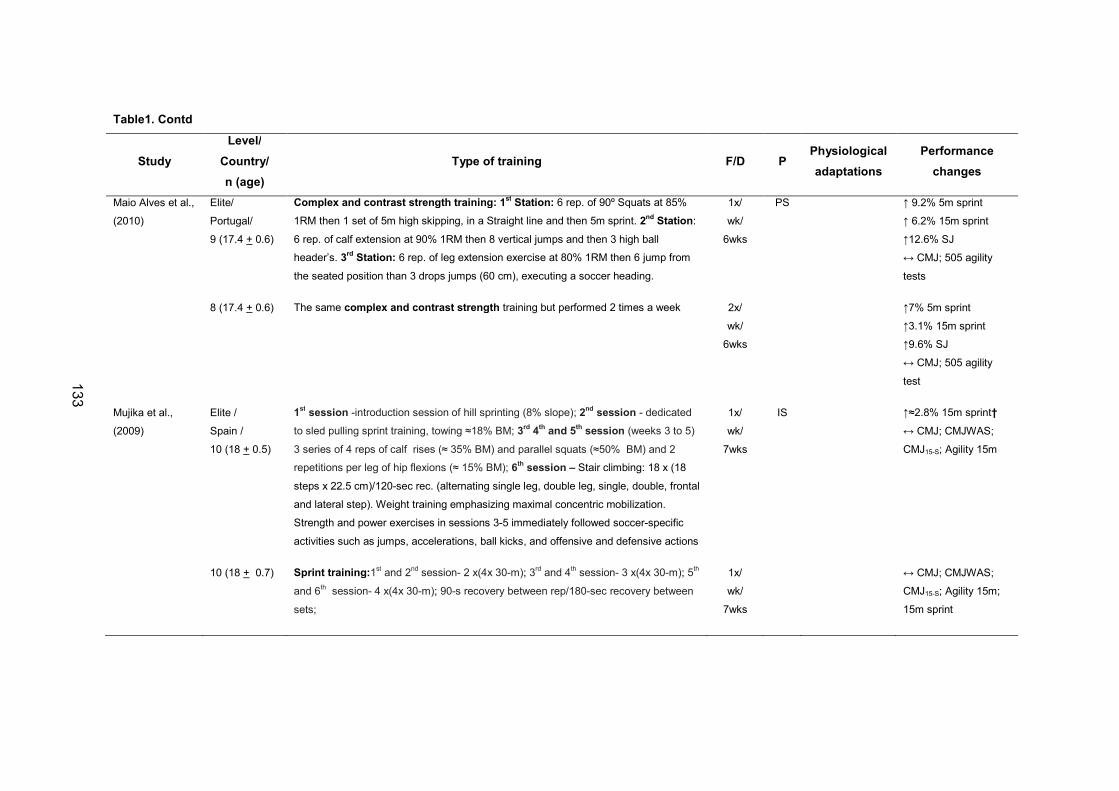
133
Table1. Contd
Study
Level/
Country/
n (age)
Type of training F/D P Physiological
adaptations
Performance
changes
Maio Alves et al.,
(2010)
Elite/
Portugal/
9 (17.4 + 0.6)
Complex and contrast strength training: 1st Station: 6 rep. of 90º Squats at 85%
1RM then 1 set of 5m high skipping, in a Straight line and then 5m sprint. 2nd
Station:
6 rep. of calf extension at 90% 1RM then 8 vertical jumps and then 3 high ball
header’s. 3rd
Station: 6 rep. of leg extension exercise at 80% 1RM then 6 jump from
the seated position than 3 drops jumps (60 cm), executing a soccer heading.
1x/
wk/
6wks
PS ↑ 9.2% 5m sprint
↑ 6.2% 15m sprint
↑12.6% SJ
↔ CMJ; 505 agility
tests
8 (17.4 + 0.6) The same complex and contrast strength training but performed 2 times a week
2x/
wk/
6wks
↑7% 5m sprint
↑3.1% 15m sprint
↑9.6% SJ
↔ CMJ; 505 agility
test
Mujika et al.,
(2009)
Elite /
Spain /
10 (18 + 0.5)
1st session -introduction session of hill sprinting (8% slope); 2
nd session - dedicated
to sled pulling sprint training, towing ≈18% BM; 3rd
4th
and 5th
session (weeks 3 to 5)
3 series of 4 reps of calf rises (≈ 35% BM) and parallel squats (≈50% BM) and 2
repetitions per leg of hip flexions (≈ 15% BM); 6th
session – Stair climbing: 18 x (18
steps x 22.5 cm)/120-sec rec. (alternating single leg, double leg, single, double, frontal
and lateral step). Weight training emphasizing maximal concentric mobilization.
Strength and power exercises in sessions 3-5 immediately followed soccer-specific
activities such as jumps, accelerations, ball kicks, and offensive and defensive actions
1x/
wk/
7wks
IS ↑≈2.8% 15m sprint†
↔ CMJ; CMJWAS;
CMJ15-S; Agility 15m
10 (18 + 0.7) Sprint training:1st and 2
nd session- 2 x(4x 30-m); 3
rd and 4
th session- 3 x(4x 30-m); 5
th
and 6th session- 4 x(4x 30-m); 90-s recovery between rep/180-sec recovery between
sets;
1x/
wk/
7wks
↔ CMJ; CMJWAS;
CMJ15-S; Agility 15m;
15m sprint

134

135
Table1. Contd
Study
Level/
Country/
n (age)
Type of training F/D P Physiological
adaptations
Performance
changes
Manopoulos et
al., (2006)
Amateurs/ NS/
10 (19.9 +
0.4)
wk1-2 : general strength (10 exercises/3 sets/15-20 rep); wk3-4 : 3sets/6 rep (5 different
exercises as skipping, jumping on one leg and on both legs, jumping running forwards,
backwards and to the side, jumping obstacles and kicking); wk5-10 : (a) 3 sets x 6 instep
kicks within a time of 5 s (b) 6 kicking’s with a 5m run-up approach against resistance
provided by a rubber band (RRB) attached on the ankle of the swinging leg (c) 3x10-
min/5- or 8-a SSG, with or without loads (d) series of modified exercise sequences: 1st)
6 kicking’s (RRB), 3 jumps, isometry trunk with a player on the back (PB) in a semi-
seated position for 6 s, 4 sideward jumps; 2nd
) 6 leg extensions RRB, 3 headers,
isometry ankle musculature, carrying PB for 6 s, 1 kicking; 3rd
) 6 knee flexion repetitions
RRB, 4 sideward jumps, 3 x 5-m sprints and a soccer kick.
3x/
wk/
10wks
NS ↑ 13.9% MIVCleg press
↑ 14% MIVC/BW
↑ 29.1% F60
↑ 17.2% F100
↑ 30% EMG VL
↑≈4%10-m sprint
↑≈10% BS with run up
↔MCS
Impellizzeri et al.,
(2008)
Amateurs/
Italian/
37 (25+ 4)
Pl on grass; Vertical jumping: 15sets in wk1; 20 sets wk2; 25sets in wk3-4; always
10rep per wk; Bounding: 3sets wk1; 4sets wk2; 5sets per wk in wk3-4; always 10rep per
wk; Broad jumping: 5sets x 8rep wk1; 5sets wk2; 7sets wk3; 7sets wk4; always 10 rep
per wk2-4; Drop jump : 3sets x 5rep wk1; 5sets x 9rep wk2; 6sets x 15rep per wk in
wk3-4; recovery 15-30s between repetitions 1-2-min between sets
3x/
wk/
4wks
PS ↑ 3.7% 10m sprint
↑ 2.8% 20m sprint
↑ 4.7% SJ
↑14.5% CMJ†
↑9% CMJ/SJ†
Same Pl protocol but performed on a different ground surface (sand). ↑ 4.3% 10m sprint
↑ 2.5% 20m sprint
↑ 10% SJ†
↑6.4% CMJ;
↑3.7% CMJ/SJ

136
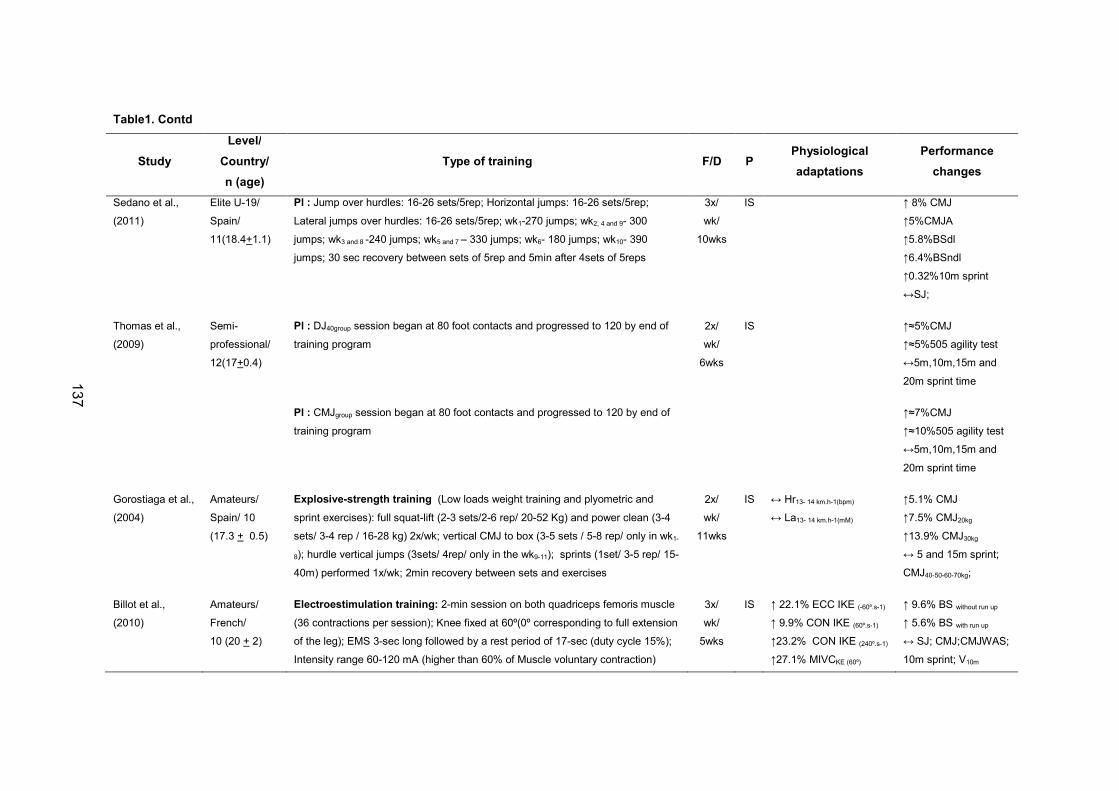
137
Table1. Contd
Study
Level/
Country/
n (age)
Type of training F/D P Physiological
adaptations
Performance
changes
Sedano et al.,
(2011)
Elite U-19/
Spain/
11(18.4+1.1)
Pl : Jump over hurdles: 16-26 sets/5rep; Horizontal jumps: 16-26 sets/5rep;
Lateral jumps over hurdles: 16-26 sets/5rep; wk1-270 jumps; wk2, 4 and 9- 300
jumps; wk3 and 8 -240 jumps; wk5 and 7 – 330 jumps; wk6- 180 jumps; wk10- 390
jumps; 30 sec recovery between sets of 5rep and 5min after 4sets of 5reps
3x/
wk/
10wks
IS ↑ 8% CMJ
↑5%CMJA
↑5.8%BSdl
↑6.4%BSndl
↑0.32%10m sprint
↔SJ;
Thomas et al.,
(2009)
Semi-
professional/
12(17+0.4)
Pl : DJ40group session began at 80 foot contacts and progressed to 120 by end of
training program
2x/
wk/
6wks
IS
↑≈5%CMJ
↑≈5%505 agility test
↔5m,10m,15m and
20m sprint time
Pl : CMJgroup session began at 80 foot contacts and progressed to 120 by end of
training program
↑≈7%CMJ
↑≈10%505 agility test
↔5m,10m,15m and
20m sprint time
Gorostiaga et al.,
(2004)
Amateurs/
Spain/ 10
(17.3 + 0.5)
Explosive-strength training (Low loads weight training and plyometric and
sprint exercises): full squat-lift (2-3 sets/2-6 rep/ 20-52 Kg) and power clean (3-4
sets/ 3-4 rep / 16-28 kg) 2x/wk; vertical CMJ to box (3-5 sets / 5-8 rep/ only in wk1-
8); hurdle vertical jumps (3sets/ 4rep/ only in the wk9-11); sprints (1set/ 3-5 rep/ 15-
40m) performed 1x/wk; 2min recovery between sets and exercises
2x/
wk/
11wks
IS
↔ Hr13- 14 km.h-1(bpm)
↔ La13- 14 km.h-1(mM)
↑5.1% CMJ
↑7.5% CMJ20kg
↑13.9% CMJ30kg
↔ 5 and 15m sprint;
CMJ40-50-60-70kg;
Billot et al.,
(2010)
Amateurs/
French/
10 (20 + 2)
Electroestimulation training: 2-min session on both quadriceps femoris muscle
(36 contractions per session); Knee fixed at 60º(0º corresponding to full extension
of the leg); EMS 3-sec long followed by a rest period of 17-sec (duty cycle 15%);
Intensity range 60-120 mA (higher than 60% of Muscle voluntary contraction)
3x/
wk/
5wks
IS ↑ 22.1% ECC IKE (-60º.s-1)
↑ 9.9% CON IKE (60º.s-1)
↑23.2% CON IKE (240º.s-1)
↑27.1% MIVCKE (60º)
↑ 9.6% BS without run up
↑ 5.6% BS with run up
↔ SJ; CMJ;CMJWAS;
10m sprint; V10m

138
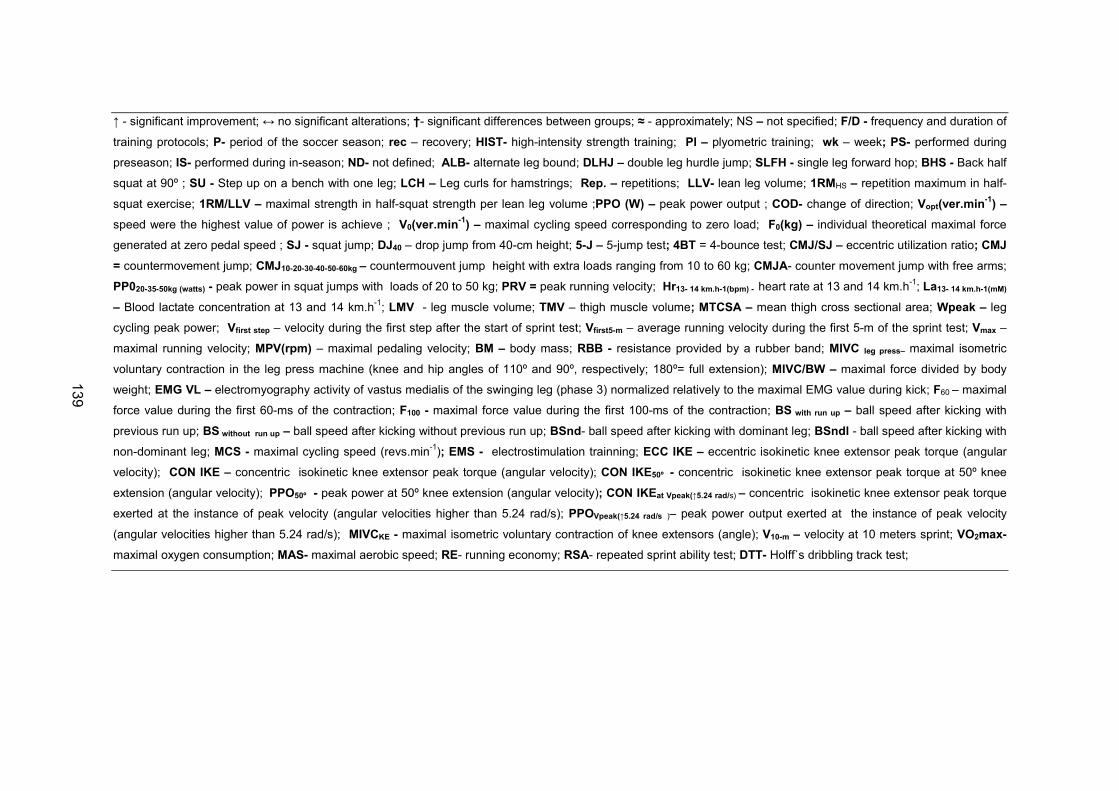
139
↑ - significant improvement; ↔ no significant alterations; †- significant differences between groups; ≈ - approximately; NS – not specified; F/D - frequency and duration of
training protocols; P- period of the soccer season; rec – recovery; HIST- high-intensity strength training; Pl – plyometric training; wk – week; PS- performed during
preseason; IS- performed during in-season; ND- not defined; ALB- alternate leg bound; DLHJ – double leg hurdle jump; SLFH - single leg forward hop; BHS - Back half
squat at 90º ; SU - Step up on a bench with one leg; LCH – Leg curls for hamstrings; Rep. – repetitions; LLV- lean leg volume; 1RMHS – repetition maximum in half-
squat exercise; 1RM/LLV – maximal strength in half-squat strength per lean leg volume ;PPO (W) – peak power output ; COD- change of direction; Vopt(ver.min-1
) –
speed were the highest value of power is achieve ; V0(ver.min-1
) – maximal cycling speed corresponding to zero load; F0(kg) – individual theoretical maximal force
generated at zero pedal speed ; SJ - squat jump; DJ40 – drop jump from 40-cm height; 5-J – 5-jump test; 4BT = 4-bounce test; CMJ/SJ – eccentric utilization ratio; CMJ
= countermovement jump; CMJ10-20-30-40-50-60kg – countermouvent jump height with extra loads ranging from 10 to 60 kg; CMJA- counter movement jump with free arms;
PP020-35-50kg (watts) - peak power in squat jumps with loads of 20 to 50 kg; PRV = peak running velocity; Hr13- 14 km.h-1(bpm) - heart rate at 13 and 14 km.h-1
; La13- 14 km.h-1(mM)
– Blood lactate concentration at 13 and 14 km.h-1
; LMV - leg muscle volume; TMV – thigh muscle volume; MTCSA – mean thigh cross sectional area; Wpeak – leg
cycling peak power; Vfirst step – velocity during the first step after the start of sprint test; Vfirst5-m – average running velocity during the first 5-m of the sprint test; Vmax –
maximal running velocity; MPV(rpm) – maximal pedaling velocity; BM – body mass; RBB - resistance provided by a rubber band; MIVC leg press– maximal isometric
voluntary contraction in the leg press machine (knee and hip angles of 110º and 90º, respectively; 180º= full extension); MIVC/BW – maximal force divided by body
weight; EMG VL – electromyography activity of vastus medialis of the swinging leg (phase 3) normalized relatively to the maximal EMG value during kick; F60 – maximal
force value during the first 60-ms of the contraction; F100 - maximal force value during the first 100-ms of the contraction; BS with run up – ball speed after kicking with
previous run up; BS without run up – ball speed after kicking without previous run up; BSnd- ball speed after kicking with dominant leg; BSndl - ball speed after kicking with
non-dominant leg; MCS - maximal cycling speed (revs.min-1
); EMS - electrostimulation trainning; ECC IKE – eccentric isokinetic knee extensor peak torque (angular
velocity); CON IKE – concentric isokinetic knee extensor peak torque (angular velocity); CON IKE50º - concentric isokinetic knee extensor peak torque at 50º knee
extension (angular velocity); PPO50º - peak power at 50º knee extension (angular velocity); CON IKEat Vpeak(↑5.24 rad/s) – concentric isokinetic knee extensor peak torque
exerted at the instance of peak velocity (angular velocities higher than 5.24 rad/s); PPOVpeak(↑5.24 rad/s )– peak power output exerted at the instance of peak velocity
(angular velocities higher than 5.24 rad/s); MIVCKE - maximal isometric voluntary contraction of knee extensors (angle); V10-m – velocity at 10 meters sprint; VO2max-
maximal oxygen consumption; MAS- maximal aerobic speed; RE- running economy; RSA- repeated sprint ability test; DTT- Holff`s dribbling track test;

140

141
Table2. Physiological and functional adaptations to concurrent strength and endurance training
Study
Level
/Country/
n (age)
Type of training D P Physiological
adaptations
Performance
changes
Nunez et al., (2008)
Semi-professional/ Spain/ 16 (28 + 3.7)
ST and ET - a sequence of general, special, and specific exercises incorporated in different training blocks. ET followed the time-line sequence of variable trajectory, medium extensive, intensive and short intensive intervals. ST followed the sequence of maximal holds, fast holds, horizontal and vertical jumps. ET block (2 sessions ET + 1 session ST) ST block (1session ET + 2 session ST)
4x12wks S ↑73% -80% Probst test ↑11.1-16.2% SJ ↑8-8.7% CMJ ↑6.4-7.4%CMJWAS
Wong et al., (2010)
Professional/ Hong-Kong/ 9 (24.6 + 1.5)
ST : 5 exercises; high-pull, jump squat, bench press, back half squat and chin-up; 4 sets at 6RM with 3 min rest between sets) SE :16 x 15 s at 120% of MAS with 15s rest
2x/wk/ 8wks
PS ↑4% VJ, ↑5.9% T10, ↑2.8% T30, ↑19.7% YYIR1, ↑3.1% MAS ↑9.2% MASdistance
Lopez-Segovia et al., (2010)
Elite/ Spain/ U-19
ET : high-intensity runs, physical-technical circuits and SSG, with maximal intensity during 4-6-min periods. ST: jumps with and without external training loads, half-squats and full-squats. The speed of movement ranged from 0.8 to 1.2 m.s
-1. ST
complemented with sprint exercises with loads (5kg) including change of direction movements, and 15 to 20-m take-offs with resisted sled towing (10kg)
2x/wk/ 16-wks
PS-IS
↑6.8%CMJ20kg ↑5.8%Fsquats20kg ↑7.1% Fsquats30kg ↑5.2% Fsquats40kg ↓ 2.3%T20 ↓2.4% T30 ↓3.2%T10-20-m ↓1.6%T10-30-m ↓2.6%T20-30-m
Bogdanis et al., (2009)
Professional/Greek/ 9(22.9 + 1.1)
ST and ET: (8-12 upper and lower body exercises + 4 sets of half-squats at 90%1RM / 5rep / 3min rest between sets) + SSG/IR (Wk1-20-min SSG; Wk2 -72min IR + 60min SSG; Wk3 -72min IR + 40min SSG; Wk4 - 40min IR + 54min SSG; Wk5 - 20min IR + 48min SSG; Wk6 - 20min IR + 48min SSG)
6-wks PS
↑ 5.4%Total work in RSA ↑10.9%RE ↑4.9%VO2max
↑29.4%YYIET ↑ 10%DTT ↑7%vVO2max
ST and ET : (8 - 12 upper and lower body exercises + 4 sets of half-squat at 70%1RM / 12rep / 1.5min rest / + the same SSG/IR protocol
↑ 4.5% Total work in RSA ↑6.2%VO2max ↑5.8%vVO2max ↔ RE
↑21.5%YYIET ↑9.6% DTT

142

143
↓- significant decrement; ↑- significant improvement; ↔ - no significant improvements; F/D - frequency and duration of training protocols; P- period of the soccer season;
ST- strength training; ET - endurance training; HIAT- high-intensity aerobic training; HIST- high intensity strength training; SE- speed endurance; S- performed
throughout the soccer season; PS- performed during preseason; IS – performed during in-season; SJ- squat jump; CMJ- countermovement jump; CMJWAS-
countermovement jump with arm swing; VJ - vertical jump height, T10- 10 meters time; T20- 20 meters sprint time; T30- 30 meters sprint time; T10-20-m – split time
between 10 and 20 meters sprint performance; T10-30-m - split time between 10 and 30 meters sprint performance; T20-30-m - split time between 20 and 30 meters
sprint performance YYIR1- yo-yo intermittent recovery level one; MAS – maximal aerobic speed; MASdistance – maximal aerobic distance; VO2max- maximal oxygen
consumption; 1RMHF- one repetition maxim in half squat strength exercise; wk1-6 – week 1, week 2A ; IR- interval running; SSG- small-side-games; Fsquats20-40kg-
speed of movement during full squats exercise with loads ranging from 20 to 40 kg;

145
Experimental Work

146

147
Experimental Work
Study I
TITLE: Individual match playing time during the season affects fitness-related
parameters of male professional soccer players
RUNNING HEAD: Seasonal variations in physical fitness
Authors:
João Renato Silva 1,2, José Magalhães 1,3, António Ascensão 1,3, Eduardo
Oliveira 1,André Seabra 1,2, António Rebelo 1,2
Affiliations:
1 Faculty of Sport, University of Porto, Portugal
2 Center of Research, Education, Innovation and Intervention in Sport (CIFI2D)
3 Research Center in Physical Activity, Health and Leisure (CIAFEL)
J Strength Cond Res (2011) 25 (10): 2729-2739.

148

149
Abstract
The purpose of this study was to analyse the effects of an entire season on
physical fitness parameters (PFP) in male professional soccer players (N=18).
Performance in 5m and 30m sprint (T5 and T30), countermovement jump
(CMJ), agility (T-test), knee extensors (KE) and flexors (KF) isokinetic strength,
hamstrings/quadriceps strength ratio (H/Q) and bilateral differences (BD), and
Yo-Yo intermittent endurance test 2 (YYIE2) were evaluated in four moments
(E1-E4) throughout the season. Individual match playing time (IMTC) was
quantified. Significant improvements in CMJ and YYIE2 from E1 to E2 were
observed (p<0.05-0.01). T30 improved from E2 to E3 (p<0.01). CMJ decreased
from E2 to E3 and E4, and YYIE2 from E2 to E4 (p<0.05). There were
increments in H/Q ratio and Agility from E1 and E2 to E3 and E4 (p<0.05-0.01).
Significant correlations were found in all evaluation points between different
PFP and between changes in strength parameters and agility, T5 and T30, CMJ
and YYIE2 (p<0.05-0.001). IMPT was correlated to changes in T5 (E1 to E3; r =
- 0.705), knee extensors non-dominant leg (KEND; E2 to E3; r = 0.786) and KF
(E3 to E4; r = 0.575-0.590). The interrelationship between muscle strength (e.g.
KE), sprint (e.g. T5) and jump abilities (CMJ) suggests the importance of
muscle strength and power training for soccer. The present study suggests that
the systematic participation of the players in soccer matches favors the increase
and maintenance of soccer players KE and KF muscle strength and sprint
ability (T5). Thus, given the unique demands of actual match play, coaches
should try to incorporate a competitive friendly match in the weekly training
cycle of non starter players.
Keywords: Soccer Season; Training Schedule; Training status; Strength;
Muscle Power; Intermittent endurance.

150

151
INTRODUCTION
The regular evaluation of soccer players physical fitness using different tests is
of special importance as players should be able to successfully compete during
10-11 months.
Data from different studies suggest that elite soccer players cover 8 to 13 km
during matches (7) at a mean intensity close to the anaerobic threshold (AT)
(43). Moreover, energy expenditure during match averages 70-75% of maximal
oxygen consumption (VO2max) (7,38), which suggests that performance at elite
level may, in part, be determined by aerobic fitness (38). Furthermore, despite
low to medium intensity running are the predominant activity patterns of soccer
players, muscle power-based efforts such as sprints, jumps, duels, and kicking,
which are mainly dependent on maximal strength and anaerobic power of the
neuromuscular system (15), are essential factors to successfully perform in
soccer. Therefore, it is consensual among the literature that soccer players`
performance is intimately related to the efficiency of different energy-related
systems (43).
During season players are usually under prolonged physiological stress, as has
been described in different studies. Analysis of soccer player during the season
have revealed signs of oxidative (9) and functional stress (7,25), and immune
system (36) and hormonal stress-related imbalances (25). In such conditions,
the maintenance or improvement of player performance is not solely determined
by appropriate conditioning, but also by the ability of the body systems to
recover and regenerate following multiple stress stimuli (25). Therefore, to
better understand the recovery pattern of the player under such demanding
competitive stress conditions, a longitudinal coverage of physical performance
in several time points throughout the season may be useful. However, there is a
lack of studies concerning the effects of an entire season on physical fitness of
professional players engaged in sport activities, including soccer. Most of the
studies rely on particular functional or physiological data such as
anthropometrics (11,13,25,31), VO2max and anaerobic threshold
measurements (11,13,31,32), specific intermittent endurance test (6,36),
152
exercise performance in incremental treadmill tests until exhaustion (11),
muscle power through jump and sprint tests (4,11,30) and lower limb strength
evaluated by isokinetic devices (30,31). Inconsistency has been revealed in the
literature regarding the impact of training and competition in the variation of
certain fitness parameters (4,10,11,13,25,30-32). Moreover, these observations
resulting from longitudinal scanning of players fitness, as well as from the
analysis of the short term impact of diverse forms of strength (29,49) and
endurance training (42,49), did not considered the influence of the cumulative
amount of competition playing time. A study performed by Impellizzeri et al.
(23), where rating of perceived exertion (RPE) was used to quantify the internal
training load (RPE-Tld), showed that in weeks comprising two official matches,
the RPE-Tld can represent about 50% of total weekly training load decreasing
to 25% in weeks with only one match performed. As so, a possible determinant
factor of physical fitness over the season could be the cumulative amount of
match playing time, a subject scarcely explored. Therefore, the purposes of this
study were to examine the impact of the season in a group of fitness-related
parameters and the association between their changes, considering the
influence of individual match playing time (IMPT).
METHODS
Experimental approach to the problem
As presented in figure 1, the different physical tests were performed in the same
order and in the same period of the day on four time points of a soccer season
(10-11 months) as follows: 1st (E1) – before the soccer season; early July); 2nd
(E2) - end of the preseason period (early August); 3rd (E3) - middle of the
season (January); 4th (E4) - end of the competitive season (May).
In each moment, players were evaluated for basic anthropometry,
countermovement vertical jump (CMJ), sprint and agility abilities, leg extensor
and flexor maximal strength, and Yo-Yo intermittent endurance test 2 (YYIE2).
However, no YYIE2 data were collected at the mid-season (E3) due to Club
heavy match commitments at that time. Additionally, the players’ individual time

153
spent in the matches was recorded. The physical fitness measurements
throughout different time points of the season allowed the analysis of seasonal
fitness alterations, the relationship between the different fitness parameters,
and the influence of individual match playing time (IMPT) in physical fitness.
The selected variables provide valid and reliable data for the evaluation of
physical fitness parameters, known to be directly (agility, sprint, jump,
intermittent endurance) and indirectly (isokinetic strength parameters) related to
soccer performance.
*figure 1 about here
Subjects
A group of 23 male professional players competing in the Portuguese elite
championship (rank 6 of the Union of European Football Associations - UEFA)
were initially involved in the protocol. As a result of injuries (n=2) and
transferences to other clubs (n=3), 5 players were not considered in the
analysis (n=18; table1). Only players free of injury involved in the full training
schedules were tested. In accordance with the Club policy, all soccer players
underwent usual physical examination in the beginning of the season (e.g.
blood sample analyzes, rest ECG, lung X- Ray).
The experimental protocol followed the Declaration of Helsinki of the World
Medical Association for research with humans and was approved by the local
Ethics Committee. All participants were fully informed about the aims,
experimental protocol and procedures, and provided written informed consent.
*table 1 about here
Evaluation Procedures
The CMJ, sprint ability and agility tests were conducted in indoor facilities to
exclude possible ground surface variations in the soccer pitch throughout the
season. Before the tests, all the players performed a 10 to 15 minutes (min)
warm-up consisting of light jogging, specific mobility exercises and stretching
routine, and 10 meters (m) sprints. Players completed two rounds of each test
154
in the same sequence and the best result was considered for analysis. Each
subject was allowed to a minimum of 5-min rest between tests to ensure
adequate recovery. All the evaluations took place at the same time of the day,
after a regular overnight sleep. Players were instructed to maintain normal
routines for daily food and water intake, and followed the same dietary
recommendations defined by the medical staff. In addition, during the days of
physical tests, players were instructed to refrain from drinking beverages
containing caffeine and/or alcohol and from consuming food during the 3 hours
before testing. In the two days preceding evaluations, the players had a day-off
(1st day) and a training session (2nd day) including low intensity exercises
aiming to improve post-match recovery.
Physical Performance Tests
Counter movement Jump
The CMJ was performed using a platform, Ergojump (Digitime 1000, Digest
Finland) according to Bosco et al., (8), whereby the highest vertical jump (cm)
and the longest flying time (s) were registered. The best trial of the two jumps
was considered.
The apparatus consisted of a digital timer connected by a cable to a jump
platform, Ergojump (Digitime 1000, Digest Finland). The timer is triggered at
take-off and then by participants’ feet at the moment of touchdown. The subject
started from an upright standing position on the platform, and immediately after
an eccentric phase (corresponding to a semi squatting position), the participants
jumped vertically without using arms (arms remained at both sides, hands on
the hip throughout the tests).
Sprint Time
Sprint measurements were carried out using telemetric photoelectric cells
(Brower Timing System, IRD-T175, Utah, USA) mounted on tripods positioned
approximately 0.75-m above the floor and situated 3-m apart facing each other
on either side of the starting line (0 m), at 5 and at 30-m. The players stood 0.3-
155
m behind the starting line, started at their own discretion, being time activated
when players cross the first pair of photocells, and they ran as fast as they
could to complete 30-m distance. The fastest trial was considered.
Agility
Agility was evaluated through the T-test following protocol of Semenick (41) with
modifications (figure 2). Subjects began with both feet 0.3-m behind the starting
point A. At their own discretion, each subject sprinted forward 9.14-m (10 yd) to
point B and touched the base of the cone with the right hand. They than
sprinted to the left 4.57-m (5 yd) and touched the base of a cone (C) with the
left and. Subjects then sprinted to the right 9.14-m (10 yd) and touched the base
of a cone (D) with the right hand. They then sprinted to the left 4.57-m back to
point B and touched the base of a cone with the left hand. They turn 270º and
then ran to point A, passing the finishing line. Two test trials were performed,
and times were recorded to the nearest one-hundredth of a second. As
described for sprint ability, measurements were carried out using telemetric
photoelectric cells (Brower Timing System, IRD-T175, Utah, USA). The players
stood 0.3-m behind the starting line, being time activated when they passed the
electronic sensors, and the clock stopped the instant players again crossed the
Point A. The fastest trial was considered.
*Figure 2 about here
Isokinetic Strength
In order to evaluate players’ lower limb muscle function, maximal gravity
corrected concentric peak torque of quadriceps and hamstring, bilateral leg
strength differences (BD) and ratio between concentric hamstring (H) and
quadriceps (Q) peak torque values (H/Q) were measured during isokinetic knee
joint movement (Biodex System 2, NY, USA) of the dominant and non-dominant
leg at the angular velocity of 90º.s-1 (1.57 rad.s-1), according to Magalhães et
al., (27). After individual self-report, the dominant leg was determined by a
routine visual inspection in a simple target kicking test requiring accuracy. Prior
156
to muscle function measurements, subjects perform a standardized warm-up
consisting of 5-min period on a cycle ergometer (Monark E-824) with a fixed
load corresponding to 2% of body weight. Players were then seated on the
dynamometer chair at 85º inclination (external angle from the horizontal) with
stabilization straps at the trunk, abdomen and thigh to prevent inaccurate joint
movements. The contralateral leg was not secured to avoid influencing the
strength developed by the knee being tested. The knee to be tested was
positioned at 90º of flexion (0º= fully extended knee) and the axis of the
dynamometer lever arm was aligned with the distal point of the lateral femoral
condyle. Before the anatomical alignments and procedures, all the subjects
were instructed to kick and also to bend the tested leg as hard and as fast as
they could through a complete range of motion (from 90º to 0º). Subjects were
also instructed to hold their arms comfortably across their chest to further
isolate knee joint flexion and extension movements. All subjects also performed
a specific sub-maximal warm-up protocol on the Biodex device in order to
familiarize with the isokinetic device and test procedure. Three maximal
repetitions at angular velocity 90º.s-1 (1.57 rad.s-1) were therefore carried out.
The highest peak torque found during all the repetitions was chosen for the
calculation of the bilateral leg strength differences (BD). This parameter was
calculated as follows: [(dominant concentric leg strength - non-dominant
concentric leg strength)] / dominant concentric leg strength *100 and is
expressed from absolute values as percentage i.e., independently of the
difference direction [from dominant (D) to non-dominant (ND) or ND to D]. The
ratio between concentric hamstring (H) and quadriceps (Q) peak torque values
(H/Q) was also determined and expressed as percentage.
Yo-Yo Intermittent Endurance Test Level 2
The Yo-Yo tests were designed to measure the ability to perform bouts of
repeated intense intermittent exercise. After a 10-min warm-up, the players
performed the test, which consists of repeated 2 x 20-m runs back and forth
between the start and finish line at a progressively increased speed controlled
by audio beeps from a CD-rom (5). The initial speed is 11.5 km/h (12.5 s for 2 x
157
20-m) and between running bouts the participants have a 5s rest period. The
test was considered ended when the subjects failed twice to reach the starting
line (objective evaluation) or the participant felt unable to complete another
shuttle at dictated speed (subjective evaluation) (12). The total distance covered
during the YYIE2 (including the last incomplete shuttle) was considered as the
testing score. Heart rate was measured during the YYIE2 and recorded every
5s using a HR monitor (POLAR TEAM SYSTEMTM, Polar Electro, Kempele,
Finland). Field testing sessions were performed on the football pitch where
players undertake their daily training sessions on several marked 2-m wide and
20-m long running lanes.
Intraclass correlation coefficients of all physical fitness tests were estimated
using a test-retest procedure, with a random sub-sample of 9 subjects in each
evaluation moment. The intraclass correlation coefficients (R) of all variables
were high as follows. Height, weight and fat mass: 0.93 ≤ R ≤ 0.99; counter
movement jump: 0.80≤ R ≤ 0.88; sprint time: 0.71 ≤ R ≤ 0.87; agility: 0.70 ≤ R ≤
0.85; Yo-Yo intermittent: 0.80≤ R ≤0.97; and isokinetic strength: 0.78 ≤ R ≤
0.98.
Playing schedule and training program
The generic training and competition plan completed by the soccer players
involved in this study was supplied by the technical staff of the team. As can be
seen by the season time-line (figure 1), 32 training sessions (6.4/wk) each
lasting for 90 to 120-min per session, and 8 “friendly” matches for a total
duration of 3400-min were comprised between E1 and E2 (5-wks). Training
contents during this period consisted of 2 sessions per week of aerobic and
strength training from week 1 to week 3 and 2 “friendly” matches. From week 4
to 5, one session per week of aerobic and strength training and 6 “friendly”
matches were performed, 3 matches in each week. Aerobic training sessions
consisted of general (interval running) and specific exercises (small-sided
games and soccer specific circuits). Strength training sessions followed the
specificity of strength training based on complex and contrast training (14).

158
Before training sessions players performed a warm-up lasting approximately 20
to 30-min (5 to 10-min jogging and low-intensity running, flexibility and mobility
exercises, technical drills, short and brief explosive actions). After training
sessions a warm-down that lasted approximately 10 to 15-min (jogging and
stretching) was fulfilled.
Between E2 and E3 (25-wks), first half of in season, the team performed 150
training sessions (6/wk) with a total duration of 13300-min and played 26 official
matches (1.04 matches/wk). In this period, players performed in each week one
session of aerobic high intensity training (high intensity interval training and
small-sided games), one session of functional strength training (plyometric
training, resistive sprints, agility drills) and one session of others sprint ability
exercises (with and without changes of directions).
Between E3 and E4 (17-wks), second half of in season, players were engaged
in 90 training sessions (5.3/wk) with a total duration of 7200-min and played 26
official matches (1.5/wk). In this period, the number of matches increased, and
the number of fitness training sessions decreased.
Statistical Analysis
All data are reported as means and standard deviations (SD). Normality was
tested with the Shapiro-Wilks test. Intraclass correlation coefficient was
calculated to estimate the reliability of the physical fitness tests. Analysis of
variance for repeated measures was used to compare differences between
evaluations. Pearson correlation coefficients (r) were used to determine
association between tests, tests changes and their relationship with individual
match playing time. The SPSS statistical package (version 14.0; Inc., Chicago,
III) was used. Statistical significance was set at p≤0.05.
RESULTS
Physical performance tests
The results of the physical tests performed in the four time points throughout the
season are shown in tables 2, 3 and 4.
159
The best 5-m (T5) and 30-m (T30) results were obtained at E3, but significant
differences were only observed between E2 and E3 in the T30 (table 2).
The results of CMJ were significantly higher in the E2 compared with the other
three time periods (Table 2). No differences were found between any other
moments.
T-test performance showed a significant improvement in E3 and E4 when
compared with E1 and E2 (table 2). No differences were found between E3 and
E4 neither between E1 and E2.
No significant changes were found in knee extension (KE) and flexion (KF)
strength in both dominant (D) and non-dominat (ND) legs (KED, KEND, KFD,
KFND), as well as in bilateral strength differences (BD) in leg extension (BDE)
and flexion (BDF) in the four time points (Table 3). However, a significant
increase in the H/Q ratio was found from E1 and E2 to E3 and E4.
*Table 2 about here
*Table 3 about here
As mentioned YYIE2 was only evaluated in E1, E2 and E4. The total distance
covered during the YYIE2 significantly increased in E2 and E4 compared with
E1. However, a significant decrease was also observed from E2 to E4 (Table
4).
*table4 about here
Association between tests
In E1, T5 was correlated with T30 (r=0.662; p<0.001) and T-test time (r=0.577;
p<0.01). The T30 was also correlated with CMJ (r=-0.456; p<0.05) and T-test
(r=0.441; p<0.05). Moreover, significant correlations were observed between
CMJ and KE values [(r= 0.524 and 0.534 for KED (p<0.05) and KEND (p<0.01),
respectively]. In E2, significant correlations were found between CMJ and T30
(r=-0.723; p<0.01), T5 (r=-0.526; p<0.01) and T-test time (r=-0.556; p<0.01).
The T30 was also correlated with T5 (r= 0.667; p<0.01) and T-test time
160
(r=0.725; p<0.01). In E3, correlations were found between CMJ and T5 (r=-
0.508; p<0.05) and T30 (r=-0.686; p<0.01), and also between T5 and T30
(r=0.801; p<0.001). Additionally, significant correlations between H/QND and
the T-test were found (r= 0.607; p<0.01). In E4, correlations between T5 and
CMJ (r=-0.730; p<0.01; Fig. 3) were observed. The KED was correlated with the
T5 (r=-0.547; p<0.05) and H/QND was correlated with de CMJ (r= 0.623;
p<0.01). In all the evaluations, body mass was correlated with the peak torques
from both KE and KF (r ranging from 0.6 to 0.8 and p<0.01 to 0.001).
*Figure 3 about here
Association between changes in the tests
From E1 to E2, significant correlations were observed between individual
changes in T30 and changes in CMJ (r=-0.546; p<0.05) and KED (r=-0.623;
p<0.01). Changes in T-test time were correlated with changes in KFD (r=0.522;
p<0.05) and H/QD (r=0.768; p<0.001). Also, a significant correlation between
individual changes in KED and YYIE2 was observed (r=-0.568; p<0.05). From
E2 to E3, significant correlations were observed between individual changes in
T-test time and H/QD (r= 0.726; p<0.05). Also, changes in KEND were
correlated with T5 (r=-0.638; p<0.05; Fig. 4), and changes in T-test time were
correlated with H/QND (r=0.622; p<0.05) from E3 and E4.
*Figure 4 about here
Association between match playing time and changes in the tests
The individual match playing time (IMPT) from E1 to E3 was correlated with the
individual changes in T5 (r=-0.705; p<0.01; Fig. 5). From E2 to E3, the IMPT
was significantly correlated with KEND (r=0.786; p<0.05) and H/QND (r=-0.738;
p<0.05). From E3 to E4, the IMPT was correlated with KFD (r=0.590; p<0.05),
KFND (r=0.575; p<0.05) and H/QND (r =0.794; p<0.05, Fig. 6).
*Figure 5 about here
161
*Figure 6 about here
DISCUSSION
The purposes of this study were to examine the impact of the season in a group
of fitness-related parameters and the association between their changes,
considering the influence of individual match playing time.
Our data showed that very short sprint performance measured by the T5 is a
stable physical ability throughout the soccer season. However, significant
differences were observed in the T30, where the time to perform the 30-m
distance decreased from E2 to E3 (p<0.01) evidencing better sprint
performance in the middle of the competitive period. In contrast with our data,
Aziz et al. (4) reported a gradual improvement in sprint performance over the
season in both 5 and 20-m sprint tests.
The soccer players showed a significantly higher CMJ performance in E2 than
in E1, E3 and E4 (Table 2). Accordingly, Clark, et al. (13) also found variations
in CMJ throughout the soccer season. However, discrepancies regarding
seasonal variation in CMJ performance have been reported in literature. In fact,
in contrast with our results, others did not report variations in CMJ during the
season (11,30,31). The increase in CMJ performance in E2 could possibly be
explained by the higher number of sessions dedicated to improve strength and
muscle power during preseason. During this period, high training volumes are
usual aiming to improve the general fitness levels (45) including muscle power.
Moreover, around December before E3, and from E3 to E4, it was observed an
increase in the number of games (see figure 1) requiring more time given to
recovery interventions, which implies a reduction in the volume of strength and
power training and potentially explain CMJ decrement from E2 to E3 and E4.
The predominant use of functional strength or solely functional type of muscle
training during in season may result in a decrement of the jump ability gains
attained during preseason training (10,39). Nevertheless, in a study by Caldwell
& Peters (10), semi-professional players only performing functional strength
training during in season were able to further increase and maintain the
improvements obtained during preseason.

162
Some researchers have suggested the importance of the agility as an
independent physical variable in the assessment of male football players’
performance (44,48). Our data showed improvements in agility performance
from E1 and E2 to E3 and E4, with the highest scores being observed in E3. A
better coordination between agonist and antagonist muscles allows an
improved ability to stop, start and turn rapidly while maintaining balance without
loss of speed (41), which may explain, at least in part, our results. These
actions that are systematically performed during training and games could likely
contribute to the agility increase observed in E3 and E4.
All together, the results of the agility and sprint tests suggest that activities
related with the stretch-shortening cycle (26) were improved in the mid-season
(E3). However, CMJ was not improved in this period. One possible reason is
that CMJ might not fulfil the criteria of SSC as would running-based exercises,
which lie in a very fast transition from stretch to shortening phases as well as in
a greater stretch velocity, both critical for stretch reflex activation (47).
Generally, data from our study showed that players maintain the same levels of
strength both on knee extension and flexor muscles as well as bilateral strength
differences throughout the soccer season. In fact, only significant increases in
the H/Q ratio from E1 and E2 to E3 and E4 were observed. A stability of
isokinetic strength parameters (e.g. KE) of professional soccer players over the
season was also observed by other investigators (30). In contrast, amateur
players showed a significant decrease of KE during an 11 week competitive
soccer season (25). This fact may highlight the possible influence of training
time in exercises specifically targeting muscle strength. Curiously, the KE peak
torques observed in the present study during the season were higher than those
reported in professional soccer players even at lower angular velocities (60º/s-1)
(30,31). Possible differences in time devoted to strength training may contribute
to explain, at least partially, the referred differences between studies.
Nevertheless, it is important to refer that despite the popularity of isokinetic
tests in research, they are less predictive of performance and longitudinally
changes than isoinertial measures, as a high sensibility is expected when the
mode of training matched the mode of testing (22).
163
Despite the multi-factorial aetiology of muscle injury, some evidences suggest
that imbalances in H/Q, as well as BD (2,16), previous injury (2,17) and lower
resistance to fatigue (e.g. hamstrings) (40), are major risk factors for soft tissues
injuries of soccer players. Throughout the time course of our study, the H/Q
ratios observed in the different time points were identical to those reported
previously by our group (27) and lower than the results reported by others (31).
Furthermore, Mercer et al., (31) did not report any significant changes in H/Q
from the beginning to the end of pre-season (E1 to E2). According with the
improvements in CMJ during preseason and in agility during in season, it seems
reasonable to suggest that a detraining effect may occur during offseason. In
fact, there is scientific evidence that detraining effects are more marked in
muscle power than in strength, being the former more dependent on muscle
coordination (24,34).
The Yo-Yo Test is widely used to evaluate the ability of soccer players to
intermittently perform exercise and has been considered a sensitive tool to
detect seasonal changes in the fitness of soccer players (6). Our data showed
an increase in the YYIE2 performance after preseason period followed by a
decrease at the end of season (E4). These results are in agreement with
previous data reporting soccer players` lower intermittent endurance
performance at the beginning of the season in field and laboratory tests. In fact,
data obtained through different tests, such as the incremental treadmill test to
exhaustion (32), exercise tolerance at VO2max, Intermittent Field Test (36) and
the Yo-Yo Intermittent Recovery Test (6) expectedly revealed lower
performance at the beginning of the season than during the competitive period.
Unfortunately, due to practical constrains related to the competitive calendar of
the team engaged in the present study, no data have been collected during the
mid-season (E3), which unable to assess the impact of the first half of the
season in the ability to perform intermittent endurance exercise.
Despite some controversies regarding the eventual contribution of the players’
aerobic power, the increments in YYIE2 performance in E2 and E4 compared to
E1 may also be related to improvements in other endurance-related
physiological features. Rampinini et al. (35) recently observed that time

164
constant of VO2 Kinetics and the ability to maintain acid–base balance are also
important physiological factors to the performance in Yo-Yo tests. As so,
improvements in the former factors throughout the season may have increase
the capacity to repeatedly perform intermittent endurance exercise. On the
other hand, the lower levels of intermittent endurance observed in E1 may also
explain the significant increment observed during preseason (E2), since in such
conditions higher adaptations should be expected.
The decline in YYIE2 performance observed in our study at E4 compared to E2
might be related with the specificity of the competition schedule. In fact, Mohr et
al., (33) reported decreases in the ability to perform high-intensity running
during games in elite soccer players involved in National and European
competitions (two matches per week) towards the middle of the season, during
which there is limited time to fitness training and more time to recovery is
needed. Accordingly, Kraemer et al., (25) observed that starter players who
usually accumulate more match playing time experience greater performance
decrements in some fitness parameters. Curiously, no relationship was
observed in the present study between changes in YYIE2 and IMPT.
An intriguing finding was that players with lower increments or higher
decrements in KFD (E1 to E2), H/QD (E1 to E2 and E2 to E3) or H/QND ratio
(E3 to E4) showed higher improvements in agility performance. These results
suggest that improvements in flexors strength and H/Q ratios seem to be on the
opposite direction of agility development. A possible explanation could be that
the decrease in H/Q strength ratio, allowed the increment of acceleration
capacity resulting from the increase of KE activation and from the reduction of
the antagonist KF coactivation during the knee extension task (50).
The present results showed that improvements in KED from E1 to E2, KEND
from E3 to E4 (fig. 4), and CMJ from E1 to E2 were significantly correlated with
the performance improvement in short sprints. KE also showed significant
correlations with the CMJ (E1) and T5 (E4; KED). Moreover, high correlations
between CMJ and T30 (E1, E2 and E3) and T5 (E3 and E4; fig.4) were
observed. Previous studies (19,48) showed that players with improvements in
CMJ and in strength experienced improvements in short-sprint performance. As

165
proposed by other researchers (19), this may suggest a possible transfer from
leg power strength gains into enhanced sprint performance. In fact, there were
significant associations between the different functional tests that rely in power
activities (CMJ, T5, T30 and Agility; Fig. 3) in the different evaluation time
points. Moreover, from E1 to E2 we observed that the players with higher
improvements in KED showed lower improvements in YYIE2 (r= - 0.568;
p<0.05). However, during the same period a higher improvement in YYIE2 was
parallel to an improvement in a muscle power test (CMJ). It has been reported
that concurrent muscle training and high intensity interval training performed
during preseason could lead both to improvements in muscle power (10 and 30-
m sprint, vertical jump) and in intermittent endurance performance (YYIR1)(49).
However, after the observation of an increment in both CMJ and YYIE2
performance during preseason in the present study, no relationships between
the two physical fitness parameters and/or their changes were found.
Top level soccer players are usually involved in the weekly matches of the
national leagues and very often in international commitments. These
competitive demands may impose strains to various physiological systems
including musculoskeletal, nervous, immune and metabolic (7,9,25,36), to a
point where the managing of player`s physical fitness trough training and
recovery strategies became influential to maximize match performance. Thus,
the knowledge on the relationship between IMPT and PFP throughout the
season would be helpful in the management of training programs including the
time scheduling of official and “friendly” matches and specific training sessions.
During the 90 min of the match, soccer players can perform 10-20 sprints, a
high intensity running every 70s, about 15 tackles, 10 headings, 50
involvements with the ball, and 30 passes, as well as changing pace and
sustaining forceful contractions to maintain balance and control of the ball
against defensive pressure (43). Therefore, high stress levels are imposed on
the neuromuscular system in order to cope with this essential muscle power
based efforts. As already observed in other intermittent team sports such as
handball (18,20), individual match playing time (IMPT) seems to influence
players’ fitness during season. In fact, according with our results, players with

166
more accumulated IMPT from E1 to E3 showed higher improvements in T5 (r= -
0.705; p<0.01; Fig. 5). This suggests that the short bursts of acceleration
required during games could have a positive effect in developing players` ability
to accelerate (15,48). It was observed that players with higher IMPT showed
both higher increments and lower decrements in KEND (r= 0.786; p<0.05; E2 to
E3), KFD and KFND (r=0.575 and 0.590, respectively; p<0.05; E3 to E4).
Accordingly with our data, Kraemer et al., (25) observed that during and after an
11-week competitive soccer season, collegiate soccer players’ KF strength did
not significantly decreased as much has KE. Moreover, the authors observed
that starter players showed higher values of KF in the different evaluation
points. Additionally, we observed that the correlation coefficients between IMPT
and individual changes in H/Q ratio were r= - 0.738 (p<0.05) from E2 to E3 and
changed to a positive value of r = 0.794 (p<0.05) from E3 to E4 (Fig. 6),
reflecting the different impact of IMPT in KE and KF in the different evaluations
throughout the competitive period. The observed relationship between IMPT
and these PFP suggests that male professional soccer players with higher
IMPT have higher capabilities to increase or maintain muscle strength (KE and
KF) and sprint (T5) throughout the season, i.e., competition time may possibly
contribute to influence certain physical characteristics of professional soccer
players. In fact, it was evidenced that after the game KF is affected by fatigue
and muscle damage and the KF reduction follows the increase in some indirect
markers of muscle damage (1,3,28). Moreover, KF were also referred as a
muscle group less resistant to fatigue than KE (40) that shows after a match
higher force decrements (1,21) and longer period of muscle soreness (46) than
extensors muscles. This may explain at least partially the higher adaptations
found in this muscle group in players with more IMPT between E3 and E4. In
fact, muscle adapts to training regimens that engage them in stretch-shortening
cycles and are impaired less with repeated exposure (37).

167
PRATICAL APLICATIONS
This study showed that changes in different parameters of soccer players`
fitness are observed throughout a soccer season. In this way, a proper control
of training and competition workloads and their impact should be monitored.
The preseason improvements in players` physical fitness from start (E1) to the
end of the season (E4), makes logical to conclude that during offseason players
experiment pronounced effects of detraining in jump ability and agility, and
intermittent endurance capacity. Thus, male professional soccer players should
perform a specific training program or participate in active leisure activities in
order to attenuate reductions in training status that results from offseason
period as well as to better cope preseason training loads. Coaches should be
aware that the interrelationship between KE strength, 5-m and 30-m sprint time
and CMJ performance suggest that muscle strength and power training should
be an important component of soccer training. Moreover, given that during the
in-season, the isolated completion of functional strength exercises may be
insufficient to maintain the jump ability of professional players, the incorporation
of some form of weight training (e.g. combined weight and plyometric training)
might be beneficial. The present study suggests that the systematic
participation in soccer matches favors the increase and maintenance of male
professional soccer players` muscle strength and sprint ability. Thus, given the
unique demands of actual match play, coaches should try to incorporate a
competitive friendly match in the weekly training cycle of non-starter players.
ACKNOWLEDGEMENTS
We thank to the technical staff and to the soccer players of the team
participating in the study. The results of the present study do not constitute
endorsement by NSCA.

168
References
1. Andersson, H, Raastad, T, Nilsson, J, Paulsen, G, Garthe, I, and Kadi, F.
Neuromuscular fatigue and recovery in elite female soccer: effects of active
recovery. Med Sci Sports Exerc 40: 372-380, 2008.
2. Arnason, A, Andersen, TE, Holme, I, Engebretsen, L, and Bahr, R.
Prevention of hamstring strains in elite soccer: an intervention study. Scand J
Med Sci Sports 18: 40-48, 2008.
3. Ascensao, A, Rebelo, A, Oliveira, E, Marques, F, Pereira, L, and Magalhaes,
J. Biochemical impact of a soccer match - analysis of oxidative stress and
muscle damage markers throughout recovery. Clin Biochem 41: 841-851, 2008.
4. Aziz, A, Tan, F, and Teh, K. Variation in selected fitness attributes of
professional soccer players during a league season. In: Science and Football V.
T. Reilly, D. Araújo and J. Cabri (Eds.): London/New York: E and FN Spon,
2005, pp. 134-138.385
5. Bangsbo, J. Fitness training in football - a scientific approach.: HO+ Storm,
Bagsvaerd, 1994.
6. Bangsbo, J, Iaia, FM, and Krustrup, P. The Yo-Yo intermittent recovery test :
a useful tool for evaluation of physical performance in intermittent sports. Sports
Med 38: 37-51, 2008.
7. Bangsbo, J, Mohr, M, and Krustrup, P. Physical and metabolic demands of
training and match-play in the elite football player. J Sports Sci 24: 665-674,
2006.
8. Bosco, C, Komi, PV, Tihanyi, J, Fekete, G, and Apor, P. Mechanical power
test and fiber composition of human leg extensor muscles. Eur J Appl Physiol
Occup Physiol 51: 129-135, 1983.
9. Brites, FD, Evelson, PA, Christiansen, MG, Nicol, MF, Basilico, MJ, Wikinski,
RW, and Llesuy, SF. Soccer players under regular training show oxidative
stress but an improved plasma antioxidant status. Clin Sci (Lond) 96: 381-385,
1999.
10. Caldwell, BP, and Peters, DM. Seasonal variation in physiological fitness of
a semiprofessional soccer team. J Strength Cond Res 23: 1370-1377, 2009.

169
11. Casajus, JA. Seasonal variation in fitness variables in professional soccer
players. J Sports Med Phys Fitness 41: 463-469, 2001.
12. Castagna, C, Impellizzeri, F, Chamari, K, Carlomagno, D, and Rampinini,
E. Aerobic fitness and Yo-Yo continous and intermittent tests performances in
soccer players: A correlation study. J Strength Cond Res 20: 320-325, 2006.
13. Clark, N, Edwards, AM, Morton, R, and Butterly, J. Season-to-season
variation of physiological fitness within a squad of professional male soccer
players. Journal of Sports Science and Medicine 7: 157-165, 2008.
14. Cometti, G. Los Métodos modernos de Musculación. Barcelona, Spain:
Editorial Paidotribo, 1998.
15. Cometti, G, Maffiuletti, NA, Pousson, M, Chatard, JC, and Maffulli, N.
Isokinetic Strength and Anaerobic Power of Elite, Subelite and Amateur Soccer
Players. Int J Sports Med 22: 45-51, 2001.
16. Croisier, JL, Ganteaume, S, Binet, J, Genty, M, and Ferret, JM. Strength
imbalances and prevention of hamstring injury in professional soccer players: a
prospective study. Am J Sports Med 36: 1469-1475, 2008.
17. Dauty, M, Potiron-Josse, M, and Rochcongar, P. Identification of previous
hamstring muscle injury by isokinetic concentric and eccentric torque
measurement in elite soccer player. Isokinetics and Exercise Science 11: 139-
144, 2003.
18. Gorostiaga, EM, Granados, C, Ibanez, J, Gonzalez-Badillo, JJ, and
Izquierdo, M. Effects of an entire season on physical fitness changes in elite
male handball players. Med Sci Sports Exerc 38: 357-366, 2006.
19. Gorostiaga, EM, Izquierdo, M, Ruesta, M, Iribarren, J, Gonzalez-Badillo, JJ,
and Ibanez, J. Strength training effects on physical performance and serum
hormones in young soccer players. Eur J Appl Physiol 91: 698-707, 2004.
20. Granados, C, Izquierdo, M, Ibanez, J, Ruesta, M, and Gorostiaga, EM.
Effects of an entire season on physical fitness in elite female handball players.
Med Sci Sports Exerc 40: 351-361, 2008.
21. Greig, M. The influence of soccer-specific fatigue on peak isokinetic torque
production of the knee flexors and extensors. Am J Sports Med 36: 1403-1409,
2008.

170
22. Harris, N, Cronin, J, and Keogh, J. Contraction force specificity and its
relationship to functional performance. J Sports Sci 25: 201-212, 2007.
23. Impellizzeri, FM, Rampinini, E, and Marcora, SM. Physiological assessment
of aerobic training in soccer. J Sports Sci 23: 583-592, 2005.
24. Izquierdo, M, Ibanez, J, Gonzalez-Badillo, JJ, Ratamess, NA, Kraemer, WJ,
Hakkinen, K, Bonnabau, H, Granados, C, French, DN, and Gorostiaga, EM.
Detraining and tapering effects on hormonal responses and strength
performance. J Strength Cond Res 21: 768-775, 2007.
25. Kraemer, WJ, French, DN, Paxton, NJ, Hakkinen, K, Volek, JS,
Sebastianelli, WJ, Putukian, M, Newton, RU, Rubin, MR, Gomez, AL, Vescovi,
JD, Ratamess, NA, Fleck, SJ, Lynch, JM, and Knuttgen, HG. Changes in
exercise performance and hormonal concentrations over a big ten soccer
season in starters and nonstarters. J Strength Cond Res 18: 121-128, 2004.
26. Lemmink, KA, Visscher, C, Lambert, MI, and Lamberts, RP. The interval
shuttle run test for intermittent sport players: evaluation of reliability. J Strength
Cond Res 18: 821-827, 2004.
27. Magalhães, J, Oliveira, J, Ascensao, A, and Soares, J. Concentric
quadriceps and hamstrings isokinetic strength in volleyball and soccer players.
J Sports Med Phys Fitness 44: 119-125, 2004.
28. Magalhaes, J, Rebelo, A, Oliveira, E, Silva, JR, Marques, F, and Ascensao,
A. Impact of Loughborough Intermittent Shuttle Test versus soccer match on
physiological, biochemical and neuromuscular parameters. Eur J Appl Physiol:
2009.
29. Maio Alves, JM, Rebelo, AN, Abrantes, C, and Sampaio, J. Short-term
effects of complex and contrast training in soccer players' vertical jump, sprint,
and agility abilities. J Strength Cond Res 24: 936-941, 2010.
30. Malliou, P, Ispirlidis, I, Beneka, A, Taxildaris, K, and Godolias, G. Vertical
jump and knee extensors isokinetic performance in professional soccer players
related to the phase of the training period. Isokinetics and Exercise Science 11:
165-169, 2003.
31. Mercer, TH, Gleeson, NP, and Mitchell, J. Fitness profiles of professional
soccer players before and after pre-season conditioning. In: Science and
171
Footbal III. T. Reilly, J. Bangsbo and M. Hughes (Eds.): London: E & FN Spon,
1997, pp. 112-117.253
32. Metaxas, T, Sendelides, T, Koutlianos, N, and Mandroukas, K. Seasonal
variation of aerobic performance in soccer players according to positional role. J
Sports Med Phys Fitness 46: 520-525, 2006.
33. Mohr, M, Krustrup, P, and Bangsbo, J. Match performance of high-standard
soccer players with special reference to development of fatigue. J Sports Sci
21: 519-528, 2003.
34. Mujika, I, and Padilla, S. Muscular characteristics of detraining in humans.
Med Sci Sports Exerc 33: 1297-1303, 2001.
35. Rampinini, E, Sassi, A, Azzalin, A, Castagna, C, Menaspa, P, Carlomagno,
D, and Impellizzeri, FM. Physiological determinants of Yo-Yo intermittent
recovery tests in male soccer players. Eur J Appl Physiol: 2009.
36. Rebelo, A. Studies of fatigue in soccer. PhD thesis. University of Porto,
Porto, 1999.
37. Reilly, T, Drust, B, and Clarke, N. Muscle fatigue during football match-play.
Sports Med 38: 357-367, 2008.
38. Reilly, T, and Ekblom, B. The use of recovery methods post-exercise. J
Sports Sci 23: 619-627, 2005.
39. Reilly, T, and Williams, A. Science and Soccer (2nd Edition). London:
Routledge, 2003.
40. Sangnier, S, and Tourny-Chollet, C. Study of the fatigue curve in
quadriceps and hamstrings of soccer players during isokinetic endurance
testing. J Strength Cond Res 22: 1458-1467, 2008.
41. Semenick, D. The T-test. Natl. Strength Cond. Assoc. J. 12: 36-37, 1990.
42. Sporis, G, Ruzic, L, and Leko, G. The anaerobic endurance of elite soccer
players improved after a high-intensity training intervention in the 8-week
conditioning program. J Strength Cond Res 22: 559-566, 2008.
43. Stolen, T, Chamari, K, Castagna, C, and Wisloff, U. Physiology of soccer:
an update. Sports Med 35: 501-536, 2005.
44. Svensson, M, and Drust, B. Testing soccer players. J Sports Sci 23: 601-
618, 2005.

172
45. Tessitore, A, Meeusen, R, Cortis, C, and Capranica, L. Effects of different
recovery interventions on anaerobic performances following preseason. J
Strength Cond Res 21: 745-750, 2007.
46. Thompson, D, Nicholas, CW, and Williams, C. Muscular soreness following
prolonged intermittent high-intensity shuttle running. J Sports Sci 17: 387-395,
1999.
47. Wilson, JM, and Flanagan, EP. The role of elastic energy in activities with
high force and power requirements: a brief review. J Strength Cond Res 22:
1705-1715, 2008.
48. Wisloff, U, Castagna, C, Helgerud, J, Jones, R, and Hoff, J. Strong
correlation of maximal squat strength with sprint performance and vertical jump
height in elite soccer players. Br J Sports Med 38: 285-288, 2004.
49. Wong, PL, Chaouachi, A, Chamari, K, Dellal, A, and Wisloff, U. Effect of
preseason concurrent muscular strength and high-intensity interval training in
professional soccer players. J Strength Cond Res 24: 653-660, 2010.
50. Young, W. Transfer of strength and power training to sports performance.
International Journal of Sports Physiology and Performance 1: 74-83, 2006.

173
Table 1. Physical characteristics of the professional soccer players at the four
test occasions.
Variable E1 E2 E3 E4
Age (yrs) 25.7 + 4.6 25.4 + 4.7 26.9 + 4.3 27.1 + 4.3
Weight (kg) 76.5 + 9.2 76.2 + 9.3 76.3 + 8.4 77.7 + 9.1
Height (cm) 178.1 + 5.7 177.8 + 5.7 178.7 + 6.6 179.1. + 6.6
Fat Mass (%) 9.8+3.7 9.5+2.7 9.3+3.0 9.1+3.1
Values are mean ± SD. E1 – evaluation 1 (Prior to pre-season), E2 – evaluation 2 (End
of pre-season) E3 - evaluation 3 (Mid-season), E4 – evaluation 4 (End-of-season)

174

175
Table 2. Variation of different performance measurements in the four evaluation
moments throughout the soccer season
Variables E1 E2 E3 E4 G. S.
T 5 m (s) 1.032 ± 0.11 1.056 ± 0.05 1.017 ± 0.06 1.033 ± 0.07 1.033
T 30 m (s) 4.164 ± 0.18 4.217 ± 0.15 4.137 ± 0.14 * 4.16 ± 0.17 4.169
CMJ (cm) 42.44 ± 4.04 44.84 ± 4.5** 42.84 ± 4.4 42.23 ± 4.38 43.08
T-test (s) 8.714 ± 0.33 8.745 ± 0.36 8.408 ± 0.27†
8.498 ± 0.27† 8.591
Values are mean ± SD. * p< 0.01 E3 vs E2; ** p< 0.05 E2 vs. E1, E3 and E4; †p< 0.01 E3 and
E4 vs E1 and E2; E1 – evaluation moment 1 (Prior to pre-season), E2 – evaluation moment 2
(End of pre-season) E3 - evaluation moment 3 (Mid-season), E4 – evaluation moment 4 (End-
of-season); G.S.- Global Sample; T5m – 5 meters sprint time; T30m – 30 meters sprint time;
CMJ – countermovement jump.

176
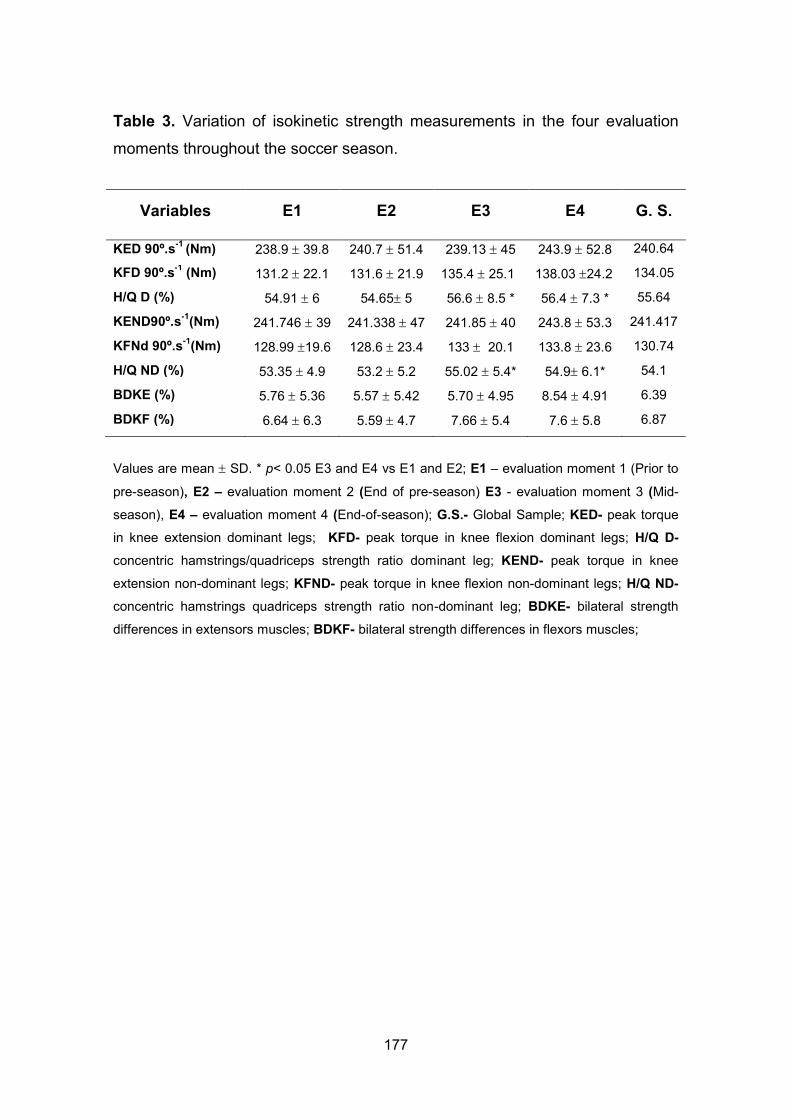
177
Table 3. Variation of isokinetic strength measurements in the four evaluation
moments throughout the soccer season.
Variables E1 E2 E3 E4 G. S.
KED 90º.s-1
(Nm) 238.9 ± 39.8 240.7 ± 51.4 239.13 ± 45 243.9 ± 52.8 240.64
KFD 90º.s-1
(Nm) 131.2 ± 22.1 131.6 ± 21.9 135.4 ± 25.1 138.03 ±24.2 134.05
H/Q D (%) 54.91 ± 6 54.65± 5 56.6 ± 8.5 * 56.4 ± 7.3 * 55.64
KEND90º.s-1
(Nm) 241.746 ± 39 241.338 ± 47 241.85 ± 40 243.8 ± 53.3 241.417
KFNd 90º.s-1
(Nm) 128.99 ±19.6 128.6 ± 23.4 133 ± 20.1 133.8 ± 23.6 130.74
H/Q ND (%) 53.35 ± 4.9 53.2 ± 5.2 55.02 ± 5.4* 54.9± 6.1* 54.1
BDKE (%) 5.76 ± 5.36 5.57 ± 5.42 5.70 ± 4.95 8.54 ± 4.91 6.39
BDKF (%) 6.64 ± 6.3 5.59 ± 4.7 7.66 ± 5.4 7.6 ± 5.8 6.87
Values are mean ± SD. * p< 0.05 E3 and E4 vs E1 and E2; E1 – evaluation moment 1 (Prior to
pre-season), E2 – evaluation moment 2 (End of pre-season) E3 - evaluation moment 3 (Mid-
season), E4 – evaluation moment 4 (End-of-season); G.S.- Global Sample; KED- peak torque
in knee extension dominant legs; KFD- peak torque in knee flexion dominant legs; H/Q D-
concentric hamstrings/quadriceps strength ratio dominant leg; KEND- peak torque in knee
extension non-dominant legs; KFND- peak torque in knee flexion non-dominant legs; H/Q ND-
concentric hamstrings quadriceps strength ratio non-dominant leg; BDKE- bilateral strength
differences in extensors muscles; BDKF- bilateral strength differences in flexors muscles;

178

179
Table 4. Variation of YYIET2 measurements in the four evaluation moments
throughout the soccer season.
Variables E1 E2 E3 E4 G. S.
YYIETL2 (m) 1120 ± 187.6 2250 ± 296 * - 1640 ± 196** 1670
HRmax (bpm) 197.9 ± 8.3 196 ± 7.1 - 196.1± 9.0 196.9
HRmean (bpm) 181.6 ± 9.6 180.9 ± 7 - 176 ± 9.8 179.5
Values are mean ± SD. * p< 0.01 E2 vs E1; ** p< 0.05 E4 vs E1 and E2; E1 – evaluation
moment 1 (Prior to pre-season), E2 – evaluation moment 2 (End of pre-season) E3 - evaluation
moment 3 (Mid-season), E4 – evaluation moment 4 (End-of-season); G.S.- Global sample;
YYIET2 – Yo-Yo intermittent endurance test level 2; HRmax – maximal heart rate; HRmean –
mean heart rate, m – meters, bpm – beats per minute.

180

181
FIGURES
Figure 1 – Season time-line. E1 – evaluation moment 1 (Prior to pre-season); E2 –
evaluation moment 2 (End of pre-season); E3 – evaluation moment 3 (Mid-season); E4
– evaluation moment 4 (End-of-season); YYIE2 – Yo-Yo intermittent endurance test
level 2; IS – isokinetic strength; CMJ – countermovement jump; T5 - 5 meters sprint
time; T30 - 30 meters sprint time; W – week; 8FM – eight friendly matches; 1 OM - one
official match per week; 2 OM - two official matches per week; 1FM – one friendly
match per week; 2FM - two friendly matches per week; 3FM - three friendly matches
per week.

182

183
Figure 2 - Layout of the T-test. Modified from Semenick (1990). Brief explanation
Figure 3 – Relationship between counter movement jump (CMJ) and 5 meters sprint
time (T5) in E4;

184

185
Figure 4 – Relationship between changes in peak torque knee extensors non-
dominant leg (KEND) and 5 meters sprint time (T5) from E3 to E4;
Figure 5 – Relationship between individual match playing time (IMPT) and changes in
5 meters sprint time (T5) from E1 to E3;

186

187
Figure 6 – Relationship between individual match playing time (IMPT) and changes in
hamstrings/quadriceps strength ratio non-dominant leg (H/Q ND) from E3 to E4;

188

189
Experimental Work
Study II
TITLE: Neuromuscular function, hormonal, redox status and muscle damage
markers in high-level players throughout a competitive soccer season.
RUNNING HEAD: Seasonal variations in stress and performance indicators
Authors:
João R. Silva1,5, António Ascensão2,4, Franklim Marques3, António Rebelo1,5, José
Magalhães2,4
Affiliations:
1 University of Porto, Faculty of Sport, Department of Soccer, Porto, Portugal
2 University of Porto, Faculty of Sport, Department of Sports Biology, Porto,
Portugal
3 Department of Clinical Analysis, Faculty of Pharmacy; Institute for Molecular
and Cell Biology (IBMC), University of Porto, Porto, Portugal
4 Research Center in Physical Activity, Health and Leisure (CIAFEL)
5 Center of Research, Education, Innovation and Intervention in Sport (CIFI2D)
Under Review

190

191
Abstract
This study aims to analyze the changes in performance and stress-related
markers of professional players throughout the season (N=14). 5 and 30-m
sprint, jump and change of direction performance, and maximal isokinetic knee
extension (KE) and flexion (KF) were evaluated in four time-points (E1-E4).
Plasma testosterone/cortisol ratio (T/C), creatine kinase (CK), superoxide
dismutase (SOD), glutathione peroxidase (GPX) and reductase (GR) activities,
myoglobin (Mb), C-reactive protein (CRP), uric acid (UA), protein sulfhydryls (-
SH), malondialdehyde (MDA) contents and total antioxidant status (TAS) were
also measured. Cortisol (C) decreased and T/C increased in E2 and E3
(P<0.01-0.05). Mb, CK and PCR increased at E2 and PCR (P<0.01-0.05) in E3.
SOD, SOD/GPX, –SH and MDA increased at E2 and E3 (P<0.01-0.05). From
E2-E3, T/C and SOD/GPX increased and C, Mb and GR (P<0.01-0.05)
decreased. Off-season resulted in decreased T/C, CK, SOD, SOD/GPX, -SH
and MDA an increased C and GR (P<0.05). Changes in T/C were correlated
with changes in KF dominant (KFDE2-E3; r=0.858) and non-dominant leg
(KFNDE2-E3; r=0.848) from E2-E3. In E3, T/C ratio was associated with KFND
and KE dominant leg (KED; r=0.563-0.636). A negative association between C
and KE and KF (r=-0.636-0.677) was found in E3. In E2, significant correlations
were observed between individual match playing time (IMPTE2), performance
and biochemical variables (r=0.456-0.615). Our data suggest that professional
players although submitted to high level of stress possess an efficient capability
to cope with the season stressful demands. Additionally, the systematic
participation of the players in matches influences performance and biochemical
responses.
Keywords: training status; training period; performance testing; neuromuscular
function; blood monitoring; anabolic:catabolic status; oxidative stress; muscle
damage; recovery;

192
193
Introduction
Soccer players are submitted to a high level of physical and physiological stress
during training and matches. These high demands are confirmed by players’
activity pattern analysis during the matches (Rampinini et al. 2007; Osgnach et
al. 2010), as well as by the magnitude of the post-match performance
impairments, biochemical responses and temporal kinetics of recovery
(Magalhaes et al. 2010; Andersson et al. 2008). Despite the high demands
imposed to players during nine months of regular match play (competitive
season), the integrative analysis of the longitudinal changes in players’ physical
performance and in stress bio-markers are limited. In fact, high volumes of
training and/or competition interspersed by insufficient recovery may induce
fatigue (Filaire et al. 2003) and ultimately an overreaching state (Kraemer and
Ratamess 2005). Nevertheless, different investigations using distinct
methodological designs to analyse longitudinal changes in soccer players
physical fitness challenged the common concept amongst the soccer population
(e.g. technical and medical staff) that players may accumulate ‘‘fatigue’’ during
periods of heavy match commitments (Meister et al. 2011) and/or as the season
progresses (Silva et al. 2012; Silva et al. 2011; Faude et al. 2011; Rampinini et
al. 2007). In fact, although contradictory reports regarding performance
impairments have been published (Kraemer et al. 2004; Silva et al. 2011;
Jensen et al. 2009; Rampinini et al. 2007; Faude et al. 2011) there are
increasing evidence of psychometric deteriorations (e.g. increased tension,
anger) towards the end of season (Rebelo 1999; Filaire et al. 2003; Faude et al.
2011) that may suggest a state of non-functional overreaching/overtraining.
Additionally, the occurrence of inadequate immune function during periods of
high physical stress has been reported (Reinke et al. 2009; Rebelo et al. 1998).
Moreover, alterations in soccer players’ anabolic-catabolic hormonal
environment (Kraemer et al. 2004; Handziski et al. 2006) and increased levels
of oxidative stress were reported after high-intensity periods of soccer training
(pre-season) (Arent et al. 2010). Therefore, in research protocols aimed to
study physical performance, fatigue and recovery in sport, a multi-dimensional

194
test panel should be included to achieve a higher efficiency of the monitoring
process (Bishop et al. 2008; Faude et al. 2011). In fact, in addition to sport-
specific performance parameters, hormonal, oxidative and muscle damage
markers have been suggested as important bio-markers during training
monitoring in different athletic populations (Kraemer and Ratamess 2005;
Bishop et al. 2008; Rebelo 1999).
Evidence-based scientific data regarding the putative relationships between
soccer players’ physical fitness, hormonal environment and oxidative status
under demanding soccer competitive stress conditions are limited. Moreover,
despite the growing number of match commitments in the national and
international context, the influence of the individual match playing time during
season on the referred parameters is lacking. On the other hand, one of the
less understood and more scarcely studied periods of the soccer season is the
off-season. Therefore, studies investigating if off-season allow players to
recover their organic homeostasis are needed. Knowledge clarifying this gap in
literature may allow improving the management of training periodization,
competition scheduling, and, eventually, of specific ergogenic interventions
(e.g., antioxidants supplementation).
The present study intends to examine, for the first time, alterations in
performance, hormonal, oxidative and muscle damage parameters throughout
the season and during the recovery period in the same cohort of professional
soccer players. We also aim to determine the relationships between players’
individual match playing time and physiological and physical performance
changes.
Methods
Subjects
A group of 20 male professional outfield soccer players (mean + standard
deviation: 25.7 + 4.6 years, body mass 76.5 + 9.2 kg, height 178.1 + 5.7 cm, fat
percentage 9.8 + 3.7%) from a team competing in the Portuguese Professional
Soccer League were involved in this study. As a result of injuries (n=2) and

195
transferences to other clubs (n=4), 6 players were not considered in the
analysis (n=14). In each evaluation, only free of injury players involved in the full
training schedules were tested. In accordance with the club policy, all soccer
players underwent usual physical examination in the beginning and throughout
the season (e.g. blood sample analyzes, rest ECG, lung x-Ray). The subjects
were not taking exogenous anabolic–androgenic steroids or other drugs or
substances expected to affect physical performance or hormonal balance
throughout the different assessment moments. The players perform several in
or out of competition doping control tests undertaken by the Portuguese Anti-
doping Authority. The subjects were not taking any medications that would have
an impact on the results of the study.
The experimental protocol was approved by the local board, and followed the
Declaration of Helsinki of the World Medical Associations for research with
humans. All participants were fully informed about the aims, experimental
protocol and procedures, and provided written informed consent.
Experimental design
As presented in figure 1, the different physical tests and blood sample
collections were performed in the same order and in the same period of the day
on four time points of a soccer season as follows: 1st evaluation (E1) – before
the beginning of the preparation period of the 1st soccer season (July); 2nd
evaluation (E2) - middle of the competitive season (January); 3rd evaluation (E3)
end of the competitive season (May); 4th evaluation (E4) – after the end of the
recovery period and before the beginning of the preparation period of the 2nd
soccer season (July). All the evaluations were performed after 72-h of the last
official match. In the two days preceding evaluations, the players had a day-off
(1st day) and a training session (2nd day) including low intensity exercises
aiming to improve post-match recovery. In E1 E2 and E3, blood samples were
collected and players were evaluated for basic anthropometry,
countermovement vertical jump (CMJ), sprint and change of direction abilities,
knee extensor and flexor maximal strength. In E4, blood samples collections
were again obtained. Players’ individual match playing time was registered

196
throughout the season. The final individual match playing time of each player
(IMPT; sum of all minutes played by a player throughout all the competition
period) was used to analyse the association between performance and
biochemical variables.
*figure 1 about here
Procedures
In order to match the circadian rhythms of the different variables, the different
time points of blood sample and functional data measurements were coincident.
As so, blood samples and functional data were obtained after an overnight fast
between 09.00 and 12.00. Procedures order were as follows: 1st - Blood
samples collection; 2nd- CMJ, 3rd- T5 and T30, 4th- COD and 5th- Isokinetic
strength. In the laboratory, a resting blood sample was taken after subjects
have been standing for at least 15 min, after which subjects consumed a light
standardized meal and drink and rested for 2 h. The meal consisted of 1.7 g
white bread and 0.3 g of low-fat spread; both values are per kilogram of body
mass (Thompson et al. 2003) The CMJ, sprint ability and COD tests were
conducted in indoor facilities. Before the tests, all the players performed a 10 to
15 minutes (min) warm-up consisting of light jogging, specific mobility exercises
and stretching routine, and 10 meters (m) sprints. Players completed two
rounds of each test in the same sequence and the best result was considered
for analysis. Each subject was allowed to a minimum of 5-min rest between
tests to ensure adequate recovery. All the evaluations took place at the same
time of the day, after a regular overnight sleep (0800-11.00 a.m.). Players were
instructed to maintain normal routines for daily food and water intake, and
followed the same dietary recommendations defined by the medical staff. In
addition, during the days of physical tests, players were instructed to refrain
from drinking beverages containing caffeine and/or alcohol and from consuming
food during the 2 hours before testing.
Physical Performance Tests
Counter-movement Jump (CMJ)

197
The CMJ was performed using a platform, Ergojump (Digitime 1000, Digest
Finland) according to (Bosco et al. 1983) whereby the highest vertical jump (cm)
and the longest flying time (s) were registered. The best trial of the two jumps
was used for data analyses. The apparatus consisted of a digital timer
connected by a cable to a jump platform, Ergojump (Digitime 1000, Digest
Finland).
Sprint ability
Sprint measurements were carried out using telemetric photoelectric cells
(Brower Timing System, IRD-T175, Utah, USA) mounted on tripods positioned
approximately 0.75-m above the floor and situated 3-m apart facing each other
on either side of the starting line (0 m), at 5 and at 30-m. The players stood 0.3-
m behind the starting line, started at their own discretion, being time activated
when players cross the first pair of photocells, and they ran as fast as they
could to complete 30-m distance. The fastest trial was used for data analyses.
Change of direction ability (COD)
Change of direction ability (COD) was evaluated using an agility test (T-test). T-
test does not include a perceptual or decision making component and can be
used to measure change of direction ability. An adapted version of the T-test by
Semenick (Semenick 1990) was performed. Subjects began with both feet 0.3-
m behind the starting point A. At their own discretion, each subject sprinted
forward 9.14-m (10 yd) to point B and touched the base of the cone with the
right hand. They than sprinted to the left 4.57-m (5 yd) and touched the base of
a cone (C) with the left and. Subjects then sprinted to the right 9.14-m (10 yd)
and touched the base of a cone (D) with the right hand. They then sprinted to
the left 4.57-m back to point B and touched the base of a cone with the left
hand. They turn 270º and then ran to point A, passing the finishing line. Two
test trials were performed, and times were recorded to the nearest one-
hundredth of a second. As described for sprint ability, measurements were
carried out using telemetric photoelectric cells (Brower Timing System, IRD-
T175, Utah, USA). The players stood 0.3-m behind the starting line, being time

198
activated when they passed the electronic sensors, and the clock stopped the
instant players again crossed the Point A. The fastest trial was used for data
analyses.
Strength assessment
In order to evaluate muscle function, subjects were familiarized with the muscle
function test on at least two occasions during preliminary visits to the laboratory.
Maximal gravity corrected concentric peak torque of quadriceps and hamstrings
was measured during isokinetic knee joint movement of dominant leg at an
angular velocity of 90º.s-1 (1.57 rad.s-1) using a isokinetic dynamometer (Biodex
System 2, USA) . After individual self-report, the dominant leg was determined
by a routine visual inspection in a simple target kicking test requiring accuracy.
Prior to muscle function measurements, subjects perform a standardized warm-
up consisting of 5-min period on a cycle ergometer (Monark E-824) with a fixed
load corresponding to 2% of body weight. Players were then seated on the
dynamometer chair at 85º inclination (external angle from the horizontal) with
stabilization straps at the trunk, abdomen and thigh to prevent inaccurate joint
movements. The contralateral leg was not secured to avoid influencing the
strength developed by the knee being tested. The knee to be tested was
positioned at 90º of flexion (0º= fully extended knee) and the axis of the
dynamometer lever arm was aligned with the distal point of the lateral femoral
condyle. Before the anatomical alignments and procedures, all the subjects
were instructed to kick and also to bend the tested leg as hard and as fast as
they could through a complete range of motion (from 90º to 0º). Subjects were
also instructed to hold their arms comfortably across their chest to further
isolate knee joint flexion and extension movements. All subjects also performed
a specific sub-maximal warm-up protocol on the Biodex device in order to
familiarize with the isokinetic device and test procedure. Three maximal
repetitions at angular velocity 90º.s-1 (1.57 rad.s-1) were therefore carried out.
The higher peak torque value was used for data analyses.

199
Blood sampling and preparations
All the venous blood samples were taken by conventional clinical procedures
using EDTA as anticoagulant. Nevertheless, no tourniquet was used in order to
minimize potentially oxidative stress induced by an ischemia-reperfusion
maneuver.
The freshly withdraw blood (~10ml) was immediately centrifuged at 3000 rpm
during 10 minutes for careful removal of the plasma. Plasma was separated into
several aliquots and rapidly frozen at – 80ºC for later biochemical analysis of
plasma total testoterone (T), cortisol (C), myoglobin (Mb), creatine kinase (CK),
uric acid (UA), C-reactive protein (CRP), total antioxidant status (TAS),
superoxide dismutase (SOD) glutathione peroxidase (GPX) and glutathione
reductase (GR), sulfhydryl groups (-SH) and malondialdehyde (MDA).
Biochemical Assays
Plasma testosterone (T) and cortisol (C) were measured immune-enzymatically
using commercial test kits VIDAS® testosterone (REF. 30418) and VIDAS®
cortisol S (REF. 30451).
Plasma creatine kinase (CK) activity was determined spectrophotometrically
using a commercial test kit (ABX A11A01632, Montpellier, FR).
Plasma myoglobin concentration was assessed using a commercial test kit
(myoglobin bioMerieux 30446, Carnaxide, PT).
C-reactive protein (CRP) was measured using an enzyme-linked immune
sorbent assay system (PENTRA 400, Horiba ABX, Montpellier, FR)
Total antioxidant status (TAS) was measured spectrophotometrically using a
commercial kit (Randox NX2332 Crumlin, UK). Uric acid (UA) was determined
by an enzymatic method using a commercial kit (Horiba ABX A11A01670,
Montpellier, France).
Regarding enzyme activities in plasma, superoxide dismutase (SOD) activity
was measured spectrophotometrically at 550 nm using a commercial Ransod kit
from Randox (catalogue no. SD 125, Crumlin,UK). The activity of glutathione
peroxidase (GPX) was assayed by a spectrophotometric technique at 340 nm
using a commercial Ransel kit from Randox (catalogue no. RS 505). The

200
activity of glutathione reductase (GR) was measured with a spectrophotometric
procedure at 340 nm using a commercial GR kit from Randox (catalogue no.
GR 2368).
Plasma MDA was assayed according to Rohn et al., (1993) with some
modifications and measured by the formation of thiobarbituric acid reactive
substances at 535 nm. Plasma SH was spectrophotometrically evaluated at 414
nm according to Hu (1990). Protein content was spectrophotometrically
assayed using bovine serum albumin as standard according to Lowry et al.,
(1951) Samples were analyzed in duplicate and the mean of the two values was
used for statistical analysis.
Statistical Analysis
Mean, standard deviation (SD) and/or standard error mean (SEM) were
calculated. Normality was tested with the Shapiro-Wilks test. After this
assumption, One-way analysis of variance (ANOVA) with repeated measures
was used to establish whether there were differences between evaluations.
Intraclass correlation coefficient was calculated to estimate the reliability of the
physical fitness tests. ICC of all physical fitness tests were estimated using a
test-retest procedure, with a random sub-sample of 9 subjects in each
evaluation moment. The intraclass correlation coefficients (R) of all variables
were high as follows. Counter movement jump: 0.80≤ R ≤ 0.88; sprint time: 0.71
≤ R ≤ 0.87; agility: 0.70 ≤ R ≤ 0.85; Yo-Yo intermittent: 0.80≤ R ≤0.97; and
isokinetic strength: 0.78 ≤ R ≤ 0.98. All data analysis was performed using
SPSS 18.0 package. A significance level of 0.05 was chosen.
Results
Performance parameters
Anthropometric data and results of performance in the different physical fitness
tests are present in Table 1.

201
Biochemical parameters
Figure 2 shows the hormonal changes during the four season time points. No
significant alterations were observed in plasma total testosterone (T; Fig. 2)
concentration in the different time points. Plasma cortisol (C) concentration was
significantly lower in end-of-season than in the remaining time-points (E3; P <
0.01-0.05; Fig. 2). The T/C ratio progressively increased towards competitive
season (E1 and E2 vs E3; P < 0.05) and decreased throughout the recovery
period (P < 0.05; Fig. 2).
Plasma Myoglobin (Mb) and C-reactive protein (CRP) contents and creatine
kinase (CK) activity can be examined in Figure 3. Mb content was higher in E2
(P < 0.05) than in the other time-points (E1 E3 and E4). Plasma CK activity
were higher in E2 than in E1 and E4 (P < 0.01) and in E3 than in E4 (P < 0.05).
Plasma CRP content was higher in E2 and E3 than in E1 (P < 0.05).
Data concerning the variation on the different redox state parameters
throughout the examination period are observed in Figure 4. No significant
alterations in plasma total antioxidant status (TAS) were examined between E1
(1.12 + 0.07 nmol/L), E2 (1.23 + 0.07 nmol/L), E3 (1.16 + 0.05 nmol/L) and E4
(1.11 + 0.066 nmol/L). Plasma uric acid (UA) contents were stable throughout
the different time-points, E1 (5.41 + 0.37 mg/dl), E2 (5.44 + 0.25 mg/dl), E3 (5 +
0.15 mg/dl) and E4 (5.5 + 0.3 mg/dl).
Plasma superoxide dismutase (SOD) activity was elevated in the middle (E2; P
< 0.05; Figure 4) and at the end of competition period (E3; P < 0.01; Figure 4)
than in the beginning of season one (E1). Also a decrement in SOD activity was
observed from E3 to the end of the recovery period (E4; P < 0.05; Figure 4). No
significant alterations in plasma glutathione peroxidase (GPX; Figure 4) activity
during season were examined. Nevertheless, the SOD and GPX kinetics
resulted in a lower SOD/GPX ratio throughout competition (E2 vs E1; P < 0.05;
Figure 4 and E3 vs. E1, E2 and E4; P < 0.05; Figure 4). Moreover, a significant
increment in SOD/GPX ratio was analysed within the competition phase (E2 vs
E3; P < 0.05; Figure 4). Plasma activity of glutathione reductase were lower in
E3 than in E2 (P < 0.01; Figure 4) and E4 (P < 0,05; Figure 4). Plasma protein
sulfhydryl content was higher in E2 and E3 than in E1 and E4 (P < 0.05). Also,

202
an increase in plasma malondialdehyde (MDA) content was analysed in E2 and
E3 than in E1 and E4 (P < 0.01-0.05; Figure 4)
Relationships between biochemical parameters and individual match
playing time (IMPT) and performance in the different time points
We examined that players with the greater individual changes in T/C from E2 to
E3 had the higher individual changes in KFD (KFDE2-E3; r = 0.858; p = 0.003),
KFND (KFNDE2-E3; r = 0.848; p = 0.004) from E2-E3. Also, in E3 an association
between T/C ration and KED (r = 0.563; p = 0.015) and KFND (r = 0.636; p =
0.005) were examined. We also observed a negative association between
plasma concentrations of C and KED (r = -0.646; p = 0.009), KEND (r = - 0.662;
p = 0.004); KFD (r = - 0.677; p = 0.004), and KFND (r = -0.636; p = 0.006) in E3.
In the middle of the season (E2) we examined that players with higher match
playing time (IMPTE2) were also those with better T30 (r = - 0.531; p = 0.019)
and CMJ (r = 0.615; p = 0.009) performance. IMPTE2 were also related to higher
cortisol concentration (r = 0.560; p = 0.024) and lower T/C ratio (r = -0.553; p =
0.033). Also correlations between TAS (r = 0.647; p = 0.003), GPX (r = 0.544; p
= 0.016) and SOD/GPX (r = -0.456; p = 0.050) and IMPTE2 were analysed.
Discussion
Our data confirm that professional soccer players are submitted to high level of
stress throughout the season expressed by increased muscle damage and
oxidative stress markers; however, seem to have an efficient capability to deal
with and sustain these stressful demands. In addition, the recovery period is
related to a decrease in markers of muscle damage and oxidative stress and
players’ individual match playing time influences the response of physical,
hormonal and oxidative stress-related parameters.
In the present study, the professional players improved change of direction
speed (COD) throughout the season without significant alterations in isokinetic
force, sprint or CMJ performance. Improvements in in-season COD ability,
evaluated by other tests, have also been reported in semi-professional players
(Caldwell and Peters 2009). Enhancement in COD speed is an important in-

203
season performance adaptation due to the large number of non-linear high-
intensity running-based activities performed during matches (Bloomfield et al.
2007) and to the high levels of mechanical (e.g. eccentric actions) and
metabolic stress that such actions involve (e.g. acceleration-deceleration
dynamics) (Dellal et al. 2010; Osgnach et al. 2010). Additionally, the better
scores of the different activities based on stretch-shortening cycle actions in E2
may suggest that in the middle of the in-season period players’ neuromuscular
system is more “tuned” to the soccer-specific activities than in end of the
season (E3). Curiously, this better performance scores in E2 occurred in
parallel with peak values of some stress markers (Mb, CK, CRP).
Testosterone (T) and cortisol (C) are two major endogenous indicators of tissue
adaptation, and their ratio represents a biological marker of homeostasis
reflecting the relationship between the anabolic and catabolic hormonal
environment within the body (Hayes et al. 2010; Kraemer et al. 2004; Kraemer
and Ratamess 2005). Throughout the analysed period of the present study,
total plasma T concentration was stable. Similar findings were reported by
Filaire et al., (2003) regarding salivary testosterone alterations throughout the
same season time-points. Moreover, Kraemer et al., (2004) also observed that
T did not change during the soccer competitive period. However, an higher T
was found just one week after the end of the competitive period than in the
initial phase of competition period (Kraemer et al. 2004). Nevertheless, others
did not corroborate this data. For example, Handziski et al., (2006) showed that
in the week of taper that preceded the beginning of competitive season, T was
higher than in the start of pre-season training, but was lower at the end-of-
season than in the former time-points. Regarding C concentration, our results
showed a progressive decline throughout the competitive period with
significantly lower values at the end-of-season (E3) than in the start of both
seasons (E1 and E4) and middle-of-season (E2). Kraemer et al., (2004) did not
examine changes in C concentrations during an 11-week competitive period of
academic soccer players. In contrast with ours and previous data (Kraemer et
al. 2004), low values after the pre-season training (Handziski et al. 2006) and
increases in the end-of season periods have been reported (Filaire et al. 2003;

204
Handziski et al. 2006). As a result of the T and C kinetics, we observed a
progressive increase in T/C until the end-of-season and a decrease during off-
season. Although stable T/C have been reported throughout the soccer season
(Filaire et al. 2003), others (Handziski et al. 2006) observed an increment in T/C
after the preparatory period (week of taper preceding competitive phase)
followed by a decrement in the end-of-season (end-of-season vs pre-and-post
preseason). The different results between studies can be explained, at least
partially, by the differences in the study designs. Handziski et al., (2006) and
Kraemer et al., (2004) analysed the soccer season with different periodization’s
structures (e.g., half-season and 11-wk competitive season, respectively).
Perhaps the length of the preparation period and/or the different densities of
match commitments during the weekly in-season cycles that characterize
distinct periodization structures, may among other factors, explain the different
hormonal kinetics. In line with our observations, studies in other football codes
(Cormack et al. 2008) and team sports (Martinez et al. 2010) reported a
decrease in C and an increase in T/C during the competitive period. The
progressive decrease in C and increase in T/C ratio observed in our study may
reflect an enhanced anabolic environment throughout the competition phase
(Kraemer et al. 1998). Nevertheless, resting hormonal concentration reflects the
current state of muscle tissue and elevations or reductions may occur at various
stages depending on substantial changes in the volume and intensity of the
training phases (Hakkinen et al. 1988), e.g. number of weekly match
commitments. In this regard, data collected by Martinez et al., (2010) in several
in-season time-points showed that high-level basketball players may alternately
increase or decrease catabolic and anabolic-related hormones throughout in-
season. This data seem to highlight that it is possible to correct or avoid
situations of accumulated stress in high competitive contexts. Moreover, it is
appealing to speculate that players’ physical adaptations and/or specificities of
their phenotype resulting from training background may led to a higher ability to
cope with the stress induced by the intermittent nature of the activity in soccer.
Another factor that cannot be excluded is a decreased influence of
psychophysiological factors. In fact, the success of the studied team in this

205
season may have contributed, at least in part, for the decrease in C
concentration, found in the end of season. This same factors may also influence
the E1 and E4 scores, since the beginning of season can be associated with a
high anticipatory level of psychophysiological stress that may influence C
concentrations (Hoffman et al. 2005). In fact, it is recognized that preseason is a
period devoted to players’ selection and squad definitions. On other hand,
Reinke et al., (2009) observed that the reduction of stress levels of professional
soccer players during off-season was related to an increase in catabolic
metabolism (e.g., increased in leukocytes counts and IL-8 ) and a decrease in
soccer players lean body mass (Reinke et al. 2009). Therefore, since resting
cortisol concentrations generally reflect long-term training stress (Kraemer and
Ratamess 2005), the higher C values found during off-season can be related,
among other factors, to a process related to the metabolization of the damage
muscle cells during in-season (Reinke et al. 2009).
On the other hand, reports from academic starter players showed higher C in
the middle of the competition phase than in other time points within the
competition period (Kraemer et al. 2004). Additionally, Kraemer et al., (2004)
observed that T/C increased in non-starters players after one week of recovery
during off-season. However, no changes were examined in starter players
(Kraemer et al. 2004). In this regard, we observed a positive association
between individual match playing time in E2 (IMPTE2) and C values, and a
negative association with T/C ratio at E2. Nevertheless, in this time-point, we
observed that players with higher IMPT were those with greater performance in
power-based efforts (T30 and CMJ) and no association between the hormonal
data and performance was found. It is likely that these increased levels of
catabolic hormonal-related evidences (increased cortisol and decreased T/C
ratio) in players with higher IMPT might have been influenced by muscle
damage induced by training and competitions. Since IMPTE2 was associated
with lower T/C and with a higher performance (T30 and CMJ) its plausible to
question to which extent anabolic/catabolic ratio can be related with
performance, as well as to the magnitude of variation than can influence certain
performance measurements. Although a decrease in anabolic/catabolic ratio

206
have been suggested to decrease performance (Adlercreutz et al. 1986),
different investigations observed that soccer players’ performance increments
can be related with both decrements (Gorostiaga et al. 2004) and higher values
of T/C (Kraemer et al. 2004). In our study, players with greater individual
changes in T/CE2-E3 had the higher individual changes in KFDE2-E3 and KFNDE2-
E3 between the two periods. Furthermore, a positive association between T/C
ratio and KED and KFND values and a negative association between plasma C
and isokinetic knee extensor and flexor force production were examined in E3.
However, since we did not examine the hypothalamo-pituitary-testicular and
adrenal axis-related hormones that mediate the mechanism of T and C
production, as well as other important factors that influence T and C role in the
muscle tissue (e.g., hormone bioavailability, binding proteins, membrane
receptors), the present results should be interpreted with caution.
Soccer competitions and trainings impose an activity pattern that request high
levels of mechanical (e.g. acceleration and decelerations) and/or metabolic
demands (e.g. elevated mitochondrial oxygen consumption). These
characteristics are considered a prone condition to tissue damage (Teague and
Schwane 1995; Vina et al. 2000). As an example, plasma concentration of
certain intracellular proteins and serum enzyme activities were shown to be
elevated during soccer match recovery periods (Magalhaes et al. 2010) and
after high-intensity training periods (pre-season) (Arent et al. 2010). In our
study, we examined a higher in-season increment in Mb content and CK activity
in E2 than in E1 and E4. We also analyzed higher CK in E3 than after the off-
season recovery period (E4). Interestingly, we observed a decrease in Mb
content from E2 to E3 and higher peak values in both bio-markers in the middle
of the season, which s might be associated with “residual” levels of muscle
damage due to the regular training sessions that players undergone (McLellan
et al. 2010). Nevertheless, in line with others analyzing a distinct team sport
(Hoffman et al. 2005), the plasma kinetic of certain intracellular proteins and
enzymes (i.e., plasma myoglobin (Mb) was lower and creatine kinase tend to be
lower towards the end-of-season), seems to suggest that a “contact adaptation”
of skeletal muscles to the repeated mechanical and/or metabolic stress during

207
season (Hoffman et al. 2005). Accordingly, we examined that although C-
reactive protein (CRP) increased from E1 to E2 and E3, peak values of this bio-
marker as well as from CK and Mb were observed in E2. Nevertheless, values
observed in E2 and E3 were not statistically higher than the analyzed at the
beginning of the 2nd season. Other study (Reinke et al. 2009) did not find
differences in professional soccer players’ plasma CRP between the end-of-
season, beginning and end of pre-season period. Curiously, longitudinal
analysis of players’ game-physical performance showed improved short (high-
intensity running in the peak 5 minutes period of the match) (Silva et al. 2012)
and extended match performance (overall match high-intensity running) towards
the end-of-season (Rampinini et al. 2007; Silva et al. 2012).
The high absolute levels of mitochondrial oxygen consumption, the increased
oxidation of circulating catecholamines, the intermittent and repeated sprint
actions-causing temporary ischemia-reperfusion events in skeletal muscle are
plausible factors that may induce reactive oxygen and nitrogen species (RONS)
(Ascensao et al. 2008) during the soccer season. Although with scarce and
some contradictory results, studies involving other team sports showed that
training may induce improvements in both athletes total antioxidant enzymatic
and non-enzymatic capacity [for refrs see (Finaud et al. 2006)]. Nevertheless,
data gathered in soccer players (Arent et al. 2010) revealed that the increasing
free radical scavenging capacity by means of ergogenic supplementation or by
endogenous up-regulation of antioxidant defences due to the training-related
pro-oxidant insults, is not a guarantee of sufficient protection or a condition for a
decrement in exercise-induced oxidative damage during periods of high-
intensity training and competition. In our study, we did not observe significant
alterations in TAS and UA levels throughout the soccer season. To our best
knowledge, no reports have been published regarding TAS kinetics during the
soccer season. Filaire et al., (2003) observed higher plasma UA levels in
professional soccer players in the beginning and at the end-of competitive
period than before the beginning of the pre-season. Data examining post-match
UA (Krustrup et al. 2006; Magalhaes et al. 2010) and IMP responses (Krustrup
et al. 2006) seem to suggest that the completion of a soccer match is

208
associated with a significant degradation of purine nucleotides. Despite no
changes were observed in UA contents during season, data from Reinke et al.,
(2009) suggests a compensated hypo-perfusion (and hypoxia) during the
playing season i.e. observed decreased muscle resting and post-ischemic blood
flow. Consequently, this hypoxia-related condition may increase XDH and XO
activity in endothelium cells and predispose the endothelium to oxidative and
inflammatory damage (Terada et al. 1992), which is consistent with the in-
season increases in Mb, CK, CRP and MDA.
Regarding chronic alterations in antioxidant enzymatic activity, we observed a
progressive increase in SOD activity in E2 and E3. This up-regulation of SOD
may result from a continuous pro-oxidant insult. In fact, SOD is a major defence
upon superoxide radicals and is the first defence line against oxidative stress
(Finaud et al. 2006). Moreover, in conjunction with the protective role against
free radical induced muscle damage during intense exercise, antioxidants may
have a positive effect on performance and on the prevention of fatigue (Vina et
al. 2000). Arent et al., (2010) examined the effects of pre-season
supplementation with a dietary containing an orally available form of SOD as a
part of an antioxidant and anti-catabolic nutriceutical mixture. Although no
differences between supplemented and control players were found in
performance capacity, players submitted to the ergogenic intervention
presented lower CK and 8-isoprostranes responses during the post-exercise
recovery period (Arent et al. 2010). Curiously, although we did not observe any
relationship, the lowest CK activity in-season was coincident with the higher
SOD activity (E3). Concerning the chronic alterations in resting antioxidant
glutathione cycle-related enzyme activities, no significant changes in GPX
activity were observed. However, GR activity decreased from E2 to E3. Taking
into account the critical physiological role of the balance between the first (SOD)
and second step (GPX and/or catalase) antioxidant enzymes, the progressive
increase in plasma SOD/GPX ratio during in-season, seems to favor H2O2
accumulation. This fact could be indicative of a low plasma scavenging
efficiency contributing to enhanced oxidative stress (Gaeta et al. 2002) that is
consistent with the increased levels of MDA found in present study. As

209
previously mentioned, the increase in oxidative stress by-products (e.g. MDA)
may suggest that an imbalance exists between oxidants and antioxidants due to
the continuous pro-oxidant state associated with the soccer demands (e.g.,
muscle high metabolic rates).
Concerning IMPT, it seems that it not only influences some physical (Silva et al.
2011; Sporis et al. 2011) and hormonal parameters but might also have some
impact on the endogenous enzymatic and non-enzymatic antioxidant system.
Our study showed that in E2, players with higher IMPT had increased levels of
TAS, GPX activity and a lower ratio between the 1st and 2nd line of antioxidant
enzymatic defense. The increased levels of TAS and GPX activity in players
with higher IMPTE2 may act as a mechanism to strengthen the endogenous
antioxidant defence and restore the redox balance (Andersson et al. 2010) due
to the increase in the intensity and volume of exercise exposure (Powers et al.
1999).
Regarding plasma sulfhydryl residues (-SH), we observed an increase during
the competitive phase. These results suggest a decreased disulphide linkages
(-S-S-) concentration from both proteins and reduced glutathione, and ultimately
prevention of protein oxidation. The higher training background (Martinovic et al.
2009) (e.g. years of practice) and standard (Nakagami et al. 2009) of
professional players cannot be ruled out as factors that may influence the
results, since they have been associated with higher concentrations of
sulfhydryl groups. Probably, the impact of vigorous training and competition on
oxidative stress may lead to a up regulation in antioxidant defences and
associated shift in redox balance in favour of a more reducing environment,
thereby protecting athlete from excessive oxidative damage during subsequent
competitions and training sessions (Fisher-Wellman and Bloomer 2009).
According to our results, it seems that professional soccer players, although
submitted to a high level of stress signalled by increase muscle damage and
oxidative stress-related markers, have an efficient capability to sustain the
soccer season stressful demands. In fact, despite these stress-related
alterations throughout the competitive season no significant performance
decreases were observed, i.e. at least in the examined neuromuscular
210
parameters and competition results (1.7 and 1.6 match average points from E1
to E2 and from E2 to E3 respectively). In addition, the recovery period is related
to a decrease in markers of muscle damage and oxidative stress. As expected,
the reduction in the functional and metabolic demands during off-season
produce a decrease in lipid peroxidation by-products (MDA) and in –SH
contents.
Acknowledgments
We would like to thank to the Professional Soccer Club, to their technical staff,
medical department and to the soccer players involved in the study for their
committed participation. The excellent technical and practical assistance and
skillful involvement of Eduardo Oliveira, Emanuel Passos and Inês Aleixo is
appreciated. JM (SFRH/BPD/66935/2009) and AA (SFRH/BPD/4225/2007) are
supported by grants from the Portuguese Foundation for Science and
Technology (FCT)
Ethical standards
The authors declare that all the procedures of the experiments comply with the
current laws of the country in which they were performed.
Conflict of interest
The authors declare that they have no conflict of interest.
References
Adlercreutz H, Harkonen M, Kuoppasalmi K, Naveri H, Huhtaniemi I, Tikkanen
H, Remes K, Dessypris A, Karvonen J (1986) Effect of training on
plasma anabolic and catabolic steroid hormones and their response
during physical exercise. Int J Sports Med 7 Suppl 1:27-28
Andersson H, Karlsen A, Blomhoff R, Raastad T, Kadi F (2010) Active recovery
training does not affect the antioxidant response to soccer games in elite
female players. Br J Nutr:1-8. doi:S0007114510002394
[pii]10.1017/S0007114510002394

211
Andersson H, Raastad T, Nilsson J, Paulsen G, Garthe I, Kadi F (2008)
Neuromuscular fatigue and recovery in elite female soccer: effects of
active recovery. Med Sci Sports Exerc 40 (2):372-380
Arent SM, Pellegrino JK, Williams CA, Difabio DA, Greenwood JC (2010)
Nutritional supplementation, performance, and oxidative stress in college
soccer players. J Strength Cond Res 24 (4):1117-1124.
doi:10.1519/JSC.0b013e3181cb70b8
Ascensao A, Rebelo A, Oliveira E, Marques F, Pereira L, Magalhaes J (2008)
Biochemical impact of a soccer match - analysis of oxidative stress and
muscle damage markers throughout recovery. Clin Biochem 41 (10-
11):841-851. doi:S0009-9120(08)00161-6 [pii]
Bishop PA, Jones E, Woods AK (2008) Recovery from training: a brief review. J
Strength Cond Res 22 (3):1015-1024.
Bloomfield J, Polman R, O`Donoghue P (2007) Physical demands of different
positions in FA Premier League soccer. Journal of Sports Science and
Medicine 6:63-70
Bosco C, Komi PV, Tihanyi J, Fekete G, Apor P (1983) Mechanical power test
and fiber composition of human leg extensor muscles. Eur J Appl Physiol
Occup Physiol 51 (1):129-135
Caldwell BP, Peters DM (2009) Seasonal variation in physiological fitness of a
semiprofessional soccer team. J Strength Cond Res 23 (5):1370-1377.
doi:10.1519/JSC.0b013e3181a4e82f
Cormack SJ, Newton RU, McGuigan MR (2008) Neuromuscular and endocrine
responses of elite players to an Australian rules football match. Int J
Sports Physiol Perform 3 (3):359-374
Dellal A, Keller D, Carling C, Chaouachi A, Wong del P, Chamari K (2010)
Physiologic effects of directional changes in intermittent exercise in
soccer players. J Strength Cond Res 24 (12):3219-3226.
doi:10.1519/JSC.0b013e3181b94a63
Faude O, Kellmann M, Ammann T, Schnittker R, Meyer T (2011) Seasonal
changes in stress indicators in high level football. Int J Sports Med 32
(4):259-265. doi:10.1055/s-0030-1269894

212
Filaire E, Lac G, Pequignot JM (2003) Biological, hormonal, and psychological
parameters in professional soccer players throughout a competitive
season. Percept Mot Skills 97 (3 Pt 2):1061-1072
Finaud J, Lac G, Filaire E (2006) Oxidative stress : relationship with exercise
and training. Sports Med 36 (4):327-358. doi:3644 [pii]
Fisher-Wellman K, Bloomer RJ (2009) Acute exercise and oxidative stress: a 30
year history. Dyn Med 8:1. doi:1476-5918-8-1 [pii]10.1186/1476-5918-8-1
Gaeta LM, Tozzi G, Pastore A, Federici G, Bertini E, Piemonte F (2002)
Determination of superoxide dismutase and glutathione peroxidase
activities in blood of healthy pediatric subjects. Clin Chim Acta 322 (1-
2):117-120. doi:S0009898102001638 [pii]
Gorostiaga EM, Izquierdo M, Ruesta M, Iribarren J, Gonzalez-Badillo JJ, Ibanez
J (2004) Strength training effects on physical performance and serum
hormones in young soccer players. Eur J Appl Physiol 91 (5-6):698-707.
doi:10.1007/s00421-003-1032-y
Hakkinen K, Pakarinen A, Alen M, Kauhanen H, Komi PV (1988)
Neuromuscular and hormonal adaptations in athletes to strength training
in two years. J Appl Physiol 65 (6):2406-2412
Handziski Z, Maleska V, Petrovska S, Nikolik S, Mickoska E, Dalip M, Kostova
E (2006) The changes of ACTH, cortisol, testosterone and
testosterone/cortisol ratio in professional soccer players during a
competition half-season. Bratisl Lek Listy 107 (6-7):259-263
Hayes LD, Bickerstaff GF, Baker JS (2010) Interactions of cortisol, testosterone,
and resistance training: influence of circadian rhythms. Chronobiol Int 27
(4):675-705. doi:10.3109/07420521003778773
Hoffman JR, Kang J, Ratamess NA, Faigenbaum AD (2005) Biochemical and
hormonal responses during an intercollegiate football season. Med Sci
Sports Exerc 37 (7):1237-1241. doi:00005768-200507000-00023 [pii]
Hu M-L (1990) Measurement of protein thiol groups and GSH in plasma. In:
Parker L (ed) Methods in enzymology. Academic Press, San Diego, pp
380-385

213
Jensen J, Randers M, Krustrup P, Bangsbo J (2009) Intermittent high-intensity
drills improve in-seasonal performance of elite soccer players. In: Reilly
T, Korkusuz F (eds) Science and Football VI. The procedings of the Sixth
World Congress on Science and Football. Routledge, pp 296-301
Kraemer WJ, French DN, Paxton NJ, Hakkinen K, Volek JS, Sebastianelli WJ,
Putukian M, Newton RU, Rubin MR, Gomez AL, Vescovi JD, Ratamess
NA, Fleck SJ, Lynch JM, Knuttgen HG (2004) Changes in exercise
performance and hormonal concentrations over a big ten soccer season
in starters and nonstarters. J Strength Cond Res 18 (1):121-128. doi:R-
13313 [pii]
Kraemer WJ, Ratamess NA (2005) Hormonal responses and adaptations to
resistance exercise and training. Sports Med 35 (4):339-361. doi:3544
[pii]
Kraemer WJ, Staron RS, Hagerman FC, Hikida RS, Fry AC, Gordon SE, Nindl
BC, Gothshalk LA, Volek JS, Marx JO, Newton RU, Hakkinen K (1998)
The effects of short-term resistance training on endocrine function in men
and women. Eur J Appl Physiol Occup Physiol 78 (1):69-76
Krustrup P, Mohr M, Steensberg A, Bencke J, Kjaer M, Bangsbo J (2006)
Muscle and blood metabolites during a soccer game: implications for
sprint performance. Med Sci Sports Exerc 38 (6):1165-1174.
doi:10.1249/01.mss.0000222845.89262.cd00005768-200606000-00020
Lowry OH, Rosebrough NJ, Farr AL, Randall RJ (1951) Protein measurement
with the Folin phenol reagent. J Biol Chem 193 (1):265-275
Magalhaes J, Rebelo A, Oliveira E, Silva JR, Marques F, Ascensao A (2010)
Impact of Loughborough Intermittent Shuttle Test versus soccer match
on physiological, biochemical and neuromuscular parameters. Eur J Appl
Physiol 108 (1):39-48. doi:10.1007/s00421-009-1161-z
Martinez AC, Seco Calvo J, Tur Mari JA, Abecia Inchaurregui LC, Orella EE,
Biescas AP (2010) Testosterone and cortisol changes in professional
basketball players through a season competition. J Strength Cond Res
24 (4):1102-1108. doi:10.1519/JSC.0b013e3181ce242300124278-
201004000-00030 [pii]

214
Martinovic J, Dopsaj V, Dopsaj MJ, Kotur-Stevuljevic J, Vujovic A, Stefanovic A,
Nesic G (2009) Long-term effects of oxidative stress in volleyball players.
Int J Sports Med 30 (12):851-856. doi:10.1055/s-0029-1238289
McLellan CP, Lovell DI, Gass GC (2010) Creatine kinase and endocrine
responses of elite players pre, during, and post rugby league match play.
J Strength Cond Res 24 (11):2908-2919.
doi:10.1519/JSC.0b013e3181c1fcb1
Meister S, Faude O, Ammann T, Schnittker R, Meyer T (2011) Indicators for
high physical strain and overload in elite football players. Scand J Med
Sci Sports. doi:10.1111/j.1600-0838.2011.01354.x
Nakagami Y, Takatsu H, Okamoto M, Terada Y, Maruta K (2009) Relationship
between team performance levels and serum SH (sulfhydryl group)
changes brought about by intensive athletic training summer camp.
Journal of Analytical Bio-Science 32 (5):427-433
Osgnach C, Poser S, Bernardini R, Rinaldo R, di Prampero PE (2010) Energy
cost and metabolic power in elite soccer: a new match analysis
approach. Med Sci Sports Exerc 42 (1):170-178.
doi:10.1249/MSS.0b013e3181ae5cfd
Powers SK, Ji LL, Leeuwenburgh C (1999) Exercise training-induced alterations
in skeletal muscle antioxidant capacity: a brief review. Med Sci Sports
Exerc 31 (7):987-997
Rampinini E, Coutts AJ, Castagna C, Sassi A, Impellizzeri F (2007) Variation in
top level soccer match performnance. Int J Sports Med 28:1018-1024
Rebelo A (1999) Studies of fatigue in soccer. PhD thesis, University of Porto,
Porto
Rebelo AN, Candeias JR, Fraga MM, Duarte JA, Soares JM, Magalhaes C,
Torrinha JA (1998) The impact of soccer training on the immune system.
J Sports Med Phys Fitness 38 (3):258-261
Reinke S, Karhausen T, Doehner W, Taylor W, Hottenrott K, Duda GN, Reinke
P, Volk HD, Anker SD (2009) The influence of recovery and training
phases on body composition, peripheral vascular function and immune

215
system of professional soccer players. PLoS ONE 4 (3):e4910.
doi:10.1371/journal.pone.0004910
Rohn TT, Hinds TR, Vincenzi FF (1993) Ion transport ATPases as targets for
free radical damage. Protection by an aminosteroid of the Ca2+ pump
ATPase and Na+/K+ pump ATPase of human red blood cell membranes.
Biochem Pharmacol 46 (3):525-534
Semenick D (1990) The T-test. Natl Strength Cond Assoc J 12 (1):36-37
Silva JR, Magalhaes JF, Ascensao AA, Oliveira EM, Seabra AF, Rebelo AN
(2011) Individual match playing time during the season affects fitness-
related parameters of male professional soccer players. J Strength Cond
Res 25 (10):2729-2739. doi:10.1519/JSC.0b013e31820da078
Silva JR, Magalhaes JF, Ascensao AA, Seabra AF, Rebelo AN (2012) Training
Status and Match Activity of Professional Soccer Players Throughout a
Season. J Strength Cond Res. doi:10.1519/JSC.0b013e31824e1946
Sporis G, Jovanovic M, Omrcen D, Matkovic B (2011) Can the official soccer
game be considered the most important contribution to player's physical
fitness level? J Sports Med Phys Fitness 51 (3):374-380. doi:R40113210
[pii]
Teague B, Schwane J (1995) Effect of intermittent eccentric contractions on
symptoms of muscle microinjury. Medicine and Science in Sports and
Exercise 27 (10):1378-1384
Terada LS, Guidot DM, Leff JA, Willingham IR, Hanley ME, Piermattei D,
Repine JE (1992) Hypoxia injures endothelial cells by increasing
endogenous xanthine oxidase activity. Proc Natl Acad Sci U S A 89
(8):3362-3366
Thompson D, Williams C, Garcia-Roves P, McGregor SJ, McArdle F, Jackson
MJ (2003) Post-exercise vitamin C supplementation and recovery from
demanding exercise. Eur J Appl Physiol 89 (3-4):393-400.
doi:10.1007/s00421-003-0816-4
Vina J, Gomez-Cabrera MC, Lloret A, Marquez R, Minana JB, Pallardo FV,
Sastre J (2000) Free radicals in exhaustive physical exercise:

216
mechanism of production, and protection by antioxidants. IUBMB Life 50
(4-5):271-277. doi:10.1080/713803729

217
Table 1. Functional data of the professional soccer players at the three test
occasions.
Variable E1 E2 E3
T5 (s) 1.03 + 0.06 1.01 + 0.05 1.03 + 0.05
T30 (s) 4.16 + 0.17 4.14 + 0.14 4.16 + 0.17
COD (s) 8.71 + 0.27 8.41 + 0.23* 8.49 + 0.27*
CMJ (cm) 42.4 + 4.0 42.8 + 4.4 42.2 + 4.4
KED (Nm) 239 + 24.7 239 + 13.8 244 + 194
KEND (Nm) 242 + 22.6 242 + 31.4 244 + 34
KFD (Nm) 131 + 12 135 + 9.7 138 + 9.6
KFND (Nm) 129 + 11 133 + 8.1 134 + 6.5
Values are mean ± SD. * p < 0.01 E1 vs E2 and E3; E1 – evaluation 1 (Prior
to pre-season 1), E2 – evaluation 2 (Middle of competitive season) E3 -
evaluation 3 (End-of-season), T5 – 5 meters sprint time; T30 – 30 meters sprint
time; COD – change of direction ability; KED – knee extensor dominant leg;
KEND – knee extensor non-dominant leg; KFD – knee flexor dominant leg;
KFND – knee flexor non-dominant leg; ND – not determined;

218
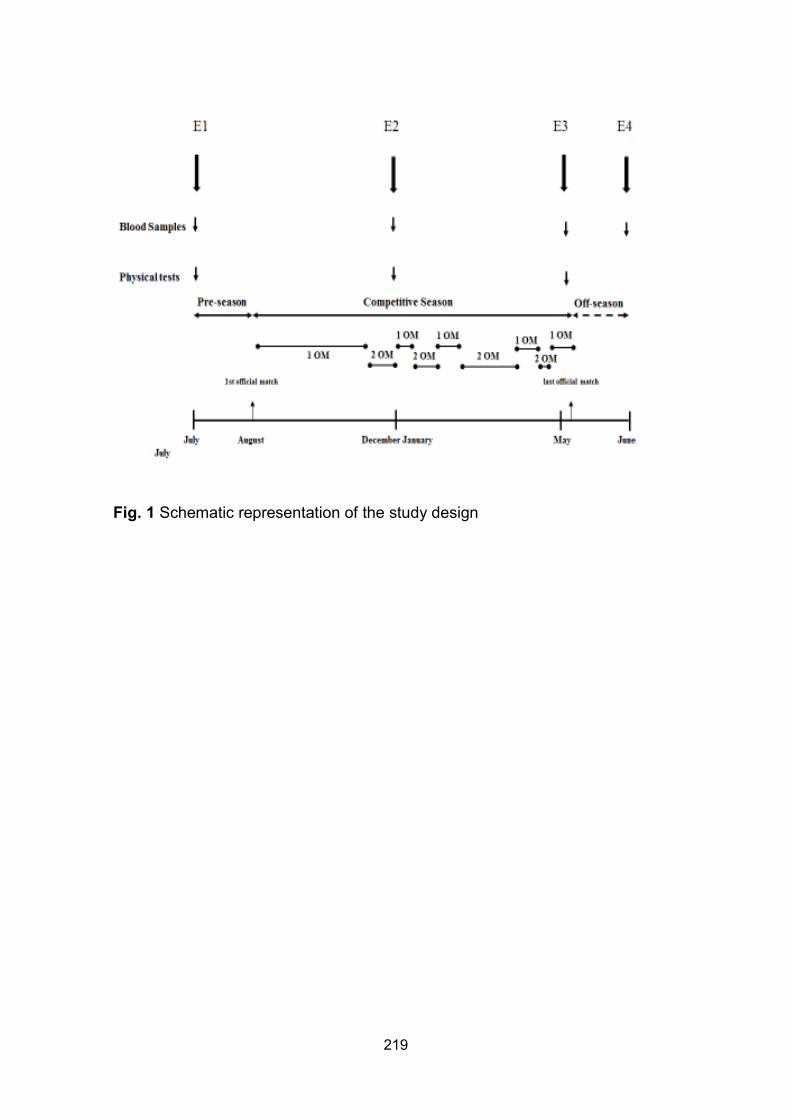
219
Fig. 1 Schematic representation of the study design

220

221
Fig. 2 Hormonal responses to a soccer season. Values represent mean + SEM

222
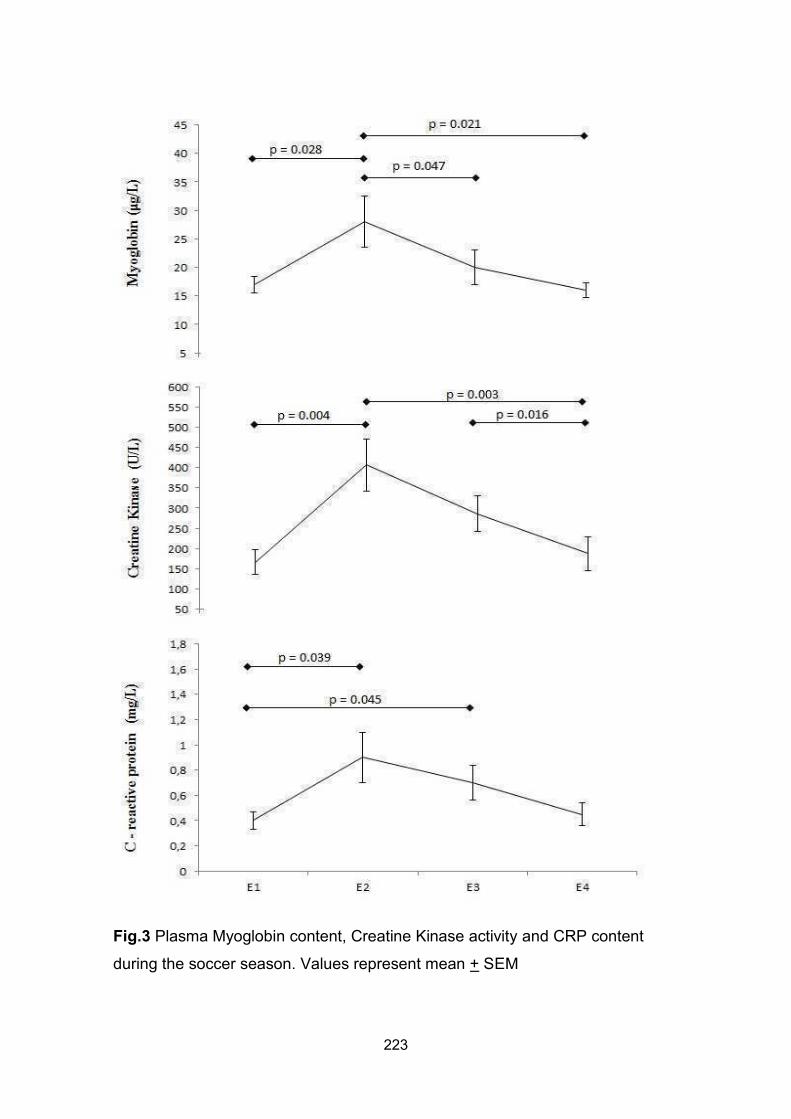
223
Fig.3 Plasma Myoglobin content, Creatine Kinase activity and CRP content
during the soccer season. Values represent mean + SEM

224
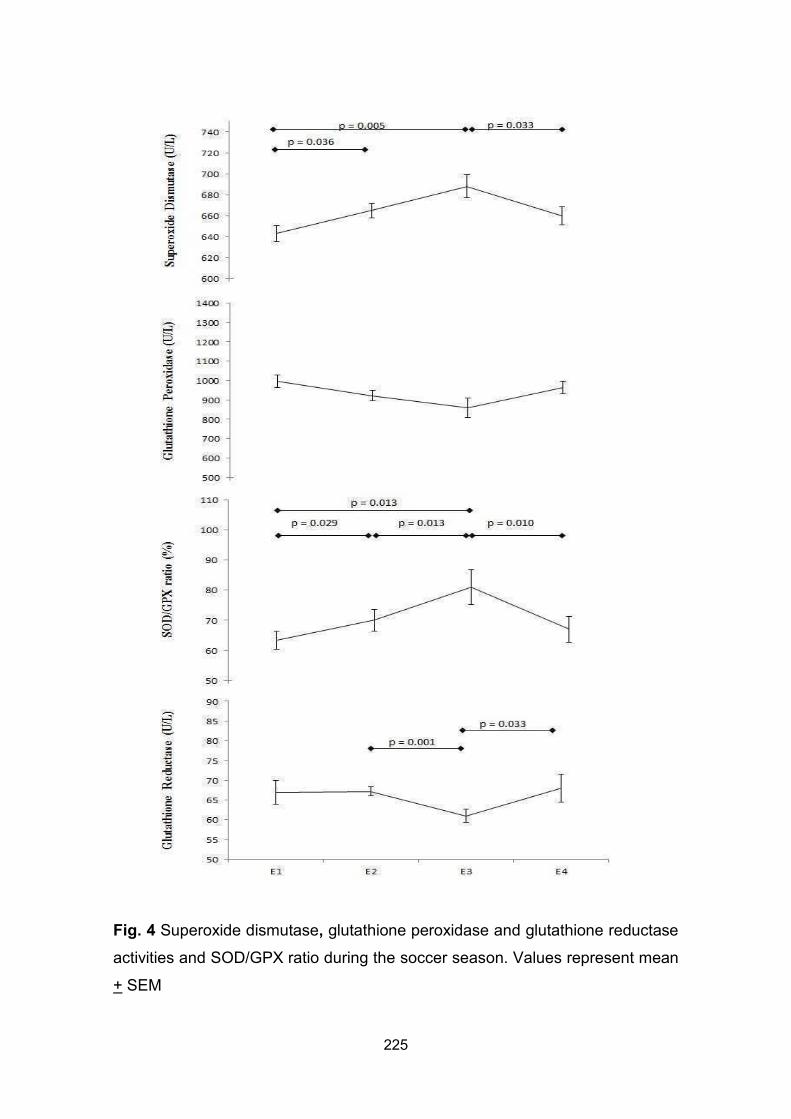
225
Fig. 4 Superoxide dismutase, glutathione peroxidase and glutathione reductase
activities and SOD/GPX ratio during the soccer season. Values represent mean
+ SEM

226
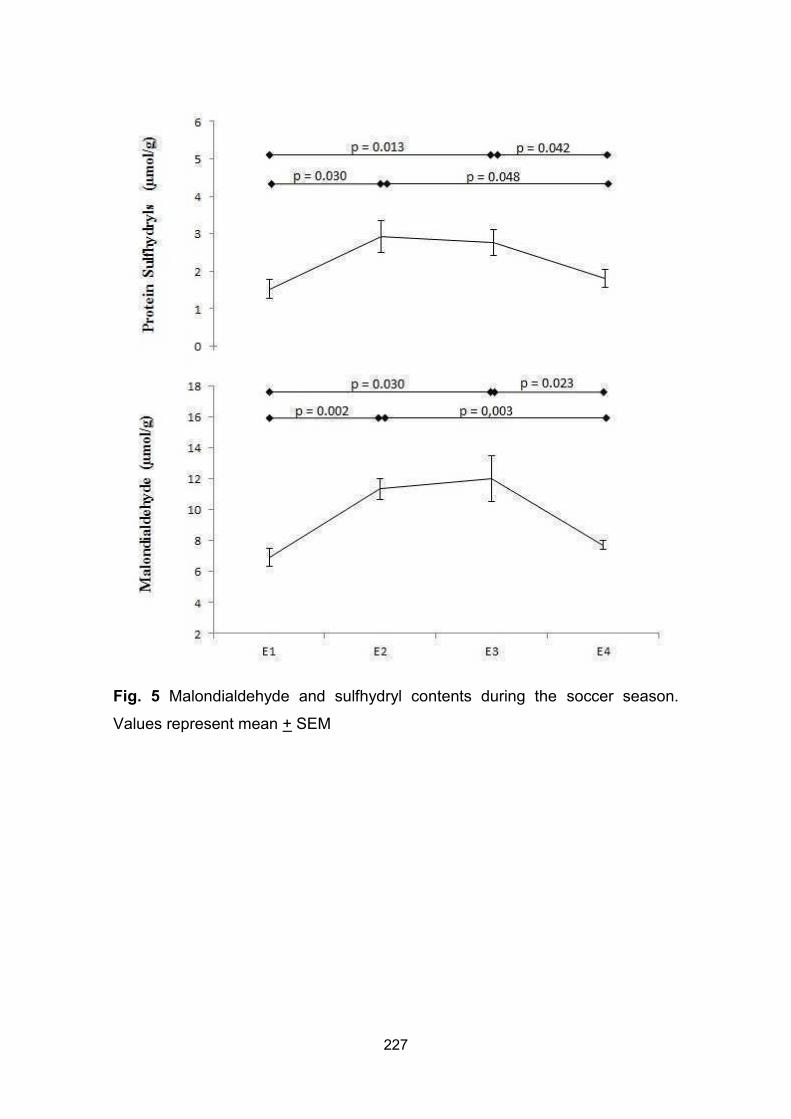
227
Fig. 5 Malondialdehyde and sulfhydryl contents during the soccer season.
Values represent mean + SEM

228

229
Experimental Work
Study III
TITLE: Training status and match activity of professional soccer players
throughout a season
RUNNING HEAD: Training status and match related physical performance
Authors:
João R. Silva1,4; José F. Magalhães2,5; António A. Ascensão2,5; André F.
Seabra3; António N. Rebelo1,4
Affiliations:
1 Faculty of Sport, University of Porto, Department of Soccer, Porto, Portugal
2 Faculty of Sport, University of Porto, Department of Sports Biology, Porto,
Portugal
3 Faculty of Sport, University of Porto, Department of kinanthropometry, Porto,
Portugal
4 Center of Research, Education, Innovation and Intervention in Sport (CIFI2D)
5 Research Center in Physical Activity, Health and Leisure (CIAFEL)
J Strength Cond Res (2012) [Epub ahead of print]

230

231
ABSTRACT
The purpose of this study was to examine match activity (MA) and fatigue
development (FD) during official soccer games in different moments of a
season and the influence of training status (TS) on MA and FD. MA of 13
professional players was examined by time-motion analysis at four time points
of a competitive season. In addition, per time point within the two-week period
between the two games video-filmed, players performed the following physical
tests: countermovement jump, 5-m and 30-m sprints, change of direction, knee
extensor and flexor isokinetic strength, and Yo-Yo intermittent endurance test-
level two. Players covered a greater high-intensity distance running (HI; p <
0.05) in the last quarter of the season than in the second (E2) and third (E3).
Within each assessment period, a greater distance was covered in HI during the
peak five-minute period of the match (P5-min) than in the five-minute period
after P5-min (Next5-min) and the remaining five-minute periods (Av5-min; p <
0.05) of the match. Also, P5-min was higher in E4 than in the beginning of the
season (E1, E2 and E3; p < 0.05). The physical fitness variables, composites
scores of power-related and isokinetic strength tests were correlated (r ranging:
0.59-0.73, p < 0.05) with game physical parameters (GPP) analyzed by time-
motion. Soccer players showed to cover more HI during the game and in the
P5-min towards end-of-season. Players with greater muscle strength and power
expressed lower performance decrements in GPP. In conclusion, results
highlight the relevance of players` neuromuscular function on game physical
performance.
Keywords: performance analysis, competitive period, strength, muscle power,
fatigue

232
233
INTRODUCTION
Match analysis is a widely used instrument in professional soccer to study
tactical and physical performance of players and referees (2). Research with
some of the most up-to-date technologies such as the multi-camera method
(2,42,44), global position systems (44) and video based time-motion analysis
(30,44) revealed detailed information about players` movement patterns
(8,26,30). Moreover, these methods seem to be able to detect performance
decrements during soccer games and thereby enable the study of game-
induced fatigue (44). Data revealed that several signs of fatigue can be
manifested temporally during a game (6,30,31), toward the end of the game
(6,30,31), and persist afterwards (4,28,32,45) with a time-dependency for the
fitness parameter evaluated. Also, it has been observed through these methods
that performance during the match is dependent on multiple factors
(7,25,26,30,42).
Recent investigations observed that physical performance during the game
changes throughout the season (30,42) and are related to players` training
status (25,26,41). In fact, some studies showed that soccer players`
performance in the Yo-Yo intermittent recovery test both in males (25) and
females (26), in incremental field tests (shorter version of the University
Montreal Track Test) (41) and in the repeated shuttle sprint ability test (41) are
indicators of game-related physical performance.
However, data on non-locomotive activity as well as unorthodox movements
(e.g. shuffling, diving), soccer specific movements (e.g. heading, blocking), and
accelerations and decelerations are generally omitted or not taken into account
(8). In fact, a massive metabolic load is imposed on players, not only during the
more intense parts of the game, but every time acceleration occurs, even when
speed is low (36). The regular evaluation of soccer physical fitness using
different tests is of special importance, as soccer players should be able to
successfully perform over competitive seasons of around 10-11 months.
Although seasonal variations in game-physical performance have been
analyzed (30,42), these investigations usually involve three time points of the

234
season (beginning, middle and end of season). Therefore, research assessing a
higher range of time points throughout the season will be more fruitful when
analyzing seasonal variations in game-related physical parameters. Moreover,
scrutinized research of seasonal alterations in fatigue patterns (e.g. temporary
fatigue) of soccer players during games has never been reported. Thus, we
aimed to analyze game-related physical performance and fatigue development
during official soccer games during four time points of the season.
Rapid force production is considered essential for a wide range of athletes
(1,20,34). In fact, soccer players’ muscle strength (3,16) and performance in
sport-specific muscle power efforts (16,33) were reported to be related to the
player`s and team`s competitive level. Moreover, improvements in coordination
specificities (12) and a greater agility (19) have been positively associated with
performance and the ability to delay fatigue. In accordance with recent reports,
enhancement of neuromuscular function can be a determinant in improving
short and long term endurance capacity (1). In spite of these indications and
although high stresses are imposed on the neuromuscular system during
soccer games, until now, no study addressed whether muscle strength and
power can be indicators of game-related physical performance. Therefore, we
also aim to investigate whether physical conditioning evaluated in field and
laboratory tests is related to game-physical performance and fatigue
development. We hypothesized that during the season soccer players may
experience performance alterations in certain game physical parameters
analyzed by time-motion. Moreover, given the high stress levels imposed on the
neuromuscular system, soccer players` training status might be associated with
some game-related physical parameters.
METHODS
Experimental approach to the problem
Match activity and fatigue during games has been a topic of increased research
in recent years (4,6-8,28,30,40). Moreover, players` physical and physiological
characteristics have already been extensively described (6,16,20). However,

235
the seasonal alterations in match activity and the influence of players` training
status in game physical performance had been scarcely investigated.
Therefore, in order to analyze seasonal alterations in game physical parameters
and in fatigue patterns (e.g temporary fatigue), a sequence of time-motion
analysis of 13 players were performed over eight videotaped matches during
four time points of a competitive season (Figure 1). Temperature and relative
humidity during matches at different time points were as follows: E1 – 1st and 3rd
official games, temperature ranged from 24-26ºC and relative humidity from 40-
44%; E2 - 8th and 10th official games, temperature ranging from 19-21ºC and
relative humidity from 55-60%; E3 - 15th and 16th official games, temperature
ranging from 13-15ºC and relative humidity from 60-65%; E4- 24th and 26th
official game, temperature ranging from 14-16ºC and relative humidity from 60-
75%. In addition, to analyze the influence of player training status in game
physical performance, players performed a group of laboratory and field
physical tests within two-weeks of each of the two time points of competitive
games video-filmed (E1 and E3; Figure 1). The players performed the
countermovement jump (CMJ), 5-m (T5) and 30-m (T30) sprints, change of
direction ability (t-test), knee extensor (KE) and flexor (KF) maximal isokinetic
strength, and the Yo-Yo intermittent endurance test level two (YYIE2). These
tests provide valid and reliable data allowing an evaluation of physical fitness
parameters directly (agility, sprint, jump, intermittent endurance) and indirectly
(isokinetic strength)-related to soccer physical performance. In addition,
composite scores were determined to provide a more complex operational
indicator of physical fitness. With this option, we aimed to investigate the
association between game physical parameters (GPP) and certain soccer
players’ specific physical fitness parameters to provide a more global indicator
of soccer players` training status (e.g the sum of the scores in the soccer
specific muscle power-related tests).
*Figure 1 about here

236
Subjects
A group of 13 male professional soccer players (four defenders, five midfielders
and four attackers (mean + SD: 25.7 + 4.6 years, body mass 76.5 + 9.2 kg,
178.1 + 5.7 cm and 9.8+ 3.7% fat percentage) from a professional team
competing in the Portuguese championship (Professional Soccer League) was
involved. All the subjects had a minimum of three and a maximum of 10 years
of senior soccer professional activity. Only injury free players participating in full
training schedules were tested. In accordance with the professional Club policy
and medical requirements, all soccer players underwent physical examinations
both at the beginning and throughout the season (e.g. blood sample analysis,
resting ECG, lung x- Ray). All subjects were told of the purpose of the study and
written informed consent was obtained according to the Declaration of Helsinki.
The study was approved by the Scientific Committee of the Sports Faculty of
the University of Porto.
Evaluation procedures
Match analyses
In order to avoid variations in pitch dimensions, all videotaped records were
restricted to home-played matches (as Host team), and were filmed by the
same group of researchers. Game score and rank of opposing team data are
presented in Table 1.
Time-motion was performed according to the procedures defined by Krustrup et
al., (26). Each player was filmed close up during the entire match by a VHS
movie camera (DCR-HC53E, SONY, JAPAN) positioned at the side of the field,
at a height of about 15-m and at a distance of 30 to 40-m from the touchline.
The videotapes were later replayed on a monitor for computerized coding of
activity patterns. The following locomotor categories were used: standing (0
km.h-1), walking (6 km.h-1), jogging (8 km.h-1), low-speed running (12 km.h-1),
moderate-speed running (15 km.h-1), high-speed running (18 km.h-1), sprinting
(30 km.h-1) and backward running (10 km.h-1). The locomotor categories were
chosen in accordance with Bangsbo et al. (7), whereas the mean speed for
each category was determined after detailed studies of video tapes. Thus, the

237
time for the players to pass landmarks in the grass, center circle and other know
distances was used to calculate the speed for each locomotor activity. The
above activities were later divided into four locomotor categories: (1) standing;
(2) walking; (3) low-intensity running, encompassing jogging, low-speed running
and backward running; and (4) high-intensity running, consisting of moderate-
speed running, high-speed running, and sprinting. The frequency and duration
of each activity were recorded in 5-,15-,45- and 90-minutes periods throughout
the game. The distance covered by each locomotor activity was determined in
five-minute intervals as the product of the total time and mean speed for that
activity. The total distance covered during a match was calculated as the sum of
the distances covered during each type of activity. The peak distance covered
in high-intensity running in a five-minute period is also presented. This period
represents that five-minute which contains the most high-intensity running in a
game and is specific to each of the monitored players. All the match recordings
were analyzed by an experienced observer. Krustrup and Bangsbo (24)
observed that the coefficients of variation for test-retest analysis were 1, 2, 5, 3,
and 3%, respectively, for total distance covered, walking, low-intensity running,
high-intensity running, and backward running. In the present study, the
coefficient of variation (CV) for test-retest analysis in different locomotors
parameters was lower than 5%. Each players` locomotive style was previously
extensively analyzed and several validation-tests were performed according to
the predetermined locomotor categories (26). Both halves were analyzed in a
random order.
Physical fitness testing
All evaluations took place at the same time of day, after the players had a
regular overnight sleep. Players were instructed to maintain normal routines for
daily food and water intake, and followed the same dietary recommendations
defined by the medical staff. In addition, during the days of physical tests,
players were instructed to refrain from drinking beverages containing caffeine
and/or alcohol and from consuming food during the three hours before testing.
In the two days preceding evaluations, the players had a day-off (first day) and

238
a training session (second day) involving low intensity exercises aimed to
improve post-match recovery.
Countermovement vertical jump (CMJ), sprint and change of direction (COD)
tests were conducted at indoor facilities to exclude the influence of ground
surface variations of the soccer pitch on results. The YYIE2 was performed on a
field of natural grass where the team normally conducted their training sessions.
The order of the tests was as follows: (1) CMJ, (2) sprint, (3) change of direction
ability (COD), (4) knee extensor and flexor isokinetic strength and (5) YYIE2.
Before the tests, all players performed a ten to fifteen minutes warm-up
consisting of light jogging, specific mobility exercises and stretching routines,
and three 10-m sprints. Players completed two rounds of each test in the same
order. Each subject was allowed a minimum of five-minute rest between tests to
ensure adequate recovery.
The CMJ was performed using a Ergojump platform (Digitime 1000, Digest
Finland) according to Bosco et al.,(9) whereby the highest vertical jump
(centimeters) and the longest flight time (seconds) were registered. Sprint ability
measurements were carried out with telemetric photoelectric cells (Brower
Timing System, IRD-T175, Utah, USA) placed at the starting line (0 m), at 5 and
at 30-m. Change of direction ability (COD), defined as the ability to decelerate,
reverse or change movement direction and accelerate again (23) was evaluated
using an agility test (T-test; Figure 2). T-test does not include a perceptual or
decision making component and can be used to measure change of direction
ability. An adapted version of the T-test by Semenick (46) was performed.
Subjects began with both feet 0.3-m behind the starting point A. At their own
discretion, each subject sprinted forward 9.14-m (10 yd) to point B and touched
the base of the cone with their right hand. They then sprinted to the left 4.57-m
(5 yd) and touched the base of a cone (C) with their left and. Subjects then
sprinted to the right 9.14-m (10 yd) and touched the base of a cone (D) with the
right hand. Next they sprinted to the left 4.57-m back to point B and touched the
base of a cone with the left hand. They turned 270º and then ran to point A,
passing the finishing line. Two test trials were performed, and times were
recorded to the nearest one-hundredth of a second. As described for sprint

239
ability, measurements were carried out with telemetric photoelectric cells
(Brower Timing System, IRD-T175, Utah, USA). Test time was activated when
players passed the electronic sensors in Point A, and the clock stopped the
instant players again crossed this point. In sprint and COD testes players were
instructed to run as quickly as possible from a standing start 0.3-m behind the
starting line.
*Figure 2 about here
To evaluate players’ lower limb muscle function, maximal gravity corrected
concentric peak torque of quadriceps and hamstrings was measured during
isokinetic knee joint movement (Biodex System 2, NY, USA) of the dominant
and nondominant leg at the angular velocity of 90º.sec-1 (1.57 rad.sec-1),
according to Magalhães et al., (27). Prior to muscle function measurements,
subjects perform a standardized warm-up consisting of five-minute period on a
cycle ergometer (Monark E-824) with a fixed load corresponding to 2% of body
weight. Players were then seated on the dynamometer chair at 85º inclination
(external angle from the horizontal) with stabilization straps at the trunk,
abdomen and thigh to prevent inaccurate joint movements. The contralateral leg
was not secured to avoid influencing the strength developed by the knee
muscles being tested. The tested knee was positioned at 90º of flexion (0º= fully
extended knee) and the axis of the dynamometer lever arm was aligned with
the distal point of the lateral femoral condyle. Before the anatomical alignments
and procedures, all the subjects were instructed to kick and bend the tested leg
as hard and as fast as they could through a complete range of motion (from 90º
to 0º). Subjects were also instructed to hold their arms comfortably across their
chest to further isolate knee joint flexion and extension movements. All subjects
also performed a specific sub-maximal warm-up protocol on the Biodex device
in order to familiarize with the isokinetic device and test procedure that entailed
three maximal repetitions at angular velocity 90º.sec-1 (1.57 rad.sec-1).
The YYIE2 was performed after a ten-minutes warm-up consisting of repeated
2x20-m runs back and forth between the start and finish line at a progressively

240
increased speed controlled by audio bleeps from a CD-ROM according to
Bangsbo (5). The initial speed is 11.5 km/h (12.5 s for 2 x 20-m) and between
running bouts the participants have a five second rest period. The total distance
covered during the YYIE2 was considered as the testing score. Heart rate was
measured during the YYIE2 and recorded every five seconds using a HR
monitor (POLAR TEAM SYSTEMTM, Polar Electro, Kempele, Finland).
Intraclass correlation coefficients of all physical fitness tests were estimated
using a test-retest procedure, with a random sub-sample of eight subjects in
each evaluation moment. The intraclass correlation coefficients (R) for all
variables were as follows. Height, weight and fat mass: 0.93 ≤ R ≤ 0.99; counter
movement jump: 0.83≤ R ≤ 0.88; sprint time: 0.76 ≤ R ≤ 0.87; agility: 0.75 ≤ R ≤
0.85; Yo-Yo intermittent: 0.80≤ R ≤0.97; and isokinetic strength: 0.81 ≤ R ≤
0.98.
Statistical Analysis
All data were reported as means and standard deviations (SD) for each
variable. The assumptions of normality were assumed using the Shapiro-Wilks
test and Mauchly test, respectively. After these assumptions, analysis of
variance for repeated measures was used to determine if there were differences
between the different 15-minutes and five-minute periods within the game, as
well between the match activity parameters in the different season time points.
The Bonferroni test for multiple comparisons was used to identify specific
differences between the means in locomotor activities in the different time-
points. Intraclass correlation coefficient and coefficient of variation was
calculated to estimate the reliability of the physical fitness tests and locomotor
parameters, respectively. Z scores were calculated for each test; scores were
reversed for the three timed items (T5, T30 and Agility) since lower times reflect
better performance. The composite scores were determined to provide a more
complex operational indicator of physical fitness. Composite scores of
performance in muscle power-related (CSPRT; T5, T30, Agility and CMJ) and
isokinetic strength tests were calculated and their association with match
analysis data was determined. Correlation coefficients (r) were used to

241
determine association between physical tests, physical tests composite scores
and time-motion data. The SPSS statistical package (version 14.0; Inc.,
Chicago, III) was used. Statistical significance was set at p ≤ 0.05.
RESULTS
Seasonal variations
Results regarding seasonal variations in the frequency of activity changes,
number of runs in low (FLI) and high intensity (FHI), total distance (TD) covered
during game, as well as in each type of movement during the two halves are
presented in Tables 1 and 2. The TD in the first 15-minutes period was 10%,
7% and 17% lower (p < 0.05) in E2 than in E1, E3 and E4 respectively, and
11% higher (p < 0.05) in E4 than in E3. In the last 15-minutes of the game the
TD was 14% and 8% higher in E4 than in E2 and E3, respectively (p < 0.01).
The distance covered in high-intensity running (HI) in the last 15-minutes of the
first half of the match in E4 was 49%, 37% and 33% higher (p < 0.05) than in
E1, E2 and E3, respectively. Also, the HI in the last 15-minutes period of the
game in E4 was 43% higher than in E3 (p < 0.05). The sum of the distance
covered at HI in the two last 15-minutes periods of each half was 36% and 38%
higher in E4 than E2 and E3, respectively (p < 0.05). The peak 15-minutes
period of HI running was 30%, 47% and 43% higher in E4 than in E1, E2, and
E3, respectively (p < 0.05), while the lower 15-minutes period of HI running
during the game was 58%, 46% and 41% higher in E4 than E1, E2 and E3,
respectively (p < 0.05).
Results from the peak distance covered in HI in a five-minute period (P5-min),
in the next five-minute period (Next5-min), in the remaining five-minute periods
(Av5-min), and the variation of distance covered from the P5-min to Next5-min
(%DecP5-N5) are presented in Figure 3. Players covered a higher distance in HI
running in the P5-min (p < 0.05) from E4 than in the remaining P5-min periods
of the other time points. Furthermore, in all assessments points of the season
the distance covered in HI was higher in P5-min (p < 0.05) than in Next5-min
and Av5-min within each assessment period. Moreover, higher (p < 0.05) Av5-

242
min values were observed in E4 than in E2 and E3. No significant differences
were observed between the distance covered in HI in the Next5-min and Av5-
min within the different assessment periods.
*Table 1 about here
*Table 2 about here
*Figure 3 about here
Physical fitness results
Results of the different physical tests performed within the two-week period
between video-filmed matches are presented in Table 3.
*Table 3 about here
Training status in relation to match analysis
Time motion variables showed that the TD and the distance covered in HI for
the first and second halves were not significantly different (4585 + 265-m vs.
4570 + 301-m and 632 + 75-m vs. 680 + 150-m, respectively). The distance
covered in HI during the first 15-minutes period of each half (1st and 4th 15-
minutes periods of the game) was higher (p < 0.05) than in the last 15-minute
period of each half (3rd and 6th periods of the game, respectively; Figure 4).
Tables 4 and 5 show the relationship between time-motion variables and the
different muscle power related tests, isokinetic parameters and tests composite
scores, respectively. Performance in sprint tests (T5 and T30) and in the
composite score of power related tests (CSPRT) were the physical-related
parameters that showed the highest correlations with time-motion variables.
T30 and CSPRT showed significant correlations (r = 0.622-0.726) with the
distance covered in HI running in the five-minute period of the game after P5-
min (Next5-min), with the decrement (%) in HI running from P5-min to Next5-
min (%DecP5/N5) and with the distance in sprinting in the second half of the
game (SP2ndhalf; Table 4).

243
Knee extension peak torque of non-dominant leg (KEND) showed significant
correlations (r ranging from 0.56 to 0.73) with the following time motion
parameters: decrement (%) in HI between the highest (4th) and the lowest (6th)
intense 15-minutes periods of the second half (HI%Dec4th
/6th), average decrement
(%) in HI from the highest to the lowest intense 15-minutes periods (1st to 3rd
and 4th to 6th) of both halves (HI%AvDec1st
/ 3rd
- 4th
/ 6th) and decrement (%) in HI
from the 1st to the last 15-minutes periods (HI%Dec1st
/6th) of the game (Table 5).
The decrement (%) in HI from the highest to lowest intense 15-minutes periods
(1st to 3rd and 4th to 6th) of both halves (HI%AvDec1st
/ 3rd
- 4th
/ 6th) was also correlated
(r = 0.59 to 0.73) with knee flexion peak torque of the non-dominant leg (KFND),
and with the composite scores of knee extension (CSKE), knee flexion (CSKF)
and knee extension and flexion (CSKEF). The distance covered in the YYIE2
was not correlated with any of the time-motion parameters analyzed.
*Table 4 about here
*Table 5 about here
*Figure 4 about here
DISCUSSION
The main findings of the present study were that alterations in game physical
parameters of professional soccer players occur during the season and that
their training status is related to a greater ability to maintain HI-related
performance variables during the match.
Time-motion analysis of the matches performed at different time points of the
season showed that players covered greater total and HI running distances in
the last quarter of the season (E4; Table1). Also, it was observed that players
were more frequently engaged in HI activities (FHI) during the last quarter of the
season (E4; Table1) than in the remaining season periods (E1, E2 and E3).
Although differences in HI match running were only significant from E2 and E3
to E4, the analysis of each match half showed that players performed more HI
running in the first half in E4 than in the first halves of the remaining periods

244
(E1, E2 and E3, Table 2). A greater distance in HI was covered in the peak and
in the lowest 15-minutes periods of the match in E4 than in the correspondent
15-minutes periods of the other time points of the season. Moreover, the
amount of HI performed in the last 15-minutes period of each half, which is
indicative of the ability to maintain performance during the game (26), was
again higher in E4. In agreement with our findings, others observed that players
covered a greater distance in HI at the end than in the middle of the competitive
season (30,42). Although not controlled in the present study, an improved
physical capacity in the last part of the season could explain, at least in part, our
results. In fact, increases in match-related physical performance could be
attributed to an improved physical capacity (42). Several studies observed an
increase in different physical parameters towards the end of the season
(13,21,25,35). Studies involving longitudinal analysis of soccer players physical
capacity throughout the season observed increases in soccer specific
endurance fitness (25,35), repeated sprint ability (21), speed (13), agility (13)
and jump performance (35) towards the end of season. Nevertheless, it is
important to note that these findings have not been corroborated by others
(14,29).
The performance in a group of physical fitness measures and in a composite
score of power-related tests (T5, T30, COD, CMJ and CSPRT) was related to
certain time-motion game physical parameters (Table 3). In fact, players with
better T5, T30, COD abilities and CSPRT showed an increased performance in
Next5-min, a lower decrement from P5-min to the Next5-min, (%DecP5-N5) and
performed a higher sprint distances during the second half of games. These
findings suggest that soccer players with improved capacity to perform sport
specific maximal dynamic activities have an increased ability to maintain
performance during short periods of high intensity intermittent exercise and a
greater fatigue resistance in the second half of the game. Also, some isokinetic
strength parameters (Table 4) and composite scores of knee extension (CSKE),
knee flexion (CSKF) and knee extension and flexion (CSKEF) were correlated
with game-related physical performance (Table 5). Relationships were observed
between KE and KF muscle strength of the non-dominant leg, CSKE, CSKF,

245
and CSKEF and the following fatigue parameters, namely: decrement in HI from
the first and to the final 15-minutes periods of the game and decrement in HI
from the highest to lowest intense 15-minutes periods of both halves. These
results suggest that greater levels of lower limb strength are related to a higher
ability to maintain performance during games (Table 5). This seems to suggest,
that players with greater ability to rapidly produce force, allowing fast
accelerations and decelerations, and to quickly and efficiently perform complex
and coordinated movements, are able to perform at high level in certain game-
related physical parameters.
Accordingly, some studies showed that strength (16) and sport specific muscle
power evaluated by sprint ability (16) and agility (33) are influenced by the
competitive level of the players. Also, high performance levels in jump ability,
leg extension strength (3) and in intermittent exercise protocols (43) were
observed in players from more successful teams compared with their less
successful counterparts.
Rampinini et al. (41) did not observe any relationships between both the best
time during a RSSA test (RSSAbest) and jump ability (Squat Jump), with different
match time-motion variables (TD, HI, very high intensity running, and sprinting).
However, despite low to medium intensity running is the predominant activity
during the match, power-based efforts such as sprints, changing of direction
and speed, jumps, duels, and kicking, which are mainly dependent on maximal
strength and anaerobic power, are widely accepted as essential factors to
success in soccer performance (16). In fact, a massive metabolic load is
imposed on players not only during the maximal intensities phases of the game
but every time acceleration occurs, even when speeds are low (36). These
speed and direction of movement changes performed during games impose
high levels of stress to the involved musculature, thereby affecting energy
usage and resulting in a higher physiologic impact than habitual forward
movements (18). Indeed, higher VO2 (11), blood lactate (11,18), heart rate (18)
and rate of perceived exertion (18) values were observed during high intensity
intermittent exercise during shuttle mode than during in-line format. Some
possible reasons could be the involvement of additional muscles, such as upper

246
body muscles (22) and of different neuromuscular activation patterns during
COD activities (11). At high speed displacements and during intermittent
shuttle running, turning technique becomes more important, and anaerobic
power is essential because players might accelerate after turning to reach the
desired speed (18). The physiological demands and functional characteristics
that are typical of soccer specific activity patterns may explain the observed
correlations found in the present study between power-related tests and game-
physical parameters.
Fatigue is a complex phenomenon that can not be simply explained by a single
factor (19). The ability to resist to fatigue has been related to different functional
and physiological features (6,12,19,31). Improvements in coordination
specificities (12) and a greater ability to COD (19) are positively associated with
performance and with an attenuated fatigue response. Indeed, an optimized
performance during the game and particularly during the most intense periods
would be expected in players with neuromuscular features tuned for the
movements performed during the game (15).
Soccer players with greater CSPRT values may have a higher ability to
accelerate, decelerate and change of direction than the players with lower
values, leading to an improved physical capacity. This greater physical capacity
may likely offset some of the mechanical and neuromuscular effects of repeated
stretch-shortening cycle (SSC) fatigue (15). For instance, improved training
status seems to be related to the higher ability to regulate joint stiffness more
efficiently during exposure to maximal intensity repeated sprints (15).
As games progress, some examples of game–induced fatigue are the
reductions in concentric (4,28,40) and eccentric muscle strength (40), as well as
in EMG activity (39) of the major lower limb muscles. Game-induced
performance decrements are also evident in players` decreased ability to
perform certain strength dependent actions such as sprint (4,28,32) and jump
(4,28). In accordance, players’ fatigue reflected in reduced electrical activity of
muscles and in compromised strength towards the final periods of the match
may cause a lower work-rate towards the end of soccer match (39,40).
Moreover, since each specific game action requires breaking and propulsive
247
forces, the importance of the strength and endurance capacities of leg muscles
likely increases as the game progresses (10,11). Thus, strength decrements
during the game could affect the performance of explosive actions such as
jumping, sprinting and changings of direction, which require high quadriceps
strength at the initiation of movement when the joint extension velocity is low
(40). It is plausible to assume that soccer players with higher levels of strength
have greater ability to maintain strength towards the final stages of each half of
the game than players with less strength, and thus show a lower decrement in
work rates.
Data suggest that athletes’ ability to exercise during longer periods of time is
usually related to their endurance capability (e.g., anaerobic threshold, VO2max).
Nevertheless, improved endurance is also influenced by factors related to
muscle recruitment and force production (37,38). It was recently observed that
distance running performance and running economy of well-trained distance
runners are related to the neuromuscular capacity to produce force (34). Also,
improvements in soccer players’ maximal strength resulting from training and
neural adaptations lead to improved running economy by 4.7% both at the
lactate threshold and at a fixed velocity in a treadmill test (20). Rapid force
production is considered essential for a wide range of athletes (20,34), with
recent reports highlighting that an enhancement in neuromuscular function can
be determinant in improving short and long term endurance capacity (1). In fact,
there is a consensus that training-related improvements in motor unit
recruitment and synchronization result in force potentiation, improving efficiency
and coordination, which may delayed the onset of fatigue (17,37,38).
In summary, this study gives empirical support to the neuromuscular
parameters measured by sprint, COD, jump ability, strength parameters and
their composite scores as indicators of physical performance of soccer players
during games. However, it is important to refer that moderate correlations do
not affirm a direct cause and effect (41). Indeed, it should be considered that
although data from laboratory and field tests are useful in providing information
on players’ general physical profile and soccer-specific fitness, test results

248
should not be used to predict the overall performance during match-play
because of the complex nature of the demands of the game (47).
PRACTICAL APPLICATIONS
Our results highlight the importance of strength and power for soccer players. In
fact, this study report an association between muscle strength and power and
performance decrements in game-related physical parameters. Thus, soccer
players’ training should incorporate specific exercise programs to improve the
athletes` strength and power during the performance of soccer specific
activities. Also, the regular evaluation of the capacity of players` neuromuscular
system to produce force and to perform powerful specific sport activities (e.g.
sprint, COD) is advised. In fact, athletes need to successfully perform over
competitive seasons of around 10-11 months and, according to our results,
these functional qualities of players` physical fitness seem to be associated with
their physical performance during games. Interventional studies designed to
analyze the relationship between improvement in these physical parameters
(e.g. strength, power, COD) and enhanced game-related physical parameters
are warranted.
ACKNOWLEDGEMENTS
We thank to the technical staff and to the soccer players of the professional
team participating in the study. The results of the present study do not
constitute endorsement by NSCA.
REFERENCES
1. Aagaard, P, and Andersen, JL. Effects of strength training on endurance
capacity in top-level endurance athletes. Scandinavian Journal of Medicine &
Science in Sports 20: 39-47, 2010.

249
2. Abt, G, and Lovell, R. The use of individualized speed and intensity
thresholds for determining the distance run at high-intensity in professional
soccer. J Sports Sci 27: 893-898, 2009.
3. Arnason, A, Sigurdsson, SB, Gudmundsson, A, Holme, I, Engebretsen, L,
and Bahr, R. Physical fitness, injuries, and team performance in soccer. Med
Sci Sports Exerc 36: 278-285, 2004.
4. Ascensao, A, Rebelo, A, Oliveira, E, Marques, F, Pereira, L, and Magalhaes,
J. Biochemical impact of a soccer match - analysis of oxidative stress and
muscle damage markers throughout recovery. Clin Biochem 41: 841-851, 2008.
5. Bangsbo, J. Fitness training in football - a scientific approach.: HO+ Storm,
Bagsvaerd, 1994.
6. Bangsbo, J, Mohr, M, and Krustrup, P. Physical and metabolic demands of
training and match-play in the elite football player. J Sports Sci 24: 665-674,
2006.
7. Bangsbo, J, Norregaard, L, and Thorso, F. Activity profile of competition
soccer. Can J Sport Sci 16: 110-116, 1991.
8. Bloomfield, J, Polman, R, and O`Donoghue, P. Physical demands of
different positions in FA Premier League soccer. Journal of Sports Science and
Medicine 6: 63-70, 2007.
9. Bosco, C, Komi, PV, Tihanyi, J, Fekete, G, and Apor, P. Mechanical power
test and fiber composition of human leg extensor muscles. Eur J Appl Physiol
Occup Physiol 51: 129-135, 1983.
10. Brughelli, M, Cronin, J, Levin, G, and Chaouachi, A. Understanding change
of direction ability in sport: a review of resistance training studies. Sports Med
38: 1045-1063, 2008.
11. Buchheit, M, Bishop, D, Haydar, B, Nakamura, FY, and Ahmaidi, S.
Physiological responses to shuttle repeated-sprint running. Int J Sports Med 31:
402-409, 2010.
12. Buchheit, M, Mendez-Villanueva, A, Delhomel, G, Brughelli, M, and
Ahmaidi, S. Improving Repeated Sprint Ability in Young Elite Soccer Players:
Repeated Shuttle Sprints Vs. Explosive Strength Training. J Strength Cond
Res: 2010.

250
13. Caldwell, BP, and Peters, DM. Seasonal variation in physiological fitness of
a semiprofessional soccer team. J Strength Cond Res 23: 1370-1377, 2009.
14. Clark, N, Edwards, AM, Morton, R, and Butterly, J. Season-to-season
variation of physiological fitness within a squad of professional male soccer
players. Journal of Sports Science and Medicine 7: 157-165, 2008.
15. Clark, RA. The effect of training status on inter-limb joint stiffness regulation
during repeated maximal sprints. Journal of science and medicine in sport /
Sports Medicine Australia 12: 406-410, 2009.
16. Cometti, G, Maffiuletti, NA, Pousson, M, Chatard, JC, and Maffulli, N.
Isokinetic Strength and Anaerobic Power of Elite, Subelite and Amateur Soccer
Players. Int J Sports Med 22: 45-51, 2001.
17. Creer, AR, Ricard, MD, Conlee, RK, Hoyt, GL, and Parcell, AC. Neural,
metabolic, and performance adaptations to four weeks of high intensity sprint-
interval training in trained cyclists. Int J Sports Med 25: 92-98, 2004.
18. Dellal, A, Keller, D, Carling, C, Chaouachi, A, Wong del, P, and Chamari, K.
Physiologic effects of directional changes in intermittent exercise in soccer
players. J Strength Cond Res 24: 3219-3226, 2010.
19. Durandt, J, Tee, JC, Prim, SK, and Lambert, MI. Physical fitness
components associated with performance in a multiple-sprint test. Int J Sports
Physiol Perform 1: 150-160, 2006.
20. Hoff, J, and Helgerud, J. Endurance and strength training for soccer
players: physiological considerations. Sports Med 34: 165-180, 2004.
21. Impellizzeri, FM, Rampinini, E, Castagna, C, Bishop, D, Ferrari Bravo, D,
Tibaudi, A, and Wisloff, U. Validity of a repeated-sprint test for football. Int J
Sports Med 29: 899-905, 2008.
22. Jacobs, R, Bobbert, MF, and van Ingen Schenau, GJ. Function of mono-
and biarticular muscles in running. Med Sci Sports Exerc 25: 1163-1173, 1993.
23. Jones, P, Bampouras, TM, and Marrin, K. An investigation into the physical
determinants of change of direction speed. J Sports Med Phys Fitness 49: 97-
104, 2009.

251
24. Krustrup, P, and Bangsbo, J. Physiological demands of top-class soccer
refereeing in relation to physical capacity: effect of intense intermittent exercise
training. J Sports Sci 19: 881-891, 2001.
25. Krustrup, P, Mohr, M, Amstrup, T, Rysgaard, T, Johansen, J, Steensberg,
A, Pedersen, PK, and Bangsbo, J. The yo-yo intermittent recovery test:
physiological response, reliability, and validity. Med Sci Sports Exerc 35: 697-
705, 2003.
26. Krustrup, P, Mohr, M, Ellingsgaard, H, and Bangsbo, J. Physical Demands
during an Elite Female Soccer Game: Importance of Training Status. Medicine
& Science in Sports & Exercise 37: 1242-1248, 2005.
27. Magalhães, J, Oliveira, J, Ascensao, A, and Soares, J. Concentric
quadriceps and hamstrings isokinetic strength in volleyball and soccer players.
J Sports Med Phys Fitness 44: 119-125, 2004.
28. Magalhaes, J, Rebelo, A, Oliveira, E, Silva, JR, Marques, F, and Ascensao,
A. Impact of Loughborough Intermittent Shuttle Test versus soccer match on
physiological, biochemical and neuromuscular parameters. Eur J Appl Physiol
108: 39-48, 2009.
29. Metaxas, T, Sendelides, T, Koutlianos, N, and Mandroukas, K. Seasonal
variation of aerobic performance in soccer players according to positional role. J
Sports Med Phys Fitness 46: 520-525, 2006.
30. Mohr, M, Krustrup, P, and Bangsbo, J. Match performance of high-standard
soccer players with special reference to development of fatigue. J Sports Sci
21: 519-528, 2003.
31. Mohr, M, Krustrup, P, and Bangsbo, J. Fatigue in soccer: a brief review. J
Sports Sci 23: 593-599, 2005.
32. Mohr, M, Krustrup, P, Nybo, L, Nielsen, JJ, and Bangsbo, J. Muscle
temperature and sprint performance during soccer matches--beneficial effect of
re-warm-up at half-time. Scand J Med Sci Sports 14: 156-162, 2004.
33. Mujika, I, Santisteban, J, Impellizzeri, F, and Castagna, C. Fitness
determinants of sucess in men`s and women`s football. J Sports Sci: 1-8, 2008.

252
34. Nummela, AT, Paavolainen, LM, Sharwood, KA, Lambert, MI, Noakes, TD,
and Rusko, HK. Neuromuscular factors determining 5 km running performance
and running economy in well-trained athletes. Eur J Appl Physiol 97: 1-8, 2006.
35. Nunez, VM, Da Silva-Grigoletto, ME, Castillo, EF, Poblador, MS, and
Lancho, JL. Effects of training exercises for the development of strength and
endurance in soccer. J Strength Cond Res 22: 518-524, 2008.
36. Osgnach, C, Poser, S, Bernardini, R, Rinaldo, R, and di Prampero, PE.
Energy cost and metabolic power in elite soccer: a new match analysis
approach. Med Sci Sports Exerc 42: 170-178, 2010.
37. Paavolainen, L, Hakkinen, K, Hamalainen, I, Nummela, A, and Rusko, H.
Explosive-strength training improves 5-km running time by improving running
economy and muscle power. J Appl Physiol 86: 1527-1533, 1999.
38. Paavolainen, LM, Nummela, AT, and Rusko, HK. Neuromuscular
characteristics and muscle power as determinants of 5-km running
performance. Med Sci Sports Exerc 31: 124-130, 1999.
39. Rahnama, N, Less, A, and Reilly, T. Electromyography of selected lower-
limb muscles fatigued by exercise at the intensity of soccer match-play. Journal
of Electromyography and Kinesiology: 1-7, 2005.
40. Rahnama, N, Reilly, T, Lees, A, and Graham-Smith, P. Muscle fatigue
induced by exercise simulating the work rate of competitive soccer. J Sports Sci
21: 933-942, 2003.
41. Rampinini, E, Bishop, D, Marcora, SM, Ferrari Bravo, D, Sassi, R, and
Impellizzeri, FM. Validity of simple field tests as indicators of match-related
physical performance in top-level professional soccer players. Int J Sports Med
28: 228-235, 2007.
42. Rampinini, E, Coutts, AJ, Castagna, C, Sassi, A, and Impellizzeri, F.
Variation in top level soccer match performnance. Int J Sports Med 28: 1018-
1024, 2007.
43. Randers, M, Rostgaard, T, and Krustrup, P. Physical match performance
and Yo-Yo IR2 test results of successful and unsuccessful football teams in the
Danish Premier League. Journal of Sports Science and Medicine 6: 70-71,
2007.

253
44. Randers, MB, Mujika, I, Hewitt, A, Santisteban, J, Bischoff, R, Solano, R,
Zubillaga, A, Peltola, E, Krustrup, P, and Mohr, M. Application of four different
football match analysis systems: a comparative study. J Sports Sci 28: 171-182,
2010.
45. Rebelo, N, Krustrup, P, Soares, J, and Bangsbo, J. Reduction in
intermittent exercise performance during a soccer match. Journal of Sport
Sciences 16: 482-483, 1998.
46. Semenick, D. The T-test. Natl. Strength Cond. Assoc. J. 12: 36-37, 1990.
47. Svensson, M, and Drust, B. Testing soccer players. J Sports Sci 23: 601-
618, 2005.

254

255
Table1. Rank of opposing team, frequency of activities and distance covered in
different locomotion categories throughout the different evaluation moments of
the season (means + standard deviation).
E1 E2 E3 E4
Rank opposite team
(result)
10th - 4th
(V-V)
7th - 9th
(T-V)
14th - 15th
(V-V)
5th - 2nd
(V-T)
Frequencies (n)
Total 1526 + 251 1577 + 200 1583 + 184 1515 + 143
FLI 635 + 88 711 + 90 718 + 124 650 + 89
FHI 130 + 27** 130 + 24** 130 + 26** 189 + 41
Distance covered (km)
TD 9.15 + 0.64 9.0 + 0.41 * 9.35 + 0.47 9.6 + 0.31
TD 1st
half 4.5 + 0.33 4.5 + 0.24** 4.7 + 0.27 4.8 + 0.23
TD 2nd
half 4.65 + 0.39 4.5 + 0.2* 4.6 + 0.19 4.8 + 0.15
LI 4.2 + 0.53 4.4 + 0.44 4.7 + 0.41 4.3 + 0.39
LI 1st
half 2.1 + 0.31 2.2 + 0.24 2.4 + 0.28† 2.2 + 0.30
LI 2nd
half 2.1 + 0.27 2.2 + 0.21 2.3 + 0.23 2.1 + 0.26
HI 1.35 + 0.28 1.25 + 0.1** 1.27 + 0.1** 1.9 + 0.55
HI 1st
half 0.64+0.25** 0.6 + 0.09** 0.63+0.07** 1.0 + 0.31
HI 2nd
half 0.72 + 0.06 0.65 + 0.05 0.64 + 0.06 0.9 + 0.25
*significantly different from E3 and E4(p<0.05); **significantly different from E4(p<0.05);
†significantly different from E1; E1 - Evaluation 1; E2 - Evaluation 2; E3 - Evaluation 3; E4 -
Evaluation 4; FLI- frequency of low intensity activities; FHI - frequency of high intensity
activities; LI - Low-intensity running; HI – High intensity running; TD - Total distance. V- Victory;
T – Tie.

256

257
Table 2. Distance covered in different categories of high-intensity running throughout the season
(mean + standard deviation).
High-intensity running (m)
E1 E2 E3 E4
Moderate speed running 1st half 399 + 49 365 + 52* 367 + 50* 552 + 163
2nd half 437 + 156 397 + 23 361 + 67 490 + 160
Total 837 + 157 763 + 48 728 + 99* 1043 + 320
High speed running 1st half 190 + 34* 189 + 34* 210 + 43 338 + 104
2nd half 229 + 77 200 + 30* 219 + 22 322 + 89
Total 420 + 107 380 + 56* 430 + 54 661 + 193
Sprint 1st half 46 + 12* 50 + 19* 53 + 26* 124 + 50
2nd half 52 + 21 46 + 12 59 + 16 82 + 30
Total 98 + 28* 96 + 25* 111 + 33* 206 + 78
* significantly different from E4 (p < 0.05); E1 - Evaluation 1; E2 - Evaluation 2; E3 - Evaluation 3; E4 - Evaluation 4;

258

259
Table 3. Physiological and functional data of the professional soccer players (mean + standard deviation; N=13).
Muscle power related tests Isokinetic knee strength (90º.s-1
; Nm) Intermittent endurance test
T5 (s) T30 (s) COD (s) CMJ (cm)
KED KEND KFD KFND
YYIE2(m) HRmax HRmean
1.02+0.05 4.2+0.13 8.57+0.4 42.4+4.4
233+29 230+32 130+17 123+16
1776+358 196±7 181±7
YYIE2- Yoyo intermittent endurance test level 2; T5- 5 meters sprint time; T30 – 30 meters sprint time; COD- change of direction test; CMJ – counter
movement jump; KED – Peak torque of knee extensors dominant leg; KEND – Peak torque of knee extensors non-dominant leg; KFD – Peak torque of
knee flexors dominant leg; KFND – Peak torque of knee flexors non- dominant leg; HRmax – maximum heart rate; HRmean – mean heart rate;

260

261
Table 4. Correlations between time-motion variables and sprint, agility, CMJ,
and Composite scores of power related tests (CSPRT).
T5 (s) T30 (s) COD (s) CMJ CSPRT
Next5-min -0.578*
(p=0.039)
-0.631*
(p=0.021)
-0.545
(p=0.054)
0.400
(p=0.175)
0.677*
(p=0.011)
%DecP5/N5 0.569*
(p=0.042)
0.622*
(p=0.023)
0.601*
(p=0.030)
-0.516
(p=0.071)
-0.725**
(p=0.005)
HI3rd -0.674*
(p=0.012)
-0.473
(p=0.103)
-0.561*
(p=0.046)
0.195
(p=0.522)
0.598*
(p=0.031)
HI4th -0.623*
(p=0.023)
-0.581*
(p=0.037)
-0.473
(p=0.103)
0.220
(p=0.943)
0.534
(p=0.060)
HI3rd
+ 6th -0.404
(p=0.171)
-0.348
(p=0.244)
-0.013
(p=0.966)
0.555
(p=0.052)
0.413
(p=0.161)
SP1st
half -0.589*
(p=0.034)
-0.458
(p=0.115)
-0.147
(p=0.632)
-0.099
(p=0.748)
0.344
(p=0.250)
SP2nd
half -0.564*
(p=0.045)
-0.726**
(p=0.005)
-0.341
(p=0.254)
0.347
(p=0.245)
0.622*
(p=0.023)
SP -0.621*
(p=0.023)
-0.650*
(p=0.016)
-0.298
(p=0.324)
0.089
(p=0.772)
0.521
(p=0.068)
SP1st
+ 4th -0.590*
(p=0.034)
-0.482
(p=0.096)
-0.194
(p=0.525)
0.101
(p=0.747)
0.430
(p=0.143)
*p < 0.05; **p<0.01; T5 - 5-m sprint time; T30 – 30-m sprint time; COD - change of direction
test; CMJ – countermovement jump; Next5-min - peak distance in HI in a five-minute period
after peak five-minute period (P5-min) of the game; %DecP5/N5 – decrement from P5-min to
Next5-min; HI3rd
-4th
– distance in HI in the 3
rd and 4
th 15-minutes periods of the match; HI3
rd+6
th
– sum of distance in HI in the 3rd
and 6th 15-minutes period of the match; SP1
sthalf - distance in
sprinting in the first half of the match; SP2nd
half - distance in sprinting in the second half of the
match; SP - distance in sprinting during all match; SP1st
+4th
– sum of sprinting in the 1st and 4
th
15-minutes periods of the match;

262

263
Table 5. Correlations between time-motion variables, isokinetic parameters and composite scores of isokinetic strength
KED
(Nm)
KEND
(Nm)
KFD
(Nm)
KFND
(Nm)
CSKE CSKF CSKEF
HI%Dec1st
/3rd -0.312
(p=0.323)
-0.560
(p=0.058)
-0.346
(p=0.270)
-0.586*
(p=0.045)
-0.470
(p=0.123)
-0.485
(p=0.110)
-0.497
(p=0.100)
HI%Dec4th
/6th
-0.493
(p=0.104)
-0.611*
(p=0.035)
-0.414
(p=0.181)
-0.449
(p=0.143)
-0.594*
(p=0.042)
-0.450
(p=0.142)
-0.542
(p=0.069)
HI%Dec1st
/6th -0.328
(p=297)
-0.581*
(p=0.047)
-0.329
(p=0.297)
-0.429
(p=0.164)
-0.490
(p=0.106)
-0.395
(p=0.204)
-0.459
(p=0.133)
HI%AvDec 1st/ 3rd - 4th/6th -0.486
(p=0.109)
-0.733**
(p=0.007)
-0.470
(p=0.123)
-0.667*
(p=0.018)
-0.657*
(p=0.020)
-0.592*
(p=0.042)
-0.649*
(p=0.022)
*p < 0.05; KED – peak torque of knee extensors dominant leg; KEND – peak torque of knee extensors non-dominant leg; KFD – peak torque of knee
flexors dominant leg; KFND – peak torque of knee flexors non-dominant leg; CSKE - composite scores of knee extensors; CSKE - composite scores of
knee flexors; CSKE - composite scores of knee extensors and flexors; HI%Dec1st
/3rd
– decrement (%) in HI from the highest (1st) to the lowest (3
rd)
intense 15-minutes period of first half; HI%Dec4th
/6th
- decrement (%) in HI from the highest (4th) to the lowest (6
th) intense 15-minutes period of second
half; HI%Dec1st
/6th
– decrement (%) in HI from the 1st to the last 15-minutes period; HI%AvDec1
st/ 3
rd- 4
th/ 6
th – Average decrement (%) from the highest to the
lowest intense 15-minutes period (1st
to 3rd
and 4th
to 6th) of both halves (HI%AvDec1
st/ 3
rd- 4
th/ 6
th).

264

265
FIGURES
Figure 1 – Season profile and measurement schedule.
Figure 2 - Layout of the T-test. Modified from Semenick (1990).

266
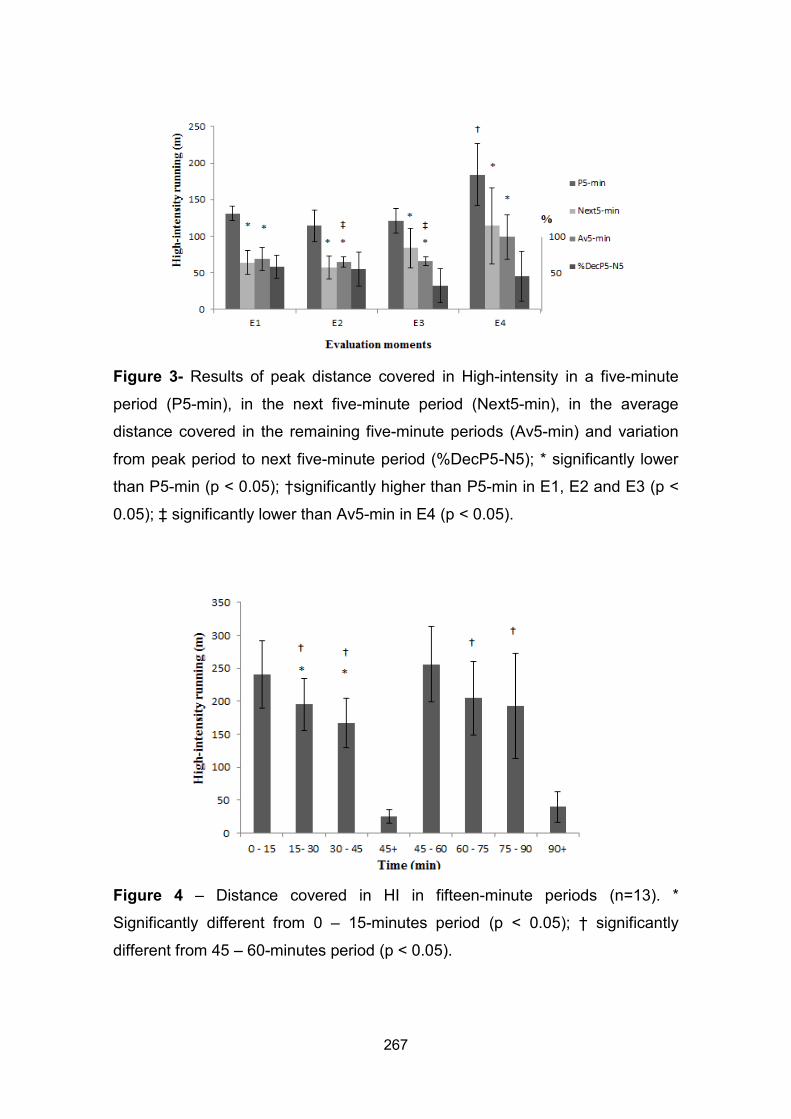
267
Figure 3- Results of peak distance covered in High-intensity in a five-minute
period (P5-min), in the next five-minute period (Next5-min), in the average
distance covered in the remaining five-minute periods (Av5-min) and variation
from peak period to next five-minute period (%DecP5-N5); * significantly lower
than P5-min (p < 0.05); †significantly higher than P5-min in E1, E2 and E3 (p <
0.05); ‡ significantly lower than Av5-min in E4 (p < 0.05).
Figure 4 – Distance covered in HI in fifteen-minute periods (n=13). *
Significantly different from 0 – 15-minutes period (p < 0.05); † significantly
different from 45 – 60-minutes period (p < 0.05).

268
269
Experimental Work
Study IV
Title: Impact of Loughborough Intermittent Shuttle Test versus soccer match on
physiological, biochemical and neuromuscular parameters
Running Title : LIST and Football
José Magalhães, PhD, 1,3* António Rebelo, PhD, 2,* Eduardo Oliveira, MSc, 3
João Renato Silva, MSc1,2, Franklim Marques, PhD, 4,5 António Ascensão,
PhD,1,3*
1 Centre for Research in Physical Activity, Health and Leisure, Faculty of Sport,
University of Porto
2 Department of Soccer, Faculty of Sport, University of Porto
3 Department of Sports Biology, Faculty of Sport, University of Porto
4 Department of Clinical Analysis, Faculty of Pharmacy, University of Porto
5 Institute for Molecular and Cell Biology, University of Porto
* José Magalhães, António Ascensão and António Rebelo contributed equally
Eur J App Physiol (2010) 108 (1): 39-48.

270

271
Abstract
The aim of the present study was to analyse the impact of Loughborough
Intermittent Shuttle Test (LIST) vs. soccer match on heart rate (HR), muscle
damage, redox status, blood leukocytes and neuromuscular function throughout
72h recovery. Sixteen male soccer players (21.3±1.1 years; 175.0±6.0 cm;
70.7±6.3 kg) completed LIST and performed a soccer match separated by 2wks
and data were collected before, 30 min, 24, 48 and 72-hours after LIST and
match. HR, plasma creatine kinase (CK) activity, myoglobin (Mb), uric acid
(UA), protein sulfhydryls (-SH), malondialdehyde (MDA) contents, total
antioxidant status (TAS), blood leukocyte counts, delayed onset muscle
soreness, 20m sprint and jump performances, and maximal isokinetic knee
extension and flexion were analyzed. HR after LIST was significantly lower than
after the match. Post-match TAS was lower and UA was higher than after LIST.
Thirty minutes and 24h after soccer MDA was higher and –SH was lower than
after LIST (p<0.05). LIST and soccer match induced elevation in total
leukocytes and a reduction in lymphocytes at 30 min. This reduction in blood
lymphocytes 30 min after match was lower than after LIST. In conclusion, the
impact of both exercises did not differ regarding the observed muscle damage
markers and some neuromuscular parameters, although soccer require higher
cardiac demand and induced higher changes on redox status, adenine
nucleotide metabolism and on lymphocyte counts than LIST, which should be
taken into account when using LIST to simulate a match to study these type of
physiological and biochemical-related endpoints.
Keywords: Intermittent exercise, muscle damage, oxidative damage,
antioxidants, fatigue and recovery

272

273
Introduction
The physiological, biochemical and neuromuscular impact of intermittent multi-
sprint sports, including soccer, has been studied through different
methodologies. Time motion analysis of soccer match provides information
regarding total distance covered and type of movement, number of physical
contacts, tackles, headers and kicks performed by players. Moreover, specific
field approaches during soccer matches (Krustrup et al., 2006), tentative
replications of match demands in laboratory (Drust, Reilly, & Cable, 2000) or a
combination of field and lab tests (Greig, McNaughton, & Lovell, 2006) have
been designed to monitor heart rate, blood and muscle metabolite alterations,
estimated energy expenditure and oxygen uptake of soccer players. These
laboratory and field tests are used to uncover the lack of control of the activity
pattern and exercise intensity in a game, resulting from the randomized order of
players’ actions, thus allowing a standardized analysis of metabolic,
biochemical and functional features of intermittent exercise. Among several
intermittent field tests, the Loughborough Intermittent Shuttle Test (LIST) has
been used to study the effects of the ingestion of carbohydrate-electrolyte
solutions or meals (Foskett, Williams, Boobis, & Tsintzas, 2008; Nicholas,
Tsintzas, Boobis, & Williams, 1999; Nicholas, Williams, Lakomy, Phillips, &
Nowitz, 1995), fluid ingestion and gastric emptying (Leiper, Nicholas, Ali,
Williams, & Maughan, 2005), muscle metabolism and temperature (Morris,
Nevill, Boobis, Macdonald, & Williams, 2005), muscle soreness and damage
(Thompson, Nicholas, & Williams, 1999), heat acclimatisation protocols
(Sunderland, Morris, & Nevill, 2007), cryotherapy treatment against muscle
damage (Bailey et al., 2007), as well as the influence of antioxidants (Kingsley,
Wadsworth, Kilduff, McEneny, & Benton, 2005; Thompson, Williams, Kingsley,
et al., 2001) on intermittent exercise performance and recovery with special
reference to soccer. In fact, some authors have suggested that LIST is a field
test that simulates the activity pattern and the workload imposed by soccer, i.e.,
was designed to mimic the activities performed and the distance covered in a
typical soccer match (Bishop, Blannin, Robson, Walsh, & Gleeson, 1999;

274
Nicholas, Nuttall, & Williams, 2000). This was based on data from time-motion
analysis and estimated indirect calorimetry variables (Nicholas, et al., 2000).
However, the analysis of the distance covered by players during the match
tends to underestimate the energy expended as many unorthodox modes of
motion, such as running backwards and sideways, jumping, decelerating and
changing direction, as well as the dribbling and contesting possession
accentuate the mechanical and metabolic loading (Reilly, 1997). Moreover,
even considering the pre-defined turns implying acceleration and decelerations
during LIST, the great quantity and variety of soccer actions associated with
eccentric contractions during a match are expected to cause additional muscle
disturbances in soccer when compared to LIST.
Recent studies from our lab and others have analyzed the response of
performance indices, muscle damage, inflammation as well as oxidative stress
and damage markers of male and female soccer players during the recovery
from a match (Andersson et al., 2008; Ascensao et al., 2008; Ispirlidis et al.,
2008), as the recovery is thought to be influenced by changes in these
functional and biochemical parameters. Some of these endpoints have also
been measured during the recovery period after the LIST (Bailey, et al., 2007;
Kingsley, et al., 2005; Thompson, et al., 1999; Thompson et al., 2003;
Thompson, Williams, Kingsley, et al., 2001). In addition to the comparison of
time-motion analysis and estimated indirect calorimetry variables between LIST
vs. soccer match (Nicholas, et al., 2000), no data had been published
comparing the impact of LIST vs. soccer on biochemical and neuromuscular
parameters. Therefore, it would be of interest to examine whether, and to what
extent, muscle damage, plasma oxidative stress and damage and blood
inflammatory markers, as well as lower limb neuromuscular variables such as
jump, 20m sprint ability and strength performance, are altered in response to
LIST vs. soccer. Thus, the present study aimed to comparatively analyse the
effect of LIST vs. soccer match on muscle damage, plasma antioxidant
capacity, oxidative damage, blood leukocyte counts, and neuromuscular
variables throughout 72h post-exercise recovery period. Our hypothesis is that
soccer induces higher levels of muscle and oxidative damage than LIST.

275
Methods
Subjects
Sixteen male soccer players from 2rd and 3th Portuguese divisions participated
in this study after being informed about the aims, experimental protocol,
procedures and after delivering writing consents. At the time of the experiments,
the players were in the competitive period of the season, performing 4-5 training
sessions per week. The experimental protocol was approved by the Ethical
Committee of Faculty of Sport, University of Porto, Portugal, and followed the
Declaration of Helsinki of the World Medical Association for research with
humans.
Experimental design and procedures
The players performed the LIST and one soccer match separated by 2-wks
(Figure 1). For 2 weeks prior to data collection and during the protocol period,
soccer players were instructed not to change their normal eating habits and to
refrain from additional vitamin, antioxidant dietary supplementation or any
recovery treatment such as cryotherapy. Subjects were also instructed to
abstain from exhaustive exercise during the 72-h pre- and post- LIST and
match, with exception of the functional evaluation tests. The overall set up was
performed during a 3-wks interruption of the competitive period. During the
remaining days, with the exception of the 72h pre and post protocol periods, the
players were engaged in normal training routines.
The temperature at the days of field exercise (LIST and soccer match) was
around 16ºC.
***Insert Figure 1***
Blood samples and functional data (jump and sprint performance, quadriceps
and hamstrings muscle strength) were assessed pre LIST/match and at 30 min,
24, 48 and 72 h of the recovery period. On the day of the LIST/match, players
arrived at the laboratory after an overnight fast between 10.00 and 12.00 h. A

276
resting blood sample was taken after subjects had been standing for at least 15
min, after which subjects consumed a light standardizing meal and drink and
rested for 2 h. According to Thompson et al. (2003) the meal consisted of 1.7
g/kg white bread and 0.3 g/kg of low-fat spread. Rest muscle strength, jump and
sprint performance were assessed during the 2 h period between the
consumption of pre-exercise meal and the start of the LIST/match.
For 3 days after the LIST/match, subjects returned to the laboratory. A blood
sample was taken from the forearm vein in the same conditions above
described. Subsequently, the players performed the sprint and strength tests as
outlined below.
Preliminary measurements
The players performed an incremental (0.1 m/sec increase each 1min step)
treadmill (Quasar-Med, Nussdorf, Germany) test until voluntary exhaustion to
determine maximal oxygen uptake (VO2max) and maximal heart rate (HRmax,
Vantage NV, Polar Electro, Finland). Expired respiratory gas fractions were
measured using an open circuit breath-by-breath automated gas-analysis
system (Cortex, Metalyzer, 3B, Germany). From the VO2max, running speeds
corresponding to 55% and 95% VO2max were calculated. Thereafter, the
subjects performed the LIST for 30 min to familiarize with the test. Jump and
20m sprint abilities and strength performance were also evaluated at baseline
as described below.
The Loughborough Intermittent Shuttle Test
The 90 min shuttle run test was conducted according to Thompson et al. (1999)
in a natural green soccer pitch. Briefly, the participants were required to run
between two lines, 20m apart, at various speeds dictated by an audio signal
and based on the velocities corresponding to their individual VO2max. The
exercise periods were designed as follows:
* 3 x 20 m walking
* 1 x 20 m maximal running sprint
* 4 sec recovery
277
* 3 x 20 m at a running speed corresponding to 55% VO2max
* 3 x 20 m at a running speed corresponding to 95% VO2max
This pattern was repeated for each 15 min exercise block followed by the
corresponding 3 min recovery period for 5 times.
Heart rate (HR) during the LIST was measured and recorded every 5 s.
Match time-motion analysis
For time motion analysis each player was video-filmed close up during the
entire match. The videotapes were later replayed for computerized time-motion
analyses according to the procedures described by Mohr et al. (2003) The used
motor pattern categories included standing (0 km.h-1), walking (6 km.h-1),
jogging (8 km.h-1), low-speed running (12 km.h-1), moderate-speed running (15
km.h-1), high-speed running (18 km.h-1), sprinting (30 km.h-1), sideways, and
backwards (10 km.h-1) running. The match activities were later analysed
considering standing, walking, jogging, cruising, sprinting, backwards running
and sideways running.
Heart rate was also measured during the match as previously described.
Delayed Onset muscle soreness (DOMS)
After LIST/match and prior to blood sampling, each subject was asked to
complete a leg muscle soreness questionnaire, in which they rated their
perceived muscle soreness on a scale from 0 (normal absence of soreness) to
10 (very intense sore).
Blood sampling and preparations
All venous blood samples were taken by conventional clinical procedures as
described previously (Magalhaes et al., 2007). An aliquot of the whole blood
was used to perform leukocyte counts as indirect markers of muscle damage.
The remaining freshly withdrawn blood was immediately centrifuged at 3000
rpm during 10 min to obtain plasma. Plasma was separated into aliquots and
rapidly frozen at –80ºC for later biochemical analysis of the muscle damage
markers myoglobin (Mb) and creatine kinase (CK), as well as the redox state

278
using total antioxidant status (TAS), malondialdehyde (MDA), protein sulfhydryl
groups (SH) and uric acid (UA).
Biochemical Assays
Muscle damage
Plasma CK activity was determined spectrophotometrically using a commercial
kit (ABX A11A01632, Mompelier, FR). Plasma Mb concentration was assessed
using a commercial kit (myoglobin bioMerieux 30446, Carnaxide, PT).
Leukocyte count was assessed by an automatic cell counter (Horiba 60; ABX
Diagnostics, France). Whole blood smears on glass slides (VBS 655/A
Microscope - Biosigma) were used for white blood cell differential analysis.
Smears were stained using Wright coloring (Merck) and air-dried. Cell
differentials were performed using an Olympus microscope equipped with
1000X oil immersion lens.
Redox state
TAS was measured spectrophotometrically using a commercial kit (Randox
NX2332 Crumlin, UK). Uric acid was determined by an enzymatic method using
a commercial kit (Horiba ABX A11A01670, Montpellier, France).
Plasma MDA was assayed according to Rohn et al. (1993) with some
modifications and measured by the formation of thiobarbituric acid reactive
substances at 535 nm. Plasma SH was spectrophotometrically evaluated at
414nm according to Hu (1990). Protein content was spectrophotometrically
assayed using bovine serum albumin as standard according to Lowry et al.
(1951). Samples were analysed in duplicate and the mean of the two values
was used for statistical analysis.
Jumping performance
Vertical jumping was evaluated on a Bosco’s mat (Ergojump, Globus, Italy). In
accordance with Hertogh et al., (2005) free counter-movement jumps with
extension of both upper limbs were chosen to simulate spontaneous jumping
movements. The depth of the counter-movement was self-selected and

279
represented each players’ optimal depth for maximal jump. Each athlete
performed three jumps and the best result expressed as jump height was
recorded.
20m sprint ability
Sprint ability measurements were carried out using telemetric photoelectric cells
placed at 0 and 20m (Brower Timing System, IRD-T175, USA). The players
stood 1m behind the starting line, started on a verbal signal being time activated
when players cross the first pair of photocells, and then ran as fast as they could
to complete the 20m distance. Players completed two runs interspersed by 1
min recovery period and the best time was registered.
Strength assessment
To evaluate muscle function subjects were familiarized with the muscle function
test on at least two occasions during preliminary visits to the laboratory.
Maximal gravity corrected concentric peak torque of quadriceps and hamstrings
was measured during isokinetic knee joint movement of dominant leg at an
angular velocity of 90.s-1 (1.57 rad.s-1) using a isokinetic dynamometer (Biodex
System 2, USA) as described previously by our group (Magalhães, Oliveira,
Ascensao, & Soares, 2004).
Fluid loss and intake
To determine sweat loss the players were weighed wearing dry shorts
immediately before and after the LIST and match using a digital weight (Tanita
Scale BC533). The subjects were allowed to drink water ad libitum during both
the LIST and the match, and their water intake was recorded.
Statistics
Mean, standard deviation and standard error mean were calculated for all
variables. A Kolmogorov-Smirnov test was used to test whether physiological,
biochemical and neuromuscular-related variables were normally distributed.

280
Two-way analysis of variance (ANOVA) for repeated measures followed by the
Bonferroni post-hoc test was used to compare variables between LIST and
soccer at the analyzed time points (before vs. 30 min vs. 24h vs. 48 h vs. 72 h).
When there were only single comparisons, a paired sample t-test was used to
determine whether any differences between LIST and soccer existed. All data
analysis was performed using SPSS 17.0 package. The significance level was
set at 5%.
Results
Physiological and anthropometric characteristics of the soccer players are
presented in table 1.
*** Insert Table 1 ***
Time-motion analysis showed that players were around 80 minutes of match
time involved in low intensity activities including standing, walking, jogging and
cruising, and 8 minutes in high intensity activities including sprinting, backwards
and sideways running, corresponding to approximately 92 and 8% of the total
match time, respectively (table 2).
*** Insert Table 2 ***
The mean heart rate during the match was 173.0±8.8 bpm and the peak heart
rate was 195.6±6.0 bpm, which corresponds to 87.1±3.2% and 99.7±7.0%,
respectively, of the maximal heart rate previously determined. Mean heart rate
during the match (including 1st and 2nd halves) was significantly higher than
during the LIST (Figure 2).
*** Insert Figure 2 ***
Plasma Mb content increased 30 min after both LIST and match (p<0.05),
returning to baseline at 24, 48 and 72 h recovery. No significant differences

281
were found between LIST and soccer in any analyzed time point (Fig 3A).
Plasma CK activity and DOMS increased at 30 min, 24, 48 and 72 h after LIST
and match when compared to pre-exercise values (p<0.05), but no significant
differences were found between protocols in any time point (Fig 3B, 3C).
*** Insert Figure 3 ***
Plasma TAS (Fig 4A) increased significantly at 30 min, 24, 48 and 72 h
recovery time points after both LIST and match. Plasma UA only increased at
30 min after both LIST and match (Fig 4B). The increases in TAS and UA at 30
min were higher after the match than after the LIST (p<0.05). Plasma MDA and
SH levels (Fig 4C, 4D) respectively increased and decreased at 30 min, 24, 48
and 72 h both after LIST and soccer (p<0.05). The increase in MDA and the
decrease in SH contents 30 min and 24 h after the match were significantly
higher than after LIST.
*** Insert Figure 4 ***
LIST and match increased blood leukocytes counts (Fig 5A) at 30 min (p<0.05)
which returned to baseline values at 24, 48 and 72h recovery. No differences
were observed between LIST and match for any time point. After both LIST and
match, lymphocytes counts at 30 min were significantly lower than pre-exercise
values, returning to baseline values at 24 h. However, match induced a
significantly higher lymphopenia than LIST at 30 min.
*** Insert Figure 5 ***
LIST and match induced significant reductions in jump (fig 6A) and sprint (fig
6B) abilities as well as in isokinetic peak torques for knee extension (fig 6C) and
flexion (fig 6D) until 72 h recovery. No significant differences were found
between LIST and match in the analyzed neuromuscular parameters with the

282
exception of sprint performance, which was less affected after LIST than after
soccer at 30 min and 24 h recovery (p<0.05).
*** Insert Figure 6 ***
The fluid loss during LIST vs. match was 0.88 ± 0.17 L vs. 0.90 ± 0.2 L, or 1.2 ±
0.3 % vs. 1.2 ± 0.5 % of the body mass, respectively. The fluid intake was 0.74
± 0.1 L vs. 0.65 ± 0.1 L. Thus, the total fluid loss was similar between the two
conditions, respectively 1.62 ± 0.4 L vs. 1.55 ± 0.3 L, corresponding to 2.3 ± 0.3
% vs. 2.2 ± 0.4 % of the body mass.
Discussion
Intensity of the soccer match
The match examined in the present study was a friendly game played by
secondary division players, and it should be thus considered how far the
intensity is from games played at an elite level. Nevertheless, the mean and
absolute HR values were similar to those reported for Danish soccer players
from similar level (Krustrup, et al., 2006). Additionally, time-motion analysis
showed that the frequency and the percentage of time both at low and high
intensity activities were also similar to that described for players of the same
level, although below to those observed in elite players (Mohr, et al., 2003).
These observations may suggest that the analyzed match intensity was
somewhat similar to other non-elite games, and probably lower than the
intensity performed by elite soccer players.
Muscle damage
The tendency and magnitude of changes induced by both LIST and match in
muscle damage-related parameters were somewhat expected and in the range
of similar exercise protocols (Andersson, et al., 2008; Bailey, et al., 2007;
Kingsley, et al., 2005; Thompson et al., 2004; Thompson, et al., 1999;
Thompson, Williams, McGregor, et al., 2001), being the significant alterations
observed after the match in plasma CK, Mb, DOMS and leg strength close to

283
some reported after LIST protocol (Kingsley, et al., 2005; Thompson, et al.,
1999; Thompson, et al., 2003; Thompson, Williams, Kingsley, et al., 2001).
Although the activity pattern of LIST is representative of the typical activities of
soccer, there are activities such as jumping, running backwards and time in
possession of ball that are not included. Some of these unorthodox activities,
together with tackles and sudden direction changes rely greatly on eccentric
contractions, probably increasing the neuromuscular demands imposed by
match when compared with LIST. The considerable amount of this type of
lengthening-based contractions characteristic of soccer were initially expected
to induce additional signs of muscle injury in match when compared to LIST.
However, no differences in plasma CK and Mb, as well as in DOMS levels and
lower limb strength were observed between the match and the LIST during
recovery. One hypothetical reason to explain this absence of differences might
be the number of turns, including accelerations and decelerations during LIST.
As reported after other types of exercise (Ascensao et al., 2007; Magalhaes, et
al., 2007) and also after match (Ascensao, et al., 2008; Ispirlidis, et al., 2008),
data showed that LIST and match induced a leukocytosis. This can be ascribed
to the mobilization of blood cells from marginal pools by hemodynamic
redistribution and augmentation that resulted from exercise-related metabolic
conditions, such as enhanced catecholamine secretion (Bangsbo, 1994). Our
results also reported a marked lymphocytopenia during the subsequent period
after both exercise protocols. Nevertheless, lymphocyte counts differed
significantly between LIST and match at 30 min recovery being lower in match
than in LIST. In comparison to concentric exercise, eccentric activity has been
shown to result in a greater release of immune system modulators such as
proinflammatory cytokines, acute phase proteins, and the recruitment of
phagocytic cells with the potential to release ROS (Malm et al., 2000). These
signals may favor additional oxidative stress and damage, as well as apoptosis
in several tissues and cells, including lymphocytes. However, the hypothesis
that a higher apoptosis-induced lymphocytopenia observed after match than
after LIST can be attributed to the referred unorthodox eccentric activities during
match is unlikely, as Simpson et al.(2007) reported that the levels of blood

284
lymphocytopenia apoptosis observed after downhill running were not different
compared with intensive running. The precise reasons for the lower lymphocyte
counts after match should be further investigated.
Redox status
Match induced higher increases in UA (30 min) and MDA (30 min and 24 h)
contents than LIST. Moreover, TAS (30 min) and SH (30 min and 24 h) were
lower after match than after LIST. These results suggest that match may induce
higher changes on redox status and on adenine nucleotide metabolism than
LIST. Given that around 1-5% of the total oxygen uptake results in the
generation of superoxide radical and given the elevated oxygen consumption
accompanying both LIST and match, it is not surprising its impact on these
biomarkers of oxidative stress and damage. Furthermore, other sources of free
radicals can influence cellular and blood antioxidant status. For example, stress
hormones undergoing autoxidation (Cooper, Vollaard, Choueiri, & Wilson, 2002)
and circulating neutrophils-induced oxidative burst (Quindry, Stone, King, &
Broeder, 2003) can contribute to blood oxidative stress and damage. The
influence of eccentric exercise-mediating muscular damage-like events on the
formation of free radicals has also been reported (Lee & Clarkson, 2003).
Considering the specific physiological demands imposed by the intermittent
exercise models used, none of these potential free radical sources should be
ruled out, although we cannot conclusively demonstrate a causal link between
any of those potential sources and the increased plasma oxidative stress and
damage.
This study also shows that plasma TAS and UA increased at 30 min after both
LIST and match. The observation that plasma UA levels increased in response
to LIST and match is consistent with the findings from other studies (Ascensao,
et al., 2007; Magalhaes, et al., 2007). However, match induced a higher
increase in UA levels than LIST (at 30 min), which should probably due to an
enhanced contribution of purine metabolism during match than during LIST.
Recent data from Krustrup et al. (2006) showed a significant decrease in
muscle ATP levels after an intense exercise period in the second half and after
285
the entire soccer match, as well as significant increase in muscle inosine
monophosphate content after an intense exercise period in the second half.
Moreover, increased blood ammonia, plasma UA and hypoxanthine contents
were earlier reported (Bangsbo, 1994). Therefore, it is likely that the observed
increased oxidative stress and damage during the intense exercise periods
comprised during the match might have a higher contribution from xanthine
oxidase free radical generating system than during LIST.
The enhanced oxidative damage induced by the match compared to LIST can
also be observed by the accumulation of lipid peroxidation by-products,
measured as plasma MDA. Accordingly, the match also induced a significant
decrease in plasma SH, suggesting increased disulphide linkages (-S-S-) from
both proteins and reduced glutathione (GSH).
Since both LIST and match did not seem to represent sufficient severe
muscular stimuli to cause leukocyte infiltration, as shown by the maintenance of
blood leukocyte counts from 24 to 72 h recovery period compared to baseline,
the possible effects of neutrophils-related oxidative burst on muscle damage
induced by match should probably be ruled out. However, other immune cells-
mediated free radical production during the post-exercise periods might be
considered, such as monocyte and macrophage oxidative burst (MacIntyre,
Reid, & McKenzie, 1995). It is possible that a delayed and continuous monocyte
mobilization from bone narrow, thus compensating infiltration of these cells into
muscle after damaging exercise (MacIntyre, et al., 1995) had occurred masking
leukocyte count changes in blood.
Neuromuscular function
In accordance with previous reports (Andersson, et al., 2008; Bailey, et al.,
2007; Kingsley, et al., 2005; Krustrup, et al., 2006; Nicholas, et al., 2000;
Thompson, et al., 2004; Thompson, et al., 1999; Thompson, et al., 2003;
Thompson, Williams, McGregor, et al., 2001), both LIST and match impaired
neuromuscular parameters assessed through measurements of sprint, jump
and strength performance. Interestingly, only sprint ability was more affected by
match than by LIST. Accordingly, Mohr et al. (2005) observed that soccer

286
players decreased their ability to sprint after intense periods of the game, as
well as after the end of the first and second halves. This temporary fatigue-
related impairment should also be expected in jump and strength performance.
In fact, considering that, at least in part, similar involvements of metabolic
pathways should occur in energy turnover during these maximal power-elicited
running and jumping tests, these distinct results were unexpected. An
hypothetical explanation based on the presumable changes in the force-velocity
relationship as a result of selective damage to type II muscle fibres induced by
the great amount of eccentric exercise during match is truly appealing (Twist &
Eston, 2005). In fact, a greater reliance on intra-muscular high-energy
phosphates in the countermovement jump instead of glycogen was likely to
occur. The relatively longer duration of the 2-3 seconds sprint test would rely
more heavily on glycogen metabolism, which may be affected by the
presumable eccentric exercise-induced muscle-damage and could, at least
partially, explain differences between the two tests (Twist & Eston, 2005). In
fact, both LIST and match induce significant glycogen depletion in skeletal
muscle fibres (Krustrup, et al., 2006; Nicholas, et al., 1999), although the effects
of glycogen depletion on high intensity/short duration performance should only
occur below critical levels. Alternatively, considering the distinct levels of motor
coordination involved in the actions of jumping and sprint running, the repeated
eccentric actions performed during the match might cause disturbances in
movement control (Bottas, Linnamo, Nicol, & Komi, 2005) affecting more
pronouncedly the running performance, which likely rely to a greater extent on
muscular coordination than a single jump or leg curl and extension.
In summary, the impact of LIST and match did not differ regarding the observed
muscle damage markers and some neuromuscular parameters, although match
require higher cardiac demand and induced higher changes on redox status,
adenine nucleotide and on lymphocyte metabolism than LIST, which should be
taken into account when using LIST to simulate a soccer match to study these
type of physiological and biochemical-related endpoints.

287
Acknowledgments
We would like to thank to soccer players involved in the study for their
committed participation. The excellent technical and practical assistance and
skilful involvement of Sergio Ribeiro, Ricardo Ladeira, Laura Pereira, Bárbara
Duarte, Henrique Reguengo, and camera operators as well as the friendly help
of André Seabra in the statistics revision is also appreciated. The authors are
grateful to City Council of Maia for providing the pitch where soccer match was
carried out. António Ascensão is supported by a grant from the Portuguese
Foundation for Science and Technology (SFRH/BPD/42525/2007).
References
Andersson, H., Raastad, T., Nilsson, J., Paulsen, G., Garthe, I., & Kadi, F.
(2008). Neuromuscular fatigue and recovery in elite female soccer:
effects of active recovery. Med Sci Sports Exerc, 40(2), 372-380.
Ascensao, A., Ferreira, R., Marques, F., Oliveira, E., Azevedo, V., Soares, J., et
al. (2007). Effect of off-road competitive motocross race on plasma
oxidative stress and damage markers. Br J Sports Med, 41(2), 101-105.
Ascensao, A., Rebelo, A., Oliveira, E., Marques, F., Pereira, L., & Magalhaes, J.
(2008). Biochemical impact of a soccer match - analysis of oxidative
stress and muscle damage markers throughout recovery. Clin Biochem,
41(10-11), 841-851.
Bailey, D. M., Erith, S. J., Griffin, P. J., Dowson, A., Brewer, D. S., Gant, N., et
al. (2007). Influence of cold-water immersion on indices of muscle
damage following prolonged intermittent shuttle running. J Sports Sci,
25(11), 1163-1170.
Bangsbo, J. (1994). The physiology of soccer--with special reference to intense
intermittent exercise. Acta Physiol Scand Suppl, 619, 1-155.
Bishop, N. C., Blannin, A. K., Robson, P. J., Walsh, N. P., & Gleeson, M.
(1999). The effects of carbohydrate supplementation on immune
responses to a soccer-specific exercise protocol. J Sports Sci, 17(10),
787-796.

288
Bottas, R., Linnamo, V., Nicol, C., & Komi, P. V. (2005). Repeated maximal
eccentric actions causes long-lasting disturbances in movement control.
Eur J Appl Physiol, 94(1-2), 62-69.
Cooper, C. E., Vollaard, N. B., Choueiri, T., & Wilson, M. T. (2002). Exercise,
free radicals and oxidative stress. Biochem Soc Trans, 30(2), 280-285.
Drust, B., Reilly, T., & Cable, N. T. (2000). Physiological responses to
laboratory-based soccer-specific intermittent and continuous exercise. J
Sports Sci, 18(11), 885-892.
Foskett, A., Williams, C., Boobis, L., & Tsintzas, K. (2008). Carbohydrate
availability and muscle energy metabolism during intermittent running.
Med Sci Sports Exerc, 40(1), 96-103.
Greig, M. P., McNaughton, L. R., & Lovell, R. J. (2006). Physiological and
mechanical response to soccer-specific intermittent activity and steady-
state activity. Res Sports Med, 14(1), 29-52.
Hertogh, C., Chamari, K., Damiani, M., Martin, R., Hachana, Y., Blonc, S., et al.
(2005). Effects of adding a preceding run-up on performance, blood
lactate concentration and heart rate during maximal intermittent vertical
jumping. J Sports Sci, 23(9), 937-942.
Hu, M.-L. (1990). Measurement of protein thiol groups and GSH in plasma. In L.
Parker (Ed.), Methods in Enzimology (Vol. 233, pp. 380-385). San Diego:
Academic Press.
Ispirlidis, I., Fatouros, I. G., Jamurtas, A. Z., Nikolaidis, M. G., Michailidis, I.,
Douroudos, I., et al. (2008). Time-course of changes in inflammatory and
performance responses following a soccer game. Clin J Sport Med,
18(5), 423-431.
Kingsley, M. I., Wadsworth, D., Kilduff, L. P., McEneny, J., & Benton, D. (2005).
Effects of phosphatidylserine on oxidative stress following intermittent
running. Med Sci Sports Exerc, 37(8), 1300-1306.
Krustrup, P., Mohr, M., Steensberg, A., Bencke, J., Kjaer, M., & Bangsbo, J.
(2006). Muscle and blood metabolites during a soccer game: implications
for sprint performance. Med Sci Sports Exerc, 38(6), 1165-1174.

289
Lee, J., & Clarkson, P. M. (2003). Plasma creatine kinase activity and
glutathione after eccentric exercise. Med Sci Sports Exerc, 35(6), 930-
936.
Leiper, J. B., Nicholas, C. W., Ali, A., Williams, C., & Maughan, R. J. (2005).
The effect of intermittent high-intensity running on gastric emptying of
fluids in man. Med Sci Sports Exerc, 37(2), 240-247.
Lowry, O. H., Rosenbrough, N., Farr, A. L., & Radall, R. J. (1951). Protein
measurement with the folin phenol reagent. J Biol Chem(193), 265-275.
MacIntyre, D. L., Reid, W. D., & McKenzie, D. C. (1995). Delayed muscle
soreness. The inflammatory response to muscle injury and its clinical
implications. Sports Med, 20(1), 24-40.
Magalhaes, J., Ferreira, R., Marques, F., Oliveira, E., Soares, J., & Ascensão,
A. (2007). Indoor climbing elicits plasma oxidative stress. Med Sci Sports
Exerc, 39(6), 955-963.
Magalhães, J., Oliveira, J., Ascensao, A., & Soares, J. (2004). Concentric
quadriceps and hamstrings isokinetic strength in volleyball and soccer
players. J Sports Med Phys Fitness, 44(2), 119-125.
Malm, C., Nyberg, P., Engstrom, M., Sjodin, B., Lenkei, R., Ekblom, B., et al.
(2000). Immunological changes in human skeletal muscle and blood after
eccentric exercise and multiple biopsies. J Physiol, 529 Pt 1, 243-262.
Mohr, M., Krustrup, P., & Bangsbo, J. (2003). Match performance of high-
standard soccer players with special reference to development of fatigue.
J Sports Sci, 21(7), 519-528.
Mohr, M., Krustrup, P., & Bangsbo, J. (2005). Fatigue in soccer: a brief review.
J Sports Sci, 23(6), 593-599.
Morris, J. G., Nevill, M. E., Boobis, L. H., Macdonald, I. A., & Williams, C.
(2005). Muscle metabolism, temperature, and function during prolonged,
intermittent, high-intensity running in air temperatures of 33 degrees and
17 degrees C. Int J Sports Med, 26(10), 805-814.
Nicholas, C. W., Nuttall, F. E., & Williams, C. (2000). The Loughborough
Intermittent Shuttle Test: a field test that simulates the activity pattern of
soccer. J Sports Sci, 18(2), 97-104.

290
Nicholas, C. W., Tsintzas, K., Boobis, L., & Williams, C. (1999). Carbohydrate-
electrolyte ingestion during intermittent high-intensity running. Med Sci
Sports Exerc, 31(9), 1280-1286.
Nicholas, C. W., Williams, C., Lakomy, H. K., Phillips, G., & Nowitz, A. (1995).
Influence of ingesting a carbohydrate-electrolyte solution on endurance
capacity during intermittent, high-intensity shuttle running. J Sports Sci,
13(4), 283-290.
Quindry, J. C., Stone, W. L., King, J., & Broeder, C. E. (2003). The effects of
acute exercise on neutrophils and plasma oxidative stress. Med Sci
Sports Exerc, 35(7), 1139-1145.
Reilly, T. (1997). Energetics of high-intensity exercise (soccer) with particular
reference to fatigue. J Sports Sci, 15(3), 257-263.
Rohn, T. T., Hinds, T. R., & Vincenzi, F. F. (1993). Ion transport ATPases as
targets for free radical damage. Protection by an aminosteroid of the
Ca2+ pump ATPase and Na+/K+ pump ATPase of human red blood cell
membranes. Biochem Pharmacol, 46(3), 525-534.
Simpson, R. J., Florida-James, G. D., Whyte, G. P., Black, J. R., Ross, J. A., &
Guy, K. (2007). Apoptosis does not contribute to the blood
lymphocytopenia observed after intensive and downhill treadmill running
in humans. Res Sports Med, 15(3), 157-174.
Sunderland, C., Morris, J. G., & Nevill, M. (2007). A heat acclimation protocol
for team sports. Br J Sports Med.
Thompson, D., Bailey, D. M., Hill, J., Hurst, T., Powell, J. R., & Williams, C.
(2004). Prolonged vitamin C supplementation and recovery from
eccentric exercise. Eur J Appl Physiol, 92(1-2), 133-138.
Thompson, D., Nicholas, C. W., & Williams, C. (1999). Muscular soreness
following prolonged intermittent high-intensity shuttle running. J Sports
Sci, 17(5), 387-395.
Thompson, D., Williams, C., Garcia-Roves, P., McGregor, S. J., McArdle, F., &
Jackson, M. J. (2003). Post-exercise vitamin C supplementation and
recovery from demanding exercise. Eur J Appl Physiol, 89(3-4), 393-400.
291
Thompson, D., Williams, C., Kingsley, M., Nicholas, C. W., Lakomy, H. K.,
McArdle, F., et al. (2001). Muscle soreness and damage parameters
after prolonged intermittent shuttle-running following acute vitamin C
supplementation. Int J Sports Med, 22(1), 68-75.
Thompson, D., Williams, C., McGregor, S. J., Nicholas, C. W., McArdle, F.,
Jackson, M. J., et al. (2001). Prolonged vitamin C supplementation and
recovery from demanding exercise. Int J Sport Nutr Exerc Metab, 11(4),
466-481.
Twist, C., & Eston, R. (2005). The effects of exercise-induced muscle damage
on maximal intensity intermittent exercise performance. Eur J Appl
Physiol, 94(5-6), 652-658.

292

293
Table 1. Anthropometric and physiological characteristics
of the subjects before LIST and match
Variables Before LIST Before match
Age (yr) 21.3 ± 1.1 21.3 ± 1.1
Mass (kg) 70.7 ± 6.3 69.8 ± 5.3
Height (cm) 175.0 ± 6.0 175.0 ± 6.0
% Body fat 8.3 ± 1.9 7.9 ± 2.9
VO2max (mL.kg-1.min-1) 55.1 ± 5.1 -
Values are mean ± SD; VO2 max, maximal oxygen uptake

294

295
Table 2. Frequency, mean duration and percent of match time spent on the considered motor categories
Standing Walking Jogging Cruising Sprinting Backwards
running Sideways running
Frequency (n)
114 ± 44.8 408.6 ± 93.8 441.9 ± 96.2 69.6 ± 10.4 41.7 ± 18.0 122.1 ± 26.6 64.9 ± 4.8
Mean duration
(min)
7.0 ± 2.5
39.5 ± 3.6 31.8 ± 7.4 2.9 ± 1.5 2.2 ± 1.5 4.3 ± 1.3 1.4 ± 0.4
% total time 7.8 ± 3.4 43.8 ± 7.9 35.3 ± 5.6 5.8 ± 2.3 2.5 ± 1.3 4.8 ± 1.9 1.6 ± 0.6
Values are mean ± SD

296

297
Figure 1 – Test schedule for the whole test period. Downward arrows denote the time
points when sprint and jump performance, isokinetic strength and DOMS were
measured. Drop marks denote the time points when blood samples were taken. HR –
heart rate.

298
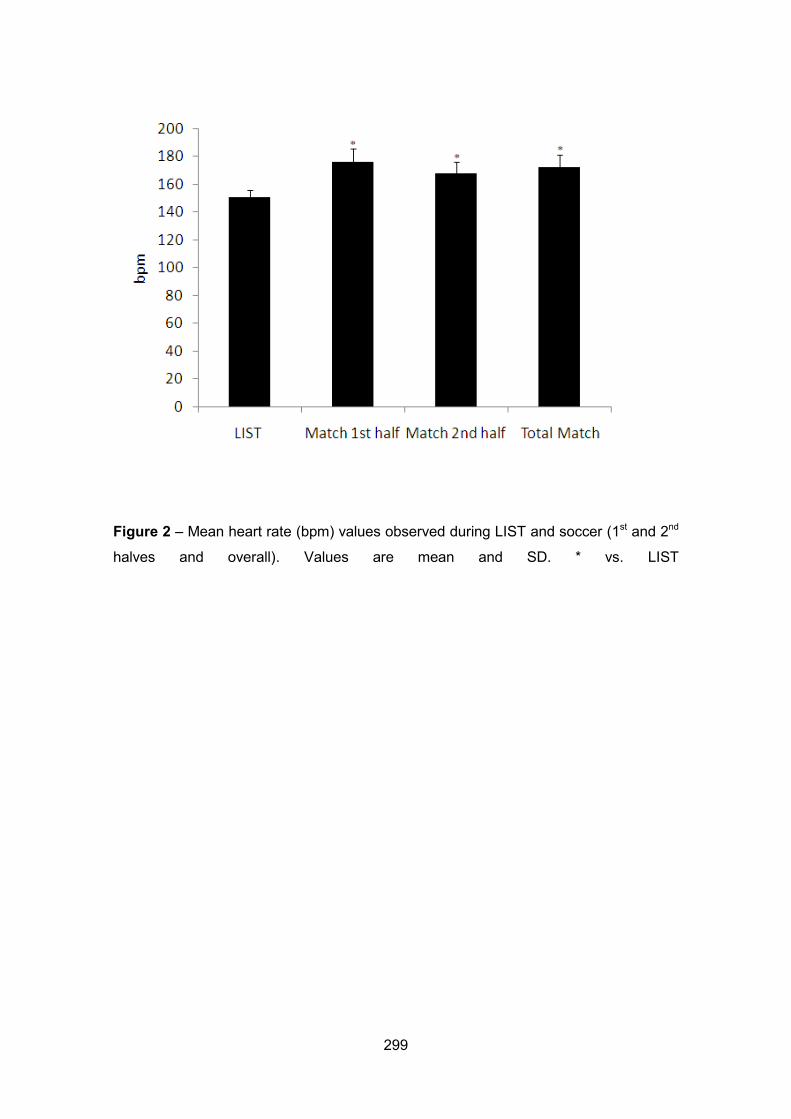
299
Figure 2 – Mean heart rate (bpm) values observed during LIST and soccer (1st and 2nd
halves and overall). Values are mean and SD. * vs. LIST

300
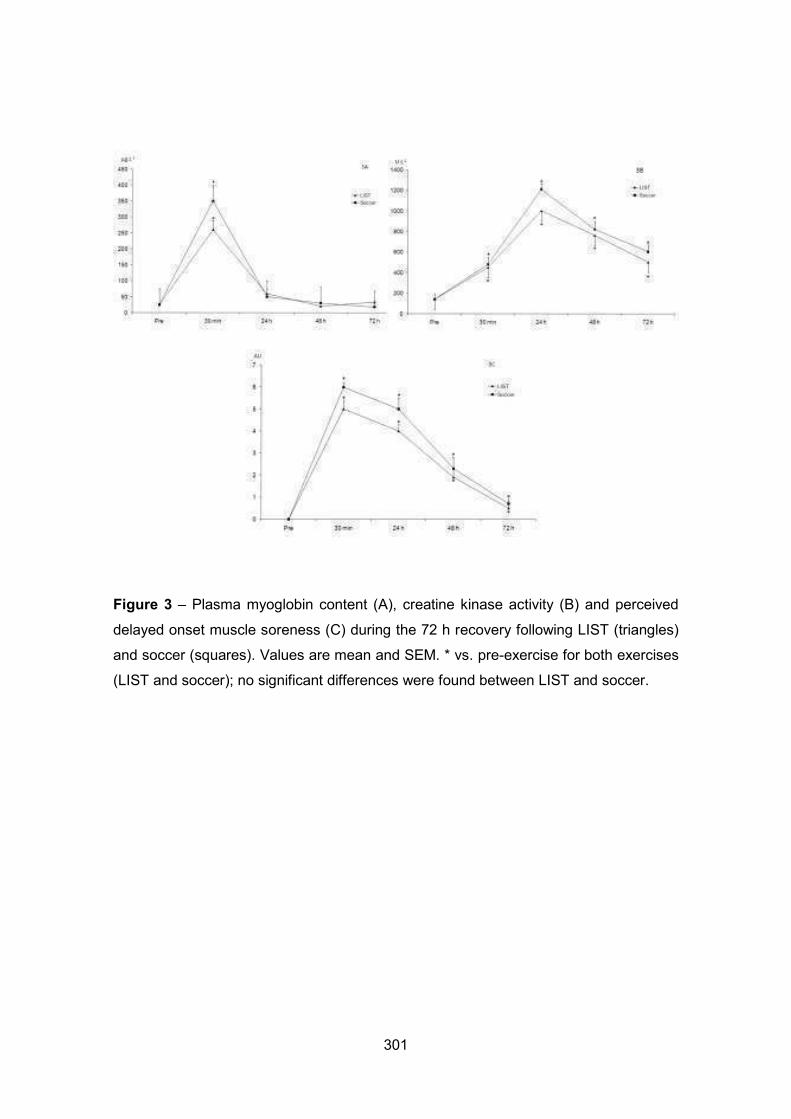
301
Figure 3 – Plasma myoglobin content (A), creatine kinase activity (B) and perceived
delayed onset muscle soreness (C) during the 72 h recovery following LIST (triangles)
and soccer (squares). Values are mean and SEM. * vs. pre-exercise for both exercises
(LIST and soccer); no significant differences were found between LIST and soccer.

302

303
Figure 4 – Plasma total antioxidant status (A), uric acid (B), malondialdehyde (C) and
sulfhydryl (D) contents during the 72 h recovery following LIST (triangles) and soccer
(squares). Values are mean and SEM. * vs. pre-exercise for both exercises (LIST and
soccer); # LIST vs. soccer.

304

305
Figure 5 – Blood leukocytes (A) and lymphocytes (B) counts during the 72 h recovery
following LIST (triangles) and soccer (squares). Values are mean and SEM. * vs. pre-
exercise for both exercises (LIST and soccer); # LIST vs. soccer.

306

307
Figure 6 – Jump performance (A), sprint performance (B), isokinetic peak torque for
knee extension (C) and flexion (D) during the 72 h recovery following LIST (triangles)
and soccer (squares). Values are mean and SD. * vs. pre-exercise for both exercises
(LIST and soccer); # LIST vs. soccer.

308
309
Experimental Work
Study V
TITLE: Neuromuscular function, hormonal and redox status, muscle damage of
professional soccer players after a high-level competitive match
RUNNING HEAD: Impact of a soccer match
Authors:
João R. Silva1,6, António Ascensão2,5, Franklim Marques3, André Seabra 4,6,
António Rebelo1,6, José Magalhães2,5
Affiliations:
1 University of Porto, Faculty of Sport, Department of Soccer, Porto, Portugal
2 University of Porto, Faculty of Sport, Department of Sports Biology, Porto,
Portugal
3 Department of Clinical Analysis, Faculty of Pharmacy; Institute for Molecular
and Cell Biology (IBMC), University of Porto, Porto, Portugal
4 University of Porto, Faculty of Sport, Department of Kinanthropometry, Porto,
Portugal
5 Research Center in Physical Activity, Health and Leisure (CIAFEL)
6 Center of Research, Education, Innovation and Intervention in Sport (CIFI2D)
Under review

310

311
Abstract
The main aim was to analyse the impact of an official high-level competitive
match on hormonal and redox status, muscle damage and inflammation and
neuromuscular function. Seven high-level male soccer players from the same
team performed an official match and data was collected 72-h before, 24-h, 48-
h and 72-h post-match. Plasma testosterone/cortisol ratio (T/C), creatine kinase
(CK), superoxide dismutase (SOD), glutathione peroxidase (GPX) and
reductase (GR) activities, myoglobin (Mb), C-reactive protein (CRP), uric acid
(UA), protein sulfhydryls (-SH), malondialdehyde (MDA) contents and total
antioxidant status (TAS) were measured. 5 and 30-m sprint, jump and change
of direction performance, and maximal isokinetic knee extension and flexion
were obtained as neuromuscular functional parameters. Cortisol increased and
T/C decreased until 48-h recovery (P<0.05). Mb, CRP and -SH (P<0.05)
increased at 24-h and CK, TAS, SOD and MDA (P<0.05) increased up to 48-h
recovery. GR increased and GPX decreased at 24-h recovery (P<0.05). Jump
performance decreased 24-h post-match (P<0.05). In conclusion, a high-level
official match increased catabolic hormonal environment, muscle damage and
inflammation as well as oxidative stress at 24-h and 48-h of recovery period.
Regardless these alterations, neuromuscular performance of high-level players
are affected to a smaller extent and only until 24-h of recovery period.
Keywords: soccer, muscle damage, oxidative stress, anabolic:catabolic
balance, fatigue, recovery.

312
313
Introduction
Soccer has been a topic of intense research in the last decade. Different studies
showed that soccer competitive demands may impose strains to various
physiological systems, including musculoskeletal, nervous, immune and
metabolic, to a point where recovery strategies post-exercise became influential
in the preparation of the next match (Reilly and Ekblom 2005). During the
soccer season, players’ physical performance is not only determined by
appropriate conditioning but also by the ability to recover and regenerate
following multiple stress stimuli (e.g. training and competition) (Kraemer et al.
2004). Moreover, match competition, in particular, seems to represent a major
source of physical stress and physiological demands during the competitive
season (Reilly and Ekblom 2005; Bangsbo et al. 2006; Reilly et al. 2008).
Performance decrements (Ascensao et al. 2008; Ispirlidis et al. 2008; Rampinini
et al. 2011; Magalhaes et al. 2010), increases in muscle damage markers
(Ascensao et al. 2008; Ispirlidis et al. 2008; Magalhaes et al. 2010; Andersson
et al. 2008), a robust pro- and anti-inflammatory cytokine response (Andersson
et al. 2010a; Ispirlidis et al. 2008), increased catabolic (Ispirlidis et al. 2008;
Kraemer et al. 2004), and pro-oxidant states (Ascensao et al. 2008; Magalhaes
et al. 2010) have been observed immediately after “friendly” soccer matches
(i.e., without value of any kind to any competitor regardless of the outcome of
the competition) and throughout the post-match recovery. Although a
considerable amount of studies have been using friendly match and soccer
specific protocols performed in laboratory as a model to reproduce the overall
game physical demands, data emerging from high-level competitive games are
scarce. The analysis of high-level official soccer matches is interesting for both
coaches and researchers as these truly represent the real context of a high-
level competition. In fact, it is reasonable to assume that the physiological and
psychological stress imposed by a friendly match does not mimic the real stress
of an official soccer competition. Despite the scarcity of studies, Rodriguez et
al., (2007) report that exercise intensity (absolute values and percentage of
maximum heart rate) in friendly matches was lower than in official matches of a
soccer competition. In addition, due to the increase in the frequency of match

314
commitments in professional soccer, a clear knowledge of the impact and time
course of the physiological changes induced by an official soccer match will
help the designing and development of more effective strategies to accelerate
the recovery (Andersson et al. 2008).
When research protocols aim to study fatigue and recovery in sport, specific
performance variables and biochemical and muscle-status markers should be
included in the analysis to achieve a higher efficiency of the monitorization
process (Bishop et al. 2008). In fact, performance measurements, hormonal
and oxidative and muscle damage markers have been suggested as important
stress biomarkers in the monitorization of fatigue and recovery (Finaud et al.
2006; Kraemer and Ratamess 2005; Bishop et al. 2008). Although associations
of pro-oxidant redox status, inflammation, muscle damage and physical
performance have been established in high-level male (Ispirlidis et al. 2008;
Rampinini et al. 2011) and female (Andersson et al. 2010a; Andersson et al.
2010b) and low-level male soccer players (Magalhaes et al. 2010; Fatouros et
al. 2010; Ascensao et al. 2008) after friendly matches, they have not been yet
examined in the same cohort of male professional players during the post-
match recovery period that follows a high-level competitive official match. Given
the higher training background of professional players and previous reports
from elite female players (Andersson et al. 2008), high-level junior players
(Rampinini et al. 2011) and adult elite players (Odetoyinbo et al. 2009) it is
expected that the performance impairments and biochemical responses will be
less exuberant than those typically reported in lower-level soccer players
(Ascensao et al. 2008; Magalhaes et al. 2010; Fatouros et al. 2010). The
purpose of the present study is to examine, for the first time, whether and to
what extent, muscle damage, plasma oxidative stress and damage, hormonal
changes, plasma inflammatory markers, as well as lower limb neuromuscular
variables such as jump, 5 and 30-m sprint, change of direction ability and
strength performance, are altered in response to a high-level official soccer
match.

315
Methods
Subjects
A group of 7 male professional outfield soccer players (age: 27.4+ 4.3 yrs,
height: 181.53 + 8.1 cm, weight: 81.5 + 8.2 kg, % body fat: 8.1 + 1.6%) from a
team competing in the Portuguese Professional Soccer League participated in
this study. The total match duration was 94-min and finished with a draw (2-2).
Only the players that played the entire match were used in the analyses. As so,
given that one player from the first eleven was injured and substituted in first
quarter of the second half and two other were substituted due to coach tactical-
technical options in the beginning of the second quarter of the second half only
seven players played the full time and thus were involved in the present study.
Moreover, the goalkeeper was also excluded due to the obvious physical
loading differences compared with the other players of distinct position roles. In
each evaluation, only free of injury players involved in the full training schedules
were tested. In accordance with the club policy, all soccer players underwent
usual physical examination in the beginning and throughout the season (e.g.
blood sample analyzes, rest ECG, lung X- Ray). The experimental protocol was
approved by the local board, and followed the Declaration of Helsinki of the
World Medical Associations for research with humans. All participants were fully
informed about the aims, experimental protocol and procedures, and provided
written informed consent.
Experimental design
The official match used in this study was the last official game of the
championship. The last game of the season was chosen to allow the repeated
examination needed for analysing the post-match recovery period. Therefore,
the overall set up was performed during the last week of the Portuguese soccer
competitive period and the first week after the last official match (off-season).
Being the last official match, the players were not involved in any programed
training activity and were asked to refrain from any form of physical exercise
during the experimental period. Subjects were engaged in normal training

316
routines during the 72 hours before match, and abstained from exercise during
the 72 hours post-match, with exception of the functional evaluation tests.
No performance or biochemical variables were obtained at the end of the match
due to logistical problems. Blood samples and functional data, namely
countermovement jump (CMJ), 5 (T5) and 30 (T30) meters sprint times, change
of direction ability (COD; T-test) and leg extensor and flexor isokinetic
concentric maximal strength were assessed at different time points namely: pre-
match (96-h post the previous official match and 72-h before the studied
match), and at 24-h, 48-h and 72-h of the recovery period.
Procedures
The game started at 4 p.m. and ended at 6 p.m. with temperature and relative
humidity around 20ºC and 45-50%, respectively. In order to match the circadian
rhythms of the different variables, data collection (blood sample and functional
data measurements) in all time points was always performed at 6 p.m.
Procedures order were as follows: 1st - Blood samples collection; 2nd- CMJ, 3rd-
T5 and T30, 4th- COD and 5th- Isokinetic strength. In the laboratory, a resting
blood sample was taken after subjects have been standing for at least 15 min,
after which subjects consumed a light standardized meal and drink and rested
for 2 h. The meal consisted of 1.7 g white bread and 0.3 g of low-fat spread;
both values are per kilogram of body mass (Thompson et al. 2003). CMJ, sprint
ability and COD tests were performed in indoor facilities. Before the tests, all the
players performed a 10 to 15-min warm-up consisting of light jogging, specific
mobility exercises and stretching routine, and 10 meters (m) sprints. Players
completed two rounds of each test in the same sequence and the best result
was considered for analysis. Each subject was allowed to a minimum of 5-min
rest between tests to ensure adequate recovery. Players were instructed to
maintain normal routines for daily food and water intake, and followed the same
dietary recommendations defined by the medical staff. In addition, during the
days of physical tests, players were instructed to refrain from drinking
beverages containing caffeine and/or alcohol and from consuming food during
the 2 hours before testing.

317
Physical Performance Tests
Counter-movement Jump (CMJ)
The CMJ was performed using a platform, Ergojump (Digitime 1000, Digest
Finland) according to (Bosco et al. 1983) whereby the highest vertical jump (cm)
and the longest flying time (s) were registered. The best of the two trials was
used for data analyses. Sprint ability
Sprint ability
Sprint measurements were carried out using telemetric photoelectric cells
(Brower Timing System, IRD-T175, Utah, USA) mounted on tripods positioned
approximately 0.75-m above the floor and situated 3-m apart facing each other
on either side of the starting line (0 m), at 5 and at 30-m. The players stood 0.3-
m behind the starting line, started at their own discretion, being time activated
when players cross the first pair of photocells, and they ran as fast as they
could to complete 30-m distance. The fastest trial was used for data analysis.
Change of direction ability (COD)
Change of direction ability (COD) was evaluated using an agility test (T-test). T-
test does not include a perceptual or decision-making component and can be
used to measure change of direction ability. An adapted version of the T-test by
Semenick (Semenick 1990) was performed. Subjects began with both feet 0.3-
m behind the starting point A. At their own discretion, each subject sprinted
forward 9.14-m (10 yd) to point B and touched the base of the cone with the
right hand. They than sprinted to the left 4.57-m (5 yd) and touched the base of
a cone (C) with the left and. Subjects then sprinted to the right 9.14-m (10 yd)
and touched the base of a cone (D) with the right hand. They then sprinted to
the left 4.57-m back to point B and touched the base of a cone with the left
hand. They turn 270º and then ran to point A, passing the finishing line. Two
test trials were performed, and times were recorded to the nearest one-
hundredth of a second. As described for sprint ability, measurements were
carried out using telemetric photoelectric cells (Brower Timing System, IRD-
T175, Utah, USA). The players stood 0.3-m behind the starting line, being time

318
activated when they passed the electronic sensors, and the clock stopped the
instant players again crossed the Point A. The fastest trial was used for data
analyses.
Strength
In order to evaluate muscle function, subjects were familiarized with the muscle
function test on at least two occasions during preliminary visits to the laboratory.
Maximal gravity corrected concentric peak torque of quadriceps and hamstring
and ratio between concentric hamstring (H) and quadriceps (Q) peak torque
values (H/Q) were measured during isokinetic knee joint movement (Biodex
System 2, NY, USA) of the dominant and non-dominant leg at the angular
velocity of 90º.s-1 (1.57 rad.s-1), according to Magalhães et al., (2004). After
individual self-report, the dominant leg was determined by a routine visual
inspection in a simple target-kicking test requiring accuracy. Prior to muscle
function measurements, subjects perform a standardized warm-up consisting of
5-min period on a cycle ergometer (Monark E-824) with a fixed load
corresponding to 2% of body weight. Players were then seated on the
dynamometer chair at 85º inclination (external angle from the horizontal) with
stabilization straps and the knee to be tested was positioned at 90º of flexion
(0º= fully extended knee). The subjects were instructed to kick and also to bend
the tested leg as hard and as fast as they could through a complete range of
motion (from 90º to 0º). All subjects also performed a specific sub-maximal
warm-up protocol on the Biodex device in order to familiarize with the isokinetic
device and test procedure. Three maximal repetitions at angular velocity 90º.s-1
(1.57 rad.s-1) were therefore carried out. The ratio between concentric
hamstring (H) and quadriceps (Q) peak torque values (H/Q) was also
determined and expressed as percentage.
Blood sampling and preparations
All the venous blood samples were taken by conventional clinical procedures
using EDTA as anticoagulant. Nevertheless, no tourniquet was used in order to
minimize potentially oxidative stress induced by an ischemia-reperfusion
maneuver.

319
The freshly withdraw blood (~10ml) was immediately centrifuged at 3000 rpm
during 10 minutes for careful removal of the plasma. Plasma was separated into
several aliquots and rapidly frozen at – 80ºC for later biochemical analysis of
plasma total testoterone (T), cortisol (C), myoglobin (Mg), creatine kinase (CK),
uric acid (UA), C-reactive protein (CRP), total antioxidant status (TAS),
superoxide dismutase (SOD) glutathione peroxidase (GPX) and glutathione
reductase (GR), sulfhydryl groups (-SH) and malondialdehyde (MDA).
Biochemical Assays
Anabolic/catabolic Status
Plasma testosterone (T) and cortisol (C) were measured immune-enzymatically
using commercial test kits VIDAS® testosterone (REF. 30418) and VIDAS®
cortisol S (REF. 30451).
Muscle Damage
Plasma creatine kinase (CK) activity was determined spectrophotometrically
using a commercial test kit (ABX A11A01632, Mompelier, FR).
Plasma myoglobin concentration was assessed using a commercial test kit
(myoglobin bioMerieux 30446, Carnaxide, PT).
Inflammatory Marker
C-reactive protein (CRP) was measured using an enzyme-linked immune
sorbent assay (ELISA) system (PENTRA 400, Horiba)
Redox Status
Total antioxidant status (TAS) was measured spectrophotometrically using a
commercial kit (Randox NX2332 Crumlin, UK). Uric acid (UA) was determined
by an enzymatic method using a commercial kit (Horiba ABX A11A01670,
Montpellier, France).
Regarding enzyme activities in plasma, superoxide dismutase (SOD) activity
was measured spectrophotometrically at 550 nm using a commercial Ransod kit
from Randox (catalogue no. SD 125, Crumlin,UK). The activity of glutathione
peroxidase (GPX) was assayed by a spectrophotometric technique at 340 nm
using a commercial Ransel kit from Randox (catalogue no. RS 505). The
activity of glutathione reductase (GR) was measured with a spectrophotometric

320
procedure at 340 nm using a commercial GR kit from Randox (catalogue no.
GR 2368).
Plasma MDA was assayed according to Rohn et al., (Rohn et al. 1993) with
some modifications and measured by the formation of thiobarbituric acid
reactive substances at 535 nm. Plasma SH was spectrophotometrically
evaluated at 414 nm according to Hu (Hu 1990). Protein content was
spectrophotometrically assayed using bovine serum albumin as standard
according to Lowry et al., (Lowry et al. 1951). Samples were analyzed in
duplicate and the mean of the two values was used for statistical analysis.
Statistical Analysis
Mean, standard deviation (SD) and/or standard error mean (SEM) were
calculated. Normality was tested with the Shapiro-Wilks test. After this
assumption, One-way analysis of variance (ANOVA) with repeated measures
was used to establish whether any of the subsequent test results were
significantly different from pre-match results. All data analysis was performed
using SPSS 18.0 package. A significance level of 0.05 was chosen.
Results
Results of performance in the different muscle power-related tests and
isokinetic strength are present in Table 1 and Table 2, respectively. CMJ
performance was significantly reduced (P < 0.05) at 24-h of the post-match
recovery period. No changes were observed in the other evaluated parameters.
No significant alterations were observed in plasma total testosterone (T; Table
3) concentration during the recovery period, however plasma cortisol (C)
concentration significantly increased at 24-h and 48-h, returning to baseline
levels at 72-h (P < 0.05; Table 3). The T/C ratio decreased significantly at 24-h
and 48-h, returning baseline levels at 72-h (P < 0.05; Table 3).
As can be observed in Table 3, plasma myoglobin (Mb) content was
significantly higher (P < 0.05) at 24-h than in the other assessed moments.
Plasma creatine kinase (CK) activity increased at 24-h and 48-h after the match
and returned pre-match values at 72-h of the recovery period (P < 0.05).

321
A significant increase in plasma C-reactive protein (CRP) content was observed
at 24-h post-match (P < 0.05; Table 3) when compared to baseline.
Data concerning the variation on the different redox state parameters
throughout the post-match recovery period are described in Table 4. Plasma
total antioxidant status (TAS) significantly increased at 24-h and 48-h and
returned to control values at 72-h (P < 0.05) of the recovery period. No
significant alterations were observed in plasma uric acid (UA) content during the
recovery period. Plasma superoxide dismutase (SOD) activity increased at 24-h
and 48-h after the match and returned to baseline values at 72-h of the recovery
period (P < 0.05). Plasma glutathione peroxidase (GPX) activity decreased at
24-h post-match (P < 0.05) and recovered to control values thereafter. The
activity of glutathione reductase (GR; P < 0.05) and protein sulfhydryl content (-
SH; P < 0.05) in plasma was significantly higher at 24-h of the recovery period.
A significantly higher level of plasma malondialdehyde (MDA) was analysed at
24-h and 48-h of the recovery period (P < 0.05).
Discussion
The overall data demonstrate, for the first time, that an official soccer match of
elite players favours the hormonal catabolic environment during the recovery
period. Also, increased levels of oxidative stress and muscle damage
throughout 48-h of the recovery period were observed. However, despite these
biochemical alterations, the functional performance pattern of high level soccer
players seem to be only slightly affected during the 24-h to 72-h of the post-
match recovery period after a competitive match.
Although performance decrements were noted in the muscle-related power and
strength tests from pre-match to 24-h post-match, only CMJ significantly
decreased. Recently, Rampinini et al., (2011) observed that high-level young
players (U-20) partially recover performance at 24-h post-match, been
completed at the 48-h of the recovery period. In contrast, data with semi-
professional players (Ascensao et al. 2008; Magalhaes et al. 2010; Fatouros et
al. 2010), reported longer recovery periods (48-h to 72-h). The reported greater

322
neuromuscular capabilities of high standard players (Cometti et al. 2001), may
explain, at least in part, the observed differences between studies. Knowing that
the mechanical stress induced by the eccentric component of the stretch-
shortening cycle (SSC) activities may result in ultra-structural muscle damage
(Malm 2001), it may be expected that these high level players may possess a
high capability to cope with the match demands, and therefore be less
susceptible to exercise-induce muscle damage (EIMD) and subsequent
performance impairments. Recently, Odetoyinbo et al., (2009) observed that
game-physical performances of professional players were not affected when
two matches were played interspersed by two days of recovery. In this regard,
players of higher standard have shown to be able to sustain a higher level of
physical work throughout the match (Mohr et al. 2003), to more quickly recover
from high intensity intermittent exercise (Edwards et al. 2003), as well as to
regulate core body temperature more effectively at a sustained level (Edwards
and Clark 2006). Probably, the higher training background may also explain the
faster recovery. In fact, muscle adapts to training regimens that engage them in
SSC and are less impaired with repeated exposure (Reilly et al. 2008).
Nevertheless, in contrast with ours and others reports (Rampinini et al. 2011;
Andersson et al. 2008; Krustrup et al. 2011), longer periods of residual fatigue
were observed in professional male soccer players after a friendly match
(Ispirlidis et al. 2008). Since the later study did not report the phase of season of
the match, the effect of seasonal variations in physical fitness and,
consequently, in the results can not be excluded. Moreover, in a recent report
(Silva et al. 2011), we observed that the systematic participation of professional
players in soccer matches favours the increase and maintenance of athletes
knee extensor (KE) and knee flexor (KF) isokinetic muscle strength and short-
sprint ability.
In the present study, CMJ was the only neuromuscular parameter impaired at
24-h recovery. Accordingly, Andersson et al., (2008) reported a longer
impairment of CMJ, when compared to other neuromuscular parameters, after a
friendly elite female soccer match. During recovery, the neuromuscular system
can adjust to the contractile failure in a very flexible way (Nicol et al. 2006) that

323
turns it difficult to established a direct link to which mechanism can be related to
the distinct recovery pattern observed. Moreover, the different neuromuscular
parameters assessed (CMJ, sprint and COD) have been described as
independent motor abilities (Salaj and Markovic 2011). CMJ has been
characterized as a concentric and slow SSC-related action (Salaj and Markovic
2011), that in contrast with other activities (e.g. running), rely in slower transition
between stretch to shortening phases, as well as by a lower stretch velocity,
which limits stretch reflex activation (Wilson and Flanagan 2008). Certain
specific components of the SSC might attenuate the detrimental performance
effects associated with EIMD i.e., increases the pre-activation of the muscle
(Byrne et al. 2004). Nevertheless, studies investigating SSC fatigue reported
greater performance impairments in SSC actions involving higher (e.g. sprint,
drop jump) than lower (e.g. CMJ and Squat jump) ground impact forces (Nicol
et al. 2006). However, others did not observe impairments in sprint performance
(5-10-20-30-m) after EIMD (Semark et al. 1999). Despite the preservation of
post-match muscle peak torque that may indirectly indicate absence of muscle
damage we examine increases in other indirect markers of EIMD (e.g. CK).
Moreover, it cannot be excluded, amongst other factors, a decrease in work
capacity resulting of a lower force capability in all joint range of motion (e.g.
force decrements or damage at specific muscle lengths). If this fact occurred, it
may had influence distinctly the recovery pattern of the different motor abilities
due to their kinetics and kinematics characteristics. Therefore, dissimilarities in
the recovery pattern of the parameters measured in this study seem to highlight
the complexity of the mechanisms of the neuromuscular SSC fatigue (Nicol et
al. 2006). In accordance, Andersson et al., (2008) suggested that the greater
delay in CMJ recovery compared to other neuromuscular parameters were not
solely dependent of the recovery of the capacity of force production from the
extensors and flexors muscles but also from additional mechanisms related with
SSC fatigue. Results of H/QND ratio showed that in the non-dominant limb the
extensors were more affected than the flexors, which may be related, at least in
part, with different intramuscular motor pattern activation between both limbs.

324
According with our results, the official soccer match altered the
catabolic/anabolic-related hormonal homeostasis towards a predominant
catabolic response during the first 48 hours of the recovery period. Ispirlidis et
al., (2008) observed that a friendly soccer match induced significant increases
in cortisol concentration only immediately after. Also in line with our findings, the
authors did not observe alterations in plasma testosterone (free testosterone)
concentration through the 144 hours of the recovery period of the study
(Ispirlidis et al. 2008). To our knowledge, no reports on T/C during the recovery
period after a soccer match have yet been described. Although a decrease in
anabolic/catabolic ratio have been suggested to decrease performance
(Adlercreutz et al. 1986), different studies observed that soccer players
performance increments can be related with both decrements (Gorostiaga et al.
2004) and increments in T/C (Kraemer et al. 2004).
The increase in plasma concentration of certain intracellular proteins (e.g. Mb,
CK, LDH) has been widely used as indirect markers of tissue damage [for refrs
see (Powers and Jackson 2008; Malm 2001)]. Our data corroborate previous
experiments carried out with semi-professional and professional players that
show increases in plasma concentrations of certain intracellular proteins
throughout recovery period. In this regard, increased Mb contents immediately
after (Ascensao et al. 2008; Magalhaes et al. 2010) and in CK activity
throughout the 72-h to 96-h of the recovery period of a friendly match (CK) of
semi-professional (Ascensao et al. 2008; Fatouros et al. 2010; Magalhaes et al.
2010) and professional players (Ispirlidis et al. 2008), have been reported.
These previous studies with semi-professional (Ascensao et al. 2008;
Magalhaes et al. 2010; Fatouros et al. 2010) and professional male players
(Ispirlidis et al. 2008), observed lower baselines values of CK (approximately
ranging from 80 to 200 U.L-1) than those observed in the present study (300.6
U.L-1) and with other professional players (310 U.L-1) (Rampinini et al. 2011).
Considering that our baseline values were obtained 96-h after the previous
official game of the regular championship, probably the higher pre-match CK
values in the professional players involved in our study may be associated to
“residual” levels of muscle damage because of the regular training that soccer

325
players undergone (McLellan et al. 2010). The longer responses (72-h to 96-h
post-match) and/or higher variations (from baseline to 24 and 48-h of recovery)
have been reported in semi-professional (Ascensao et al. 2008; Fatouros et al.
2010; Magalhaes et al. 2010) and professional players (Ispirlidis et al. 2008)
(ranging from 400 to 800%) than the observed in our (85 to 201%) and other
studies with players of the same standard (Krustrup et al. 2011; Andersson et
al. 2008; Rampinini et al. 2011) can be related with the training status in the
moment of the match. In fact, training status has shown to be a determinant
factor in the magnitude of the post-exercise CK changes since less trained
subjects have been shown to exhibit the higher post-exercise increases
(Maxwell and Bloor 1981; Garry and McShane 2000). Nevertheless, given the
high number of factors that are associated with plasma CK inter-individual
variability (e.g. age, muscle mass, physical activity) both in rest and in response
to exercise (low and high responders) (Brancaccio et al. 2007) it is difficult to
compare the magnitude of the changes between studies. Despite some
controversy, CK has been widely used as a stress bio-marker that reflects
damage of the muscle tissue (Brancaccio et al. 2007). Given the small degree
of neuromuscular impairments and the faster recovery period (only CMJ
performance was impaired at 24-h) it is possible to assume that if any muscle
damage occurred it was of minor magnitude allowing the preservation of the
functionality of the contractile machinery and, concomitantly, of performance. In
fact, some studies evidence that muscle enzyme release may not clearly reflect
the size of the injury (e.g. evaluated by histological analysis), being the efflux of
intracellular proteins a possible result of both damage and transient changes in
membrane permeability (Malm 2001; Brancaccio et al. 2007).
An acute phase inflammatory response has been described after friendly-match
performed by professional and semi-professional soccer players, suggested by
an increase in blood leukocyte counts (Ascensao et al. 2008; Ispirlidis et al.
2008; Andersson et al. 2010a; Magalhaes et al. 2010), inflammatory mediators
(Ispirlidis et al. 2008; Andersson et al. 2010a) and in cortisol levels (Ispirlidis et
al. 2008). In accordance with our results, Ispirlidis et al., (2008) observed in

326
professional players that CRP content increased at the same time-point (24-h)
of the recovery period and with the same magnitude after a friendly match.
The high absolute levels of mitochondrial oxygen consumption, the increased
oxidation of circulating catecholamines, the intermittent and repeated sprint
actions-causing temporary ischemia-reperfusion events in skeletal muscle are
plausible factors that may induce reactive oxygen and nitrogen species (RONS)
production during and after a soccer match (Ascensao et al. 2008). However,
an increase in RONS during and following acute exercise is believed to serve
the necessary “signal” for the hormetic-associated up regulation in antioxidant
defence commonly observed with chronic exercise training (Fisher-Wellman
and Bloomer 2009). Although evidences suggest that soccer players may show
higher plasma activity of certain endogenous antioxidants than untrained
individuals, there are some contradictory reports regarding TAS (Brites et al.
1999; Banfi et al. 2006; Cazzola et al. 2003). We observed an increase in TAS
at 24 and 48-h post-match recovery period. Our data, together with other
reports examining semi-professional players TAS responses to other match
models (e.g. friendly match and LIST), seems to support the idea that a soccer
match induces a pro-oxidant insult resulting in a compensatory response in
plasma TAS immediately after (Ascensao et al. 2008; Magalhaes et al. 2010)
and during the first 48-h of post-match recovery period (Ascensao et al. 2008;
Fatouros et al. 2010; Magalhaes et al. 2010). Consistently, Andersson et al.,
(2008) observed increases in specific endogenous (non-enzymatic) compounds
and in certain dietary antioxidants immediately and during the 72-h post-match
recovery period, respectively, being this delayed increase in dietary antioxidants
during recovery a putative mechanism to strengthen the endogenous
antioxidant defence and restore the redox balance (Andersson et al. 2010b).
Although we did not observe variations in uric acid (UA), recent studies have
shown that plasma UA levels of semi-professional players increase immediately
after a friendly match (Ascensao et al. 2008; Magalhaes et al. 2010) and during
the 48-h (Fatouros et al. 2010) of the recovery period. Also, an increase in UA
until 96-h of the recovery period of professional players has been reported
(Ispirlidis et al. 2008). Nevertheless, Andersson et al., (2010b) observed that

327
after a friendly match, UA levels of elite female soccer players increased
immediately after the game but return to pre-match levels at 21-h of the
recovery period. All together, data seems to suggest that lower-level compared
to high-level players rely more strongly on the degradation of purine nucleotides
as reflected by the higher increments in UA contents throughout recovery. In
addition, the longer post-match recovery pattern reported by Ispirilidis et al.,
(2008) e.g. physical parameters, CK and UA responses, in contrast to our and
others (Andersson et al. 2008; Rampinini et al. 2011) involving players of the
same standard could be related with players fitness levels in the moment of the
match i.e., with seasonal variations in physical fitness. In line with previous
antioxidant markers, plasma superoxide dismutase (SOD) activity was
significantly higher during the 48-h of the post-match recovery period. Despite
no reports of SOD kinetic after a soccer match have been published, studies
with untrained individuals and other athletic populations suggest that physical
exercise can result in increments or maintenance of SOD activity (Fisher-
Wellman and Bloomer 2009). Given that SOD is considered the first enzymatic
defence line against oxidative stress (Finaud et al. 2006; Powers and Jackson
2008) and that the magnitude of exercise-mediated changes in skeletal muscle
SOD activity increases in function of the intensity and duration of the exercise
(Powers and Jackson 2008), alterations may be expected due to the high
physiologic demands of an official soccer match.
With respect to the antioxidant glutathione cycle-related enzymes, although we
observed a decrease in GPX only at 24-h of recovery period, others (Fatouros
et al. 2010), examining semi-professional players, observed an increased
activity during the 24 to 72-h post-match recovery period. To our knowledge,
this is the first study that analysed the effect of a soccer match in plasma GR
activity. We observed an up-regulation of plasma GR activity at 24-h post-
match. Taking into account the critical physiological role of the balance between
the first (SOD) and second step (GPX and/or catalase) antioxidant enzymes,
the significant increase in plasma SOD/GPX ratio observed after the game,
mainly due to a decreased in GPX activity as referred to previously, seems to
favour H2O2 accumulation. This fact, could be indicative of a low plasma

328
scavenging efficiency contributing to enhanced oxidative stress (Gaeta et al.
2002), which is consistent with the increased levels of MDA found in present
study and others (Magalhaes et al. 2010; Ispirlidis et al. 2008; Ascensao et al.
2008; Fatouros et al. 2010).
Regarding plasma sulfhydryl residues (-SH) we observed an increase at 24-h of
the recovery period. These results can indicate decreased disulphide linkages (-
S-S-) from both proteins and reduced glutathione. These findings initially were
not expected due to previous reports of decreases in plasma –SH levels of
semi-professional soccer players immediately after and through the first 48-h of
the recovery period (Ascensao et al. 2008; Magalhaes et al. 2010). Moreover, a
decrease in GSH and GSH/GSSG and increases in GSSG during the post-
match recovery period have been observed in semi-professional soccer players
(Fatouros et al. 2010). Nevertheless, these findings were not confirmed in elite
female players. Andersson et al., (2010b) observed that the immediately post-
match increase in GSSG and decrease in GSH/GSSG returned to baseline at
21-h of the recovery period. Moreover, GSH content was unaltered during the
observation period (Andersson et al. 2010b). The moment of the season when
the investigation took place might contribute to the different results between
studies. In fact, some reports suggest that the antioxidant status (e.g. TAS) may
change within the season (Teixeira et al. 2009) influencing the capacity of the
antioxidant defence system and the ability to restore the redox balance. Players
training background (Martinovic et al. 2009) (e.g. years of practice) and
standard (Nakagami et al. 2009) cannot be ruled out as factors that may
influence the different results between studies, since they have been associated
with higher concentrations of sulfhydryl groups. Probably the vigorous training
and competition resulting in oxidative stress may lead to an up regulation in
antioxidant defences and associated shift in redox balance in favour of a more
reducing environment, thereby protecting athlete from excessive oxidative
damage during subsequent training sessions (Fisher-Wellman and Bloomer
2009).
In summary, a high-level official match led to increased catabolic hormonal
environment, markers of muscle damage, inflammation and oxidative stress

329
until 48-h of recovery period. Although match induced certain biochemical
alterations, the performance of these high-level adult soccer players was
affected only to a smaller extent and until 24-h of recovery period. This
suggests that high-level players possess a high capability to cope with the
game demands as shown by the fast recovery pattern and lower performance
impairments, at least in the examined neuromuscular parameters.
Nevertheless, together with previous studies conducted with players of different
competitive level and gender, data confirm that soccer match induces
temporary disturbances in the homeostasis of several physiological systems.
Therefore, studies concerning recovery strategies in soccer are needed.
Acknowledgments
We would like to thank to the Professional Soccer Club, to their technical staff,
medical department and to the soccer players involved in the study for their
committed participation. The excellent technical and practical assistance and
skillful involvement of André Seabra, Eduardo Oliveira, Emanuel Passos and
Inês Aleixo is appreciated.
Ethical standards
The authors declare that all the procedures of the experiments comply with the
current laws of the country in which they were performed.
Conflict of interest
The authors declare that they have no conflict of interest.
References
Adlercreutz H, Harkonen M, Kuoppasalmi K, Naveri H, Huhtaniemi I, Tikkanen
H, Remes K, Dessypris A, Karvonen J (1986) Effect of training on
plasma anabolic and catabolic steroid hormones and their response
during physical exercise. Int J Sports Med 7 Suppl 1:27-28
Andersson H, Bohn SK, Raastad T, Paulsen G, Blomhoff R, Kadi F (2010a)
Differences in the inflammatory plasma cytokine response following two

330
elite female soccer games separated by a 72-h recovery. Scand J Med
Sci Sports 20 (5):740-747.
Andersson H, Karlsen A, Blomhoff R, Raastad T, Kadi F (2010b) Plasma
antioxidant responses and oxidative stress following a soccer game in
elite female players. Scand J Med Sci Sports 20 (4):600-608.
doi:SMS987 [pii]10.1111/j.1600-0838.2009.00987.x
Andersson H, Raastad T, Nilsson J, Paulsen G, Garthe I, Kadi F (2008)
Neuromuscular fatigue and recovery in elite female soccer: effects of
active recovery. Med Sci Sports Exerc 40 (2):372-380
Ascensao A, Rebelo A, Oliveira E, Marques F, Pereira L, Magalhaes J (2008)
Biochemical impact of a soccer match - analysis of oxidative stress and
muscle damage markers throughout recovery. Clin Biochem 41 (10-
11):841-851.doi:S0009-9120(08)00161-6
Banfi G, Malavazos A, Iorio E, Dolci A, Doneda L, Verna R, Corsi MM (2006)
Plasma oxidative stress biomarkers, nitric oxide and heat shock protein
70 in trained elite soccer players. Eur J Appl Physiol 96 (5):483-486.
doi:10.1007/s00421-005-0104-6
Bangsbo J, Mohr M, Krustrup P (2006) Physical and metabolic demands of
training and match-play in the elite football player. J Sports Sci 24
(7):665-674
Bishop PA, Jones E, Woods AK (2008) Recovery from training: a brief review. J
Strength Cond Res 22 (3):1015-1024.
Bosco C, Komi PV, Tihanyi J, Fekete G, Apor P (1983) Mechanical power test
and fiber composition of human leg extensor muscles. Eur J Appl Physiol
Occup Physiol 51 (1):129-135
Brancaccio P, Maffulli N, Limongelli FM (2007) Creatine kinase monitoring in
sport medicine. Br Med Bull 81-82:209-230. doi:ldm014
[pii]10.1093/bmb/ldm014
Brites FD, Evelson PA, Christiansen MG, Nicol MF, Basilico MJ, Wikinski RW,
Llesuy SF (1999) Soccer players under regular training show oxidative
stress but an improved plasma antioxidant status. Clin Sci (Lond) 96
(4):381-385
331
Byrne C, Twist C, Eston R (2004) Neuromuscular function after exercise-
induced muscle damage: theoretical and applied implications. Sports
Med 34 (1):49-69. doi:3415 [pii]
Cazzola R, Russo-Volpe S, Cervato G, Cestaro B (2003) Biochemical
assessments of oxidative stress, erythrocyte membrane fluidity and
antioxidant status in professional soccer players and sedentary controls.
Eur J Clin Invest 33 (10):924-930. doi:1227 [pii]
Cometti G, Maffiuletti NA, Pousson M, Chatard JC, Maffulli N (2001) Isokinetic
Strength and Anaerobic Power of Elite, Subelite and Amateur Soccer
Players. Int J Sports Med 22:45-51
Edwards AM, Clark NA (2006) Thermoregulatory observations in soccer match
play: professional and recreational level applications using an intestinal
pill system to measure core temperature. Br J Sports Med 40 (2):133-
138. doi:40/2/133 [pii]10.1136/bjsm.2005.021980
Edwards AM, Macfadyen AM, Clark N (2003) Test performance indicators from
a single soccer specific fitness test differentiate between highly trained
and recreationally active soccer players. J Sports Med Phys Fitness 43
(1):14-20
Fatouros IG, Chatzinikolaou A, Douroudos, II, Nikolaidis MG, Kyparos A,
Margonis K, Michailidis Y, Vantarakis A, Taxildaris K, Katrabasas I,
Mandalidis D, Kouretas D, Jamurtas AZ (2010) Time-course of changes
in oxidative stress and antioxidant status responses following a soccer
game. J Strength Cond Res 24 (12):3278-3286.
Finaud J, Lac G, Filaire E (2006) Oxidative stress : relationship with exercise
and training. Sports Med 36 (4):327-358. doi:3644 [pii]
Fisher-Wellman K, Bloomer RJ (2009) Acute exercise and oxidative stress: a 30
year history. Dyn Med 8:1. doi:1476-5918-8-1 [pii]10.1186/1476-5918-8-1
Gaeta LM, Tozzi G, Pastore A, Federici G, Bertini E, Piemonte F (2002)
Determination of superoxide dismutase and glutathione peroxidase
activities in blood of healthy pediatric subjects. Clin Chim Acta 322 (1-
2):117-120. doi:S0009898102001638 [pii]

332
Garry JP, McShane JM (2000) Postcompetition elevation of muscle enzyme
levels in professional football players. MedGenMed 2 (1):E4.
doi:v02.n02/mgm0303.garr/mgm0303.garr-01 [pii]
Gorostiaga EM, Izquierdo M, Ruesta M, Iribarren J, Gonzalez-Badillo JJ, Ibanez
J (2004) Strength training effects on physical performance and serum
hormones in young soccer players. Eur J Appl Physiol 91 (5-6):698-
707.doi:10.1007/s00421-003-1032-y
Hu M-L (1990) Measurement of protein thiol groups and GSH in plasma. In:
Parker L (ed) Methods in enzymology. Academic Press, San Diego, pp
380-385
Ispirlidis I, Fatouros IG, Jamurtas AZ, Nikolaidis MG, Michailidis I, Douroudos I,
Margonis K, Chatzinikolaou A, Kalistratos E, Katrabasas I, Alexiou V,
Taxildaris K (2008) Time-course of changes in inflammatory and
performance responses following a soccer game. Clin J Sport Med 18
(5):423-431
Kraemer WJ, French DN, Paxton NJ, Hakkinen K, Volek JS, Sebastianelli WJ,
Putukian M, Newton RU, Rubin MR, Gomez AL, Vescovi JD, Ratamess
NA, Fleck SJ, Lynch JM, Knuttgen HG (2004) Changes in exercise
performance and hormonal concentrations over a big ten soccer season
in starters and nonstarters. J Strength Cond Res 18 (1):121-128. doi:R-
13313 [pii]
Kraemer WJ, Ratamess NA (2005) Hormonal responses and adaptations to
resistance exercise and training. Sports Med 35 (4):339-361. doi:3544
[pii]
Krustrup P, Ortenblad N, Nielsen J, Nybo L, Gunnarsson TP, Iaia FM, Madsen
K, Stephens F, Greenhaff P, Bangsbo J (2011) Maximal voluntary
contraction force, SR function and glycogen resynthesis during the first
72 h after a high-level competitive soccer game. Eur J Appl Physiol.
doi:10.1007/s00421-011-1919-y
Lowry OH, Rosebrough NJ, Farr AL, Randall RJ (1951) Protein measurement
with the Folin phenol reagent. J Biol Chem 193 (1):265-275

333
Magalhães J, Oliveira J, Ascensao A, Soares J (2004) Concentric quadriceps
and hamstrings isokinetic strength in volleyball and soccer players. J
Sports Med Phys Fitness 44 (2):119-125
Magalhaes J, Rebelo A, Oliveira E, Silva JR, Marques F, Ascensao A (2010)
Impact of Loughborough Intermittent Shuttle Test versus soccer match
on physiological, biochemical and neuromuscular parameters. Eur J Appl
Physiol 108 (1):39-48. doi:10.1007/s00421-009-1161-z
Malm C (2001) Exercise-induced muscle damage and inflammation: fact or
fiction? Acta Physiol Scand 171 (3):233-239
Martinovic J, Dopsaj V, Dopsaj MJ, Kotur-Stevuljevic J, Vujovic A, Stefanovic A,
Nesic G (2009) Long-term effects of oxidative stress in volleyball players.
Int J Sports Med 30 (12):851-856. doi:10.1055/s-0029-1238289
Maxwell JH, Bloor CM (1981) Effects of conditioning on exertional
rhabdomyolysis and serum creatine kinase after severe exercise.
Enzyme 26 (4):177-181
McLellan CP, Lovell DI, Gass GC (2010) Creatine kinase and endocrine
responses of elite players pre, during, and post rugby league match play.
J Strength Cond Res 24 (11):2908-2919.
Mohr M, Krustrup P, Bangsbo J (2003) Match performance of high-standard
soccer players with special reference to development of fatigue. J Sports
Sci 21 (7):519-528
Nakagami Y, Takatsu H, Okamoto M, Terada Y, Maruta K (2009) Relationship
between team performance levels and serum SH (sulfhydryl group)
changes brought about by intensive athletic training summer camp.
Journal of Analytical Bio-Science 32 (5):427-433
Nicol C, Avela J, Komi PV (2006) The stretch-shortening cycle : a model to
study naturally occurring neuromuscular fatigue. Sports Med 36 (11):977-
999. doi:36114 [pii]
Odetoyinbo K, Wooster B, Lane A (2009) The effect of a sucession of matches
on the activity profiles of professional soccer players. In: Reilly T,
Korkusuz F (eds) Science and Football VI. The procedings of the Sixth
World Congress on Science and Football. Routledge, pp 105-110

334
Powers SK, Jackson MJ (2008) Exercise-induced oxidative stress: cellular
mechanisms and impact on muscle force production. Physiol Rev 88
(4):1243-1276. doi:88/4/1243 [pii]10.1152/physrev.00031.2007
Rampinini E, Bosio A, Ferraresi I, Petruolo A, Morelli A, Sassi A (2011) Match-
Related Fatigue in Soccer Players. Med Sci Sports Exerc.
doi:10.1249/MSS.0b013e31821e9c5c
Reilly T, Drust B, Clarke N (2008) Muscle fatigue during football match-play.
Sports Med 38 (5):357-367. doi:3851 [pii]
Reilly T, Ekblom B (2005) The use of recovery methods post-exercise. J Sports
Sci 23 (6):619-627
Rodrigues V, Coelho DB, Mortimer L, Condessa L, Soares D, Silami-Garcia E
(2007) Exercise intensity in training sessions and official games in
soccer. Journal of Sports Science and Medicine 1:57-61
Rohn T, Hinds T, Vincenzi F (1993) Ion transport ATPases as targets for free
radical damage. Protection by an aminosteroid of the Ca2+ pump
ATPase and Na+/K+ pump ATPase of human red blood cell membranes.
Biochem Pharmacol 3:525-534
Salaj S, Markovic G (2011) Specificity of jumping, sprinting, and quick change-
of-direction motor abilities. J Strength Cond Res 25 (5):1249-1255.
doi:10.1519/JSC.0b013e3181da77df
Semark A, Noakes TD, St Clair Gibson A, Lambert MI (1999) The effect of a
prophylactic dose of flurbiprofen on muscle soreness and sprinting
performance in trained subjects. J Sports Sci 17 (3):197-203.
doi:10.1080/026404199366091
Semenick D (1990) The T-test. Natl Strength Cond Assoc J 12 (1):36-37
Silva JR, Magalhaes JF, Ascensao AA, Oliveira EM, Seabra AF, Rebelo AN
(2011) Individual Match Playing Time During the Season Affects Fitness-
Related Parameters of Male Professional Soccer Players. J Strength
Cond Res. doi:10.1519/JSC.0b013e31820da078
Teixeira V, Valente H, Casal S, Pereira L, Marques F, Moreira P (2009)
Antioxidant status, oxidative stress, and damage in elite kayakers after 1
335
year of training and competition in 2 seasons. Appl Physiol Nutr Metab
34 (4):716-724. doi:h09-062 [pii]10.1139/H09-062
Thompson D, Williams C, Garcia-Roves P, McGregor SJ, McArdle F, Jackson
MJ (2003) Post-exercise vitamin C supplementation and recovery from
demanding exercise. Eur J Appl Physiol 89 (3-4):393-400.
doi:10.1007/s00421-003-0816-4
Wilson JM, Flanagan EP (2008) The role of elastic energy in activities with high
force and power requirements: a brief review. J Strength Cond Res 22
(5):1705-1715. doi:10.1519/JSC.0b013e31817ae4a7

336

337
Table 1 Variation of functional performance measurements in the four evaluation
moments
Variables Pre-match 24 h 48 h 72 h
T5-m (s) 1.013 ± 0.1 1.063 ± 0.51 1.01 ± 0.52 1.015 ± 0.17
T30-m (s) 4.204 ± 0.19 4.232 ± 0.2 4.202 ± 0.18 4.207 ±0.22
CMJ (cm) 43.83 ± 4.89 40.75 ± 4.68* 43.15 ± 4.52 43.60 ± 4.61
COD (s) 8.67 ± 0.20 8.85 ± 0.41 8.57 ± 0.22 8.70 ± 0.25
Data are mean ± SD (n=7). T5-m – 5 meters sprint time; T30-m – 30 meters sprint time; CMJ –
countermovement jump; COD – change of direction; * significantly different from pre-match and
72-h (P < 0.05)

338

339
Table 2 Variation of isokinetic strength measurements in the four evaluation moments.
Variables Pre-match 24-h post 48-h post 72-h post
KED 90º.s-1 (Nm) 279.8 ± 50.1 263.5 ± 59.3 272.9 ± 38.9 274.6 ± 51.1
KFD 90º.s-1 (Nm) 155.2 ± 22.9 147.6 ± 22.1 150.9 ± 13.2 151.5 ± 23.6
H/Q D (%) 55.5 ± 3.1 56.7 ± 3.9 55.5 ± 3.7 55.5 ± 3.8
KEND90º.s-1(Nm) 287.1 ± 60.1 258.9 ± 53.3 273.7 ± 36 282.2 ± 62.1
KFND 90º.s-1 (Nm) 156.9 ± 25.1 145.7 ± 23 150.4 ± 15.5 151.4 ± 26.3
H/Q ND (%) 54.6 ± 4.8 56.8 ± 3.3 54.1 ± 2.8 54.3 ± 5
Data are mean ± SD (n=7). KED- peak torque in knee extension dominant legs; KEND- peak
torque in knee extension non-dominant legs; KFD- peak torque in knee flexion dominant legs;
KFND- peak torque in knee flexion non-dominant legs; H/Q D- concentric
hamstrings/quadriceps strength ratio dominant leg; H/Q ND- concentric hamstrings quadriceps
strength ratio non-dominant leg;

340
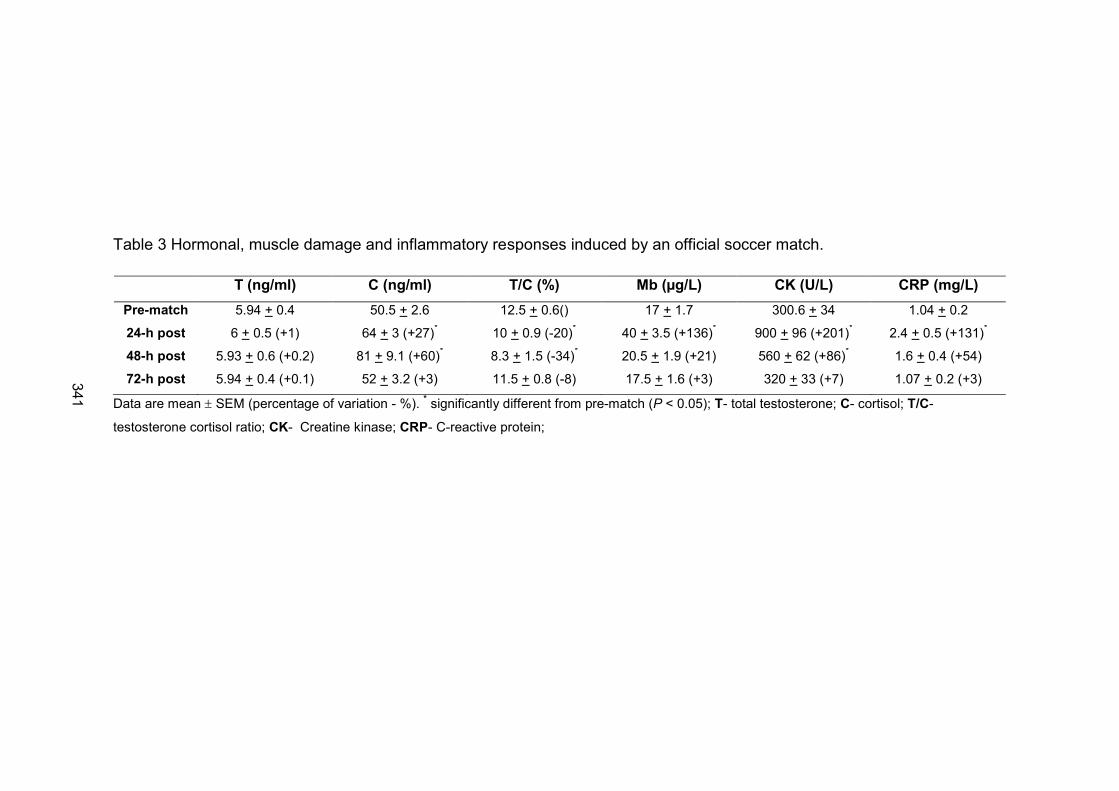
341
Table 3 Hormonal, muscle damage and inflammatory responses induced by an official soccer match.
T (ng/ml) C (ng/ml) T/C (%) Mb (µg/L) CK (U/L) CRP (mg/L)
Pre-match 5.94 + 0.4 50.5 + 2.6 12.5 + 0.6() 17 + 1.7 300.6 + 34 1.04 + 0.2
24-h post 6 + 0.5 (+1) 64 + 3 (+27)* 10 + 0.9 (-20)
* 40 + 3.5 (+136)
* 900 + 96 (+201)
* 2.4 + 0.5 (+131)
*
48-h post 5.93 + 0.6 (+0.2) 81 + 9.1 (+60)* 8.3 + 1.5 (-34)
* 20.5 + 1.9 (+21) 560 + 62 (+86)
* 1.6 + 0.4 (+54)
72-h post 5.94 + 0.4 (+0.1) 52 + 3.2 (+3) 11.5 + 0.8 (-8) 17.5 + 1.6 (+3) 320 + 33 (+7) 1.07 + 0.2 (+3)
Data are mean ± SEM (percentage of variation - %). * significantly different from pre-match (P < 0.05); T- total testosterone; C- cortisol; T/C-
testosterone cortisol ratio; CK- Creatine kinase; CRP- C-reactive protein;

342

343
Table 4 Oxidative stress and damage induced by an official soccer match
TAS (nmol) UA (mg/dl) SOD (U/L) GPX (U/L) GR (U/L) -SH (µmol/g) MDA (µmol/g)
Pre-match 1.06 + 0.01 4.8 + 0.11 711 + 7.7 1006 + 19 65 + 0.7 1.2 + 0.05 13 + 1.2
24-h post 1.2 + 0.04 (+13)* 4.9 + 0.5 (+2.1) 781 + 8 (+9.8)* 921 + 32 (-8.4)
* 72 + 1.7 (+11)
* 2.2 + 0.1 (+83)
* 22 + 2.6 (+70)
*
48-h post 1.15 + 0.03 (+8.5)* 5.7 + 0.3 (+19) 745 + 5 (+4.8)* 964 + 31 (-4.2) 67 + 2 (+3.1) 1.1 + 0.05 (-8.3) 17 + 0.3 (+31)
*
72-h post 1.07 + 0.01 (+2.8) 4.7 + 0.2 (+2.1) 712 + 7.8 (+1.2) 1000 + 18 (-0.6) 64.9 + 0.8 (-0.2) 1.3 + 0.05 (+8) 14 + 1.3 (+7.7)
Data are mean ± SEM (percentage of variation - %). * significantly different from pre-match (P < 0.05); TAS- total antioxidant status; UA- uric acid;
SOD- superoxide dismutase; GPX- glutathione peroxidase: GR- glutathione reductase; -SH- sulfhydryls groups; MDA- malondialdehyde;

344

345
General Discussion

346
347
General Discussion
The overall picture of the studies comprised in this dissertation is that even
though soccer players are submitted to an increase in certain markers of
physiological stress during practices and competitions, professional soccer
players seem to possess a good capability to cope with the soccer physiological
demands.
Data from this dissertation complemented with data from other studies
conducted with soccer players of different standards, showed that both soccer
specific endurance performance (e.g. game-physical performance) and
neuromuscular function improve during the season (S-I and S-III) in spite of the
increase in certain bio-markers of physiological stress observed during
practices and competition (S-II, S-V). The recovery period between seasons
(off-season) resulted in certain biochemical alterations such as a decrease in
muscle damage and oxidative stress markers (S-II). Additionally, as already
observed in other intermittent team sports such as handball (Gorostiaga et al.,
2006; Granados et al., 2008), studies I and II showed that the individual match
playing time (IMPT) throughout the season may influence players’ physical
fitness. Moreover, associations between IMPT, physical performance in the
match and in functional tests, and biochemical parameters were observed (S-I,
S-II and S-III).
In line with previous data (Andersson et al., 2010a; Andersson et al., 2010c;
Andersson et al., 2008; Ascensao et al., 2008; Greig, 2008; Krustrup et al.,
2011; Rampinini et al., 2011; Reilly & Rigby, 2002; Small et al., 2008; Small et
al., 2009; Thompson et al., 1999), our studies showed that soccer matches
examined by distinct models such as intermittent shuttle exercise (S-IV), friendly
match (S-IV) and/or official match (S-V) resulted in performance impairments
and increased stress markers throughout the recovery period of semi-
professional (S-IV) and professional players (S-V). Nevertheless, distinct
recovery patterns and biochemical responses were observed in distinct
standards of players and models of investigation (e.g., friendly match vs. soccer
specific field test). In fact, a friendly-match (S-IV) when compared to a specific
348
protocol (LIST; S-IV) resulted in higher cardiac demands, changes on redox
status, adenine nucleotide metabolism and on lymphocyte counts in semi-
professional players. Moreover, in a high-level official match (S-V), increased
catabolic hormonal environment, muscle damage and inflammation, as well as
oxidative stress throughout recovery period were observed. However, in spite of
these biochemical alterations, high-level players showed lower performance
impairments and faster recovery kinetics of distinct neuromuscular capabilities.
In addition, data from study III highlighted that professional players’ physical
fitness and training status (e.g., neuromuscular capabilities) can be associated
with physical performance in the match.
The knowledge of players’ physiological and functional characteristics is not
only a matter of undeniable interest, but also the understanding of how these
characteristics are altered throughout the training process is important for
coaches, medical departments and researchers. In this regard, review I and II
examined the different anthropometric, physiological and neuromuscular
alterations that occur during the annual soccer training cycle (preseason, in-
season and off season). Distinct patterns are presented in relation to the
physiological and functional adaptations during preseason and in-season
training. Most of the studies showed that VO2max increases (average
increments ranging 5 to 11%) during preseason (Aziz et al., 2005; Bogdanis et
al., 2009; Caldwell & Peters, 2009; Kalapotharakos et al., 2011; Mercer et al.,
1997; Metaxas et al., 2006) and is maintained towards in-season (Haritodinis et
al., 2004; Kalapotharakos et al., 2011; Mercer et al., 1997; Metaxas et al., 2006;
Mohr et al., 2002b). In addition, literature shows that above a threshold of 62
ml.kg-1.min-1, no significant increments are observed (Clark et al., 2008;
Edwards et al., 2003a). In fact, the referred increases in VO2max found in
different standard of players during in-season (Caldwell & Peters, 2009; Ferrari
Bravo et al., 2008; Jensen et al., 2009; Magal et al., 2009) occurred under this
threshold. Maximal aerobic speed (MAS) improves during preseason (3.1-9.2%)
(Arent et al., 2010; Haritodinis et al., 2004; Kalapotharakos et al., 2011;
Metaxas et al., 2006; Wong et al., 2010), and improvements of different
magnitude (4.5-21.6%) were also observed in different physiological indices

349
measured during exercise at sub-maximal intensities (Helgerud et al., 2001;
Impellizzeri et al., 2006; Kalapotharakos et al., 2011; Zoppi et al., 2006).
Additionally, in line with other researches (Iaia et al., 2009b; Krustrup et al.,
2003a; Krustrup et al., 2006a; Rebelo & Soares, 1997), in study I we observed
faster and greater soccer specific endurance (SSE; e.g. Yo-Yo tests)
improvements during preseason than during the other periods of the season. In
addition, field-tests showed great average increments in SSE (e.g., Yo-Yo tests,
R-I and R-II) than physiological endurance-related parameters analysed in
laboratory. Regarding in-season alterations, although the majority of the studies
did not report in-season VO2max improvements, other endurance parameters,
such as MAS and physiological adaptations during submaximal exercise
performance (e.g., velocity at anaerobic threshold) seem to increase during this
period (Casajus, 2001; Dupont et al., 2004; Impellizzeri et al., 2006; Jensen et
al., 2009). In addition, albeit some evidence of improvements in time to
exhaustion during maximal incremental tests (MIT) occur in parallel to
increments in VO2max, there is evidence that professional soccer players
increase MIT without increments in VO2max (Edwards et al., 2003a). It seems
that highly trained players are able to increase exercise performance through
enhanced anaerobic energy systems (Edwards et al., 2003a).
As observed in study III, increases in soccer specific endurance performance
(e.g., game-physical performance) occurred during in-season. Nevertheless,
data reported in review I did not suggest significant changes in VO2max (Aziz et
al., 2005; Casajus, 2001; Clark et al., 2008; Haritodinis et al., 2004; Heller et al.,
1992; Kalapotharakos et al., 2011; Metaxas et al., 2006; Mohr et al., 2002b) and
only smaller physiological adaptations during sub-maximal exercise occurred
during in-season of professional players (Casajus, 2001; Edwards et al., 2003a;
Impellizzeri et al., 2006; McMillan et al., 2005b). These facts highlight the high
sensitivity of field assessments for monitoring the endurance ability of soccer
players (Drust et al., 2007). Different investigations (Aziz et al., 2005; Carling et
al.,2011; Faude et al., 2011; Meister 2011; Mohr et al., 2003; Nunez et al 2008;
Rampinini et al., 2007) using distinct methodological designs to analyse
longitudinal changes in soccer players physical fitness challenged the common

350
concept amongst the soccer population (e.g. technical and medical staff) that
players may accumulate ‘‘fatigue’’ during periods of heavy match commitments
and/or as the season progresses (Reilly & Ekblom, 2005). Although studies
generally report the maintenance or improvement in distinct measures of
physical fitness during in-season (R-I), we observed that soccer SSE evaluated
by YYIE2 performance decreases from the start to the end of the in-season (S-
I). However, an in-season decrease in maximal performance capacity of
professional players during an incremental exercise test, have been reported
between these two periods (Faude et al., 2011). Additionally, lower values of
SSE evaluated by the YYIR1 (Krustrup et al., 2003a) and YYIE2 (Bradley et al.,
2010) that were not statistically significant have also been reported between
these two time-points. Although without corroboration of other studies, Clarck et
al., (2008) observed a decrease in AT from middle to the end-of-season (-6%)
without significant changes in VO2max being reported. Nevertheless, in
agreement with different reports dealing with high-level junior and senior players
(Helgerud et al., 2001; Impellizzeri et al., 2006; Mohr et al., 2003; Rampinini et
al., 2007b) certain game-related high-intensity categories were shown to
progress throughout the season, particularly during in-season (S-III). In study III,
we also observed that players were more frequently engaged in high-intensity
activities during the last quarter of the season than in the previous season
periods. Moreover, in this study (S-III), the amount of high-intensity running
(HIR) performed in the last fifteen-minutes period of each half, which is
indicative of the ability to maintain performance during the game (Krustrup et
al., 2005), was again higher towards the end-of-season. In addition, at the end-
of-season, a greater distance in HIR was covered in the peak and in the lowest
fifteen-minute periods of the match than in the correspondent fifteen-minute
periods of the other time points of the season (S-III). Study III seems to confirm
evidence of others (Bradley et al., 2009; Mohr et al., 2003, 2005; Randers et al.,
2010) of a decrease in the ability of maintain physical activity in the second half
and towards the last 15-min period of the match as well as temporarily during
the game. This fact has largely been suggested to occur as result of players
experiencing accumulative fatigue during the match (Edwards & Noakes, 2009;

351
Mohr et al., 2005; Reilly et al., 2008). This has been proposed to be related to
the fact that each player may employ a subconscious pacing strategy to ensure
that they reach the end of the game without an excessive threat to their
homeostasis, i.e., having physically working at a vigorous, yet sustainable level
of performance (Edwards & Noakes, 2009). Edwards et al., (2009) proposed a
pacing model to explain the self-regulation of elite soccer performance, which is
based on both pre-match (intrinsic and extrinsic factors) and dynamic
considerations during the game (e.g., accumulation of metabolites in the
muscles, substract availability). We can suggest that the increase in game-
physical activity towards the end-of-season (S-III) can result, at least in part,
from an improvement in some form of conscious (Carling & Bloomfield, 2010a)
and/or subconscious pacing strategies by professional players (Edwards et al.,
2009). Therefore, the development and improvement of pacing strategies
allowing increased ability to preserve high intensity activity later in matches or
high-intensity performance through the season cannot be excluded. This fact,
seems consistent with the higher game physical performance towards end-of-
season (S-III) without improvements in the majority of physiological and function
parameters (R-I and S-I) and evidence of increases in certain stress bio-
markers (S-II) being reported. Nevertheless, there are contradictions regarding
the concept of team sport players pacing during matches (Aughey, 2010).
Endurance physiological determinants (e.g., VO2 kinetics and ability to maintain
acid-base balance) that have been demonstrated to be associated with the
ability to increase performance (Christensen et al., 2011) and carried out via
high-intensity intermittent exercise (Dupont et al., 2005; Rampinini et al., 2009a;
Rampinini et al., 2009b) can occur during the season contributing to the
improved game physical performance observed in study III and others (Mohr et
al., 2003; Rampinini et al., 2007b). An improvement in running economy as the
season progresses cannot be excluded. In fact, when high level athletes
already have, either through training or selection, high values for VO2max and
the ability to sustain VO2max, it is possible that further improvements in
performance will depend on improved economy (Foster & Lucia, 2007).
Although positive adaptations in running economy (RE) have mainly been

352
reported and investigated during preseason (Bogdanis et al., 2011; Helgerud et
al., 2001; Helgerud et al., 2003; Impellizzeri et al., 2006), there are recent
reports of increased RE (75% of MAS) in professional players after 2 weeks of
high intensity training performed in the end of the competitive season
(Christensen et al., 2011). Nevertheless, Macmillan et al., (2005b) did not found
any change in RE after 10-wks of high-intensity aerobic training (6-wks in
preseason plus 4-wks in in-season). However, given that RE has been
assessed by treadmill running and significant differences exist between this
assessment mode and soccer specific activity during training and matches,
there is some conviction that soccer specific work economy may improve
somewhat during in season, with relevant gains not detectable by conventional
treadmill testing (Helgerud et al., 2001; McMillan et al., 2005b).
Some studies reported significant correlations between soccer players’
performance on distinct Yo-Yo tests and other performance measurements,
such as players’ high-intensity running in the match (HIR) (Bradley et al., 2010;
Krustrup et al., 2005; Krustrup et al., 2003b), total distance covered during
match (Bradley et al., 2010; Krustrup et al., 2005), VO2max (Castagna et al.,
2006; Krustrup et al., 2006a; Rampinini et al., 2009a), incremental treadmill test
performance (ITT) (Krustrup et al., 2006a) and peak power in counter
movement jump (Castagna et al., 2006). Others have found correlations
between performance in repeated sprint ability (RSA) and VO2max (Rampinini
et al., 2009a). However, some contradictory findings were found when
correlations of HIR with ITT and VO2max were analysed (Krustrup et al., 2005;
Krustrup et al., 2003b). In addition, recent reports showed correlations between
changes in SSE field tests (e.g., YYIE2) and changes in physical game
performance (e.g., high-intensity running) during the season which were not
evident for VO2max (Bradley et al., 2011). However, it is important to note that
most of the studies only detected moderate correlations, and so, do not
establish a direct cause effect relationship (Rampinini et al., 2007a). We did not
observe any correlation between YYIE2 performance and game-physical
parameters (S-III). Thus, it is important to consider that even though data from
laboratory and field tests are useful in providing information on players’ general

353
physical profile and soccer-specific fitness, results should not be used to predict
the overall performance during match-play because of the complex nature of
the demands of the game (Svensson & Drust, 2005).
Literature have been showed (review I and II) positive adaptations on players’
neuromuscular system measured through distinct performance tests, e.g. sprint,
change of direction ability (COD) and jump tests. In addition, this evidence
seems to be more pronounced when jumps involve stretch-shortening cycle
activities (SSC) and all body movement interactions (jumps with arm swing)
(Aziz et al., 2005; Caldwell & Peters, 2009; Mercer et al., 1997; Ostojic, 2003;
Sedano et al., 2011; Thomas & Reilly, 1979). Generally, data suggests that
when early improvements are obtained in SSC activities (from PPS to BCP),
they can be maintained and even further improved during in-season (Aziz et al.,
2005; Chelly et al., 2009; Gorostiaga et al., 2004; Mujika et al., 2009; Ostojic,
2003; Sedano et al., 2011; Thomas & Reilly, 1979). Nevertheless, CMJ was
unaltered from middle of season to the beginning of season, while performance
in other SSC based activities showed the better scores, e.g. COD and sprint
tests (S-I). These results suggest that performance in activities depending on
stretch-shortening cycle may improve in these season time-points. This may
suggest that neuromuscular adaptations affecting SSC mechanisms occur
during in-season. It could be asked why this fact was not observed in CMJ
tests. One possible reason may be that CMJ might not fulfil the criteria of SSC
as would running-based exercises, which have very fast transitions from stretch
to shortening phases, as well greater stretch velocity, both critical for stretch
reflex activation (Wilson & Flanagan, 2008).
Regarding strength variations, our results (S-I) are in line with other studies
suggesting that isoinertial assessment seems to be more effective than
isokinetic evaluations to detect players’ performance improvements (Bogdanis
et al 2009, 2011; Harris et al., 2007; Kotzamanidis et al., 2005; Malliou et al.,
2003; Mercer et al., 1997; Nunez et al ., 2008; Ronnestad et al., 2008;
Ronnestad et al., 2011). The higher sensitivity of the isoinertial testing modes
may result from of the neural and mechanical differences between isometric
and isokinetic tests to sport-specific functional movements (Duchateau et al.,

354
2006; Gabriel et al., 2006; Harris et al., 2007). It appears that greatest changes
are observed when the mode of training matched that of testing (Harris et al.,
2007). In fact, data from our study showed that players maintain the same
levels of strength, evaluated by an isokinetic device, both on knee extension
and flexor muscles, as well as bilateral strength differences throughout the
soccer season. This stability of isokinetic strength parameters (e.g., KE) of
professional soccer players throughout the season was also observed by other
investigators (Malliou et al., 2003). In contrast, academic players showed a
significant decrease of KE during an 11-week competitive soccer season
(Kraemer et al., 2004). Possible differences in training background (professional
vs. academic) and time devoted to training (e.g. strength training) may
contribute to explain, at least partially, the referred differences between studies.
Curiously, the KE peak torques observed in the present study (I) during the
season were higher than those reported in other professional soccer players
even at lower angular velocities (60º/s-1) (Malliou et al., 2003; Mercer et al.,
1997).
Despite the multi-factorial aetiology of muscle injury, some evidence suggest
that strength imbalances between agonistic and antagonistic muscles (Arnason
et al., 2008; Croisier et al., 2008), as well as bilateral differences (BD) (Arnason
et al., 2008; Croisier et al., 2008; Magalhães et al., 2004), previous injury
(Arnason et al., 2008; Dauty et al., 2003) and lower resistance to fatigue (e.g.
hamstrings) (Kawabata et al., 2000; Sangnier & Tourny-Chollet, 2008), are
major risk factors for soft tissues injuries of soccer players. Interestingly, the
H/Q ratio of the soccer players increased throughout the season (middle and
end of season) and no changes were examined in BD (study I). As such, the
increase and maintenance of lower limb muscle balances throughout the
season may help, at least in part, to decrease the risk of muscle injury. In this
regard, Croisier et al., (2008; 2003) examined that soccer players with lower
limb muscle imbalances appear 4 to 5 times more likely to sustain a hamstring
strain than those without the imbalance. Although we did not intend to compare
or evaluate the efficiency of an intervention program in the prevention of muscle
injuries, it`s important to highlight that when values of the ratio of concentric

355
hamstrings to concentric quadriceps peak torque (Hconc/Qconc) of the players
evaluated (study I) were under 0.55 (55%), players performed some specific
strength exercises in order to restore a balance above this threshold. In
addition, significant increases in H/Q ratio during in season phase were
observed. Nevertheless, we calculated the “conventional” strength ratio
(Hconc/Qconc) and not the “dynamic” strength ratio (eccentric
hamstring:concentric quadriceps peak torque). This last ratio has been shown
to possess a higher discriminating character when assessing the risk of
hamstring injury in professional soccer players (Croisier et al., 2008).
During the 90 min of the match, soccer players can perform 10-20 sprints, a
high intensity running every 70s, about 15 tackles, 10 headings, 50
involvements with the ball, and 30 passes, as well as changing pace and
sustaining forceful contractions to maintain balance and control of the ball
against defensive pressure (Stolen et al., 2005). Therefore, it is agreed that high
stress levels are imposed on the neuromuscular system in order to cope with
these muscle power based efforts. In study I, we observed that the systematic
participation of players in soccer matches favors the increase and maintenance
of soccer players KE and KF muscle strength and sprint ability. This suggests
that the short bursts of acceleration performed during games could have a
positive effect in developing players` ability to accelerate (Cometti et al., 2001;
Wisloff et al., 2004). In addition, the better sprint and CMJ performance were
observed in players with high IMPT in the middle of the season (S-II). In
accordance with our data, Kraemer et al., (2004) observed that during and after
an 11-week competitive soccer season, collegiate soccer players’ KF strength
did not significantly decrease as much has KE. Moreover, the authors observed
that starter players showed higher values of KF in the different evaluation
points. The observed relationship between IMPT and these neuromuscular
qualities suggests, at least in part, that male professional soccer players with
higher IMPT are more prone to increase or maintain these physical qualities
throughout the season, i.e., competition time may possibly contribute to
influence certain physical characteristics of professional soccer players.
Recently, Sporis et al., (2011) observed that starter players maintained and

356
improved agility parameters, as well as overall power performance (sprinting,
jumping and kicking the ball) better than non-starters. These facts raised the
question as whether “Can the official soccer game be considered the most
important contribution to player's physical fitness level?” (Sporis et al., 2011).
As confirmed in study IV and V, there is evidence that knee strength and SSC
activities are affected by fatigue and muscle damage after the game (Ascensao
et al., 2011; Ascensao et al., 2008; Ispirlidis et al., 2008). In addition, KF has
been referred as a muscle group less resistant to fatigue than KE (Sangnier &
Tourny-Chollet, 2008). In fact, after a match, higher force decrements
(Andersson et al., 2008; Greig, 2008) and longer period of muscle soreness
(Thompson et al., 1999) were found in knee flexors than in extensor muscles.
This may explain, at least partially, the higher increases in KF found in players
with more IMPT. In fact, muscle adapts to training regimens that rely in stretch-
shortening cycles and are less impaired with repeated exposure (McHugh,
2003; Reilly et al., 2008).
Study I showed that improvements in KE and CMJ from start to end of
preseason were significantly correlated with the improvement in sprint
performance. KE strength also showed significant correlations with the CMJ and
T5 performance. Moreover, strong correlations between CMJ and T30 and T5
were observed in distinct season time-points. Previous studies (Gorostiaga et
al., 2004; Wisloff et al., 2004) showed that players with improvements in CMJ
and in lower limb strength experienced improvements in short-sprint
performance. As proposed by other researchers (Gorostiaga et al., 2004), this
may suggest a possible transfer from leg power strength gains into enhanced
sprint performance. In fact, there were significant associations between the
different functional tests that rely in power activities (CMJ, T5, T30 and COD) in
the different evaluation time points. Moreover, from start to end of preseason
we also observed that improvement in the distance covered in YYIE2 was
parallel to the performance increase in a muscle power test (CMJ). As
highlighted in review II, it has been reported that both strength and endurance
training programs during preseason and in-season could lead both to
improvements in muscle power (e.g., 10 and 30-m sprint, vertical jump) and in

357
soccer specific endurance performance (e.g., YYIR1) (Bogdanis et al., 2011;
Nunez et al., 2008; Wong et al., 2010).
Data from study III seems to corroborate other investigations reporting that
game-related physical performance changes throughout the season (Mohr et
al., 2003; Rampinini et al., 2007b) and is related with players’ training status
(Krustrup et al., 2003a; Krustrup et al., 2005; Rampinini et al., 2007a). In fact,
some studies showed that soccer players’ performance in the Yo-Yo intermittent
recovery test both in males (Krustrup et al., 2003a) and females (Krustrup et al.,
2005), in incremental field tests (shorter version of the University Montreal
Track Test) (Rampinini et al., 2007a), and in repeated shuttle sprint ability test
(Rampinini et al., 2007a) could be an indicator of game-related physical
performance. In this regard, we examined (S-III) that different neuromuscular
parameters (T5, T30, COD, CMJ, KE and KF), composites scores of power-
related (CSPRT; T5, T30, COD and CMJ) and isokinetic strength tests (KE and
KF), were correlated with certain game physical parameters (GPPs) analysed
by time-motion, particularly in high-intensity locomotor categories. In fact,
players with better performance in T5, T30, COD test and CSPRT showed more
high-intensity running (HIR) in the five-minute period (Next5-min) after the peak
five-minute period (P5-min) of during the match, a lower decrement in HIR from
P5-min to the Next5-min (%DecP5-N5) and covered more distance in sprint
during the second half of the match. These findings suggest that soccer players
with improved capacity to perform sport specific maximal dynamic activities
have an increased ability to maintain performance during repeated short periods
of high intensity exercise and a high fatigue resistance in the second half of the
game. Also, some isokinetic strength parameters (S-III) and composite scores
of knee extension (CSKE), knee flexion (CSKF) and knee extension and flexion
(CSKEF) were correlated with game-related physical performance (S-III).
Relationships were observed between KE and KF muscle strength of the non-
dominant leg, CSKE, CSKF, and CSKEF and the following fatigue parameters:
decrement in HI running from the first to the last fifteen-minute period of the
game and decrement in HI running from the first to last intense fifteen-minute
periods of both halves (S-III). These data suggest that greater levels of lower
358
limb strength are related to a higher ability to maintain performance during
games. Given the high stress upon the neuromuscular system during match, it
seems that players with greater ability to produce force, fast accelerations and
decelerations, and to quickly and efficiently perform complex and coordinated
movements, can perform better in certain game-related physical parameters. In
this regard, rapid force production is considered essential for a wide range of
athletes (Hoff & Helgerud, 2004; Nummela et al., 2006). Recent reports
highlighted that an enhancement in neuromuscular function can be determinant
to improve short and long term endurance capacity (Aagaard & Andersen,
2010). In accordance with these authors, the possible contributing mechanisms
may be related with an increase in the proportion of type IIA muscle fibers (less
fatigable and yet highly capable of producing high contractile power) and the
increase in rapid force capacity (RFD) (allowing a shorter propulsion phase,
reducing the time of contraction-induced muscle occlusion, and hence
increasing the time of muscle perfusion thereby increasing the mean capillary
transit time (MTT)). Thus, a prolonged muscle relaxation phase potentially
would allow for an increased MTT, enabling an increased diffusion of FFA into
the muscle cells and an enhanced removal of metabolites produced by the
contracting muscle (Aagaard & Andersen, 2010). Moreover, there is an
agreement that training-related improvements in motor unit recruitment and
synchronization seem to result in force potentiation, improving efficiency and
coordination, which may delay the onset of fatigue (Aagaard & Andersen, 2010;
Creer et al., 2004; Paavolainen et al., 1999a; Paavolainen et al., 1999b).
Even though low to medium intensity running are the predominant running
activities during the match, it seems consensual that power-based efforts such
as sprints, changing of direction and speed, jumps, duels, and kicking, which
are mainly dependent on maximal strength and anaerobic power of the
neuromuscular system, are essential factors to successfully perform in soccer
(Cometti et al., 2001). These speed and movement direction changes
performed during game impose higher levels of stress on the involved
musculature, thereby affecting energy usage and could result in a higher
physiological impact than habitual forward movements (Dellal et al., 2010). In

359
fact, a massive metabolic load is imposed on players not only during the
maximal intensities phases of the game but every time acceleration occurs,
even when speeds are low (Osgnach et al., 2010). Indeed, higher VO2
(Buchheit et al., 2010a), blood lactate concentration (Buchheit et al., 2010a;
Dellal et al., 2010), heart rate (Dellal et al., 2010) and rate of perceived exertion
(Dellal et al., 2010) values were observed in high intensity intermittent exercise
performed in shuttle mode than during in-line format. Some possible reasons
could be the involvement of additional muscles, such as upper body muscles
(Jacobs et al., 1993), and different neuromuscular activation patterns during
COD activities (Buchheit et al., 2010a). At high speed displacements and during
intermittent shuttle running, turning techniques become more important, and
anaerobic power is essential because players might accelerate after turning to
reach the desired speed (Dellal et al., 2010). The physiological demands and
functional characteristics that are typical of soccer specific activity may, at least
in part, explain the observed correlations found in the present study (S-III)
between power-related tests and game-physical parameters.
Fatigue is a complex phenomenon that cannot be simply explained by a single
factor (Durandt et al., 2006). The ability to resist to fatigue has been related to
different functional and physiological features (Bangsbo et al., 2006; Buchheit et
al., 2010b; Durandt et al., 2006; Mohr et al., 2005). Improvements in
coordination specificities (Buchheit et al., 2010b) and a greater ability to COD
movements (Durandt et al., 2006) are positively associated with performance
and with an attenuated fatigue response. Indeed, an optimized performance
during game and particularly during the most intense periods would be
expected in players with neuromuscular features tuned for the movements
performed during game (Clark, 2009). Soccer players with greater CSPRT
values may have a higher ability to accelerate, decelerate and change direction
than players with lower values, leading to an improved physical capacity. This
greater physical capacity may likely offset some of the mechanical and
neuromuscular effects of repeated stretch-shortening cycle (SSC) fatigue
(Clark, 2009). For instance, improved training status is related to higher ability
to regulate joint stiffness more efficiently during exposure to maximal intensity
360
repeated sprints (Clark, 2009). The reported reductions in isometric (Ascensao
2011; Silva 2007), concentric (Ascensao et al., 2008; Rahnama et al., 2003)
and eccentric muscle strength (Greig, 2008; Rahnama et al., 2003; Small et al.,
2008) as well as in EMG activity (Rahnama et al., 2005) of the major lower limb
muscles during the game are clear manifestations of game-induced fatigue. In
study IV and V, in agreement with other observations, it was examined that
game-induced performance decreases in strength and certain strength
dependent actions such as sprint (S-IV; Andersson et al., 2008: Ascensao et al.,
2008; Mohr et al., 2004; Small et al., 2009) and jump (S-IV and S-V; Andersson
et al., 2008; Ascensao et al., 2008). According to literature, players’ fatigue
reflected by decreases in EMG activity of major lower limb muscles and by
compromised strength towards the final periods of the match may cause a lower
work-rate towards the end of soccer match (Rahnama et al., 2005; Rahnama et
al., 2003). In fact, both high intensity running and maximal accelerations seem
to be reduced later in games, which are manifestations of game-induced fatigue
(S-III; Bangsbo et al., 2006; Mohr et al., 2005). Moreover, since each specific
game action requires breaking and propulsive forces, the importance of strength
and endurance capacities of leg muscles likely increases as the game
progresses (Brughelli et al., 2008; Buchheit et al., 2010a). Thus, strength
decrements during the game could affect the performance of explosive actions
such as jumping, sprinting and changing of direction movements, which require
high quadriceps strength at the initiation of movement when the joint extension
velocity is low (Rahnama et al., 2003). It is plausible to assume that soccer
players with higher levels of strength will be more able to maintain that strength
towards the final stages of each half of the game than players with less
strength, and thus show a lower decrement in work rates. Generally, athletes’
ability to exercise during longer periods of time is usually related to their
endurance capability (e.g., anaerobic threshold, VO2max). Nevertheless, as
already stated, improved endurance is also influenced by factors related to
muscle recruitment and force production (Aagaard & Andersen, 2010;
Paavolainen et al., 1999a; Paavolainen et al., 1999b). It was recently observed
that performance and running economy of well-trained distance runners are

361
related to the neuromuscular capacity to produce force (Nummela et al., 2006).
In fact, although the causes of variability in RE are not well understood, it
seems likely that anatomical traits, mechanical skill, neuromuscular skills, and
storage of elastic energy are important factors (Hoff & Helgerud, 2004).
Professional soccer players with higher improvements in different
neuromuscular parameters (e.g., 1RM, maximal strength by lean leg volume-
1RM/LLV) also showed high improvements in RE, SSE and fatigue resistance
during a repeated sprint ability tests (Bogdanis et al., 2011).
Performance measurements and hormonal, oxidative and muscle damage
markers have been suggested as important stress bio-markers in the monitoring
of fatigue and recovery (Adlercreutz et al., 1986; Bishop et al., 2008; Clarkson &
Tremblay, 1988; Finaud et al., 2006; Kraemer & Ratamess, 2005; Margonis et
al., 2007; Urhausen & Kindermann, 2002). Interestingly, in study V we found
increased levels of catabolic hormonal environment, muscle damage and
inflammation, as well as oxidative stress at 24-h and 48-h of the recovery period
after an official match of the competition phase in professional players. Although
performance decrements were evident in the muscle-related power and
strength tests from pre-match to 24-h post-match, only CMJ significantly
decreased (S-V). With different match models (e.g. intermittent shuttle exercise
vs. friendly match vs. official match), studies IV and V, reinforce the evidence
observed by others that high standard players might show smaller post-match
performance impairments and faster recovery kinetics (Andersson et al., 2008;
Krustrup et al., 2011; Odetoyinbo et al., 2009; Rampinini et al., 2011). Recently,
Rampinini et al., (2011) observed that performance of high-level players was
partially recovered 24-h post-match and fully recovered 48-h post-match. In
contrast, data from our study IV and from other studies with semi-professional
players (Ascensao et al., 2008; Fatouros et al., 2010), reported longer recovery
periods (48-h to 72-h). Recently, Odetoyinbo et al., (2009) observed that game-
physical performance of professional players was not affected when two
matches were played interspersed by two days of recovery. Additionally,
Meister et al., (2011) observed that a 3-week period of high match exposure in
elite football players did not affect laboratory, psychometric and performance
362
parameters. These differences in time to recover may be related, amongst other
factors, to players’ physical fitness. The better physiological responses to match
play (regulation of core body temperatue) (Edwards and Clarck 2006) and to
high-intensity intermittent exercise (HIT) of high standard players (VO2 Kinetics,
blood La-, H+, HCO3 - and RPE measured after HIT and the rate of La-
accumulation during HIT) (Rampinini 2009a, 209b), may explain, at least in part,
the observed differences between studies. In this regard, players of higher
standard seem to more quickly recover from high intensity intermittent exercise
(Edwards et al., 2003) and to be able to sustain a higher level of physical work
throughout the match (Mohr et al., 2003). In addition, higher standard players
have a greater neuromuscular capability to perform powerful contractions during
isokinetic force production tasks, as well as during and throughout the repetition
of stretch-shortening cycle activities (SSC) (Cometti et al., 2001; Dauty &
Potiron Josse, 2004; Impellizzeri et al., 2008a; Mujika et al., 2008; Rampinini et
al., 2009b). Knowing that the mechanical stress induced by the eccentric
component of the SSC activities may result in ultra-structural muscle damage
(Armstrong, 1984; Clarkson & Tremblay, 1988; Friden & Lieber, 2001; Malm,
2001; Newham et al., 1987; Yu et al., 2004), it may be expected that these high
level players have a higher capacity to cope with the match demands and
therefore be less susceptible to exercise-induce muscle damage and
subsequent performance impairments. In agreement, data from study III
highlighted the relevance of players’ neuromuscular function for game physical
performance. Nevertheless, in contrast with data provided by study V and
others (Andersson et al., 2008; Krustrup et al., 2011; Rampinini et al., 2011),
longer periods of residual fatigue was observed in professional male soccer
players after a friendly match (Ispirlidis et al., 2008). Considering that an official
match is expected to be more intense than a friendly match, the different
recovery patterns between the former studies involving professional players
may be associated with seasonal-related differences in physical fitness.
Unfortunately, previous authors did not report the phase of season in which the
match was performed. Differences in physical fitness levels that can be found
during season (Carling & Orhant, 2010; Casajus, 2001; Dupont et al., 2004;

363
Edwards et al., 2003a; Gorostiaga et al., 2004; Iaia et al., 2009b;
Kalapotharakos et al., 2011; Mohr et al., 2002b; Ostojic, 2003; Reinke et al.,
2009; Sporis et al., 2008a) may affect the results and so their influence cannot
be excluded. This fact highlights that studies on match fatigue and recovery
should provide information regarding the time-point of the season where the
match took place (pre-season vs. in-season vs. off-season) in order to allow a
better interpretation and comparison of the results. In study I, we observed that
the systematic participation of professional players in soccer matches favours
the increase and maintenance of athlete’s knee extensor (KE) and knee flexor
(KF) isokinetic muscle strength and short-sprint ability. In addition, in study II, in
line with previous evidence and with research involving other team sport
(Hoffman et al., 2005), we examined that the plasma kinetics of certain
intracellular proteins and enzymes (e.g. decrease of plasma myoglobin (Mb)
and creatine kinase trend to be lower towards end-of-season), may suggest a
degree of sensitization (contact adaptation) of the muscles relating to the
repeated traumas (mechanical and/or metabolic) occurring during the season
(Hoffman et al., 2005). Accordingly, we examined that although C-reactive
protein (CRP) increased from start to middle- and end-of-season, peak values
of this bio-marker as well as from CK and Mb were observed in the middle of
the competitive season. Curiously, in agreement with others studies (Mohr et
al., 2003; Rampinini et al., 2007b) we observed (S-III) that physical match
performance was higher towards de end-of-season. Knowing that the
mechanical stress induced by the eccentric component of the SSC activities,
typical in soccer practice and competition, may result in ultra-structural muscle
damage (Clarkson & Tremblay, 1988; Nosaka et al., 2005; Teague & Schwane,
1995; Twist & Eston, 2005), it may be suggested that high level players have a
higher capacity to cope with the match demands, and therefore be less
susceptible to exercise-induce muscle damage and subsequent performance
impairments. In this matter, study IV and others (Ascensao et al., 2008;
Ascensao 2011; Fatouros et al., 2010) showed evidences that low-level soccer
players have greater match-induced performance impairments and longer
recovery periods after a match than high-level soccer players (S-V) (Andersson

364
et al., 2008; Krustrup et al., 2011; Rampinini et al., 2011). Accordingly,
professional (S-V) but not semi-professional players (S-IV), recovered isokinetic
strength as well as the majority of the different evaluated neuromuscular
parameters after 24-h (only CMJ performance was impaired at 24-h).
Additionally, semi-professional players (S-IV) showed greater performance
impairments and longer recovery periods in jump and sprint performance as
well as in knee extension and flexion isokinetic force production. It is plausible
to assume that if muscle damage occurred, it was of minor magnitude in
professional players. This was corroborated by a lower neuromuscular
impairment, a shorter recovery period in addition with a lower efflux of
intracellular proteins (S-V).
In study IV, we observed that sprint ability, in contrast with CMJ was more
affected by the friendly-match than by the LIST. Probably, considering the
distinct levels of motor coordination involved in the actions of jumping and sprint
running, the repeated eccentric actions performed during the match might have
caused disturbances in running movement control (Bottas et al., 2005). In fact,
eccentric contractions may had affected more pronouncedly the running
performance of these semi-professional players, which likely rely to a greater
extent on muscular coordination than a single jump or leg curl and extension.
On the other hand, in study V, CMJ was the only neuromuscular parameter
impaired at 24-h recovery. Accordingly, Andersson et al., (2008) and Ascensao
et al., (2011) reported a longer impairment of CMJ, when compared to other
neuromuscular parameters, after a friendly elite female soccer match. During
recovery, the neuromuscular system can adjust to the contractile failure in a
very flexible way (Nicol et al., 2006) that makes it difficult to establish a direct
link to which mechanism can be related to the distinct recovery pattern
observed. Moreover, the different neuromuscular parameters assessed (CMJ,
sprint and COD) have been recently described as independent motor abilities
(Salaj & Markovic, 2011). CMJ has been characterized as a concentric and slow
SSC-related action (Salaj & Markovic, 2011) that in contrast with other activities
(e.g., running) rely on slower transitions between stretch to shortening phases,
as well as by a lower stretch velocity, which limits stretch reflex activation
365
(Wilson & Flanagan, 2008). Certain specific components of the SSC might
attenuate the detrimental performance effects associated with exercise-induced
muscle damage (EIMD), e.g. increase of muscle pre-activation (Byrne et al.,
2004). Nevertheless, studies investigating fatigue in SSC activities reported
greater performance impairments in actions involving higher (e.g., sprint, drop
jump) than lower (e.g., CMJ and Squat jump) ground impact forces (Nicol et al.,
2006). However, others did not observe impairments in sprint performance (5-
10-20-30-m) after EIMD (Semark et al., 1999) and after the match (Ascensão et
al., 2011). Ascensão et al., (2011) assessed the effects of a single session of
cold or thermoneutral water immersion after a match on muscular dysfunction
and damage in soccer players. The previous authors observe that in contrast to
sprint performance, high-level junior players had impaired CMJ performance
during the 48-h of recovery period. Moreover, the maintenance of sprint ability
and squat jump performance in one group of the examined players (cold water
immersion group), occurred despite the increase in indirect markers of EIMD
(CK and perceived muscle soreness increased and maximal isometric voluntary
contraction decreased throughout 48-h recovery). In study V, despite the
preservation of the majority of the examined neuromuscular parameters during
the recovery period (e.g. muscle peak torque, COD and sprint ability recovery at
24-h and CMJ at 48-h) that may suggest indicate absence of muscle damage
we examine increases in other indirect markers of EIMD (e.g., CK). It cannot be
excluded, amongst other factors, a decrease in work capacity resulting of a
lower force capability in all joint range of motion (e.g., force decrements or
damage at specific muscle lengths). Also, EIMD may shift the length-tension
relationship (Brown & Donnelly, 2011; McHugh & Tetro, 2003; Philippou et al.,
2009; Prasartwuth et al., 2006). If these facts occurred, it might at least, in part,
distinctly influence the recovery pattern of the different motor abilities due to
their kinetics and kinematics characteristics. Therefore, the already mentioned
dissimilarities between the recovery pattern of distinct parameters measured
within our studies (S-IV and S-V) and the observations of others (Ascensao et
al.,2008; Ascensao et al., 2011; Andersson et al 2008; Ispirlidis et al., 2008;

366
Krustrup et al 2011; Rampinini et al 2011) highlighted the complexity of the
mechanisms of the neuromuscular SSC fatigue (Nicol et al., 2006).
Andersson et al., (2008) suggested that the greater delay in CMJ recovery
compared to other neuromuscular parameters was not solely dependent on the
recovery of force production of the extensors and flexors muscles but also of
additional mechanisms related with SSC fatigue. Nevertheless, it is important to
highlight that post-match responses may be influenced by the used exercise
model to analyse performance, and physiological and biochemical responses to
the “match” (soccer-specific protocol vs. friendly-match vs. official match). In
fact, as observed in study IV, although, the impact of distinct models (friendly
match vs. LIST) did not differ regarding the observed muscle damage markers
and some neuromuscular parameters, friendly-match required higher cardiac
demand and induced higher changes on redox status, adenine nucleotide
metabolism and on lymphocyte counts than LIST.
Testosterone (T) and cortisol (C) are two major endogenous indicators of tissue
adaptation, and their ratio represents a biological marker of homeostasis
reflecting the relationship between the anabolic and catabolic hormonal
environment within the body (Filaire et al., 2003; Gorostiaga et al., 2004;
Handziski et al., 2006; Hayes et al., 2010; Kraemer et al., 2004; Kraemer &
Ratamess, 2005; Kraemer et al., 1998). According to our results (S-V), the
official soccer match altered the catabolic/anabolic-related hormonal
homeostasis towards a predominant catabolic response during the first 48
hours of the recovery period. This was expressed by the acute increase in
cortisol response in the 48-h recovery period without alteration in total
testosterone, which resulted in a significant decrement in the plasma total
testosterone:cortisol ratio (T/C). Ispirlidis et al., (2008) found significant
increases in cortisol concentration immediately after a friendly soccer match.
Increase in C concentrations and decreased T/C during the recovery period (24-
h) has also been reported after other high-level football codes competitions
(Cormack et al., 2008; McLellan et al., 2010). Also, in line with our findings,
Ispirlidis et al., (2008) did not observe alterations in plasma testosterone (free
testosterone) concentration throughout the 144 hours of the recovery period. To

367
our best knowledge, no reports on T/C during the recovery period after an
official soccer match have yet been described.
Study II showed that total plasma T concentration was stable during the soccer
season. Filaire et al., (2003) found similar findings when salivary testosterone
concentrations (biological active fraction) throughout the season and off-season
were analysed. Also, Kraemer et al., (2004) observed that T did not change
during the competition period while an increase in T was found just one week
after the end of competitive period over the initial phase of competition period
(Kraemer et al., 2004). Others (Handziski et al., 2006) showed that T in the
week of taper that preceded the beginning of competitive season, was higher
than in the start of pre-season training, but was lower at the end-of-season than
in the former time-points. Concerning C concentrations, our results (S-II)
showed a progressive decline in C throughout the competition period with
significantly lower values at the end-of-season than in the start of both seasons
and middle-of-season. Kraemer et al., (2004) did not examine changes in C
concentrations during several time points of an 11-week competition period of
academic soccer players. In contrast to our data, Handzisky et al., (2006)
reported that cortisol decreased during preseason and was higher at the end-of-
season than before and after pre-season period. Higher resting concentrations
of salivary C at the end-of season than in start of season were also observed by
others (Filaire et al., 2003). In study II, as a result of the T and C kinetics, we
observed a progressive increase in T/C towards the end-of-season and a
decrease in this ratio during off-season. Kraemer et al., (2004) observed that
T/C increased in non-starters players after one week of recovery during off-
season. However, no changes were examined in starters. In the study of Filaire
et al., (2003), no differences were found in T/C in the different assessments
carried out during the season (pre-and-post pre-season, end-of-season and off-
season). In contrast, others (Handziski et al., 2006) observed an increment in
T/C after the preparatory period (week of taper preceding competition phase)
and a higher decrement in the end-of-season than in the other time points (pre-
and-post preseason). The different results observed between our (S-II) and
previous studies could be explained, at least partially, by the differences in the
368
study designs. Handziski et al., (2006) and Kraemer et al., (2004) analysed the
soccer season with different periodization’s structures (e.g., half-season and 11-
wk competitive season, respectively). Perhaps the length of the preparation
period and/or the different densities of match commitments during the weekly
in-season cycles that characterize distinct periodization structures, may among
other factors, explain the different hormonal kinetics.
In line with our observations (S-IV), studies in other football codes (Cormack et
al., 2008) and team sports (Mazon et al., 2011) reported a decrease in C and
increase in T/C during the competition period. Moreover, resting hormonal
concentrations reflect the current state of muscle tissue and elevations or
reductions may occur at various stages depending on substantial changes in
the volume and intensity of training phases, i.e., number of weekly match
commitments (Hakkinen et al., 1988). Research involving high-level basketball
players has shown that both increases and decreases in catabolic and anabolic-
related hormones may occur in distinct phases of the in-season (Martinez et al.,
2010). The progressive decrease in C and increase in T/C ratio observed in our
study may reflect an increase in the anabolic status of skeletal muscles in the
phase that a higher accumulation of match-related physiological stresses
occurs (e.g., middle and end-of-competitive phase). In fact, the decrease in
cortisol parallels the increment in T/C, which reflects an enhanced anabolic
environment throughout the competition phase (Kraemer et al., 1998). These
results suggest that it is possible to correct or avoid situations of accumulated
stress even in high competitive contexts (Martinez et al., 2010). Moreover, it is
appealing to speculate from a hormonal perspective that players’ physical
adaptations and/or specificities of their phenotype resulting from their training
background led to a higher ability to cope with the stress induced by the
intermittent nature of the activity in soccer. Another factor that cannot be
excluded is a decreased influence of psychophysiological factors, since in our
study (S- II) the end-of season blood samples were obtained as soon as the
competitive season finished, and therefore, at least in part, may have
contributed to the decrease in C concentration found in this period as team
performance during season was very successful. The beginning of the season

369
can be associated with a high anticipatory level of psychophysiological stress
that may influence C concentrations (Hoffman et al., 2005). In fact, it is
recognized that preseason is a period devoted to players’ selection and squad
definitions. On the other hand, Reinke et al., (2009) observed that the reduction
of stress levels of professional soccer players during off-season was related to
an increase in catabolic metabolism (e.g., increased in leukocytes counts and
IL-8) and a decrease in soccer players lean body mass (Reinke et al., 2009).
Therefore, since resting cortisol concentrations generally reflect long-term
training stress (Kraemer & Ratamess, 2005), the higher C values found during
off-season can be related, among other factors, to a process related to the
metabolization of the damaged muscle cells during in-season (Reinke et al.,
2009).
There are reports regarding academic starter players with higher C in the
middle of competition phase than in other time points within the competitive
period (Kraemer et al., 2004). Accordingly, in study II, we observed that
individual match playing time (IMPT) at the middle of the season was positively
associated with C values and negatively associated with T/C ratio.
Nevertheless, in this time-point we also observed that players with higher match
playing time (IMPT) were those with greater performance in power-based
efforts, and no association between the hormonal data and performance was
found. It is likely that these increased levels of catabolic hormonal-related
evidences in players with higher IMPT (increased cortisol and decrease T/C
ratio) could be related to muscle damage induced by the accumulation of
training sessions and matches (S-IV and S-V). The fact that IMPT was
associated with lower T/C and with higher performance raises the question on
the extent to which anabolic:catabolic ratio can be related with performance, as
well as which magnitude of variation of T/C could be associated with
performance changes. Although a decrease in anabolic/catabolic ratio has been
suggested to be associated with performance decreases (Adlercreutz et al.,
1986), different investigations observed that soccer players performance
increments can be related with both decrements (Gorostiaga et al., 2004) and
increments in T/C (Kraemer et al., 2004). In study II, players with greater

370
individual increases in T/C from middle to end of season had the higher
individual increases in KFD, KFND between the two periods. Furthermore, a
positive association between T/C ratio and KED and KFND values and negative
association between plasma C and isokinetic knee extensor and flexor force
production were examined in the end-of-season. However, since we did not
examine the hormones production controlled by the hypothalamo-pituitary-
testicular and adrenal axis that mediate the regulation of T and C, as well as
other important factors that influence the role of T and C in muscle (e.g.,
hormone bioavailability, binding proteins and membrane receptors), the present
results should be interpreted with caution.
The mechanical stress induced by the eccentric components of the SSC
activities that are common in soccer practice and competition induces skeletal
muscle damage, results in morphological alterations within the muscle and led
to loss of cellular integrity (Friden & Lieber, 2001; Peake et al., 2005; Teague &
Schwane, 1995). The increase in plasma concentration and activity of certain
intracellular proteins and serum enzymes (e.g., Mb, CK, LDH) has been widely
used as stress-biomarker that reflects damage of the muscle tissue (Brancaccio
et al., 2007; Ebbeling & Clarkson, 1989; Kanter, 1995; Powers & Jackson,
2008)]. Studies IV and V corroborate the post-match increase in muscle
damage markers observed in similar investigations (Ascensao et al., 2008;
Fatouros et al., 2010; Ispirlidis et al., 2008). Longer responses (72-h to 96-h
post-match) were reported in semi-professional (study IV; Ascensao et al.,
2008; Fatouros et al., 2010) compared with our and other studies with players of
the same standard (study V) (Andersson et al., 2008; Krustrup et al., 2011;
Rampinini et al., 2011) during the recovery period. Considering that baseline
values in study V were obtained 96-h after the previous official game of the
regular championship, probably as observed in study II, the higher pre-match
CK values found in the professional players of the study V and others
(Rampinini et al., 2011), might be associated with “residual” levels of muscle
damage from previous match and regular training sessions (McLellan et al.,
2010). On the other hand, the different magnitude of changes in CK in studies
IV, V and others (Andersson et al., 2008; Ascensao et al., 2008; Fatouros et al.,

371
2010; Ispirlidis et al., 2008; Krustrup et al., 2011; Rampinini et al., 2011), might
also be related to the training status when the match was performed. In fact,
training status has been shown to be a determinant factor in the magnitude of
the post-exercise CK changes, since less trained subjects exhibited the higher
post-exercise increases (Garry & McShane, 2000; Maxwell & Bloor, 1981).
Nevertheless, given the large number of factors that are associated with plasma
CK inter-individual variability (e.g., age, muscle mass, physical activity) both in
rest and in response to exercise (low and high responders) (Brancaccio et al.,
2007), it is difficult to compare the magnitude of the changes from different
studies. Moreover, some studies evidenced that muscle enzyme release may
not clearly reflect the size of the injury (e.g., evaluated by histological analysis),
being the efflux of intracellular proteins a possible result of both damage and
transient changes in membrane permeability (Malm, 2001). In studies II, IV, and
V, both MDA content increases in post-match (24-h, 48-h) and during the
competitive phase are consistent with alterations in membrane permeability that
could, at least in part, contribute to an enhanced efflux of intracellular proteins
to circulation despite the preservation of the functionality of the contractile
machinery, and concomitantly of the performance observed in study II and V.
Studies IV and V also corroborate the occurrence of an acute phase
inflammatory response after the match. This was suggested by the increase of
blood leukocyte counts (S-IV) (Andersson et al., 2010a; Ascensao et al., 2008;
Ispirlidis et al., 2008), inflammatory mediators (Andersson et al., 2010a;
Ispirlidis et al., 2008) and in cortisol levels (S-V) (Ispirlidis et al., 2008) that has
been described after friendly-matches performed by professional and semi-
professional soccer players. During inflammation, an increased in inflammatory
mediators stimulate the synthesis of acute phase proteins such as C-reactive
protein (CRP) (Ispirlidis et al., 2008). In accordance with our results (S-V),
Ispirlidis et al., (2008) and Ascensão et al., (2011) observed that CRP content
increased at the same time-point (24-h) of the recovery period after a friendly
match, both in professional and semi-professional players. Concerning chronic
variation in CRP content, we observed an increase from the start to the middle
and end-of-season. Nevertheless, values observed in the middle and in the
372
end-of-season were not statistically higher than those at the beginning of the 2nd
season. Other studies (Reinke et al., 2009) did not find differences in
professional soccer players’ plasma CRP levels between the end-of-season,
beginning and end of pre-season period.
Soccer presents an activity pattern highly demanding for neuromuscular system
(e.g., acceleration and decelerations) and/or metabolic (e.g., elevated
mitochondrial oxygen consumption) pathways. This is considered a prone
condition to free radical-induced damage (Vina et al., 2000). In fact, the high
absolute levels of mitochondrial oxygen consumption, the increased oxidation of
circulating catecholamines, and the intermittent and repeated sprint actions-
causing temporary ischemia-reperfusion events in skeletal muscle are plausible
factors that may induce reactive oxygen and nitrogen species (RONS)
production during and after a soccer match (Ascensao et al., 2008) as well as
during training periods. An increase in RONS during and following acute
exercise is believed to serve the necessary “signal” for the hormetic-associated
up-regulation in antioxidant defence commonly observed with chronic exercise
training (Fisher-Wellman & Bloomer, 2009). However, the chronic effects of
high-level soccer practice in the antioxidant status and oxidative stress levels of
professional players have not yet been investigated. In addition, studies
examining acute changes in redox status during and after a match have been
scarcely investigated (Ascensao et al., 2008; Fatouros et al., 2010). Although
evidence suggests a higher increase in plasma activity of certain endogenous
antioxidants such as uric acid (Cazzola et al., 2003), superoxide dismutase
(Brites et al., 1999; Cazzola et al., 2003) and glutathione reductase (Banfi et al.,
2006) in soccer players than in untrained individuals, there are contradictory
results regarding a higher total antioxidant status (TAS) (Banfi et al., 2006;
Brites et al., 1999). Moreover, although scarce and contradictory studies
involving other team sports showed that training may induce improvements in
both athletes total antioxidant enzymatic and non-enzymatic capacity [for
reference see (Finaud et al., 2006)]. Nevertheless, data gathered in soccer
players (Arent et al., 2010; Brites et al., 1999) revealed that the increasing free
radical scavenging capacity by means of ergogenic supplementation or by the

373
endogenous up-regulation of antioxidant defences due to the training-related
pro-oxidant insults, is not a guarantee of sufficient protection or a condition for a
decrement in exercise-induced oxidative damage during periods of high-
intensity training and competition. In study II, we did not observe chronic
changes on TAS and UA levels throughout the soccer season. According to our
best knowledge, only one study focused on the kinetics of these biochemical
parameters during a soccer season, and analysed UA contents (Filaire et al.,
2003). Filaire et al., (2003) observed higher plasma UA levels in professional
soccer players in the beginning and at the end-of competitive period than before
the beginning of the pre-season. We observed an increase in TAS during the
post-match recovery period (S-IV and S-V). Previous studies with semi-
professional soccer players reported that TAS increased immediately after a
friendly-match and throughout the 48-h (Fatouros et al., 2010) and 72-h
recovery period (Ascensao et al., 2010c). Consistent with these findings,
Anderson et al., (2010c) observed increases in specific endogenous (non-
enzymatic) compounds and in certain dietary antioxidants immediately and
during the 72-h post-match recovery period, respectively. According to the
authors (Anderson et al., 2008), this delayed increase in dietary antioxidants
during recovery may serve as a putative mechanism to strengthen the
endogenous antioxidant defence and restore the redox balance (Andersson et
al., 2010c). Different studies seem to support the idea that a soccer match
induces a pro-oxidant insult resulting in a compensatory response in plasma
TAS immediately after or during the first 48-h of the post-match recovery period.
Data examining post-match UA and IMP responses (Krustrup et al., 2006b)
seem to suggest that a soccer match is associated with a significant
degradation of purine nucleotides. Despite the absence of UA increases in
study V (with professional players), in study IV and in others studies with semi-
professional players an elevated plasma UA content was observed immediately
after a friendly match (Ascensao et al., 2008) that was maintained until 48-h
recovery period (Fatouros et al., 2010). In agreement with study V, match-
related UA responses during the recovery period were lower in players of higher
standard (Andersson et al., 2008). In fact, Andersson et al., (2010b) observed

374
UA levels of elite female soccer players increase immediately after a match but
return to pre-match levels at 21-h of the recovery period. Altogether, data
suggest that lower-level compared to high-level players seem to more strongly
rely on the degradation of purine nucleotides as reflected by the higher
increments in UA contents throughout recovery. In addition, the longer post-
match recovery pattern reported by Ispirilidis et al., (Ispirlidis et al., 2008) e.g.,
physical parameters, CK and UA responses, in contrast to our results and
others (Andersson et al., 2008; Krustrup et al., 2011; Rampinini et al., 2011)
involving players of the same standard, could be related with seasonal
variations in physical fitness.
As observed in study IV, the friendly-match induced higher increases in TAS
and UA (30 min) contents than LIST. Moreover, MDA was higher and SH were
lower after match than after LIST (30 min and 24 h). These results suggest that
the match may induce higher changes on redox status and on adenine
nucleotide metabolism than LIST. Moreover, it may also suggest that the match
resulted in a higher pro-oxidant insult than the LIST.
In line with the above referred effects of a soccer match on antioxidant markers,
specific enzyme activity tends to respond accordingly (Fisher-Wellman &
Bloomer, 2009). Superoxide dismutase (SOD) is the major antioxidant defence
upon superoxide radicals production and is the first defence line against
oxidative stress (Finaud et al., 2006). Concerning the alterations in redox status
throughout the post–match recovery period (S-V), we observed an increase in
SOD activity during the 48-h of the post-match recovery period (S-V). Although
no reports on SOD kinetic after a soccer match have been published, studies
with untrained individuals and other athletic populations showed that exercise
can result in increments or maintenance of SOD activity (Fisher-Wellman &
Bloomer, 2009). Accordingly, a progressive increase in SOD activity during the
middle and at the end-of-season period was found in study II. This up-regulation
of SOD may result from the continuous pro-oxidant insult derived from the
already described mechanism during the season, as corroborate by study IV
and V. Since SOD is considered the first enzymatic defence line against
oxidative stress (Finaud et al., 2006; Powers & Jackson, 2008) and that the

375
magnitude of exercise-mediated changes in skeletal muscle SOD activity
increases in function of the intensity and duration of the exercise (Powers &
Jackson, 2008), alterations may be expected due to the high physiological
demands of a soccer match. Moreover, in conjunction with the protective role
against free radical-induced muscle damage during intense exercise,
antioxidants may have a positive effect on performance and on the prevention
of fatigue (Vina et al., 2000). Although examined in animal models, superoxide
radicals can attenuate the function and enhance the rate of fatigue from the
exercised muscles (Barclay & Hansel, 1991). Arent et al., (2010) examined the
effects of pre-season supplementation with a dietary containing an orally
available form of SOD as part of an antioxidant and anticatabolic nutriceutical
mixture. Although no differences between supplemented and control players
were found in performance capacity, players submitted to the ergogenic
intervention presented lower CK and 8-isoprostranes responses during the
post-exercise recovery period (Arent et al., 2010). Curiously, although we did
not observe any relationship, the lowest CK activity in-season was coincident
with the higher SOD activity (middle season).
Glutathione peroxidase (GPX) reduces a wide range of hydroperoxides and
therefore is an important intracellular antioxidant protecting against oxidative
stress (Powers & Jackson, 2008). To exert is scavenging function, GPX
requires a supply of reduced glutathione (GSH) to provide electrons (Powers &
Jackson, 2008). The antioxidant enzyme glutathione reductase (GR) is involved
in the reduction of oxidized glutathione (GSSG), and elevated activity is thought
to be indicative of increased free radical generation (Kanter, 1995). With respect
to the match-induced alterations in antioxidant glutathione cycle-related
enzymes (S-V), although a decrease in GPX at 24-h of recovery period was
observed, others (Fatouros et al., 2010) examining semi-professional players
observed an increased activity during the 24 to 72-h post-match recovery
period. On the other hand, an up-regulation of plasma GR activity at 24-h post-
match was also found. Concerning the chronic alterations in resting antioxidant
glutathione cycle-related enzyme activities, although not significant, lower
values of GPX activity during competition period (middle and end-of season)

376
than in beginning of season were observed. To our best knowledge, studies II
and V are the first that analysed the effect of a soccer season (S-II) and a
soccer match (S-V) in plasma GR activity. The activity of GR decreased from
middle to end-of-season. Taking into account the critical physiological role of
the balance between the first (SOD) and second step (GPX and/or catalase)
antioxidant enzymes, the significant increase in plasma SOD/GPX ratio
observed after the game and throughout the competition period, mainly due to a
decreased in post-match GPX activity and no changes throughout competition
phase as referred to previously, seems to favor H2O2 accumulation. This fact
could be indicative of a low plasma scavenging efficiency contributing to
enhanced oxidative stress (Gaeta et al., 2002) that is consistent with the
increased levels of MDA found in studies II, IV and V and others (Ascensao et
al., 2008; Fatouros et al., 2010; Ispirlidis et al., 2008). These facts suggest that
although an up-regulation of the first line of defence of the endogenous
enzymatic antioxidant system (SOD) throughout the season may suggest a
higher capability to cope with the soccer-related metabolic stresses (S-II), this
was not evident in the secondary enzymatic line of defence, i.e., GPX did not
change and GR decreased from middle to end-of-season (S-II). As previously
mentioned, the increase in oxidative stress by-products (MDA) may suggest
that an imbalance exists between oxidants and antioxidants due to the
continuous pro-oxidant state associated with the soccer demands (e.g., muscle
high metabolic rates). In fact, oxidative stress occurs both under conditions in
which local antioxidant defences are depleted or when the rate of the radical
production is greater than the capacity of the antioxidant defence mechanisms
(Buettner, 1993). Taking into account the evidence of an increase in ROS
production, i.e., up-regulation of certain antioxidant enzymes and the increase
levels of lipid peroxidation by products (MDA) and other markers of oxidative
stress (CK) during the soccer season (S-II) and post-match recovery periods (S-
IV and S-V), it may be important to consider the beneficial effect of antioxidants
supplementation in professional soccer players. Nevertheless, there are
contradictions regarding their ability to enhance exercise performance as well
as in the ability to help recovery of soccer players (Arent et al., 2010) and other

377
athletic populations (Finaud et al., 2006; Powers & Jackson, 2008). It is
important to highlight that increased ROS could activate signal/transcription
pathways and promote among other factors the hormetic-associated up
regulation in antioxidant defence (Fisher-Wellman & Bloomer, 2009; Magalhaes
et al., 2005). Even though if needed, an adequated antioxidant supplementation
may help athletes to maintain an optimal health, which is a key conditioning to
attaining the best performance (Finaud et al., 2006), there is a point at which
increased ROS may represent an optimal redox state for greater performance,
i.e., force production (Reid, 2001).
Literature regarding soccer nutritional strategies and metabolic demands of
soccer training and match play focus on the role of the ingestion of proper
amounts of carbohydrates before, during and after exercise (Bangsbo et al.,
2006; Burke, 2010; Burke et al., 2006; Zehnder et al., 2001). Furthermore, it has
been emphasized that optimal adaptations and enhanced recovery may occur
when carbohydrate ingestion is complement with protein and/or amino acid
administration in order to stimulate muscle protein synthesis, inhibit protein
breakdown, and allow net muscle protein accretion (Beelen et al., 2010; Burke
et al., 2006). Nevertheless, the increased levels of MDA in our studies (S-II, S-
IV and S-V) may also highlight the importance of lipid rich macronutrients, which
could compensate for an eventual increase in lipid peroxidation (Magalhaes et
al., 2005). In fact, since dietary fatty acids are exchanged with membrane fatty
acids, dietary fat composition is reflected in membrane lipid composition and
could influence cell function through effects on membrane properties
(Magalhaes et al., 2005).
Concerning the influence of IMPT, it seems that not only influences some
physical and hormonal parameters (S-I and S-II) but might also have some
impact on the endogenous enzymatic and non-enzymatic antioxidant system
(S-II). Study II showed that in the middle of season players with higher IMPT
had increased levels of TAS and GPX activity and a lower ratio between the 1st
and 2nd line of enzymatic defense. The increased levels of TAS and GPX
activity in players with higher IMPT may act as a mechanism to strengthen the
endogenous antioxidant defence and restore the redox balance (Andersson et

378
al., 2010c) due to the increase in the intensity and volume of exercise exposure
(Powers et al., 1999).
Another class of biomarkers of oxidative stress involves the evaluation of
oxidative modified molecule (Powers & Jackson, 2008). Free radical reactions
can cause damage to lipid membranes, proteins, DNA and other cellular
constituents (Kanter, 1995) generating uniquely oxidized biomolecules that can
be used as “finger-tips” to detect oxidative stress (Powers & Jackson, 2008).
Regarding plasma sulfhydryl residues (-SH), we observed an increase during
post-match recovery period (at 24-h; S-V) and an increase during the
competitive period of professional players (S-II). These results showed
decreased disulphide linkages (-S-S-) concentration from both proteins and
reduced glutathione, and ultimately suggest a prevention of protein oxidation. In
study IV and in Ascensao et al., (2008), decreased –SH contents were
observed in semi-professional soccer players immediately after and throughout
the first 48-h of the recovery period. Nevertheless, as previously stated, in study
V involving professional players, a distinct response was observed, i.e.,
increased –SH contents at 24-post-match. A decrease in GSH and GSH/GSSG
and increases in GSSG during the post-match recovery period have been
observed in semi-professional male soccer players (Fatouros et al., 2010).
Nevertheless, these findings were not confirmed in elite female players.
Andersson et al., (2010c) observed that the immediately post-match increased
in GSSG and decreased in GSH/GSSG returned to baseline at 21-h of the
recovery period. Moreover, GSH content was unaltered during the recovery
period (Andersson et al., 2010c). The point in the season when the match was
performed might contribute to the different results between studies. In fact,
although not observed in study II, some reports with other athletic populations
suggest that the antioxidant status (e.g. TAS) might change within the season
(Teixeira et al., 2009). In addition, as examined in study II, players match
exposure from beginning to the middle of the season (higher IMPT) was
associated to higher resting TAS at that time-point. These facts, among other
factors, might influence the capacity of the antioxidant defence system and the
ability to restore the redox balance. Players training background (Martinovic et
379
al., 2009) (e.g. years of practice) and standard (Nakagami et al., 2009) cannot
be ruled out as factors that may influence the different results between studies,
since they have been associated with higher concentrations of sulfhydryl
groups. Probably, vigorous training sessions and competitions resulting in
oxidative stress may lead to an up regulation of antioxidant defences and
associated shift in redox balance in favour of a more reducing environment,
thereby protecting the athlete from excessive oxidative damage during
subsequent training sessions (Fisher-Wellman & Bloomer, 2009).
One of the least understood and more scarcely studied phases of the soccer
season training cycle is the off-season period (S-II). The off-season period
appears to result in decrements of a variety of physiological, biochemical and
functional parameters (R-I and S-II). There are reports that the off-season
period seems to result in an increase in body fat of different standard of players
(Caldwell & Peters, 2009; Reinke et al., 2009) and decreases in professional
players lean body mass (Reinke et al., 2009). Despite the scarcity of reports,
deconditioning during off-season resulting in VO2max decrements in players of
different standards (Caldwell & Peters, 2009; Mohr et al., 2002b; Sotiropoulos et
al., 2009) and slower VO2 kinetics (75% MAS) (Christensen et al., 2011) have
been described. In addition, a decrease in time to exhaustion during a maximal
incremental lab test and increase in heart rate at sub-maximal intensity has
been reported in professional players (Mohr et al., 2002). Regarding
neuromuscular function, it seems that such decrements are more evident in
muscle power ability than in muscle strength (Caldwell & Peters, 2009; Ostojic,
2003) (as indirectly confirmed by the data in review I and from study I). In
addition, a decrease in the activity of certain muscle oxidative enzymes was
found (Christensen et al., 2011). Accordingly, a decrease in the first line of
defence of the antioxidant enzymatic system (SOD) and in plasma SOD/GPX
ratio was analysed. In addition, the reduction in functional and metabolic
demands produces a decrease in lipid peroxidation by products (MDA) and in –
SH contents. Moreover, lower levels of plasma bio-markers of muscle damage
(CK) were examined after off-season.

380

381
Conclusions

382
383
Conclusions
Based on the general conclusions of each of the different studies presented in
this dissertation, it seems possible to highlight the following major conclusions:
a) Seasonal variations occur in different soccer specific and non-specific
endurance and neuromuscular function parameters. Soccer specific
endurance (game-physical performance) and soccer specific
neuromuscular function (change of direction speed) increase during the
competitive period.
b) Professional soccer players show an improved match activity and
express low level of fatigue during the match towards the end-of-season.
c) Professional soccer players, although submitted to high levels of stress
signalled by increased muscle damage and oxidative stress, seem to
possess an efficient capability to sustain the soccer season stressful
demands. In addition, the recovery period is related to a decrease in
markers of muscle damage and oxidative stress.
d) Players’ individual match playing time influences physical, hormonal and
oxidative-related parameters.
e) The interrelationship between lower limb muscle strength and soccer
specific neuromuscular parameters (sprint and jump ability) highlight the
importance of muscle strength and power training in soccer.
f) Professional players with high neuromuscular capabilities have lower
performance decrements in game physical parameters. These results
highlight the relevance of players’ neuromuscular function for physical
performance in the match.
g) Friendly-match and LIST performed by semi-professional professional
players did not differ regarding the observed muscle damage markers
and some neuromuscular parameters, although friendly-matches require
higher cardiac demand and induced higher changes on redox status,
adenine nucleotide metabolism and on lymphocyte counts than LIST.

384
h) A high-level official match increases catabolic hormonal environment,
muscle damage and inflammation, as well as oxidative stress markers at
24-h and 48-h of recovery period. Regardless these alterations,
neuromuscular performance of professional players are affected to a
small extent and only until 24-h of the recovery period.
In summary, this dissertation presents a scenario regarding the functional and
biochemical changes induced by acute and chronic exposure of professional
soccer players to high-level training and competition. Moreover, highlights the
complexity of the established interactions between players’ game-physical
performance (GPP), GPP throughout the season and players physical fitness
(PPF). In fact, despite PPF shown to be related with GFP, a direct link between
an in-season higher GPP and PPF could not be established. In fact, a higher
GPP towards end-of-season may not necessarily be coincident with a higher
PPF (e.g. expressed both by performance and biochemical measurements) in
the same time point. Nevertheless, data suggest that neuromuscular
capabilities play an importance role in high-level soccer performance and that
individual playing time may influence the former as well as hormonal and
oxidative parameters of professional soccer players.

385
References

386

387
References
Aagaard, P., & Andersen, J. L. (2010). Effects of strength training on endurance
capacity in top-level endurance athletes. Scandinavian Journal of
Medicine & Science in Sports, 20, 39-47.
Abt, G., & Lovell, R. (2009). The use of individualized speed and intensity
thresholds for determining the distance run at high-intensity in
professional soccer. J Sports Sci, 27(9), 893-898.
Adlercreutz, H., Harkonen, M., Kuoppasalmi, K., Naveri, H., Huhtaniemi, I.,
Tikkanen, H., et al. (1986). Effect of training on plasma anabolic and
catabolic steroid hormones and their response during physical exercise.
Int J Sports Med, 7 Suppl 1, 27-28.
Andersson, H., Bohn, S. K., Raastad, T., Paulsen, G., Blomhoff, R., & Kadi, F.
(2010a). Differences in the inflammatory plasma cytokine response
following two elite female soccer games separated by a 72-h recovery.
Scand J Med Sci Sports, 20(5), 740-747.
Andersson, H., Karlsen, A., Blomhoff, R., Raastad, T., & Kadi, F. (2010b).
Plasma antioxidant responses and oxidative stress following a soccer
game in elite female players. Scand J Med Sci Sports, 20(4), 600-608.
Andersson, H., Karlsen, A., Blomhoff, R., Raastad, T., & Kadi, F. (2010c).
Active recovery training does not affect the antioxidant response to
soccer games in elite female players. Br J Nutr, 1-8.
Andersson, H., Raastad, T., Nilsson, J., Paulsen, G., Garthe, I., & Kadi, F.
(2008). Neuromuscular fatigue and recovery in elite female soccer:
effects of active recovery. Med Sci Sports Exerc, 40(2), 372-380.
Arent, S. M., Pellegrino, J. K., Williams, C. A., Difabio, D. A., & Greenwood, J.
C. (2010). Nutritional supplementation, performance, and oxidative stress
in college soccer players. J Strength Cond Res, 24(4), 1117-1124.
Armstrong, R. B. (1984). Mechanisms of exercise-induced delayed onset
muscular soreness: a brief review. Med Sci Sports Exerc, 16(6), 529-
538.

388
Arnason, A., Andersen, T. E., Holme, I., Engebretsen, L., & Bahr, R. (2008).
Prevention of hamstring strains in elite soccer: an intervention study.
Scand J Med Sci Sports, 18(1), 40-48.
Arnason, A., Sigurdsson, S. B., Gudmundsson, A., Holme, I., Engebretsen, L.,
& Bahr, R. (2004). Physical fitness, injuries, and team performance in
soccer. Med Sci Sports Exerc, 36(2), 278-285.
Ascensao, A., Leite, M., Rebelo, A. N., Magalhaes, S., & Magalhaes, J. (2011).
Effects of cold water immersion on the recovery of physical performance
and muscle damage following a one-off soccer match. J Sports Sci,
29(3), 217-225.
Ascensao, A., Rebelo, A., Oliveira, E., Marques, F., Pereira, L., & Magalhaes, J.
(2008). Biochemical impact of a soccer match - analysis of oxidative
stress and muscle damage markers throughout recovery. Clin Biochem,
41(10-11), 841-851.
Aughey, R. J. (2010). Australian football player work rate: evidence of fatigue
and pacing? Int J Sports Physiol Perform, 5(3), 394-405.
Aziz, A., Tan, F., & Teh, K. (2005). Variation in selected fitness attributes of
professional soccer players during a league season. In T. Reilly, D.
Araújo & J. Cabri (Eds.), Science and Football V (pp. 134-138):
London/New York: E and FN Spon.
Banfi, G., Malavazos, A., Iorio, E., Dolci, A., Doneda, L., Verna, R., et al. (2006).
Plasma oxidative stress biomarkers, nitric oxide and heat shock protein
70 in trained elite soccer players. Eur J Appl Physiol, 96(5), 483-486.
Bangsbo, J. (1994). The physiology of soccer - with special reference to intense
intermittent exrcise. Acta Physiol Scand., 150, suppl. 615.
Bangsbo, J., Iaia, F. M., & Krustrup, P. (2007). Metabolic response and fatigue
in soccer. Int J Sports Physiol Perform, 2(2), 111-127.
Bangsbo, J., Iaia, F. M., & Krustrup, P. (2008). The Yo-Yo intermittent recovery
test : a useful tool for evaluation of physical performance in intermittent
sports. Sports Med, 38(1), 37-51.

389
Bangsbo, J., Mohr, M., & Krustrup, P. (2006). Physical and metabolic demands
of training and match-play in the elite football player. J Sports Sci, 24(7),
665-674.
Bangsbo, J., Norregaard, L., & Thorso, F. (1991). Activity profile of competition
soccer. Can J Sport Sci, 16(2), 110-116.
Barclay, J. K., & Hansel, M. (1991). Free radicals may contribute to oxidative
skeletal muscle fatigue. Can J Physiol Pharmacol, 69(2), 279-284.
Beelen, M., Burke, L. M., Gibala, M. J., & van Loon, L. J. (2010). Nutritional
strategies to promote postexercise recovery. Int J Sport Nutr Exerc
Metab, 20(6), 515-532.
Billat, L. V., & Koralsztein, J. P. (1996). Significance of the velocity at VO2max
and time to exhaustion at this velocity. Sports Med, 22(2), 90-108.
Bishop, P. A., Jones, E., & Woods, A. K. (2008). Recovery from training: a brief
review. J Strength Cond Res, 22(3), 1015-1024.
Bloomfield, J., Polman, R., & O`Donoghue, P. (2007). Physical demands of
different positions in FA Premier League soccer. Journal of Sports
Science and Medicine, 6, 63-70.
Bogdanis, G. C., Papaspyrou, A., Souglis, A., Theos, A., Sotiropoulos, A., &
Maridaki, M. (2009). Effects of hypertrophy and a maximal strength
training programme on speed, force and power of soccer players. In T.
Reilly & F. Korkusuz (Eds.), Science and Football VI. The proceedings of
the sixth world congress on science and football. (pp. 290-295):
Routledge.
Bogdanis, G. C., Papaspyrou, A., Souglis, A. G., Theos, A., Sotiropoulos, A., &
Maridaki, M. (2011). Effects of Two Different Half-Squat Training
Programs on Fatigue During Repeated Cycling Sprints in Soccer
Players. J Strength Cond Res.
Bottas, R., Linnamo, V., Nicol, C., & Komi, P. V. (2005). Repeated maximal
eccentric actions causes long-lasting disturbances in movement control.
Eur J Appl Physiol, 94(1-2), 62-69.

390
Bradley, P. S., Mascio, M. D., Bangsbo, J., & Krustrup, P. (2011). The maximal
and sub-maximal versions of the Yo-Yo intermittent endurance test level
2 are simply reproducible, sensitive and valid. Eur J Appl Physiol.
Bradley, P. S., Mohr, M., Bendiksen, M., Randers, M. B., Flindt, M., Barnes, C.,
et al. (2010). Sub-maximal and maximal Yo-Yo intermittent endurance
test level 2: heart rate response, reproducibility and application to elite
soccer. Eur J Appl Physiol.
Bradley, P. S., Sheldon, W., Wooster, B., Olsen, P., Boanas, P., & Krustrup, P.
(2009). High-intensity running in English FA Premier League soccer
matches. J Sports Sci, 27(2), 159-168.
Brady, K., Maile, A., & Ewing, B. (1997). An investigation into the fitness of
professional soccer players over two seasons. In T. Reilly, J. Bangsbo &
M. Hughes (Eds.), Science and Footbal III (pp. 118-222): London: E &
FN Spon.
Brancaccio, P., Maffulli, N., & Limongelli, F. M. (2007). Creatine kinase
monitoring in sport medicine. Br Med Bull, 81-82, 209-230.
Brites, F. D., Evelson, P. A., Christiansen, M. G., Nicol, M. F., Basilico, M. J.,
Wikinski, R. W., et al. (1999). Soccer players under regular training show
oxidative stress but an improved plasma antioxidant status. Clin Sci
(Lond), 96(4), 381-385.
Brown, S. J., & Donnelly, A. (2011). Changes in human skeletal muscle length
during stimulated eccentric muscle actions. J Physiol Sci, 61(1), 31-36.
Brughelli, M., Cronin, J., Levin, G., & Chaouachi, A. (2008). Understanding
change of direction ability in sport: a review of resistance training studies.
Sports Med, 38(12), 1045-1063.
Buchheit, M., Bishop, D., Haydar, B., Nakamura, F. Y., & Ahmaidi, S. (2010a).
Physiological responses to shuttle repeated-sprint running. Int J Sports
Med, 31(6), 402-409.
Buchheit, M., Mendez-Villanueva, A., Delhomel, G., Brughelli, M., & Ahmaidi, S.
(2010b). Improving Repeated Sprint Ability in Young Elite Soccer
Players: Repeated Shuttle Sprints Vs. Explosive Strength Training. J
Strength Cond Res.

391
Buettner, G. R. (1993). The pecking order of free radicals and antioxidants: lipid
peroxidation, alpha-tocopherol, and ascorbate. Arch Biochem Biophys,
300(2), 535-543.
Burke, L. M. (2010). Fueling strategies to optimize performance: training high or
training low? Scandinavian Journal of Medicine & Science in Sports, 20,
48-58.
Burke, L. M., Loucks, A. B., & Broad, N. (2006). Energy and carbohydrate for
training and recovery. J Sports Sci, 24(7), 675-685.
Byrne, C., Twist, C., & Eston, R. (2004). Neuromuscular function after exercise-
induced muscle damage: theoretical and applied implications. Sports
Med, 34(1), 49-69.
Caldwell, B. P., & Peters, D. M. (2009). Seasonal variation in physiological
fitness of a semiprofessional soccer team. J Strength Cond Res, 23(5),
1370-1377.
Carling, C., & Bloomfield, J. (2010a). The effect of an early dismissal on player
work-rate in a professional soccer match. J Sci Med Sport, 13, 126-1283
Carling, C., Le Gall, F., & Dupont, G. (2011). Are physical performance and
injury risk in a professional soccer team in match-play affected over a
prolonged period of fixture congestion? Int J Sports Med, 33, 36-42
Carling, C., & Orhant, E. (2010b). Variation in body composition in professional
soccer players: interseasonal and intraseasonal changes and the effects
of exposure time and player position. J Strength Cond Res, 24(5), 1332-
1339.
Carling, C., Williams, A., & Reilly, T. (2005). Handbook of soccer match
analysis: a systematic approach to improving performance. London:
Routledge.
Casajus, J. A. (2001). Seasonal variation in fitness variables in professional
soccer players. J Sports Med Phys Fitness, 41(4), 463-469.
Castagna, C., Impellizzeri, F., Chamari, K., Carlomagno, D., & Rampinini, E.
(2006). Aerobic fitness and Yo-Yo continous and intermittent tests
performances in soccer players: A correlation study. J Strength Cond
Res, 20(2), 320-325.

392
Cazzola, R., Russo-Volpe, S., Cervato, G., & Cestaro, B. (2003). Biochemical
assessments of oxidative stress, erythrocyte membrane fluidity and
antioxidant status in professional soccer players and sedentary controls.
Eur J Clin Invest, 33(10), 924-930.
Chelly, M. S., Fathloun, M., Cherif, N., Ben Amar, M., Tabka, Z., & Van Praagh,
E. (2009). Effects of a back squat training program on leg power, jump,
and sprint performances in junior soccer players. J Strength Cond Res,
23(8), 2241-2249.
Christensen, P. M., Krustrup, P., Gunnarsson, T. P., Kiilerich, K., Nybo, L., &
Bangsbo, J. (2011). VO2 Kinetics and Performance in Soccer Players
after Intense Training and Inactivity. Med Sci Sports Exerc.
Clark, N., Edwards, A. M., Morton, R., & Butterly, J. (2008). Season-to-season
variation of physiological fitness within a squad of professional male
soccer players. Journal of Sports Science and Medicine, 7, 157-165.
Clark, R. A. (2009). The effect of training status on inter-limb joint stiffness
regulation during repeated maximal sprints. J Sci Med Sport, 12(3), 406-
410.
Clarkson, P. M., & Tremblay, I. (1988). Exercise-induced muscle damage,
repair, and adaptation in humans. J Appl Physiol, 65(1), 1-6.
Cometti, G., Maffiuletti, N. A., Pousson, M., Chatard, J. C., & Maffulli, N. (2001).
Isokinetic Strength and Anaerobic Power of Elite, Subelite and Amateur
Soccer Players. Int J Sports Med, 22, 45-51.
Cormack, S. J., Newton, R. U., & McGuigan, M. R. (2008). Neuromuscular and
endocrine responses of elite players to an Australian rules football
match. Int J Sports Physiol Perform, 3(3), 359-374.
Cormack, S. J., Newton, R. U., McGuigan, M. R., & Cormie, P. (2008).
Neuromuscular and endocrine responses of elite players during an
Australian rules football season. Int J Sports Physiol Perform, 3(3), 439-
453.
Creer, A. R., Ricard, M. D., Conlee, R. K., Hoyt, G. L., & Parcell, A. C. (2004).
Neural, metabolic, and performance adaptations to four weeks of high

393
intensity sprint-interval training in trained cyclists. Int J Sports Med, 25(2),
92-98.
Croisier, J. L., Ganteaume, S., Binet, J., Genty, M., & Ferret, J. M. (2008).
Strength imbalances and prevention of hamstring injury in professional
soccer players: a prospective study. Am J Sports Med, 36(8), 1469-1475.
Croisier, J. L., Reveillon, V., Ferret, J. M., Cotte, T., Genty, M., Popovich, N., et
al. (2003). Isokinetic assassment of knee flexors and extensors in
professional soccer players. Isokinetics and Exercise Science, 11, 61-62.
Dauty, M., Potiron-Josse, M., & Rochcongar, P. (2003). Identification of
previous hamstring muscle injury by isokinetic concentric and eccentric
torque measurement in elite soccer player. Isokinetics and Exercise
Science, 11, 139-144.
Dauty, M., & Potiron Josse, M. (2004). Correlations and differences of
performance between soccer players, professionals, young players and
amateurs, from the 10-meter sprint test and knee isokinetic assessment.
Science & Sports, 19 75-79.
Dellal, A., Keller, D., Carling, C., Chaouachi, A., Wong del, P., & Chamari, K.
(2010). Physiologic effects of directional changes in intermittent exercise
in soccer players. J Strength Cond Res, 24(12), 3219-3226.
Di Salvo, V., Baron, R., Tschan, H., Calderon Montero, F. J., Bachi, N., &
Pigozzi, F. (2007). Performance characteristics according to playing
position in elite soccer. Int J Sports Med, 28, 222-227.
Dittrich, N., da Silva, J. F., Castagna, C., de Lucas, R. D., & Antonacci
Guglielmo, L. G. (2011). Validity of Carminatti's Test to Determine
Physiological Indices of Aerobic Power and Capacity in Soccer and
Futsal Players. J Strength Cond Res, 25(11), 3099-3106.
Drust, B., Atkinson, G., & Reilly, T. (2007). Future Perspectives in the
Evaluation of the Physiological Demands of Soccer. Sports Med, 37(9),
783-805.
Dupont, G., Akakpo, K., & Berthoin, S. (2004). The effect of in-season, high-
intensity interval training in soccer players. J Strength Cond Res, 18(3),
584-589.

394
Dupont, G., Millet, G. P., Guinhouya, C., & Berthoin, S. (2005). Relationship
between oxygen uptake kinetics and performance in repeated running
sprints. Eur J Appl Physiol, 95, 27-34.
Durandt, J., Tee, J. C., Prim, S. K., & Lambert, M. I. (2006). Physical fitness
components associated with performance in a multiple-sprint test. Int J
Sports Physiol Perform, 1(2), 150-160.
Duchateau, J., Semmler, J. G., & Enoka, R. M. (2006). Training adaptations in
the behavior of human motor units. J Appl Physiol, 101(6), 1766-1775.
Ebbeling, C. B., & Clarkson, P. M. (1989). Exercise-induced muscle damage
and adaptation. Sports Med, 7(4), 207-234.
Edwards, A. M., & Clark, N. A. (2006). Thermoregulatory observations in soccer
match play: professional and recreational level applications using an
intestinal pill system to measure core temperature. Br J Sports Med,
40(2), 133-138.
Edwards, A. M., Macfadyen, A. M., & Clark, N. (2003a). Lactate and ventilatory
thresholds reflect the training status of professional soccer players where
maximum aerobic power is unchanged. Journal of Sports Science and
Medicine, 2, 23-29.
Edwards, A. M., Macfadyen, A. M., & Clark, N. (2003b). Test performance
indicators from a single soccer specific fitness test differentiate between
highly trained and recreationally active soccer players. J Sports Med
Phys Fitness, 43(1), 14-20.
Edwards, A. M., & Noakes, T. D. (2009). Dehydration: cause of fatigue or sign
of pacing in elite soccer? Sports Med, 39(1), 1-13.
Fatouros, I. G., Chatzinikolaou, A., Douroudos, II, Nikolaidis, M. G., Kyparos, A.,
Margonis, K., et al. (2010). Time-course of changes in oxidative stress
and antioxidant status responses following a soccer game. J Strength
Cond Res, 24(12), 3278-3286.
Faude, O., Kellmann, M., Ammann, T., Schnittker, R., & Meyer, T. (2011).
Seasonal changes in stress indicators in high level football. Int J Sports
Med, 32(4), 259-265.

395
Ferrari Bravo, D., Impellizzeri, F. M., Rampinini, E., Castagna, C., Bishop, D., &
Wisloff, U. (2008). Sprint vs. interval training in football. Int J Sports Med,
29(8), 668-674.
Filaire, E., Bernain, X., Sagnol, M., & Lac, G. (2001). Preliminary results on
mood state, salivary testosterone:cortisol ratio and team performance in
a professional soccer team. Eur J Appl Physiol, 86(2), 179-184.
Filaire, E., Lac, G., & Pequignot, J. M. (2003). Biological, hormonal, and
psychological parameters in professional soccer players throughout a
competitive season. Percept Mot Skills, 97(3 Pt 2), 1061-1072.
Finaud, J., Lac, G., & Filaire, E. (2006). Oxidative stress : relationship with
exercise and training. Sports Med, 36(4), 327-358.
Fisher-Wellman, K., & Bloomer, R. J. (2009). Acute exercise and oxidative
stress: a 30 year history. Dyn Med, 8, 1.
Foster, C., & Lucia, A. (2007). Running economy : the forgotten factor in elite
performance. Sports Med, 37(4-5), 316-319.
Friden, J., & Lieber, R. L. (2001). Eccentric exercise-induced injuries to
contractile and cytoskeletal muscle fibre components. Acta Physiol
Scand, 171(3), 321-326.
Gabriel, D. A., Kamen, G., & Frost, G. (2006). Neural adaptations to resistive
exercise: mechanisms and recommendations for training practices.
Sports Med, 36(2), 133-149.
Gaeta, L. M., Tozzi, G., Pastore, A., Federici, G., Bertini, E., & Piemonte, F.
(2002). Determination of superoxide dismutase and glutathione
peroxidase activities in blood of healthy pediatric subjects. Clin Chim
Acta, 322(1-2), 117-120.
Garry, J. P., & McShane, J. M. (2000). Postcompetition elevation of muscle
enzyme levels in professional football players. MedGenMed, 2(1), E4.
Gorostiaga, E. M., Granados, C., Ibanez, J., Gonzalez-Badillo, J. J., &
Izquierdo, M. (2006). Effects of an entire season on physical fitness
changes in elite male handball players. Med Sci Sports Exerc, 38(2),
357-366.

396
Gorostiaga, E. M., Izquierdo, M., Ruesta, M., Iribarren, J., Gonzalez-Badillo, J.
J., & Ibanez, J. (2004). Strength training effects on physical performance
and serum hormones in young soccer players. Eur J Appl Physiol, 91(5-
6), 698-707.
Granados, C., Izquierdo, M., Ibanez, J., Ruesta, M., & Gorostiaga, E. M. (2008).
Effects of an entire season on physical fitness in elite female handball
players. Med Sci Sports Exerc, 40(2), 351-361.
Greig, M. (2008). The influence of soccer-specific fatigue on peak isokinetic
torque production of the knee flexors and extensors. Am J Sports Med,
36(7), 1403-1409.
Hakkinen, K., Pakarinen, A., Alen, M., Kauhanen, H., & Komi, P. V. (1988).
Neuromuscular and hormonal adaptations in athletes to strength training
in two years. J Appl Physiol, 65(6), 2406-2412.
Handziski, Z., Maleska, V., Petrovska, S., Nikolik, S., Mickoska, E., Dalip, M., et
al. (2006). The changes of ACTH, cortisol, testosterone and
testosterone/cortisol ratio in professional soccer players during a
competition half-season. Bratisl Lek Listy, 107(6-7), 259-263.
Haritodinis, K., Koutlianos, N., Koudi, E., Haritonidou, M., & Deligiannis, A.
(2004). Seasonal variation of aerobic capacity in elite soccer, basketball
and volleyball players. Journal of Human Performance, 46, 289-302.
Harris, N., Cronin, J., & Keogh, J. (2007). Contraction force specificity and its
relationship to functional performance. J Sports Sci, 25(2), 201-212.
Hayes, L. D., Bickerstaff, G. F., & Baker, J. S. (2010). Interactions of cortisol,
testosterone, and resistance training: influence of circadian rhythms.
Chronobiol Int, 27(4), 675-705.
Helgerud, J., Engen, L. C., Wisloff, U., & Hoff, J. (2001). Aerobic endurance
training improves soccer performance. Med Sci Sports Exerc, 33(11),
1925-1931.
Helgerud, J., Kemi, O. J., & Hoff, J. (2003). Pre-season concurrent strength and
endurance development in elite soccer players. . In J. Hoff & J. Helgerud
(Eds.), Football (soccer): New developments in physical training research
(pp. 55-66). Trondheim,: NTNU.

397
Heller, J., Procházka, L., Bunc, V., Dlouhá, R., & Novotný, J. (1992). Functional
capacity in top league football players during the competitive season. J
Sports Sci(10), 152.
Hill-Haas, S. V., Dawson, B., Impellizzeri, F. M., & Coutts, A. J. (2011).
Physiology of small-sided games training in football: a systematic review.
Sports Med, 41(3), 199-220.
Hoff, J. (2005). Training and testing physical capacities for elite soccer players.
J Sports Sci, 23(6), 573-582.
Hoff, J., & Helgerud, J. (2004). Endurance and strength training for soccer
players: physiological considerations. Sports Med, 34(3), 165-180.
Hoffman, J. R., Kang, J., Ratamess, N. A., & Faigenbaum, A. D. (2005).
Biochemical and hormonal responses during an intercollegiate football
season. Med Sci Sports Exerc, 37(7), 1237-1241.
Iaia, F. M., Rampinini, E., & Bangsbo, J. (2009a). High-intensity training in
football. Int J Sports Physiol Perform, 4(3), 291-306.
Iaia, F. M., Rostgaard, T., Krustrup, P., & Bangsbo, J. (2009b). Seasonal
changes in intermittent exercise perfromance of soccer players evaluated
by the Yo-Yo intermittent recovery test level 2. In T. Reilly & F. Korkusuz
(Eds.), Science and Football VI. The proceedings of the sixth world
congress on science anf football (pp. 357-359): Routledge.
Impellizzeri, F. M., Marcora, S. M., Castagna, C., Reilly, T., Sassi, A., Iaia, F.
M., et al. (2006). Physiological and performance effects of generic versus
specific aerobic training in soccer players. Int J Sports Med, 27(6), 483-
492.
Impellizzeri, F. M., Rampinini, E., Castagna, C., Bishop, D., Ferrari Bravo, D.,
Tibaudi, A., et al. (2008). Validity of a repeated-sprint test for football. Int
J Sports Med, 29(11), 899-905.
Impellizzeri, F. M., Rampinini, E., & Marcora, S. M. (2005). Physiological
assessment of aerobic training in soccer. J Sports Sci, 23(6), 583-592.
Ispirlidis, I., Fatouros, I. G., Jamurtas, A. Z., Nikolaidis, M. G., Michailidis, I.,
Douroudos, I., et al. (2008). Time-course of changes in inflammatory and
398
performance responses following a soccer game. Clin J Sport Med,
18(5), 423-431.
Jacobs, I., Westlin, N., Karlsson, J., Rasmusson, M., & Houghton, B. (1982).
Muscle glycogen and diet in elite soccer players. Eur J Appl Physiol
Occup Physiol, 48(3), 297-302.
Jacobs, R., Bobbert, M. F., & van Ingen Schenau, G. J. (1993). Function of
mono- and biarticular muscles in running. Med Sci Sports Exerc, 25(10),
1163-1173.
Jensen, J., Randers, M., Krustrup, P., & Bangsbo, J. (2009). Intermittent high-
intensity drills improve in-seasonal performance of elite soccer players.
In T. Reilly & F. Korkusuz (Eds.), Science and Football VI. The
procedings of the Sixth World Congress on Science and Football (pp.
296-301): Routledge.
Kalapotharakos, V. I., Ziogas, G., & Tokmakidis, S. P. (2011). Seasonal Aerobic
Performance Variations in Elite Soccer Players. J Strength Cond Res.
Kanter, M. (1995). Free radicals and exercise: effects of nutritional antioxidant
supplementation. Exerc Sport Sci Rev, 23, 375-397.
Karlsson, H. (1969). kolhydratomsarting under en fotbollsmatch. (No. 6).
Stockholm: Department of Phisiology III.
Kawabata, Y., Senda, M., Oka, T., Yagata, Y., Takahara, Y., Nagashima, H., et
al. (2000). Measurement of fatigue in knee flexor and extensor muscles.
Acta Med Okayama, 54(2), 85-90.
Kotzamanidis, C., Chatzopoulos, D., Michailidis, C., Papaiakovou, G., &
Patikas, D. (2005). The effect of a combined high-intensity strength and
speed training program on the running and jumping ability of soccer
players. J Strength Cond Res, 19(2), 369-375.
Kraemer, W. J., French, D. N., Paxton, N. J., Hakkinen, K., Volek, J. S.,
Sebastianelli, W. J., et al. (2004). Changes in exercise performance and
hormonal concentrations over a big ten soccer season in starters and
nonstarters. J Strength Cond Res, 18(1), 121-128.
399
Kraemer, W. J., & Ratamess, N. A. (2005). Hormonal responses and
adaptations to resistance exercise and training. Sports Med, 35(4), 339-
361.
Kraemer, W. J., Staron, R. S., Hagerman, F. C., Hikida, R. S., Fry, A. C.,
Gordon, S. E., et al. (1998). The effects of short-term resistance training
on endocrine function in men and women. Eur J Appl Physiol Occup
Physiol, 78(1), 69-76.
Krustrup, P., Mohr, M., Amstrup, T., Rysgaard, T., Johansen, J., Steensberg,
A., et al. (2003). The yo-yo intermittent recovery test: physiological
response, reliability, and validity. Med Sci Sports Exerc, 35(4), 697-705.
Krustrup, P., Mohr, M., Ellingsgaard, H., & Bangsbo, J. (2005). Physical
Demands during an Elite Female Soccer Game: Importance of Training
Status. Medicine & Science in Sports & Exercise, 37(7), 1242-1248..
Krustrup, P., Mohr, M., Nybo, L., Jensen, J. M., Nielsen, J. J., & Bangsbo, J.
(2006a). The Yo-Yo IR2 test: physiological response, reliability, and
application to elite soccer. Med Sci Sports Exerc, 38(9), 1666-1673.
Krustrup, P., Mohr, M., Steensberg, A., Bencke, J., Kjaer, M., & Bangsbo, J.
(2006b). Muscle and blood metabolites during a soccer game:
implications for sprint performance. Med Sci Sports Exerc, 38(6), 1165-
1174.
Krustrup, P., Ortenblad, N., Nielsen, J., Nybo, L., Gunnarsson, T. P., Iaia, F. M.,
et al. (2011). Maximal voluntary contraction force, SR function and
glycogen resynthesis during the first 72 h after a high-level competitive
soccer game. Eur J Appl Physiol.
Lees, A., & Nolan, L. (1998). The biomechanics of soccer: a review. J Sports
Sci, 16(3), 211-234.
Little, T., & Williams, A. G. (2005). Specificity of acceleration, maximum speed,
and agility in professional soccer players. J Strength Cond Res, 19(1),
76-78.
Lopez-Segovia, M., Palao Andres, J. M., & Gonzalez-Badillo, J. J. (2010). Effect
of 4 months of training on aerobic power, strength, and acceleration in
two under-19 soccer teams. J Strength Cond Res, 24(10), 2705-2714.
400
Magal, M., Smith, R. T., Dyer, J. J., & Hoffman, J. R. (2009). Seasonal variation
in physical performance-related variables in male NCAA Division III
soccer players. J Strength Cond Res, 23(9), 2555-2559.
Magalhaes, J., Ascensao, A., Marques, F., Soares, J. M., Ferreira, R.,
Neuparth, M. J., et al. (2005). Effect of a high-altitude expedition to a
Himalayan peak (Pumori, 7,161 m) on plasma and erythrocyte
antioxidant profile. Eur J Appl Physiol, 93(5-6), 726-732.
Magalhães, J., Oliveira, J., Ascensao, A., & Soares, J. (2004). Concentric
quadriceps and hamstrings isokinetic strength in volleyball and soccer
players. J Sports Med Phys Fitness, 44(2), 119-125.
Malliou, P., Ispirlidis, I., Beneka, A., Taxildaris, K., & Godolias, G. (2003).
Vertical jump and knee extensors isokinetic performance in professional
soccer players related to the phase of the training period. Isokinetics and
Exercise Science, 11, 165-169.
Malm, C. (2001). Exercise-induced muscle damage and inflammation: fact or
fiction? Acta Physiol Scand, 171(3), 233-239.
Malm, C., Ekblom, O., & Ekblom, B. (2004a). Immune system alteration in
response to increased physical training during a five day soccer training
camp. Int J Sports Med, 25(6), 471-476.
Malm, C., Ekblom, O., & Ekblom, B. (2004b). Immune system alteration in
response to two consecutive soccer games. Acta Physiol Scand, 180(2),
143-155.
Margonis, K., Fatouros, I. G., Jamurtas, A. Z., Nikolaidis, M. G., Douroudos, I.,
Chatzinikolaou, A., et al. (2007). Oxidative stress biomarkers responses
to physical overtraining: implications for diagnosis. Free Radic Biol Med,
43(6), 901-910.
Martinez, A. C., Seco Calvo, J., Tur Mari, J. A., Abecia Inchaurregui, L. C.,
Orella, E. E., & Biescas, A. P. (2010). Testosterone and cortisol changes
in professional basketball players through a season competition. J
Strength Cond Res, 24(4), 1102-1108.

401
Martinovic, J., Dopsaj, V., Dopsaj, M. J., Kotur-Stevuljevic, J., Vujovic, A.,
Stefanovic, A., et al. (2009). Long-term effects of oxidative stress in
volleyball players. Int J Sports Med, 30(12), 851-856.
Maxwell, J. H., & Bloor, C. M. (1981). Effects of conditioning on exertional
rhabdomyolysis and serum creatine kinase after severe exercise.
Enzyme, 26(4), 177-181.
Mazon, J., Gastaldi, A., Di Sacco, T., Cozza, I., Dutra, S., & Souza, H. (2011).
Effects of training periodization on cardiac autonomic modulation and
endogenous stress markers in volleyball players. Scand J Med Sci
Sports.
McHugh, M. P. (2003). Recent advances in the understanding of the repeated
bout effect: the protective effect against muscle damage from a single
bout of eccentric exercise. Scand J Med Sci Sports, 13(2), 88-97.
McHugh, M. P., & Tetro, D. T. (2003). Changes in the relationship between joint
angle and torque production associated with the repeated bout effect. J
Sports Sci, 21(11), 927-932.
McLellan, C. P., Lovell, D. I., & Gass, G. C. (2010). Creatine kinase and
endocrine responses of elite players pre, during, and post rugby league
match play. J Strength Cond Res, 24(11), 2908-2919.
McMaster, W. C., & Walter, M. (1978). Injuries in soccer. Am J Sports Med,
6(6), 354-357.
McMillan, K., Helgerud, J., Macdonald, R., & Hoff, J. (2005). Physiological
adaptations to soccer specific endurance training in professional youth
soccer players. Br J Sports Med, 39(5), 273-277.
Meister, S., Faude, O., Ammann, T., Schnittker, R., & Meyer, T. (2011).
Indicators for high physical strain and overload in elite football players.
Scand J Med Sci Sports.
Mercer, T. H., Gleeson, N. P., & Mitchell, J. (1997). Fitness profiles of
professional soccer players before and after pre-season conditioning. In
T. Reilly, J. Bangsbo & M. Hughes (Eds.), Science and Footbal III (pp.
112-117): London: E & FN Spon.

402
Metaxas, T., Sendelides, T., Koutlianos, N., & Mandroukas, K. (2006). Seasonal
variation of aerobic performance in soccer players according to positional
role. J Sports Med Phys Fitness, 46(4), 520-525.
Michalczyk, M., Barbara Kłapcińska, B., Sadowska-Kręp, E., Jagsz, S., Pilis,
W., Szołtysek-Bołdys, I., et al. (2008). Evaluation of the Blood
Antioxidant Capacity in Two Selected Phases of the Training Cycle in
Professional Soccer Players. Journal of Human Kinetics, 19, 93-1008.
Mohr, M., Krustrup, P., & Bangsbo, J. (2002). Physiological characteristics and
exhaustive exercise performance of elite soccer players during a season.
Med Sci Sports Exerc, 34(5), S24.
Mohr, M., Krustrup, P., & Bangsbo, J. (2003). Match performance of high-
standard soccer players with special reference to development of fatigue.
J Sports Sci, 21(7), 519-528.
Mohr, M., Krustrup, P., & Bangsbo, J. (2005). Fatigue in soccer: a brief review.
J Sports Sci, 23(6), 593-599.
Mohr, M., Krustrup, P., Nybo, L., Nielsen, J. J., & Bangsbo, J. (2004). Muscle
temperature and sprint performance during soccer matches--beneficial
effect of re-warm-up at half-time. Scand J Med Sci Sports, 14(3), 156-
162.
Mujika, I., Santisteban, J., & Castagna, C. (2009). In-season effect of short-term
sprint and power training programs on elite junior soccer players. J
Strength Cond Res, 23(9), 2581-2587.
Mujika, I., Santisteban, J., Impellizzeri, F., & Castagna, C. (2008). Fitness
determinants of sucess in men`s and women`s football. J Sports Sci, 1-8.
Nakagami, Y., Takatsu, H., Okamoto, M., Terada, Y., & Maruta, K. (2009).
Relationship between team performance levels and serum SH (sulfhydryl
group) changes brought about by intensive athletic training summer
camp. Journal of Analytical Bio-Science, 32(5), 427-433.
Newham, D. J., Jones, D. A., & Clarkson, P. M. (1987). Repeated high-force
eccentric exercise: effects on muscle pain and damage. J Appl Physiol,
63(4), 1381-1386.

403
Nicholas, C. W., Nuttall, F. E., & Williams, C. (2000). The Loughborough
Intermittent Shuttle Test: a field test that simulates the activity pattern of
soccer. J Sports Sci, 18(2), 97-104.
Nicol, C., Avela, J., & Komi, P. V. (2006). The stretch-shortening cycle : a model
to study naturally occurring neuromuscular fatigue. Sports Med, 36(11),
977-999.
Nosaka, K., Newton, M., Sacco, P., Chapman, D., & Lavender, A. (2005).
Partial protection against muscle damage by eccentric actions at short
muscle lengths. Med Sci Sports Exerc, 37(5), 746-753.
Nummela, A. T., Paavolainen, L. M., Sharwood, K. A., Lambert, M. I., Noakes,
T. D., & Rusko, H. K. (2006). Neuromuscular factors determining 5 km
running performance and running economy in well-trained athletes. Eur J
Appl Physiol, 97(1), 1-8.
Nunez, V. M., Da Silva-Grigoletto, M. E., Castillo, E. F., Poblador, M. S., &
Lancho, J. L. (2008). Effects of training exercises for the development of
strength and endurance in soccer. J Strength Cond Res, 22(2), 518-524.
Odetoyinbo, K., Wooster, B., & Lane, A. (2009). The effect of a sucession of
matches on the activity profiles of professional soccer players. In T.
Reilly & F. Korkusuz (Eds.), Science and Football VI. The procedings of
the Sixth World Congress on Science and Football (pp. 105-110):
Routledge.
Oliveira, J. (2000). Evaluation of intermittent endurance in team sports.
Unpublished Doctoral Thesis, University of Porto, Porto.
Osgnach, C., Poser, S., Bernardini, R., Rinaldo, R., & di Prampero, P. E.
(2010). Energy cost and metabolic power in elite soccer: a new match
analysis approach. Med Sci Sports Exerc, 42(1), 170-178.
Ostojic, S. (2003). Seasonal alterations in body composition and sprint
performance of elite soccer players. J Exerc Physiol Online, 6(3), 24-27.
Paavolainen, L., Hakkinen, K., Hamalainen, I., Nummela, A., & Rusko, H.
(1999a). Explosive-strength training improves 5-km running time by
improving running economy and muscle power. J Appl Physiol, 86(5),
1527-1533.

404
Paavolainen, L. M., Nummela, A. T., & Rusko, H. K. (1999b). Neuromuscular
characteristics and muscle power as determinants of 5-km running
performance. Med Sci Sports Exerc, 31(1), 124-130.
Peake, J. M., Suzuki, K., Wilson, G., Hordern, M., Nosaka, K., Mackinnon, L., et
al. (2005). Exercise-induced muscle damage, plasma cytokines, and
markers of neutrophil activation. Med Sci Sports Exerc, 37(5), 737-745.
Petibois, C., Cazorla, G., Poortmans, J. R., & Deleris, G. (2002). Biochemical
aspects of overtraining in endurance sports: a review. Sports Med,
32(13), 867-878.
Philippou, A., Maridaki, M., Bogdanis, G., Halapas, A., & Koutsilieris, M. (2009).
Changes in the mechanical properties of human quadriceps muscle after
eccentric exercise. In Vivo, 23(5), 859-865.
Powers, S. K., & Jackson, M. J. (2008). Exercise-induced oxidative stress:
cellular mechanisms and impact on muscle force production. Physiol
Rev, 88(4), 1243-1276.
Powers, S. K., Ji, L. L., & Leeuwenburgh, C. (1999). Exercise training-induced
alterations in skeletal muscle antioxidant capacity: a brief review. Med
Sci Sports Exerc, 31(7), 987-997.
Prasartwuth, O., Allen, T. J., Butler, J. E., Gandevia, S. C., & Taylor, J. L.
(2006). Length-dependent changes in voluntary activation, maximum
voluntary torque and twitch responses after eccentric damage in
humans. J Physiol, 571(Pt 1), 243-252.
Rahnama, N., Less, A., & Reilly, T. (2005). Electromyography of selected lower-
limb muscles fatigued by exercise at the intensity of soccer match-play.
Journal of Electromyography and Kinesiology, 1-7.
Rahnama, N., Reilly, T., Lees, A., & Graham-Smith, P. (2003). Muscle fatigue
induced by exercise simulating the work rate of competitive soccer. J
Sports Sci, 21(11), 933-942.
Rampinini, E., Bishop, D., Marcora, S. M., Ferrari Bravo, D., Sassi, R., &
Impellizzeri, F. M. (2007a). Validity of simple field tests as indicators of
match-related physical performance in top-level professional soccer
players. Int J Sports Med, 28(3), 228-235.

405
Rampinini, E., Bosio, A., Ferraresi, I., Petruolo, A., Morelli, A., & Sassi, A.
(2011). Match-Related Fatigue in Soccer Players. Med Sci Sports Exerc.
Rampinini, E., Coutts, A. J., Castagna, C., Sassi, A., & Impellizzeri, F. (2007b).
Variation in top level soccer match performnance. Int J Sports Med, 28,
1018-1024.
Rampinini, E., Sassi, A., Azzalin, A., Castagna, C., Menaspa, P., Carlomagno,
D., et al. (2009a). Physiological determinants of Yo-Yo intermittent
recovery tests in male soccer players. Eur J Appl Physiol.
Rampinini, E., Sassi, A., Morelli, A., Mazzoni, S., Fanchini, M., & Coutts, A. J.
(2009b). Repeated-sprint ability in professional and amateur soccer
players. Appl Physiol Nutr Metab, 34(6), 1048-1054.
Randers, M., Rostgaard, T., & Krustrup, P. (2007). Physical match performance
and Yo-Yo IR2 test results of successful and unsuccessful football teams
in the Danish Premier League. Journal of Sports Science and Medicine,
6, 70-71.
Randers, M. B., Mujika, I., Hewitt, A., Santisteban, J., Bischoff, R., Solano, R.,
et al. (2010). Application of four different football match analysis systems:
a comparative study. J Sports Sci, 28(2), 171-182.
Raven, P., Gettman, L., Pollock, M., & Cooper, K. (1976). A physiological
evaluation of professional soccer players. Br J Sports Med, 109, 209-
216.
Rebelo, A. (1999). Studies of fatigue in soccer. Unpublished PhD thesis,
University of Porto, Porto.
Rebelo, A. N., Candeias, J. R., Fraga, M. M., Duarte, J. A., Soares, J. M.,
Magalhaes, C., et al. (1998a). The impact of soccer training on the
immune system. J Sports Med Phys Fitness, 38(3), 258-261.
Rebelo, A. N., & Soares, J. M. C. (1997). Endurance capacity of soccer players
pre-season and during the playing season. In T. Reilly, J. Bangsbo & M.
Hughes (Eds.), Science and footbal III (pp. 106-111): London: E & FN
Spon.

406
Rebelo, N., Krustrup, P., Soares, J., & Bangsbo, J. (1998b). Reduction in
intermittent exercise performance during a soccer match. Journal of
Sport Sciences, 16, 482-483.
Reid, M. B. (2001). Invited Review: redox modulation of skeletal muscle
contraction: what we know and what we don't. J Appl Physiol, 90(2), 724-
731.
Reilly, T., Drust, B., & Clarke, N. (2008). Muscle fatigue during football match-
play. Sports Med, 38(5), 357-367.
Reilly, T., & Ekblom, B. (2005). The use of recovery methods post-exercise. J
Sports Sci, 23(6), 619-627.
Reilly, T., & Gilbourne, D. (2003). Science and football: a review of applied
research in the football codes. J Sports Sci, 21(9), 693-705.
Reilly, T., & Rigby, M. (2002). Effect of an warm-down following competitive
soccer. In W. Spinks, T. Reilly & J. Murphy (Eds.), In: Science and
Football IV (pp. 226-229): E&F. N. Spon, London/New York.
Reilly, T., & Thomas, V. (1976). A motion analysis of work rate in different
positional roles in pofessional football match-play. J Human Mov Stud.,
2, 87-97.
Reilly, T., Williams, A. M., Nevill, A., & Franks, A. (2000). A multidisciplinary
approach to talent identification in soccer. Journal of Sports Sciences,,
18, 695-702.
Reinke, S., Karhausen, T., Doehner, W., Taylor, W., Hottenrott, K., Duda, G. N.,
et al. (2009). The influence of recovery and training phases on body
composition, peripheral vascular function and immune system of
professional soccer players. PLoS ONE, 4(3), e4910.
Rienzi, E., Drust, B., Reilly, T., Carter, J. E., & Martin, A. (2000). Investigation of
anthropometric and work-rate profiles of elite South American
international soccer players. J Sports Med Phys Fitness, 40(2), 162-169.
Ronnestad, B. R., Kvamme, N. H., Sunde, A., & Raastad, T. (2008). Short-term
effects of strength and plyometric training on sprint and jump
performance in professional soccer players. J Strength Cond Res, 22(3),
773-780.
407
Salaj, S., & Markovic, G. (2011). Specificity of jumping, sprinting, and quick
change-of-direction motor abilities. J Strength Cond Res, 25(5), 1249-
1255.
Sangnier, S., & Tourny-Chollet, C. (2008). Study of the fatigue curve in
quadriceps and hamstrings of soccer players during isokinetic endurance
testing. J Strength Cond Res, 22(5), 1458-1467.
Sedano, S., Matheu, A., Redondo, J. C., & Cuadrado, G. (2011). Effects of
plyometric training on explosive strength, acceleration capacity and
kicking speed in young elite soccer players. J Sports Med Phys Fitness,
51(1), 50-58.
Semark, A., Noakes, T. D., St Clair Gibson, A., & Lambert, M. I. (1999). The
effect of a prophylactic dose of flurbiprofen on muscle soreness and
sprinting performance in trained subjects. J Sports Sci, 17(3), 197-203.
Shephard, R. J. (1999). Biology and medicine of soccer: an update. J Sports
Sci, 17(10), 757-786.
Silva, J. R. (2007). Fatigue and Recovery in Soccer: analysis of the
physiological and functional impact of the soccer game. Unpublished
Master Thesis, University of Porto.
Small, K., McNaughton, L., Greig, M., & Lovell, R. (2008). The effects of
multidirectional soccer-specific fatigue on markers of hamstring injury
risk. J Sci Med Sport.
Small, K., McNaughton, L. R., Greig, M., Lohkamp, M., & Lovell, R. (2009).
Soccer fatigue, sprinting and hamstring injury risk. Int J Sports Med,
30(8), 573-578.
Sotiropoulos, A., Travlos, A. K., Gissis, I., Souglis, A. G., & Grezios, A. (2009).
The effect of a 4-week training regimen on body fat and aerobic capacity
of professional soccer players during the transition period. J Strength
Cond Res, 23(6), 1697-1703.
Sporis, G., Jovanovic, M., Omrcen, D., & Matkovic, B. (2011). Can the official
soccer game be considered the most important contribution to player's
physical fitness level? J Sports Med Phys Fitness, 51(3), 374-380.

408
Sporis, G., Ruzic, L., & Leko, G. (2008). The anaerobic endurance of elite
soccer players improved after a high-intensity training intervention in the
8-week conditioning program. J Strength Cond Res, 22(2), 559-566.
Stolen, T., Chamari, K., Castagna, C., & Wisloff, U. (2005). Physiology of
soccer: an update. Sports Med, 35(6), 501-536.
Svensson, M., & Drust, B. (2005). Testing soccer players. J Sports Sci, 23(6),
601-618.
Teague, B., & Schwane, J. (1995). Effect of intermittent eccentric contractions
on symptoms of muscle microinjury. Medicine and Science in Sports and
Exercise, 27(10), 1378-1384.
Teixeira, V., Valente, H., Casal, S., Pereira, L., Marques, F., & Moreira, P.
(2009). Antioxidant status, oxidative stress, and damage in elite kayakers
after 1 year of training and competition in 2 seasons. Appl Physiol Nutr
Metab, 34(4), 716-724.
Thomas, V., & Reilly, T. (1979). Fitness assessment of English league soccer
players through the competitive season. Br J Sports Med, 13(3), 103-
109.
Thompson, D., Nicholas, C. W., & Williams, C. (1999). Muscular soreness
following prolonged intermittent high-intensity shuttle running. J Sports
Sci, 17(5), 387-395.
Tomlin, D. L., & Wenger, H. A. (2001). The relationship between aerobic fitness
and recovery from high intensity intermittent exercise. Sports Med, 31(1),
1-11.
Twist, C., & Eston, R. (2005). The effects of exercise-induced muscle damage
on maximal intensity intermittent exercise performance. Eur J Appl
Physiol, 94, 652-658.
Urhausen, A., & Kindermann, W. (2002). Diagnosis of overtraining: what tools
do we have? Sports Med, 32(2), 95-102.
Vigne, G., Gaudino, C., Rogowski, I., Alloatti, G., & Hautier, C. (2010). Activity
profile in elite Italian soccer team. Int J Sports Med, 31(5), 304-310.
Vina, J., Gomez-Cabrera, M. C., Lloret, A., Marquez, R., Minana, J. B.,
Pallardo, F. V., et al. (2000). Free radicals in exhaustive physical

409
exercise: mechanism of production, and protection by antioxidants.
IUBMB Life, 50(4-5), 271-277.
Wilson, J. M., & Flanagan, E. P. (2008). The role of elastic energy in activities
with high force and power requirements: a brief review. J Strength Cond
Res, 22(5), 1705-1715.
Wisloff, U., Castagna, C., Helgerud, J., Jones, R., & Hoff, J. (2004). Strong
correlation of maximal squat strength with sprint performance and
vertical jump height in elite soccer players. Br J Sports Med, 38(3), 285-
288.
Withers, T., Maricic, Z., & Wasilewski, S. (1982). Match analysis of Australian
professional soccer players. Journal of Hum Mov Stud(8), 159-176.
Wong, P. L., Chaouachi, A., Chamari, K., Dellal, A., & Wisloff, U. (2010). Effect
of preseason concurrent muscular strength and high-intensity interval
training in professional soccer players. J Strength Cond Res, 24(3), 653-
660.
Yu, J. G., Carlsson, L., & Thornell, L. E. (2004). Evidence for myofibril
remodeling as opposed to myofibril damage in human muscles with
DOMS: an ultrastructural and immunoelectron microscopic study.
Histochem Cell Biol, 121(3), 219-227.
Zehnder, M., Rico-Sanz, J., Kuhne, G., & Boutellier, U. (2001). Resynthesis of
muscle glycogen after soccer specific performance examined by 13C-
magnetic resonance spectroscopy in elite players. Eur J Appl Physiol,
84(5), 443-447.
Zoppi, C. C., Hohl, R., Silva, F. C., Lazarim, F. L., Neto, J. M., Stancanneli, M.,
et al. (2006). Vitamin C and e supplementation effects in professional
soccer players under regular training. J Int Soc Sports Nutr, 3, 37-44.

410

411
Appendix


INDIVIDUAL MATCH PLAYING TIME DURING THE
SEASON AFFECTS FITNESS-RELATED PARAMETERS
OF MALE PROFESSIONAL SOCCER PLAYERS
JOAO R. SILVA,1 JOSE F. MAGALHAES,2,5 ANTONIO A. ASCENSAO,2,5 EDUARDO M. OLIVEIRA,2
ANDRE F. SEABRA,3 AND ANTONIO N. REBELO1,4
1Department of Soccer, Faculty of Sport, University of Porto, Porto, Portugal; 2Department of Sports Biology, Faculty of Sport,University of Porto, Porto, Portugal; 3Department of Kinanthropometry, Faculty of Sport, University of Porto, Porto, Portugal;4Center of Research, Education, Innovation and Intervention in Sport (CIFI2D), Porto, Portugal; and 5Research Center inPhysical Activity, Health and Leisure (CIAFEL), Porto, Portugal
ABSTRACT
Silva, JR, Magalhaes, JF, Ascensao, AA, Oliveira, EM, Seabra, AF,
and Rebelo, AN. Individual match playing time during the season
affects fitness-related parameters of male professional soccer
players. J Strength Cond Res 25(10): 2729–2739, 2011—The
purpose of this study was to analyze the effects of an entire
season on physical fitness parameters (PFPs) in male pro-
fessional soccer players (N = 18). Performance in 5- and 30-m
sprint (T5 and T30), countermovement jump (CMJ), agility
(T-test), knee extensor (KE) and knee flexor (KF) isokinetic
strength, hamstrings/quadriceps strength ratio (H/Q) and
bilateral differences (BDs), and Yo-Yo intermittent endurance
test 2 (YYIE2) was evaluated in 4 moments (E1–E4) throughout
the season. Individual match playing time was quantified.
Significant improvements in CMJ and YYIE2 from E1 to E2
were observed (p , 0.05–0.01). The T30 improved from E2 to
E3 (p , 0.01). The CMJ decreased from E2 to E3 and E4, and
YYIE2 from E2 to E4 (p, 0.05). There were increments in the H/
Q ratio and Agility from E1 and E2 to E3 and E4 (p, 0.05–0.01).
Significant correlations were found in all evaluation points
between different PFPs and between changes in strength
parameters and agility, T5 and T30, CMJ, and YYIE2 (p ,
0.05–0.001). Influence of individual match playing time was
correlated to changes in T5 (E1 to E3; r = 20.705), KE
nondominant leg (KEND; E2 to E3; r = 0.786), and KF (E3 to E4;
r = 0.575–0.590). The interrelationship between muscle strength
(e.g., KE), sprint (e.g., T5), and jump abilities (CMJ) suggests the
importance of muscle strength and power training for soccer. This
study suggests that the systematic participation of the players in
soccer matches favors the increase and maintenance of soccer
players KE and KF muscle strength and sprint ability (T5). Thus,
given the unique demands of actual match play, coaches should
try to incorporate a competitive friendly match in the weekly
training cycle of nonstarter players.
KEY WORDS soccer season, training schedule, training status,
strength, muscle power, intermittent endurance
INTRODUCTION
The regular evaluation of soccer players’ physicalfitness using different tests is of special importancebecause players should be able to successfullycompete during 10–11 months.
Data from different studies suggest that elite soccer playerscover 8–13 km duringmatches (7) at a mean intensity close tothe anaerobic threshold (AT) (43). Moreover, energyexpenditure during match averages 70–75% of maximaloxygen consumption ( _VO2max) (7,38), which suggests thatperformance at the elite level may, in part, be determined byaerobic fitness (38). However, despite low- to medium-intensity running being the predominant activity pattern ofsoccer players, muscle power-based efforts, such as sprints,jumps, duels, and kicking, which are mainly dependent onmaximal strength and anaerobic power of the neuromuscularsystem (15), are essential factors to successfully perform insoccer. Therefore, it is consensual among the literature thatsoccer players’ performance is intimately related to theefficiency of different energy-related systems (43).During season, players are usually under prolonged physio-
logical stress, as has been described in different studies. Analysisof soccer player during the season has revealed signs of oxidative(9) and functional stress (7,25), and immune system (36) andhormonal stress-related imbalances (25). In such conditions, themaintenance or improvement of player performance is not onlydetermined by appropriate conditioning but also by the abilityof the body systems to recover and regenerate after multiple
Address correspondence to Joao R. Silva, [email protected].
25(10)/2729–2739
Journal of Strength and Conditioning ResearchÓ 2011 National Strength and Conditioning Association
VOLUME 25 | NUMBER 10 | OCTOBER 2011 | 2729
Copyright © National Strength and Conditioning Association Unauthorized reproduction of this article is prohibited.

stress stimuli (25). Therefore, to better understand the recoverypattern of the player under such demanding competitive stressconditions, a longitudinal coverage of physical performance inseveral time points throughout the season may be useful.However, there is a lack of studies concerning the effects of anentire season on physical fitness of professional players engagedin sport activities, including soccer. Most of the studies rely onparticular functional or physiological data such as anthropo-metrics (11,13,25,31), _VO2max and AT measurements(11,13,31,32), specific intermittent endurance test (6,36), exerciseperformance in incremental treadmill tests until exhaustion (11),muscle power through jump and sprint tests (4,11,30), andlower limb strength evaluated by isokinetic devices (30,31).Inconsistency has been revealed in the literature regarding theimpact of training and competition in the variation of certainfitness parameters (4,10,11,13,25,30–32). Moreover, theseobservations resulting from longitudinal scanning of playersfitness, and from the analysis of the short-term impact ofdiverse forms of strength (29,49) and endurance training(42,49), did not consider the influence of the cumulativeamount of competition playing time. A study performed byImpellizzeri et al. (23), wherein rating of perceived exertion(RPE) was used to quantify the internal training load (RPE-Tld), showed that in weeks comprising 2 official matches, theRPE-Tld can represent about 50% of total weekly trainingload decreasing to 25% in weeks with only 1 matchperformed. Hence, a possible determinant factor of physicalfitness over the season could be the cumulative amount ofmatch playing time, a subject scarcely explored. Therefore,the purposes of this study were to examine the impact of theseason in a group of fitness-related parameters and theassociation between theirchanges, considering the influ-ence of individual match play-ing time (IMPT).
METHODS
Experimental Approach to the
Problem
As presented in Figure 1, thedifferent physical tests were per-formed in the same order and inthe same period of the day on 4time points of a soccer season(10–11 months) as follows: first(E1)—before the soccer season;early July); second (E2)—end ofthe preseason period (earlyAugust); third (E3)—middle ofthe season (January); fourth(E4)—end of the competitiveseason (May).In each moment, players were
evaluated for basic anthropome-try, countermovement vertical
jump (CMJ), sprint and agility abilities, leg extensor and flexormaximal strength, and Yo-Yo intermittent endurance test 2(YYIE2). However, no YYIE2 data were collected at themidseason (E3) because of Club heavy match commitments atthat time. Additionally, the players’ individual time spent in thematches was recorded. The physical fitness measurementsthroughout different time points of the season allowed theanalysis of seasonal fitness alterations, the relationship betweenthe different fitness parameters, and the IMPTin physical fitness.The selected variables provide valid and reliable data for theevaluation of physical fitness parameters (PFPs), known to bedirectly (agility, sprint, jump, intermittent endurance) andindirectly (isokinetic strength parameters) related to soccerperformance.
Subjects
A group of 23 male professional players competing inthe Portuguese elite championship (rank 6 of the Union ofEuropean Football Associations) was initially involved in theprotocol. As a result of injuries (n = 2) and transferences to otherclubs (n = 3), 5 players were not considered in the analysis(n = 18; Table 1). Only players free from injury involved in thefull training schedules were tested. In accordance with the Clubpolicy, all soccer players underwent usual physical examinationin the beginning of the season (e.g., blood sample analyses, restelectrocardiogram, lung x- ray).The experimental protocol followed the Declaration of
Helsinki of the World Medical Association for research withhumans and was approved by the local Ethics Committee. Allparticipants were fully informed about the aims, experimentalprotocol, andprocedures andprovidedwritten informedconsent.
Figure 1. Season time line. E1 = evaluation moment 1 (before preseason); E2 = evaluation moment 2 (end of
preseason); E3 = evaluation moment 3 (midseason); E4 = evaluation moment 4 (end of season); YYIE2 = Yo-Yo
intermittent endurance test level 2; IS = isokinetic strength; CMJ = countermovement jump; T5 = 5-m sprint time;
T30 = 30-m sprint time; W = week; 8FM = 8 friendly matches; 1OM = 1 official match per week; 2OM = 2 official
matches per week; 1FM = 1 friendly match per week; 2FM = 2 friendly matches per week; 3FM = 3 friendly matches
per week.
2730 Journal of Strength and Conditioning Researchthe TM
Seasonal Variations in Physical Fitness
Copyright © National Strength and Conditioning Association Unauthorized reproduction of this article is prohibited.
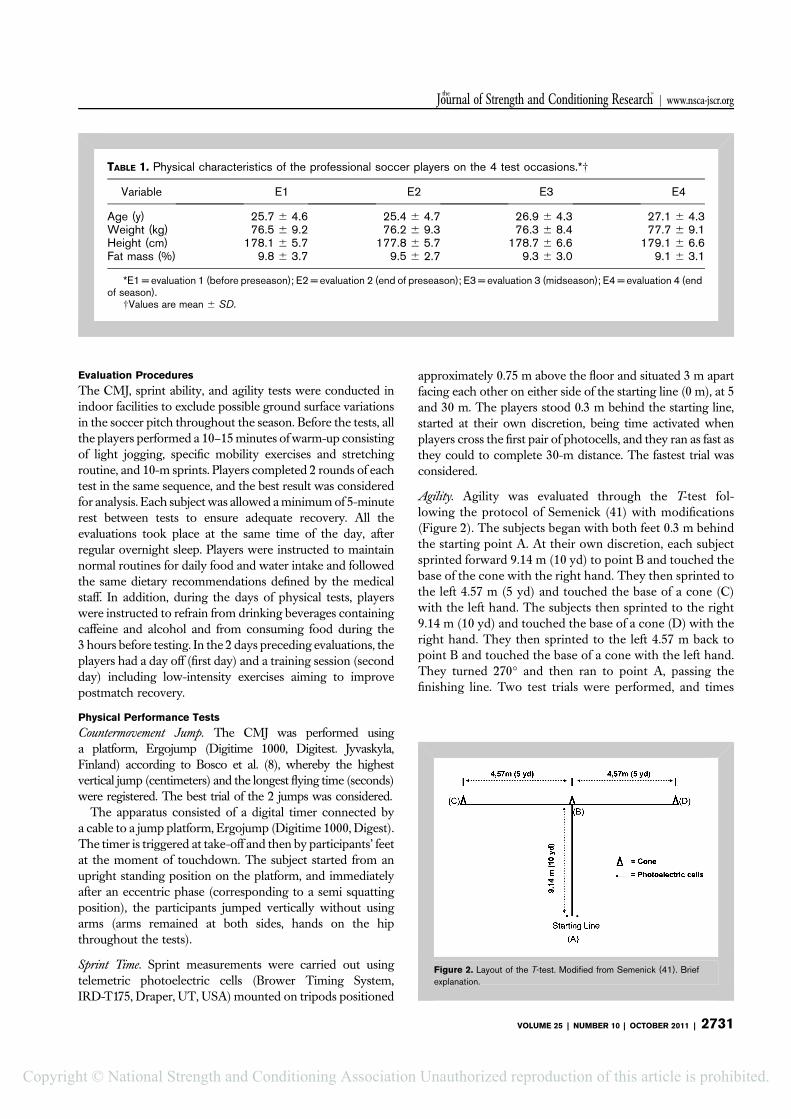
Evaluation Procedures
The CMJ, sprint ability, and agility tests were conducted inindoor facilities to exclude possible ground surface variationsin the soccer pitch throughout the season. Before the tests, allthe players performed a 10–15minutes of warm-up consistingof light jogging, specific mobility exercises and stretchingroutine, and 10-m sprints. Players completed 2 rounds of eachtest in the same sequence, and the best result was consideredfor analysis. Each subject was allowed aminimumof 5-minuterest between tests to ensure adequate recovery. All theevaluations took place at the same time of the day, afterregular overnight sleep. Players were instructed to maintainnormal routines for daily food and water intake and followedthe same dietary recommendations defined by the medicalstaff. In addition, during the days of physical tests, playerswere instructed to refrain from drinking beverages containingcaffeine and alcohol and from consuming food during the3 hours before testing. In the 2 days preceding evaluations, theplayers had a day off (first day) and a training session (secondday) including low-intensity exercises aiming to improvepostmatch recovery.
Physical Performance Tests
Countermovement Jump. The CMJ was performed usinga platform, Ergojump (Digitime 1000, Digitest. Jyvaskyla,Finland) according to Bosco et al. (8), whereby the highestvertical jump (centimeters) and the longest flying time (seconds)were registered. The best trial of the 2 jumps was considered.The apparatus consisted of a digital timer connected by
a cable to a jump platform, Ergojump (Digitime 1000, Digest).The timer is triggered at take-off and then by participants’ feetat the moment of touchdown. The subject started from anupright standing position on the platform, and immediatelyafter an eccentric phase (corresponding to a semi squattingposition), the participants jumped vertically without usingarms (arms remained at both sides, hands on the hipthroughout the tests).
Sprint Time. Sprint measurements were carried out usingtelemetric photoelectric cells (Brower Timing System,IRD-T175, Draper, UT, USA) mounted on tripods positioned
approximately 0.75 m above the floor and situated 3 m apartfacing each other on either side of the starting line (0 m), at 5and 30 m. The players stood 0.3 m behind the starting line,started at their own discretion, being time activated whenplayers cross the first pair of photocells, and they ran as fast asthey could to complete 30-m distance. The fastest trial wasconsidered.
Agility. Agility was evaluated through the T-test fol-lowing the protocol of Semenick (41) with modifications(Figure 2). The subjects began with both feet 0.3 m behindthe starting point A. At their own discretion, each subjectsprinted forward 9.14 m (10 yd) to point B and touched thebase of the cone with the right hand. They then sprinted tothe left 4.57 m (5 yd) and touched the base of a cone (C)with the left hand. The subjects then sprinted to the right9.14 m (10 yd) and touched the base of a cone (D) with theright hand. They then sprinted to the left 4.57 m back topoint B and touched the base of a cone with the left hand.They turned 270° and then ran to point A, passing thefinishing line. Two test trials were performed, and times
TABLE 1. Physical characteristics of the professional soccer players on the 4 test occasions.*†
Variable E1 E2 E3 E4
Age (y) 25.7 6 4.6 25.4 6 4.7 26.9 6 4.3 27.1 6 4.3Weight (kg) 76.5 6 9.2 76.2 6 9.3 76.3 6 8.4 77.7 6 9.1Height (cm) 178.1 6 5.7 177.8 6 5.7 178.7 6 6.6 179.1 6 6.6Fat mass (%) 9.8 6 3.7 9.5 6 2.7 9.3 6 3.0 9.1 6 3.1
*E1 = evaluation 1 (before preseason); E2 = evaluation 2 (end of preseason); E3 = evaluation 3 (midseason); E4 = evaluation 4 (endof season).
†Values are mean 6 SD.
Figure 2. Layout of the T-test. Modified from Semenick (41). Brief
explanation.
VOLUME 25 | NUMBER 10 | OCTOBER 2011 | 2731
Journal of Strength and Conditioning Researchthe TM
| www.nsca-jscr.org
Copyright © National Strength and Conditioning Association Unauthorized reproduction of this article is prohibited.
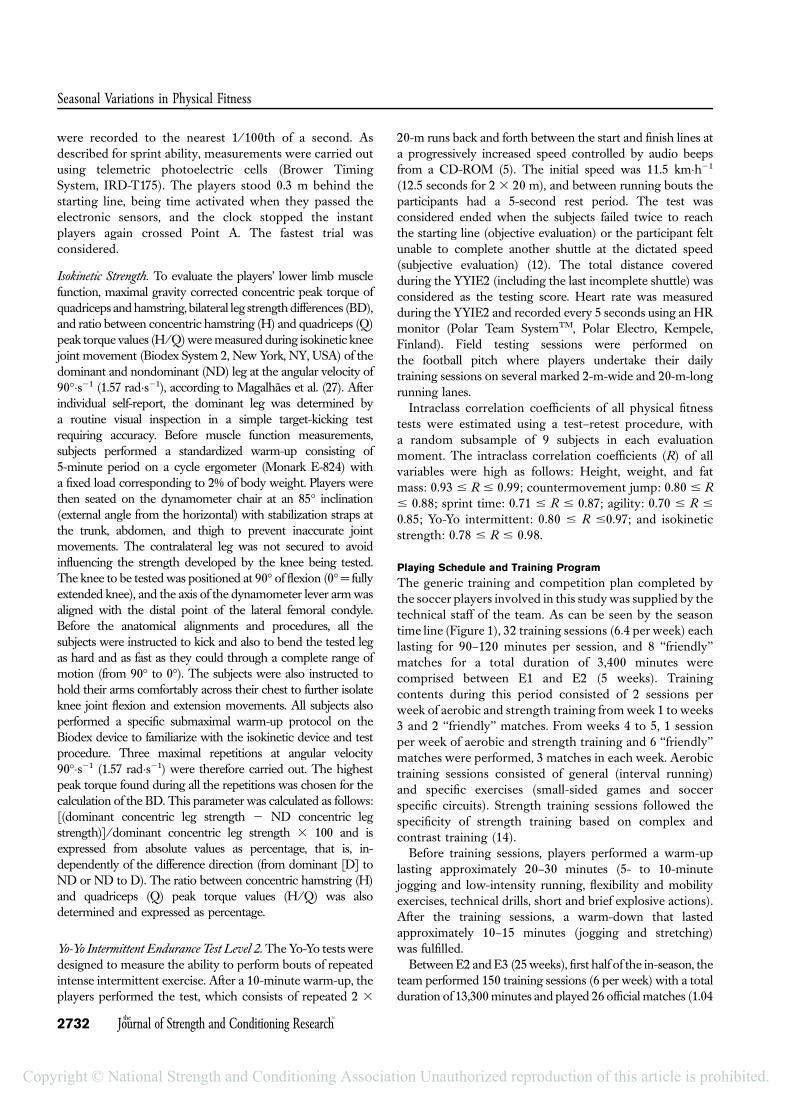
were recorded to the nearest 1/100th of a second. Asdescribed for sprint ability, measurements were carried outusing telemetric photoelectric cells (Brower TimingSystem, IRD-T175). The players stood 0.3 m behind thestarting line, being time activated when they passed theelectronic sensors, and the clock stopped the instantplayers again crossed Point A. The fastest trial wasconsidered.
Isokinetic Strength. To evaluate the players’ lower limb musclefunction, maximal gravity corrected concentric peak torque ofquadriceps andhamstring, bilateral leg strength differences (BD),and ratio between concentric hamstring (H) and quadriceps (Q)peak torque values (H/Q)weremeasured during isokinetic kneejoint movement (Biodex System 2, New York, NY, USA) of thedominant and nondominant (ND) leg at the angular velocity of90°s21 (1.57 rads21), according to Magalhaes et al. (27). Afterindividual self-report, the dominant leg was determined bya routine visual inspection in a simple target-kicking testrequiring accuracy. Before muscle function measurements,subjects performed a standardized warm-up consisting of5-minute period on a cycle ergometer (Monark E-824) witha fixed load corresponding to 2% of body weight. Players werethen seated on the dynamometer chair at an 85° inclination(external angle from the horizontal) with stabilization straps atthe trunk, abdomen, and thigh to prevent inaccurate jointmovements. The contralateral leg was not secured to avoidinfluencing the strength developed by the knee being tested.The knee to be tested was positioned at 90° of flexion (0°= fullyextended knee), and the axis of the dynamometer lever armwasaligned with the distal point of the lateral femoral condyle.Before the anatomical alignments and procedures, all thesubjects were instructed to kick and also to bend the tested legas hard and as fast as they could through a complete range ofmotion (from 90° to 0°). The subjects were also instructed tohold their arms comfortably across their chest to further isolateknee joint flexion and extension movements. All subjects alsoperformed a specific submaximal warm-up protocol on theBiodex device to familiarize with the isokinetic device and testprocedure. Three maximal repetitions at angular velocity90°s21 (1.57 rads21) were therefore carried out. The highestpeak torque found during all the repetitions was chosen for thecalculation of the BD. This parameter was calculated as follows:[(dominant concentric leg strength 2 ND concentric legstrength)]/dominant concentric leg strength 3 100 and isexpressed from absolute values as percentage, that is, in-dependently of the difference direction (from dominant [D] toND or ND to D). The ratio between concentric hamstring (H)and quadriceps (Q) peak torque values (H/Q) was alsodetermined and expressed as percentage.
Yo-Yo Intermittent Endurance Test Level 2. The Yo-Yo tests weredesigned to measure the ability to perform bouts of repeatedintense intermittent exercise. After a 10-minute warm-up, theplayers performed the test, which consists of repeated 2 3
20-m runs back and forth between the start and finish lines ata progressively increased speed controlled by audio beepsfrom a CD-ROM (5). The initial speed was 11.5 kmh21
(12.5 seconds for 2 3 20 m), and between running bouts theparticipants had a 5-second rest period. The test wasconsidered ended when the subjects failed twice to reachthe starting line (objective evaluation) or the participant feltunable to complete another shuttle at the dictated speed(subjective evaluation) (12). The total distance coveredduring the YYIE2 (including the last incomplete shuttle) wasconsidered as the testing score. Heart rate was measuredduring the YYIE2 and recorded every 5 seconds using an HRmonitor (Polar Team SystemTM, Polar Electro, Kempele,Finland). Field testing sessions were performed onthe football pitch where players undertake their dailytraining sessions on several marked 2-m-wide and 20-m-longrunning lanes.Intraclass correlation coefficients of all physical fitness
tests were estimated using a test–retest procedure, witha random subsample of 9 subjects in each evaluationmoment. The intraclass correlation coefficients (R) of allvariables were high as follows: Height, weight, and fatmass: 0.93 # R # 0.99; countermovement jump: 0.80 # R# 0.88; sprint time: 0.71 # R # 0.87; agility: 0.70 # R #0.85; Yo-Yo intermittent: 0.80 # R #0.97; and isokineticstrength: 0.78 # R # 0.98.
Playing Schedule and Training Program
The generic training and competition plan completed bythe soccer players involved in this study was supplied by thetechnical staff of the team. As can be seen by the seasontime line (Figure 1), 32 training sessions (6.4 per week) eachlasting for 90–120 minutes per session, and 8 ‘‘friendly’’matches for a total duration of 3,400 minutes werecomprised between E1 and E2 (5 weeks). Trainingcontents during this period consisted of 2 sessions perweek of aerobic and strength training from week 1 to weeks3 and 2 ‘‘friendly’’ matches. From weeks 4 to 5, 1 sessionper week of aerobic and strength training and 6 ‘‘friendly’’matches were performed, 3 matches in each week. Aerobictraining sessions consisted of general (interval running)and specific exercises (small-sided games and soccerspecific circuits). Strength training sessions followed thespecificity of strength training based on complex andcontrast training (14).Before training sessions, players performed a warm-up
lasting approximately 20–30 minutes (5- to 10-minutejogging and low-intensity running, flexibility and mobilityexercises, technical drills, short and brief explosive actions).After the training sessions, a warm-down that lastedapproximately 10–15 minutes (jogging and stretching)was fulfilled.Between E2 and E3 (25 weeks), first half of the in-season, the
team performed 150 training sessions (6 per week) with a totalduration of 13,300minutes and played 26 official matches (1.04
2732 Journal of Strength and Conditioning Researchthe TM
Seasonal Variations in Physical Fitness
Copyright © National Strength and Conditioning Association Unauthorized reproduction of this article is prohibited.

matches per week). In this period, players performed in eachweek 1 session of aerobic high-intensity training (high-intensityinterval training and small-sided games), 1 session of functionalstrength training (plyometric training, resistive sprints, agilitydrills) and 1 session of others sprint ability exercises (with andwithout changes of directions).Between E3 and E4 (17 weeks), second half of the in-season,
players were engaged in 90 training sessions (5.3 per week) witha total duration of 7,200 minutes and played 26 official matches(1.5 per week). In this period, the number of matches increased,and the number of fitness training sessions decreased.
Statistical Analyses
All data are reported as mean and SD. Normality was testedwith the Shapiro–Wilks test. Intraclass correlation coefficientwas calculated to estimate the reliability of the physicalfitness tests. Analysis of variance for repeated measures wasused to compare the differences between evaluations.Pearson correlation coefficients (r) were used to determineassociation between tests, tests changes, and their relation-ship with individual match playing time. The SPSS statisticalpackage (version 14.0; Inc., Chicago, USA) was used.Statistical significance was set at p # 0.05.
TABLE 2. Variation of different performance measurements in the 4 evaluation moments throughout the soccer season.*†
Variables E1 E2 E3 E4 GS
T5m (s) 1.032 6 0.11 1.056 6 0.05 1.017 6 0.06 1.033 6 0.07 1.033T30m (s) 4.164 6 0.18 4.217 6 0.15 4.137 6 0.14‡ 4.16 6 0.17 4.169CMJ (cm) 42.44 6 4.04 44.84 6 4.5§ 42.84 6 4.4 42.23 6 4.38 43.08T-test (s) 8.714 6 0.33 8.745 6 0.36 8.408 6 0.27k 8.498 6 0.27k 8.591
*E1 = evaluation moment 1 (before preseason); E2 = evaluation moment 2 (end of preseason); E3 = evaluation moment 3(midseason), E4 = evaluation moment 4 (end-of-season); GS = global sample; T5m = 5-m sprint time; T30m = 30-m sprint time;CMJ = countermovement jump.
†Values are mean 6 SD.‡p , 0.01 E3 vs. E2.§p , 0.05 E2 vs. E1, E3, and E4.kp , 0.01 E3 and E4 vs. E1 and E2.
TABLE 3. Variation of isokinetic strength measurements in the 4 evaluation moments throughout the soccer season.*†
Variables E1 E2 E3 E4 GS
KED 90°s21(Nm) 238.95 6 39.8 240.73 6 51.4 239.13 6 45 243.96 6 52.8 240.64KFD 90°s21(Nm) 131.22 6 22.1 131.58 6 21.9 135.36 6 25.1 138.03 6 24.2 134.05H/Q D (%) 54.91 6 6 54.65 6 5 56.6 6 8.5‡ 56.4 6 7.3‡ 55.64KEND 90°s21(Nm) 241.746 6 39 241.338 6 47 241.85 6 40 243.82 6 53.3 241.417KFND 90°s21(Nm) 128.992 6 19.6 128.561 6 23.4 133.01 6 20.1 133.86 6 23.6 130.74H/QND (%) 53.35 6 4.9 53.2 6 5.2 55.02 6 5.4‡ 54.9 6 6.1‡ 54.1BDKE (%) 5.76 6 5.36 5.57 6 5.42 5.70 6 4.95 8.54 6 4.91 6.39BDKF (%) 6.64 6 6.3 5.59 6 4.7 7.66 6 5.4 7.6 6 5.8 6.87
*E1 = evaluation moment 1 (before preseason); E2 = evaluation moment 2 (end of preseason) ; E3 = evaluation moment 3(midseason) ; E4 = evaluation moment 4 (end-of-season); GS= global sample; KED = peak torque in knee extension dominant legs;KFD = peak torque in knee flexion dominant legs; H/QD= concentric hamstrings/quadriceps strength ratio dominant leg; KEND= peaktorque in knee extension nondominant legs; KFND = peak torque in knee flexion nondominant legs; H/QND = concentric hamstringsquadriceps strength ratio nondominant leg; BDKE = bilateral strength differences in extensors muscles; BDKF = bilateral strengthdifferences in flexors muscles.
†Values are mean 6 SD.‡p , 0.05 E3 and E4 vs. E1 and E2.
VOLUME 25 | NUMBER 10 | OCTOBER 2011 | 2733
Journal of Strength and Conditioning Researchthe TM
| www.nsca-jscr.org
Copyright © National Strength and Conditioning Association Unauthorized reproduction of this article is prohibited.
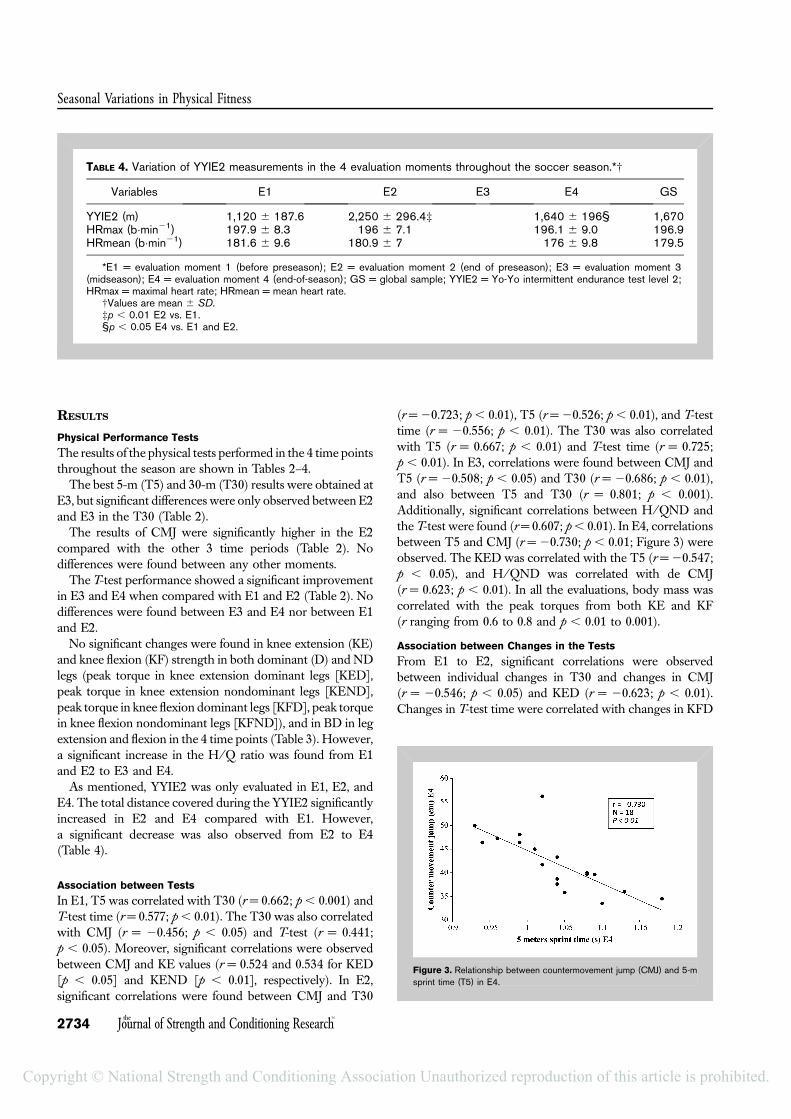
RESULTS
Physical Performance Tests
The results of the physical tests performed in the 4 time pointsthroughout the season are shown in Tables 2–4.The best 5-m (T5) and 30-m (T30) results were obtained at
E3, but significant differences were only observed between E2and E3 in the T30 (Table 2).The results of CMJ were significantly higher in the E2
compared with the other 3 time periods (Table 2). Nodifferences were found between any other moments.The T-test performance showed a significant improvement
in E3 and E4 when compared with E1 and E2 (Table 2). Nodifferences were found between E3 and E4 nor between E1and E2.No significant changes were found in knee extension (KE)
and knee flexion (KF) strength in both dominant (D) and NDlegs (peak torque in knee extension dominant legs [KED],peak torque in knee extension nondominant legs [KEND],peak torque in knee flexion dominant legs [KFD], peak torquein knee flexion nondominant legs [KFND]), and in BD in legextension and flexion in the 4 time points (Table 3). However,a significant increase in the H/Q ratio was found from E1and E2 to E3 and E4.As mentioned, YYIE2 was only evaluated in E1, E2, and
E4. The total distance covered during the YYIE2 significantlyincreased in E2 and E4 compared with E1. However,a significant decrease was also observed from E2 to E4(Table 4).
Association between Tests
In E1, T5 was correlated with T30 (r = 0.662; p , 0.001) andT-test time (r = 0.577; p, 0.01). The T30 was also correlatedwith CMJ (r = 20.456; p , 0.05) and T-test (r = 0.441;p , 0.05). Moreover, significant correlations were observedbetween CMJ and KE values (r = 0.524 and 0.534 for KED[p , 0.05] and KEND [p , 0.01], respectively). In E2,significant correlations were found between CMJ and T30
(r = 20.723; p , 0.01), T5 (r = 20.526; p , 0.01), and T-testtime (r = 20.556; p , 0.01). The T30 was also correlatedwith T5 (r = 0.667; p , 0.01) and T-test time (r = 0.725;p , 0.01). In E3, correlations were found between CMJ andT5 (r = 20.508; p , 0.05) and T30 (r = 20.686; p , 0.01),and also between T5 and T30 (r = 0.801; p , 0.001).Additionally, significant correlations between H/QND andthe T-test were found (r = 0.607; p, 0.01). In E4, correlationsbetween T5 and CMJ (r = 20.730; p , 0.01; Figure 3) wereobserved. The KED was correlated with the T5 (r =20.547;p , 0.05), and H/QND was correlated with de CMJ(r = 0.623; p , 0.01). In all the evaluations, body mass wascorrelated with the peak torques from both KE and KF(r ranging from 0.6 to 0.8 and p , 0.01 to 0.001).
Association between Changes in the Tests
From E1 to E2, significant correlations were observedbetween individual changes in T30 and changes in CMJ(r = 20.546; p , 0.05) and KED (r = 20.623; p , 0.01).Changes in T-test time were correlated with changes in KFD
TABLE 4. Variation of YYIE2 measurements in the 4 evaluation moments throughout the soccer season.*†
Variables E1 E2 E3 E4 GS
YYIE2 (m) 1,120 6 187.6 2,250 6 296.4‡ 1,640 6 196§ 1,670HRmax (bmin21) 197.9 6 8.3 196 6 7.1 196.1 6 9.0 196.9HRmean (bmin21) 181.6 6 9.6 180.9 6 7 176 6 9.8 179.5
*E1 = evaluation moment 1 (before preseason); E2 = evaluation moment 2 (end of preseason); E3 = evaluation moment 3(midseason); E4 = evaluation moment 4 (end-of-season); GS = global sample; YYIE2 = Yo-Yo intermittent endurance test level 2;HRmax = maximal heart rate; HRmean = mean heart rate.
†Values are mean 6 SD.‡p , 0.01 E2 vs. E1.§p , 0.05 E4 vs. E1 and E2.
Figure 3. Relationship between countermovement jump (CMJ) and 5-m
sprint time (T5) in E4.
2734 Journal of Strength and Conditioning Researchthe TM
Seasonal Variations in Physical Fitness
Copyright © National Strength and Conditioning Association Unauthorized reproduction of this article is prohibited.

(r = 0.522; p, 0.05) and H/QD (r = 0.768; p , 0.001). Also,a significant correlation between individual changes in KED andYYIE2 was observed (r = 20.568; p , 0.05). From E2 to E3,significant correlations were observed between individualchanges in T-test time and H/QD (r = 0.726; p , 0.05). Also,changes in KEND were correlated with T5 (r = 20.638;p , 0.05; Figure 4), and changes in T-test time were correlatedwith H/QND (r = 0.622; p , 0.05) from E3 and E4.
Association betweenMatch Playing Time and Changes in the
Tests
The individual match playing time from E1 to E3 wascorrelated with the individual changes in T5 (r = 20.705;p , 0.01; Figure 5). From E2 to E3, the IMPT wassignificantly correlated with KEND (r = 0.786; p, 0.05) andH/QND (r = 20.738; p , 0.05). From E3 to E4, the IMPTwas correlated with KFD (r = 0.590; p , 0.05), KFND(r = 0.575; p , 0.05) and H/QND (r = 0.794; p , 0.05,Figure 6).
DISCUSSION
The purposes of this study were to examine the impact of theseason in a group of fitness-related parameters and theassociation between their changes, considering the IMPT.Our data showed that very short-sprint performance
measured by the T5 is a stable physical ability throughoutthe soccer season. However, significant differences wereobserved in the T30, where the time to perform the 30-mdistance decreased fromE2 to E3 (p, 0.01) evidencing bettersprint performance in the middle of the competitive period.In contrast with our data, Aziz et al. (4) reported a gradualimprovement in sprint performance over the season in both5- and 20-m sprint tests.The soccer players showed a significantly higher CMJ
performance in E2 than in E1, E3, and E4 (Table 2).Accordingly, Clark et al. (13) also found variations in CMJthroughout the soccer season. However, discrepanciesregarding seasonal variation in CMJ performance have beenreported in the literature. In fact, in contrast with our results,others did not report variations in CMJ during the season(11,30,31). The increase in CMJ performance in E2 couldpossibly be explained by the higher number of sessionsdedicated to improve strength and muscle power duringpreseason. During this period, high training volumes areusual aiming to improve the general fitness levels (45)including muscle power. Moreover, around December beforeE3, and from E3 to E4, we observed an increase in thenumber of games (see Figure 1) requiring more time given torecovery interventions, which implies a reduction in thevolume of strength and power training and potentiallyexplain CMJ decrement from E2 to E3 and E4. Thepredominant use of functional strength or solely functionaltype of muscle training during in season may result ina decrement of the jump ability gains attained duringpreseason training (10, 39). Nevertheless, in a study byCaldwell and Peters (10), semiprofessional players only
Figure 4. Relationship between changes in peak torque knee extensor
nondominant leg (KEND) and 5-m sprint time (T5) from E3 to E4.
Figure 5. Relationship between individual match playing time (IMPT) and
changes in 5-m sprint time (T5) from E1 to E3.
Figure 6. Relationship between individual match playing time (IMPT) and
changes in hamstrings/quadriceps (H/Q) strength ratio nondominant leg
(H/QND) from E3 to E4.
VOLUME 25 | NUMBER 10 | OCTOBER 2011 | 2735
Journal of Strength and Conditioning Researchthe TM
| www.nsca-jscr.org
Copyright © National Strength and Conditioning Association Unauthorized reproduction of this article is prohibited.

performing functional strength training during in season wereable to further increase and maintain the improvementsobtained during preseason.Some researchers have suggested the importance of the
agility as an independent physical variable in the assessmentof male football players’ performance (44,48). Our datashowed improvements in agility performance from E1 andE2 to E3 and E4, with the highest scores being observed inE3. A better coordination between agonist and antagonistmuscles allows an improved ability to stop, start, and turnrapidly while maintaining balance without loss of speed (41),which may explain, at least in part, our results. These actionsthat are systematically performed during training and gamescould likely contribute to the agility increase observed in E3and E4.All together, the results of the agility and sprint tests suggest
that activities related with the stretch-shortening cycle (SSC[26]) were improved in the midseason (E3). However, CMJwas not improved in this period. One possible reason is thatCMJ might not fulfill the criteria of SSC as would running-based exercises, which lie in a very fast transition from stretchto shortening phases and in a greater stretch velocity, bothcritical for stretch reflex activation (47).Generally, data from our study showed that players
maintain the same levels of strength in both knee extensionand flexor muscles and bilateral strength differences through-out the soccer season. In fact, only significant increases in theH/Q ratio from E1 and E2 to E3 and E4 were observed. Astability of isokinetic strength parameters (e.g., KE) ofprofessional soccer players over the season was also observedby other investigators (30). In contrast, amateur playersshowed a significant decrease of KE during an 11-weekcompetitive soccer season (25). This fact may highlight thepossible influence of training time in exercises specificallytargeting muscle strength. Curiously, the KE peak torquesobserved in this study during the season were higher thanthose reported in professional soccer players even at lowerangular velocities (60°s21) (30,31). Possible differences intime devoted to strength training may contribute to explain,at least partially, the referred differences between studies.Nevertheless, it is important to refer that despite thepopularity of isokinetic tests in research, they are lesspredictive of performance and longitudinally changes thanisoinertial measures, because a high sensibility is expectedwhen the mode of training matched the mode of testing (22).Despite the multifactorial etiology of muscle injury, some
evidence suggests that imbalances in H/Q, and BD (2,16),previous injury (2,17) and lower resistance to fatigue (e.g.,hamstrings) (40), are major risk factors for soft tissues injuriesof soccer players. Throughout the time course of our study,the H/Q ratios observed in the different time points wereidentical to those reported previously by our group (27) andlower than the results reported by others (31). Furthermore,Mercer et al. (31) did not report any significant changes inH/Q from the beginning to the end of preseason (E1 to E2).
According to the improvements in CMJ during preseasonand in agility during in season, it seems reasonable to suggestthat a detraining effect may occur during offseason. In fact,there is scientific evidence that detraining effects are moremarked in muscle power than in strength, the former beingmore dependent on muscle coordination (24,34).The Yo-Yo Test is widely used to evaluate the ability of
soccer players to intermittently perform exercise and has beenconsidered a sensitive tool to detect seasonal changes in thefitness of soccer players (6). Our data showed an increase inthe YYIE2 performance after the preseason period followedby a decrease at the end of season (E4). These results are inagreement with previous data reporting soccer players’ lowerintermittent endurance performance at the beginning of theseason in field and laboratory tests. In fact, data obtainedthrough different tests, such as the incremental treadmill testto exhaustion (32), exercise tolerance at _VO2max, Intermit-tent Field Test (36), and the Yo-Yo Intermittent RecoveryTest (6) expectedly revealed lower performance at thebeginning of the season than during the competitive period.Unfortunately, because of practical constraints related to thecompetitive calendar of the team engaged in this study, nodata have been collected during the midseason (E3), whichenables one to assess the impact of the first half of the seasonin the ability to perform intermittent endurance exercise.Despite some controversies regarding the eventual contri-
bution of the players’ aerobic power, the increments in YYIE2performance in E2 and E4 compared to E1 may also berelated to improvements in other endurance-related physi-ological features. Rampinini et al. (35) recently observed thattime constant of _VO2 Kinetics and the ability to maintainacid–base balance are also important physiological factors tothe performance in Yo-Yo tests. As so, improvements in theformer factors throughout the season may have increased thecapacity to repeatedly perform intermittent enduranceexercise. On the other hand, the lower levels of intermittentendurance observed in E1 may also explain the significantincrement observed during preseason (E2), because in suchconditions, higher adaptations should be expected.The decline in YYIE2 performance observed in our study at
E4 compared to that at E2 might be related to the specificityof the competition schedule. In fact, Mohr et al. (33) reporteddecreases in the ability to perform high-intensity runningduring games in elite soccer players involved in National andEuropean competitions (2 matches per week) toward themiddle of the season, during which there is limited time tofitness training and more time to recovery is needed.Accordingly, Kraemer et al. (25) observed that starter playerswho usually accumulate more match playing time experiencegreater performance decrements in some fitness parameters.Curiously, no relationship was observed in this studybetween changes in YYIE2 and IMPT.An intriguing finding was that players with lower incre-
ments or higher decrements in KFD (E1 to E2), H/QD (E1to E2 and E2 to E3), or H/QND ratio (E3 to E4) showed
2736 Journal of Strength and Conditioning Researchthe TM
Seasonal Variations in Physical Fitness
Copyright © National Strength and Conditioning Association Unauthorized reproduction of this article is prohibited.

higher improvements in agility performance. These resultssuggest that improvements in flexors strength andH/Q ratiosseem to be in the opposite direction of agility development. Apossible explanation could be that the decrease in the H/Qstrength ratio allowed the increment of acceleration capacityresulting from the increase of KE activation and from thereduction of the antagonist KF coactivation during the kneeextension task (50).The present results showed that improvements in KED from
E1 to E2, KEND fromE3 to E4 (Figure 4), and CMJ from E1 toE2 were significantly correlated with the performanceimprovement in short sprints. The KE also showed significantcorrelations with the CMJ (E1) and T5 (E4; KED). Moreover,high correlations between CMJ and T30 (E1, E2, and E3) andT5 (E3 and E4; Figure 3) were observed. Previous studies(19,48) showed that players with improvements in CMJ and instrength experienced improvements in short-sprint perfor-mance. As proposed by other researchers (19), this may suggesta possible transfer from leg power strength gains into enhancedsprint performance. In fact, there were significant associationsbetween the different functional tests that rely on poweractivities (CMJ, T5, T30, and Agility; Figure 3) in the differentevaluation time points. Moreover, from E1 to E2, we observedthat the players with higher improvements in KED showedlower improvements in YYIE2 (r = 20.568; p , 0.05).However, during the same period, a higher improvement inYYIE2 was parallel to an improvement in a muscle power test(CMJ). It has been reported that concurrent muscle training andhigh-intensity interval training performed during preseasoncould lead to improvements both in muscle power (10- and 30-m sprint, vertical jump) and in intermittent enduranceperformance (YYIR1)(49). However, after the observation ofan increment in both CMJ and YYIE2 performance duringpreseason in this study, no relationships between the 2PFPsand/or their changes were found.Top-level soccer players are usually involved in the weekly
matches of the national leagues and very often in internationalcommitments. These competitive demands may imposestrains to various physiological systems including musculo-skeletal, nervous, immune and metabolic (7,9,25,36), toa point where the managing of player’s physical fitnesstrough training and recovery strategies became influential tomaximize match performance. Thus, the knowledge on therelationship between IMPT and PFP throughout the seasonwould be helpful in the management of training programsincluding the time scheduling of official and ‘‘friendly’’matches and specific training sessions.During the 90 minutes of the match, soccer players can
perform 10–20 sprints, a high-intensity running every 70seconds, about 15 tackles, 10 headings, 50 involvements withthe ball, and 30 passes, and changing pace and sustainingforceful contractions to maintain balance and control of theball against defensive pressure (43). Therefore, high stresslevels are imposed on the neuromuscular system to cope withthis essential muscle power-based efforts. As already
observed in other intermittent team sports such as handball(18,20), individual match playing time (IMPT) seems toinfluence players’ fitness during season. In fact, accordingto our results, players with more accumulated IMPT from E1to E3 showed higher improvements in T5 (r = 20.705;p , 0.01; Figure 5). This suggests that the short bursts ofacceleration required during games could have a positiveeffect in developing players’ ability to accelerate (15,48). Itwas observed that players with higher IMPT showed bothhigher increments and lower decrements in KEND (r = 0.786;p , 0.05; E2 to E3), KFD, and KFND (r = 0.575 and 0.590,respectively; p , 0.05; E3 to E4). Kraemer et al. (25)observed that during and after a 11-week competitive soccerseason, collegiate soccer players’ KF strength did notsignificantly decrease as much as KE did. Moreover, theauthors observed that starter players showed higher values ofKF in the different evaluation points. Additionally, weobserved that the correlation coefficients between IMPTandindividual changes in the H/Q ratio were r = 20.738 (p ,
0.05) from E2 to E3 and changed to a positive value of r =0.794 (p , 0.05) from E3 to E4 (Figure 6), reflecting thedifferent impact of IMPT in KE and KF in the differentevaluations throughout the competitive period. The ob-served relationship between IMPT and these PFP suggeststhat male professional soccer players with higher IMPT havehigher capabilities to increase or maintain muscle strength(KE and KF) and sprint (T5) throughout the season, that is,competition time may possibly contribute to influencecertain physical characteristics of professional soccer players.In fact, it was evidenced that after the game, KF is affected byfatigue and muscle damage and the KF reduction follows theincrease in some indirect markers of muscle damage (1,3,28).Moreover, KF was also referred as a muscle group lessresistant to fatigue than KE (40) that shows after a matchhigher force decrements (1,21) and longer period of musclesoreness (46) than extensor muscles. This may explain at leastpartially the higher adaptations found in this muscle group inplayers with more IMPT between E3 and E4. In fact, muscleadapts to training regimens that engage them in SSCs and areimpaired less with repeated exposure (37).
PRACTICAL APPLICATIONS
This study showed that changes in different parameters ofsoccer players’ fitness are observed throughout a soccerseason. In this way, a proper control of training andcompetition workloads and their impact should be moni-tored. The preseason improvements in players’ physicalfitness from start (E1) to the end of the season (E4) makes itlogical to conclude that during offseason players experiencedpronounced effects of detraining in jump ability and agility,and intermittent endurance capacity. Thus, male professionalsoccer players should perform a specific training program orparticipate in active leisure activities to attenuate reductions intraining status that result from offseason period and to bettercope with preseason training loads. Coaches should be aware
VOLUME 25 | NUMBER 10 | OCTOBER 2011 | 2737
Journal of Strength and Conditioning Researchthe TM
| www.nsca-jscr.org
Copyright © National Strength and Conditioning Association Unauthorized reproduction of this article is prohibited.

that the interrelationship between KE strength, 5- and 30-msprint time, and CMJ performance suggests that musclestrength and power training should be an importantcomponent of soccer training. Moreover, given that duringthe in-season, the isolated completion of functional strengthexercises may be insufficient to maintain the jump ability ofprofessional players, the incorporation of some form ofweight training (e.g., combined weight and plyometrictraining) might be beneficial. This study suggests that thesystematic participation in soccer matches favors the increaseand maintenance of male professional soccer players’ musclestrength and sprint ability. Thus, given the unique demands ofactual match play, coaches should try to incorporatea competitive friendly match in the weekly training cycle ofnonstarter players.
ACKNOWLEDGMENTS
We thank the technical staff and the soccer players of the teamparticipating in the study. The results of this study do notconstitute endorsement by the National Strength andConditioning Association. Antonio Ascensao and JoseMagalhaes are supported by grants from the PortugueseFoundation for Science and Technology (SFRH/BPD/42525/2007 and SFRH/BPD/66935/2009, respectively).
REFERENCES
1. Andersson, H, Raastad, T, Nilsson, J, Paulsen, G, Garthe, I, and Kadi, F.Neuromuscular fatigue and recovery in elite female soccer: Effects ofactive recovery. Med Sci Sports Exerc 40: 372–380, 2008.
2. Arnason, A, Andersen, TE, Holme, I, Engebretsen, L, and Bahr, R.Prevention of hamstring strains in elite soccer: An interventionstudy. Scand J Med Sci Sports 18: 40–48, 2008.
3. Ascensao, A, Rebelo, A, Oliveira, E, Marques, F, Pereira, L, andMagalhaes, J. Biochemical impact of a soccer match–Analysis ofoxidative stress and muscle damage markers throughout recovery.Clin Biochem 41: 841–851, 2008.
4. Aziz, A, Tan, F, and Teh, K. Variation in selected fitness attributes ofprofessional soccer players during a league season. In: Science andFootball V. Reilly, T, Araujo, D, and Cabri, J, eds. London, UnitedKingdom/New York, NY: E and FN Spon, 2005. pp. 134–138.
5. Bangsbo, J. Fitness Training in Football—A Scientific Approach.Bagsvaerd, Denmark: HO+ Storm, 1994.
6. Bangsbo, J, Iaia, FM, and Krustrup, P. The Yo-Yo intermittentrecovery test: A useful tool for evaluation of physical performance inintermittent sports. Sports Med 38: 37–51, 2008.
7. Bangsbo, J, Mohr, M, and Krustrup, P. Physical and metabolicdemands of training and match-play in the elite football player.J Sports Sci 24: 665–674, 2006.
8. Bosco, C, Komi, PV, Tihanyi, J, Fekete, G, and Apor, P. Mechanicalpower test and fiber composition of human leg extensor muscles.Eur J Appl Physiol Occup Physiol 51: 129–135, 1983.
9. Brites, FD, Evelson, PA, Christiansen, MG, Nicol, MF, Basilico, MJ,Wikinski, RW, and Llesuy, SF. Soccer players under regular trainingshow oxidative stress but an improved plasma antioxidant status.Clin Sci (Lond) 96: 381–385, 1999.
10. Caldwell, BP and Peters, DM. Seasonal variation in physiologicalfitness of a semiprofessional soccer team. J Strength Cond Res 23:1370–1377, 2009.
11. Casajus, JA. Seasonal variation in fitness variables in professionalsoccer players. J Sports Med Phys Fitness 41: 463–469, 2001.
12. Castagna, C, Impellizzeri, F, Chamari, K, Carlomagno, D, andRampinini, E. Aerobic fitness and Yo-Yo continous and intermittenttests performances in soccer players: A correlation study. J StrengthCond Res 20: 320–325, 2006.
13. Clark, N, Edwards, AM,Morton, R, and Butterly, J. Season-to-seasonvariation of physiological fitness within a squad of professional malesoccer players. J Sports Sci Med 7: 157–165, 2008.
14. Cometti, G. Los Metodos Modernos de Musculacion. Barcelona, Spain:Editorial Paidotribo, 1998.
15. Cometti, G, Maffiuletti, NA, Pousson, M, Chatard, JC, and Maffulli, N.Isokinetic strength and anaerobic power of elite, subelite andamateur soccer players. Int J Sports Med 22: 45–51, 2001.
16. Croisier, JL, Ganteaume, S, Binet, J, Genty, M, and Ferret, JM.Strength imbalances and prevention of hamstring injury in pro-fessional soccer players: A prospective study. Am J Sports Med 36:1469–1475, 2008.
17. Dauty, M, Potiron-Josse, M, and Rochcongar, P. Identification ofprevious hamstring muscle injury by isokinetic concentric andeccentric torque measurement in elite soccer player. Isokinet Exerc Sci11: 139–144, 2003.
18. Gorostiaga, EM, Granados, C, Ibanez, J, Gonzalez-Badillo, JJ, andIzquierdo, M. Effects of an entire season on physical fitness changesin elite male handball players.Med Sci Sports Exerc 38: 357–366, 2006.
19. Gorostiaga, EM, Izquierdo, M, Ruesta, M, Iribarren, J,Gonzalez-Badillo, JJ, and Ibanez, J. Strength training effects onphysical performance and serum hormones in young soccer players.Eur J Appl Physiol 91: 698–707, 2004.
20. Granados, C, Izquierdo, M, Ibanez, J, Ruesta, M, and Gorostiaga, EM.Effects of an entire season on physical fitness in elite female handballplayers. Med Sci Sports Exerc 40: 351–361, 2008.
21. Greig, M. The influence of soccer-specific fatigue on peak isokinetictorque production of the knee flexors and extensors. Am J Sports Med36: 1403–1409, 2008.
22. Harris, N, Cronin, J, and Keogh, J. Contraction force specificity and itsrelationship to functional performance. J Sports Sci 25: 201–212, 2007.
23. Impellizzeri, FM, Rampinini, E, and Marcora, SM. Physiologicalassessment of aerobic training in soccer. J Sports Sci 23: 583–592, 2005.
24. Izquierdo, M, Ibanez, J, Gonzalez-Badillo, JJ, Ratamess, NA,Kraemer, WJ, Hakkinen, K, Bonnabau, H, Granados, C, French, DN,and Gorostiaga, EM. Detraining and tapering effects on hormonalresponses and strength performance. J Strength Cond Res 21:768–775, 2007.
25. Kraemer, WJ, French, DN, Paxton, NJ, Hakkinen, K, Volek, JS,Sebastianelli, WJ, Putukian, M, Newton, RU, Rubin, MR,Gomez, AL, Vescovi, JD, Ratamess, NA, Fleck, SJ, Lynch, JM, andKnuttgen, HG. Changes in exercise performance and hormonalconcentrations over a big ten soccer season in starters andnonstarters. J Strength Cond Res 18: 121–128, 2004.
26. Lemmink, KA, Visscher, C, Lambert, MI, and Lamberts, RP. Theinterval shuttle run test for intermittent sport players: Evaluation ofreliability. J Strength Cond Res 18: 821–827, 2004.
27. Magalhaes, J, Oliveira, J, Ascensao, A, and Soares, J. Concentricquadriceps and hamstrings isokinetic strength in volleyball andsoccer players. J Sports Med Phys Fitness 44: 119–125, 2004.
28. Magalhaes, J, Rebelo, A, Oliveira, E, Silva, JR, Marques, F, andAscensao, A. Impact of Loughborough Intermittent Shuttle Testversus soccer match on physiological, biochemical and neuromus-cular parameters. Eur J Appl Physiol 108: 39–48, 2010.
29. Maio Alves, JM, Rebelo, AN, Abrantes, C, and Sampaio, J. Short-term effects of complex and contrast training in soccer players’vertical jump, sprint, and agility abilities. J Strength Cond Res 24:936–941, 2010.
30. Malliou, P, Ispirlidis, I, Beneka, A, Taxildaris, K, and Godolias, G.Vertical jump and knee extensors isokinetic performance inprofessional soccer players related to the phase of the trainingperiod. Isokinet Exerc Sci 11: 165–169, 2003.
2738 Journal of Strength and Conditioning Researchthe TM
Seasonal Variations in Physical Fitness
Copyright © National Strength and Conditioning Association Unauthorized reproduction of this article is prohibited.
31. Mercer, TH, Gleeson, NP, and Mitchell, J. Fitness profiles ofprofessional soccer players before and after pre-season condi-tioning. In: Science and Footbal III. Reilly, T, Bangsbo, J, andHughes, M, eds. London, United Kingdom: E & FN Spon, 1997.pp. 112–117.
32. Metaxas, T, Sendelides, T, Koutlianos, N, and Mandroukas, K.Seasonal variation of aerobic performance in soccer players accordingto positional role. J Sports Med Phys Fitness 46: 520–525, 2006.
33. Mohr, M, Krustrup, P, and Bangsbo, J. Match performance of high-standard soccer players with special reference to development offatigue. J Sports Sci 21: 519–528, 2003.
34. Mujika, I and Padilla, S. Muscular characteristics of detraining inhumans. Med Sci Sports Exerc 33: 1297–1303, 2001.
35. Rampinini, E, Sassi, A, Azzalin, A, Castagna, C, Menaspa, P,Carlomagno, D, and Impellizzeri, FM. Physiological determinantsof Yo-Yo intermittent recovery tests in male soccer players. Eur JAppl Physiol 108: 401-409, 2010.
36. Rebelo, A. Studies of fatigue in soccer. PhD thesis, University ofPorto, Porto, 1999.
37. Reilly, T, Drust, B, and Clarke, N. Muscle fatigue during footballmatch-play. Sports Med 38: 357–367, 2008.
38. Reilly, Tand Ekblom, B. The use of recovery methods post-exercise.J Sports Sci 23: 619–627, 2005.
39. Reilly, T and Williams, A. Science and Soccer (2nd ed.). London,United Kingdom: Routledge, 2003.
40. Sangnier, S and Tourny-Chollet, C. Study of the fatigue curve inquadriceps and hamstrings of soccer players during isokineticendurance testing. J Strength Cond Res 22: 1458–1467, 2008.
41. Semenick, D. The T-test. Natl Strength Cond Assoc J 12: 36–37, 1990.
42. Sporis, G, Ruzic, L, and Leko, G. The anaerobic endurance of elitesoccer players improved after a high-intensity training interventionin the 8-week conditioning program. J Strength Cond Res 22:559–566, 2008.
43. Stolen, T, Chamari, K, Castagna, C, and Wisloff, U. Physiology ofsoccer: An update. Sports Med 35: 501–536, 2005.
44. Svensson, M and Drust, B. Testing soccer players. J Sports Sci 23:601–618, 2005.
45. Tessitore, A, Meeusen, R, Cortis, C, and Capranica, L. Effects ofdifferent recovery interventions on anaerobic performances fol-lowing preseason. J Strength Cond Res 21: 745–750, 2007.
46. Thompson, D, Nicholas, CW, and Williams, C. Muscular sorenessfollowing prolonged intermittent high-intensity shuttle running.J Sports Sci 17: 387–395, 1999.
47. Wilson, JM and Flanagan, EP. The role of elastic energy in activitieswith high force and power requirements: A brief review. J StrengthCond Res 22: 1705–1715, 2008.
48. Wisloff, U, Castagna, C, Helgerud, J, Jones, R, and Hoff, J. Strongcorrelation of maximal squat strength with sprint performance andvertical jump height in elite soccer players. Br J Sports Med 38:285–288, 2004.
49. Wong, PL, Chaouachi, A, Chamari, K, Dellal, A, and Wisloff, U.Effect of preseason concurrent muscular strength and high-intensityinterval training in professional soccer players. J Strength Cond Res24: 653–660, 2010.
50. Young, W. Transfer of strength and power training to sportsperformance. Int J Sports Physiol Perform 1: 74–83, 2006.
VOLUME 25 | NUMBER 10 | OCTOBER 2011 | 2739
Journal of Strength and Conditioning Researchthe TM
| www.nsca-jscr.org
Copyright © National Strength and Conditioning Association Unauthorized reproduction of this article is prohibited.


Eur J Appl Physiol (2010) 108:39–48
DOI 10.1007/s00421-009-1161-z
123
ORIGINAL ARTICLE
Impact of Loughborough Intermittent Shuttle Test versus soccer match on physiological, biochemical and neuromuscular parameters
José Magalhães · António Rebelo · Eduardo Oliveira ·
João Renato Silva · Franklim Marques ·
António Ascensão
Accepted: 4 August 2009 / Published online: 16 September 2009
Springer-Verlag 2009
Abstract The aim of the present study was to analyze the
impact of Loughborough Intermittent Shuttle Test (LIST)
versus soccer match on heart rate (HR), muscle damage,
redox status, blood leukocytes and neuromuscular function
throughout 72 h recovery. Sixteen male soccer players
(21.3 § 1.1 years; 175.0 § 6.0 cm; 70.7 § 6.3 kg) com-
pleted LIST and performed a soccer match separated by
2 weeks and data were collected before, 30 min, 24, 48 and
72 h after LIST and match. HR, plasma creatine kinase
(CK) activity, myoglobin (Mb), uric acid (UA), protein sul-
fhydryls (–SH), malondialdehyde (MDA) contents, total
antioxidant status (TAS), blood leukocyte counts, delayed
onset muscle soreness, 20 m sprint and jump performances,
and maximal isokinetic knee extension and Xexion were
analyzed. HR after LIST was signiWcantly lower than after
the match. Post-match TAS was lower and UA was higher
than after LIST. Thirty minutes and 24 h after soccer MDA
was higher and –SH was lower than after LIST (P < 0.05).
LIST and soccer match induced elevation in total leuko-
cytes and a reduction in lymphocytes at 30 min. This reduc-
tion in blood lymphocytes 30 min after match was lower
than after LIST. In conclusion, the impact of both exercises
did not diVer regarding the observed muscle damage mark-
ers and some neuromuscular parameters, although soccer
requires higher cardiac demand and induced higher changes
on redox status, adenine nucleotide metabolism and on
lymphocyte counts than LIST, which should be taken into
account when using LIST to simulate a match to study
these type of physiological and biochemical-related end-
points.
Keywords Intermittent exercise · Muscle damage ·
Oxidative damage · Antioxidants · Fatigue and recovery
Introduction
The physiological, biochemical and neuromuscular impact
of intermittent multi-sprint sports, including soccer, has
been studied through diVerent methodologies. Time-motion
analysis of soccer match provides information regarding
total distance covered and type of movement, number of
physical contacts, tackles, headers and kicks performed by
players. Moreover, speciWc Weld approaches during soccer
matches (Krustrup et al. 2006), tentative replications of
match demands in laboratory (Drust et al. 2000) or a com-
bination of Weld and lab tests (Greig et al. 2006) have been
designed to monitor heart rate (HR), blood and muscle
J. Magalhães, A. Ascensão and A. Rebelo contributed equally.
J. Magalhães (&) · A. Ascensão
Centre for Research in Physical Activity, Health and Leisure,
Faculty of Sport Sciences, University of Porto,
Rua Dr. Plácido Costa, 91, 4200-450 Porto, Portugal
e-mail: [email protected]
A. Rebelo · J. R. Silva
Department of Soccer, Faculty of Sport,
University of Porto, Porto, Portugal
J. Magalhães · E. Oliveira · A. Ascensão
Department of Sports Biology, Faculty of Sport,
University of Porto, Porto, Portugal
F. Marques
Department of Clinical Analysis, Faculty of Pharmacy,
Institute for Molecular and Cell Biology,
University of Porto, Porto, Portugal
40 Eur J Appl Physiol (2010) 108:39–48
123
metabolite alterations, estimated energy expenditure and
oxygen uptake of soccer players. These laboratory and Weld
tests are used to uncover the lack of control of the activity
pattern and exercise intensity in a game, resulting from the
randomized order of players’ actions, thus allowing a stan-
dardized analysis of metabolic, biochemical and functional
features of intermittent exercise. Among several intermit-
tent Weld tests, the Loughborough Intermittent Shuttle Test
(LIST) has been used to study the eVects of the ingestion of
carbohydrate-electrolyte solutions or meals (Foskett et al.
2008; Nicholas et al. 1995, 1999), Xuid ingestion and gas-
tric emptying (Leiper et al. 2005), muscle metabolism and
temperature (Morris et al. 2005), muscle soreness and dam-
age (Thompson et al. 1999), heat acclimatization protocols
(Sunderland et al. 2008), cryotherapy treatment against
muscle damage (Bailey et al. 2007), as well as the inXuence
of antioxidants (Kingsley et al. 2005; Thompson et al.
2001a) on intermittent exercise performance and recovery
with special reference to soccer. In fact, some authors have
suggested that LIST is a Weld test that simulates the activity
pattern and the workload imposed by soccer, i.e., was
designed to mimic the activities performed and the distance
covered in a typical soccer match (Bishop et al. 1999; Nicholas
et al. 2000). This was based on data from time-motion
analysis and estimated indirect calorimetric variables
(Nicholas et al. 2000). However, the analysis of the dis-
tance covered by players during the match tends to underes-
timate the energy expended as many unorthodox modes of
motion, such as running backwards and sideways, jumping,
decelerating and changing direction, as well as the drib-
bling and contesting possession accentuate the mechanical
and metabolic loading (Reilly 1997). Moreover, even con-
sidering the pre-deWned turns implying acceleration and
decelerations during LIST, the great quantity and variety of
soccer actions associated with eccentric contractions during
a match are expected to cause additional muscle distur-
bances in soccer when compared to LIST.
Recent studies from our lab and others have analyzed the
response of performance indices, muscle damage, inXam-
mation as well as oxidative stress and damage markers of
male and female soccer players during the recovery from a
match (Andersson et al. 2008; Ascensao et al. 2008; Ispirlidis
et al. 2008), as the recovery is thought to be inXuenced
by changes in these functional and biochemical parameters.
Some of these endpoints have also been measured during
the recovery period after the LIST (Bailey et al. 2007;
Kingsley et al. 2005; Thompson et al. 1999, 2001a, 2003).
In addition to the comparison of time-motion analysis and
estimated indirect calorimetric variables between LIST ver-
sus soccer match (Nicholas et al. 2000), no data had been
published comparing the impact of LIST versus soccer on
biochemical and neuromuscular parameters. Therefore, it
would be of interest to examine whether, and to what
extent, muscle damage, plasma oxidative stress and damage
and blood inXammatory markers, as well as lower limb
neuromuscular variables such as jump, 20 m sprint ability
and strength performance, are altered in response to LIST
versus soccer. Thus, the present study aimed to compara-
tively analyze the eVect of LIST versus soccer match on
muscle damage, plasma antioxidant capacity, oxidative
damage, blood leukocyte counts and neuromuscular vari-
ables throughout 72-h post-exercise recovery period. Our
hypothesis is that soccer induces higher levels of muscle
and oxidative damage than LIST.
Methods
Subjects
Sixteen male soccer players from 2nd and 3rd Portuguese
divisions participated in this study after being informed
about the aims, experimental protocol, procedures and after
delivering writing consents. At the time of the experiments,
the players were in the competitive period of the season,
performing 4–5 training sessions per week. The experimen-
tal protocol was approved by the Ethical Committee of
Faculty of Sport, University of Porto, Portugal, and
followed the Declaration of Helsinki of the World Medical
Association for research with humans.
Experimental design and procedures
The players performed the LIST and one soccer match
separated by 2 week (Fig. 1). For 2 weeks prior to data col-
lection and during the protocol period, soccer players were
instructed not to change their normal eating habits and to
refrain from additional vitamin, antioxidant dietary supple-
mentation or any recovery treatment such as cryotherapy.
Subjects were also instructed to abstain from exhaustive
exercise during the 72-h pre- and post-LIST and match,
with exception of the functional evaluation tests. The over-
all set-up was performed during a 3-week interruption of
the competitive period. During the remaining days, with the
exception of the 72 h pre- and post-protocol periods, the
players were engaged in normal training routines.
The temperature at the days of Weld exercise (LIST and
soccer match) was around 16°C.
Blood samples and functional data (jump and sprint per-
formance, quadriceps and hamstrings muscle strength)
were assessed pre-LIST/match and at 30 min, 24, 48 and
72 h of the recovery period. On the day of the LIST/match,
players arrived at the laboratory after an overnight fast
between 10.00 and 12.00 h. A resting blood sample was
taken after subjects had been standing for at least 15 min,
after which subjects consumed a light standardizing meal

Eur J Appl Physiol (2010) 108:39–48 41
123
and drink and rested for 2 h. According to Thompson et al.
(2003), the meal consisted of 1.7 g/kg white bread and
0.3 g/kg of low-fat spread. Rest muscle strength, jump and
sprint performance were assessed during the 2-h period
between the consumption of pre-exercise meal and the start
of the LIST/match.
For 3 days after the LIST/match, subjects returned to the
laboratory. A blood sample was taken from the forearm
vein in the same conditions described above. Subsequently,
the players performed the sprint and strength tests as out-
lined below.
Preliminary measurements
The players performed an incremental (0.1 m/s increase
each 1 min step) treadmill (Quasar-Med, Nussdorf, Germany)
test until voluntary exhaustion to determine maximal
oxygen uptake (VO2max) and maximal HR (HRmax, Vantage
NV, Polar Electro, Finland). Expired respiratory gas
fractions were measured using an open circuit breath-by-
breath automated gas-analysis system (Cortex, Metalyzer,
3B, Germany). From the VO2max, running speeds corre-
sponding to 55 and 95% VO2max were calculated. There-
after, the subjects performed the LIST for 30 min to
familiarize with the test. Jump and 20 m sprint abilities
and strength performance were also evaluated at baseline
as described below.
The LIST
The 90-min shuttle run test was conducted according to
Thompson et al. (1999) in a natural green soccer pitch.
BrieXy, the participants were required to run between two
lines, 20 m apart, at various speeds dictated by an audio
signal and based on the velocities corresponding to their
individual VO2max. The exercise periods were designed as
follows:
• 3 £ 20 m walking
• 1 £ 20 m maximal running sprint
• 4 s recovery
• 3 £ 20 m at a running speed corresponding to 55%
VO2max
• 3 £ 20 m at a running speed corresponding to 95%
VO2max
This pattern was repeated for each 15-min exercise block
followed by the corresponding 3-min recovery period for
Wve times.
HR during the LIST was measured and recorded
every 5 s.
Match time-motion analysis
For time-motion analysis, each player was video-Wlmed
close up during the entire match. The videotapes were later
replayed for computerized time-motion analyses according
to the procedures described by Mohr et al. (2003) The used
motor pattern categories included standing (0 km h¡1),
walking (6 km h¡1), jogging (8 km h¡1), low-speed running
(12 km h¡1), moderate-speed running (15 km h¡1), high-
speed running (18 km h¡1), sprinting (30 km h¡1), side-
ways, and backwards (10 km h¡1) running. The match
activities were later analyzed considering standing, walk-
ing, jogging, cruising, sprinting, backwards running and
sideways running.
HR was also measured during the match as previously
described.
Delayed onset muscle soreness (DOMS)
After LIST/match and prior to blood sampling, each subject
was asked to complete a leg muscle soreness questionnaire,
in which they rated their perceived muscle soreness on a
scale from 0 (normal absence of soreness) to 10 (very
intense sore).
Blood sampling and preparations
All venous blood samples were taken by conventional clin-
ical procedures as described previously (Magalhaes et al.
2007). An aliquot of the whole blood was used to perform
leukocyte counts as indirect markers of muscle damage.
The remaining freshly withdrawn blood was immediately
centrifuged at 3,000 rpm during 10 min to obtain plasma.
Plasma was separated into aliquots and rapidly frozen at
Fig. 1 Test schedule for the whole test period. Downward arrows denote the time points when sprint and jump performance, isokinetic strength
and DOMS were measured. Drop marks denote the time points when blood samples were taken. HR heart rate

42 Eur J Appl Physiol (2010) 108:39–48
123
–80°C for later biochemical analysis of the muscle damage
markers myoglobin (Mb) and creatine kinase (CK), as well
as the redox state using total antioxidant status (TAS), mal-
ondialdehyde (MDA), protein sulfhydryl groups (SH) and
uric acid (UA).
Biochemical assays
Muscle damage
Plasma CK activity was determined spectrophotometrically
using a commercial kit (ABX A11A01632, Mompelier,
FR). Plasma Mb concentration was assessed using a com-
mercial kit (myoglobin bioMerieux 30446, Carnaxide, PT).
Leukocyte count was assessed by an automatic cell
counter (Horiba 60; ABX Diagnostics, France). Whole
blood smears on glass slides (VBS 655/A Microscope, Bio-
sigma) were used for white blood cell diVerential analysis.
Smears were stained using Wright coloring (Merck) and
air-dried. Cell diVerentials were performed using an Olym-
pus microscope equipped with 1,000£ oil immersion lens.
Redox state
Total antioxidant status was measured spectrophotometrically
using a commercial kit (Randox NX2332 Crumlin, UK). Uric
acid was determined by an enzymatic method using a com-
mercial kit (Horiba ABX A11A01670, Montpellier, France).
Plasma MDA was assayed according to Rohn et al.
(1993) with some modiWcations and measured by the
formation of thiobarbituric acid reactive substances at
535 nm. Plasma SH was spectrophotometrically evaluated
at 414 nm according to Hu (1990). Protein content was
spectrophotometrically assayed using bovine serum albu-
min as standard according to Lowry et al. (1951). Samples
were analyzed in duplicate and the mean of the two values
was used for statistical analysis.
Jumping performance
Vertical jumping was evaluated on a Bosco’s mat (Ergo-
jump, Globus, Italy). In accordance with Hertogh et al.
(2005), free counter-movement jumps with extension of both
upper limbs were chosen to simulate spontaneous jumping
movements. The depth of the counter-movement was self-
selected and represented each players’ optimal depth for
maximal jump. Each athlete performed three jumps and the
best result expressed as jump height was recorded.
20 m sprint ability
Sprint ability measurements were carried out using telemet-
ric photoelectric cells placed at 0 and 20 m (Brower Timing
System, IRD-T175, USA). The players stood 1 m behind
the starting line, started on a verbal signal being time
activated when players cross the Wrst pair of photocells, and
then ran as fast as they could to complete the 20-m
distance. Players completed two runs interspersed by
1-min recovery period and the best time was registered.
Strength assessment
In order to evaluate muscle function, subjects were famil-
iarized with the muscle function test on at least two occa-
sions during preliminary visits to the laboratory. Maximal
gravity corrected concentric peak torque of quadriceps and
hamstrings was measured during isokinetic knee joint
movement of dominant leg at an angular velocity of 90 s¡1
(1.57 rad s¡1) using a isokinetic dynamometer (Biodex
System 2, USA) as described previously by our group
(Magalhaes et al. 2004).
Fluid loss and intake
In order to determine sweat loss, the players were weighed
wearing dry shorts immediately before and after the LIST
and match using a digital weight (Tanita Scale BC533).
The subjects were allowed to drink water ad libitum during
both the LIST and the match, and their water intake was
recorded.
Statistics
Mean, standard deviation and standard error mean were cal-
culated for all variables. A Kolmogorov–Smirnov test was
used to test whether physiological, biochemical and neuro-
muscular-related variables were normally distributed. Two-
way analysis of variance (ANOVA) for repeated measures
followed by the Bonferroni post hoc test was used to com-
pare variables between LIST and soccer at the analyzed
time points (before vs. 30 min vs. 24 vs. 48 vs. 72 h). When
there were only single comparisons, a paired sample t test
was used to determine whether any diVerences between
LIST and soccer existed. All data analysis was performed
using SPSS 17.0 package. The signiWcance level was set
at 5%.
Results
Physiological and anthropometric characteristics of the soccer
players are presented in Table 1.
Time-motion analysis showed that players were around
80 min of match time involved in low-intensity activities
including standing, walking, jogging and cruising, and
8 min in high-intensity activities including sprinting,
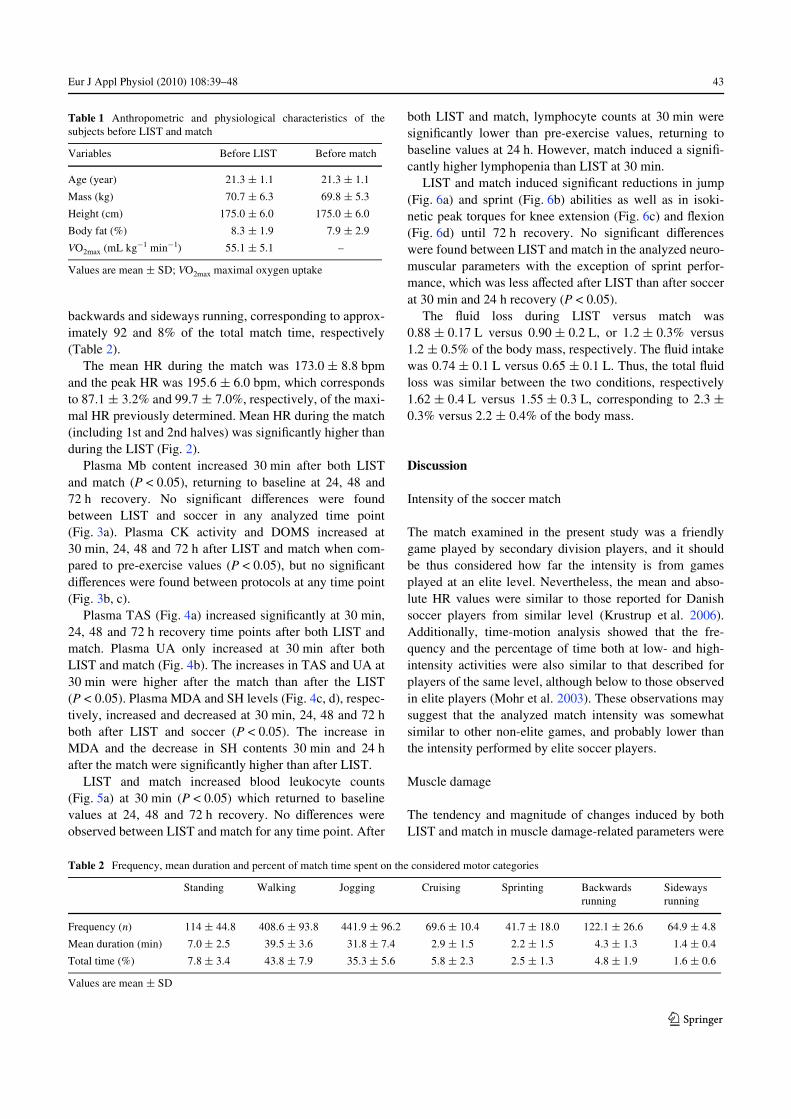
Eur J Appl Physiol (2010) 108:39–48 43
123
backwards and sideways running, corresponding to approx-
imately 92 and 8% of the total match time, respectively
(Table 2).
The mean HR during the match was 173.0 § 8.8 bpm
and the peak HR was 195.6 § 6.0 bpm, which corresponds
to 87.1 § 3.2% and 99.7 § 7.0%, respectively, of the maxi-
mal HR previously determined. Mean HR during the match
(including 1st and 2nd halves) was signiWcantly higher than
during the LIST (Fig. 2).
Plasma Mb content increased 30 min after both LIST
and match (P < 0.05), returning to baseline at 24, 48 and
72 h recovery. No signiWcant diVerences were found
between LIST and soccer in any analyzed time point
(Fig. 3a). Plasma CK activity and DOMS increased at
30 min, 24, 48 and 72 h after LIST and match when com-
pared to pre-exercise values (P < 0.05), but no signiWcant
diVerences were found between protocols at any time point
(Fig. 3b, c).
Plasma TAS (Fig. 4a) increased signiWcantly at 30 min,
24, 48 and 72 h recovery time points after both LIST and
match. Plasma UA only increased at 30 min after both
LIST and match (Fig. 4b). The increases in TAS and UA at
30 min were higher after the match than after the LIST
(P < 0.05). Plasma MDA and SH levels (Fig. 4c, d), respec-
tively, increased and decreased at 30 min, 24, 48 and 72 h
both after LIST and soccer (P < 0.05). The increase in
MDA and the decrease in SH contents 30 min and 24 h
after the match were signiWcantly higher than after LIST.
LIST and match increased blood leukocyte counts
(Fig. 5a) at 30 min (P < 0.05) which returned to baseline
values at 24, 48 and 72 h recovery. No diVerences were
observed between LIST and match for any time point. After
both LIST and match, lymphocyte counts at 30 min were
signiWcantly lower than pre-exercise values, returning to
baseline values at 24 h. However, match induced a signiW-
cantly higher lymphopenia than LIST at 30 min.
LIST and match induced signiWcant reductions in jump
(Fig. 6a) and sprint (Fig. 6b) abilities as well as in isoki-
netic peak torques for knee extension (Fig. 6c) and Xexion
(Fig. 6d) until 72 h recovery. No signiWcant diVerences
were found between LIST and match in the analyzed neuro-
muscular parameters with the exception of sprint perfor-
mance, which was less aVected after LIST than after soccer
at 30 min and 24 h recovery (P < 0.05).
The Xuid loss during LIST versus match was
0.88 § 0.17 L versus 0.90 § 0.2 L, or 1.2 § 0.3% versus
1.2 § 0.5% of the body mass, respectively. The Xuid intake
was 0.74 § 0.1 L versus 0.65 § 0.1 L. Thus, the total Xuid
loss was similar between the two conditions, respectively
1.62 § 0.4 L versus 1.55 § 0.3 L, corresponding to 2.3 §
0.3% versus 2.2 § 0.4% of the body mass.
Discussion
Intensity of the soccer match
The match examined in the present study was a friendly
game played by secondary division players, and it should
be thus considered how far the intensity is from games
played at an elite level. Nevertheless, the mean and abso-
lute HR values were similar to those reported for Danish
soccer players from similar level (Krustrup et al. 2006).
Additionally, time-motion analysis showed that the fre-
quency and the percentage of time both at low- and high-
intensity activities were also similar to that described for
players of the same level, although below to those observed
in elite players (Mohr et al. 2003). These observations may
suggest that the analyzed match intensity was somewhat
similar to other non-elite games, and probably lower than
the intensity performed by elite soccer players.
Muscle damage
The tendency and magnitude of changes induced by both
LIST and match in muscle damage-related parameters were
Table 1 Anthropometric and physiological characteristics of the
subjects before LIST and match
Values are mean § SD; VO2max maximal oxygen uptake
Variables Before LIST Before match
Age (year) 21.3 § 1.1 21.3 § 1.1
Mass (kg) 70.7 § 6.3 69.8 § 5.3
Height (cm) 175.0 § 6.0 175.0 § 6.0
Body fat (%) 8.3 § 1.9 7.9 § 2.9
VO2max (mL kg¡1 min¡1) 55.1 § 5.1 –
Table 2 Frequency, mean duration and percent of match time spent on the considered motor categories
Values are mean § SD
Standing Walking Jogging Cruising Sprinting Backwards
running
Sideways
running
Frequency (n) 114 § 44.8 408.6 § 93.8 441.9 § 96.2 69.6 § 10.4 41.7 § 18.0 122.1 § 26.6 64.9 § 4.8
Mean duration (min) 7.0 § 2.5 39.5 § 3.6 31.8 § 7.4 2.9 § 1.5 2.2 § 1.5 4.3 § 1.3 1.4 § 0.4
Total time (%) 7.8 § 3.4 43.8 § 7.9 35.3 § 5.6 5.8 § 2.3 2.5 § 1.3 4.8 § 1.9 1.6 § 0.6

44 Eur J Appl Physiol (2010) 108:39–48
123
somewhat expected and in the range of similar exercise pro-
tocols (Andersson et al. 2008; Bailey et al. 2007; Kingsley
et al. 2005; Thompson et al. 1999, 2001b, 2004), being the
signiWcant alterations observed after the match in plasma
CK, Mb, DOMS and leg strength close to some reported
after LIST protocol (Kingsley et al. 2005; Thompson et al.
1999, 2001a, 2003).
Although the activity pattern of LIST is representative of
the typical activities of soccer, there are activities such as
jumping, running backwards and time in possession of ball
that are not included. Some of these unorthodox activities,
together with tackles and sudden direction changes rely
greatly on eccentric contractions, probably increasing the
neuromuscular demands imposed by match when compared
with LIST. The considerable amount of this type of length-
ening-based contractions characteristic of soccer were ini-
tially expected to induce additional signs of muscle injury in
match when compared to LIST. However, no diVerences in
plasma CK and Mb, as well as in DOMS levels and lower
limb strength were observed between the match and the
LIST during recovery. One hypothetical reason to explain
this absence of diVerences might be the number of turns,
including accelerations and decelerations during LIST.
As reported after other types of exercise (Ascensao et al.
2007; Magalhaes et al. 2007) and also after match (Ascen-
sao et al. 2008; Ispirlidis et al. 2008), data showed that
LIST and match induced a leukocytosis. This can be
ascribed to the mobilization of blood cells from marginal
pools by hemodynamic redistribution and augmentation
that resulted from exercise-related metabolic conditions,
such as enhanced catecholamine secretion (Bangsbo 1994).
Our results also reported a marked lymphocytopenia during
the subsequent period after both exercise protocols. Never-
theless, lymphocyte counts diVered signiWcantly between
LIST and match at 30 min recovery being lower in match
Fig. 3 Plasma myoglobin content (a), creatine kinase activity (b) and
perceived delayed onset muscle soreness (c) during the 72-h recovery
following LIST (triangles) and soccer (squares). Values are mean and
SEM. Asterisk versus pre-exercise for both exercises (LIST and
soccer); no signiWcant diVerences were found between LIST and
soccer
Fig. 2 Mean heart rate (bpm) values observed during LIST and soccer
(1st and 2nd halves and overall). Values are mean and SD. Asterisk
versus LIST

Eur J Appl Physiol (2010) 108:39–48 45
123
than in LIST. In comparison to concentric exercise, eccen-
tric activity has been shown to result in a greater release of
immune system modulators such as proinXammatory cyto-
kines, acute phase proteins, and the recruitment of phago-
cytic cells with the potential to release ROS (Malm et al.
2000). These signals may favor additional oxidative stress
and damage, as well as apoptosis in several tissues and
cells, including lymphocytes. However, the hypothesis that
a higher apoptosis-induced lymphocytopenia observed after
match than after LIST can be attributed to the referred
unorthodox eccentric activities during match is unlikely, as
Simpson et al. (2007) reported that the levels of blood lym-
phocytopenia apoptosis observed after downhill running
were not diVerent compared with intensive running. The
precise reasons for the lower lymphocyte counts after
match should be further investigated.
Redox status
Match induced higher increases in UA (30 min) and MDA
(30 min and 24 h) contents than LIST. Moreover, TAS
(30 min) and SH (30 min and 24 h) were lower after match
than after LIST. These results suggest that match may
induce higher changes on redox status and on adenine
nucleotide metabolism than LIST. Given that around 1–5%
of the total oxygen uptake results in the generation of
Fig. 4 Plasma total antioxidant status (a), uric acid (b), malondialde-
hyde (c) and sulfhydryl (d) contents during the 72-h recovery follow-
ing LIST (triangles) and soccer (squares). Values are mean and SEM.
Asterisk versus pre-exercise for both exercises (LIST and soccer);
#LIST versus soccer
Fig. 5 Blood leukocytes (a) and lymphocytes (b) counts during the
72-h recovery following LIST (triangles) and soccer (squares).
Values are mean and SEM. Asterisk versus pre-exercise for both
exercises (LIST and soccer); #LIST versus soccer
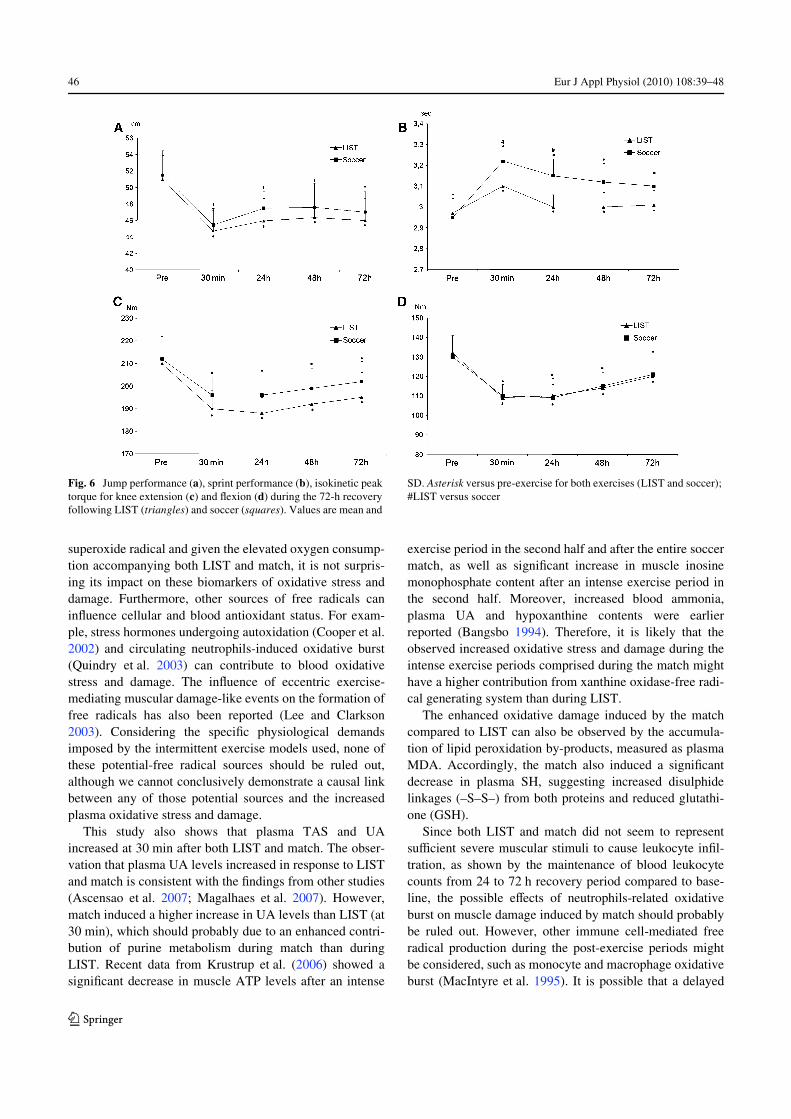
46 Eur J Appl Physiol (2010) 108:39–48
123
superoxide radical and given the elevated oxygen consump-
tion accompanying both LIST and match, it is not surpris-
ing its impact on these biomarkers of oxidative stress and
damage. Furthermore, other sources of free radicals can
inXuence cellular and blood antioxidant status. For exam-
ple, stress hormones undergoing autoxidation (Cooper et al.
2002) and circulating neutrophils-induced oxidative burst
(Quindry et al. 2003) can contribute to blood oxidative
stress and damage. The inXuence of eccentric exercise-
mediating muscular damage-like events on the formation of
free radicals has also been reported (Lee and Clarkson
2003). Considering the speciWc physiological demands
imposed by the intermittent exercise models used, none of
these potential-free radical sources should be ruled out,
although we cannot conclusively demonstrate a causal link
between any of those potential sources and the increased
plasma oxidative stress and damage.
This study also shows that plasma TAS and UA
increased at 30 min after both LIST and match. The obser-
vation that plasma UA levels increased in response to LIST
and match is consistent with the Wndings from other studies
(Ascensao et al. 2007; Magalhaes et al. 2007). However,
match induced a higher increase in UA levels than LIST (at
30 min), which should probably due to an enhanced contri-
bution of purine metabolism during match than during
LIST. Recent data from Krustrup et al. (2006) showed a
signiWcant decrease in muscle ATP levels after an intense
exercise period in the second half and after the entire soccer
match, as well as signiWcant increase in muscle inosine
monophosphate content after an intense exercise period in
the second half. Moreover, increased blood ammonia,
plasma UA and hypoxanthine contents were earlier
reported (Bangsbo 1994). Therefore, it is likely that the
observed increased oxidative stress and damage during the
intense exercise periods comprised during the match might
have a higher contribution from xanthine oxidase-free radi-
cal generating system than during LIST.
The enhanced oxidative damage induced by the match
compared to LIST can also be observed by the accumula-
tion of lipid peroxidation by-products, measured as plasma
MDA. Accordingly, the match also induced a signiWcant
decrease in plasma SH, suggesting increased disulphide
linkages (–S–S–) from both proteins and reduced glutathi-
one (GSH).
Since both LIST and match did not seem to represent
suYcient severe muscular stimuli to cause leukocyte inWl-
tration, as shown by the maintenance of blood leukocyte
counts from 24 to 72 h recovery period compared to base-
line, the possible eVects of neutrophils-related oxidative
burst on muscle damage induced by match should probably
be ruled out. However, other immune cell-mediated free
radical production during the post-exercise periods might
be considered, such as monocyte and macrophage oxidative
burst (MacIntyre et al. 1995). It is possible that a delayed
Fig. 6 Jump performance (a), sprint performance (b), isokinetic peak
torque for knee extension (c) and Xexion (d) during the 72-h recovery
following LIST (triangles) and soccer (squares). Values are mean and
SD. Asterisk versus pre-exercise for both exercises (LIST and soccer);
#LIST versus soccer

Eur J Appl Physiol (2010) 108:39–48 47
123
and continuous monocyte mobilization from bone narrow,
thus compensating inWltration of these cells into muscle
after damaging exercise (MacIntyre et al. 1995) had
occurred masking leukocyte count changes in blood.
Neuromuscular function
In accordance with previous reports (Andersson et al. 2008;
Bailey et al. 2007; Kingsley et al. 2005; Krustrup et al.
2006; Nicholas et al. 2000; Thompson et al. 1999, 2001b,
2003, 2004), both LIST and match impaired neuromuscular
parameters assessed through measurements of sprint, jump
and strength performance. Interestingly, only sprint ability
was more aVected by match than by LIST. Accordingly,
Mohr et al. (2005) observed that soccer players decreased
their ability to sprint after intense periods of the game, as
well as after the end of the Wrst and second halves. This
temporary fatigue-related impairment should also be
expected in jump and strength performance. In fact, consid-
ering that, at least in part, similar involvements of meta-
bolic pathways should occur in energy turnover during
these maximal power-elicited running and jumping tests,
these distinct results were unexpected. An hypothetical
explanation based on the presumable changes in the force–
velocity relationship as a result of selective damage to type
II muscle Wbers induced by the great amount of eccentric
exercise during match is truly appealing (Twist and Eston
2005). In fact, a greater reliance on intra-muscular high-
energy phosphates in the countermovement jump instead of
glycogen was likely to occur. The relatively longer duration
of the 2- to 3-s sprint test would rely more heavily on gly-
cogen metabolism, which may be aVected by the presum-
able eccentric exercise-induced muscle-damage and could,
at least partially, explain diVerences between the two tests
(Twist and Eston 2005). In fact, both LIST and match
induce signiWcant glycogen depletion in skeletal muscle
Wbers (Krustrup et al. 2006; Nicholas et al. 1999), although
the eVects of glycogen depletion on high intensity/short
duration performance should only occur below critical lev-
els. Alternatively, considering the distinct levels of motor
coordination involved in the actions of jumping and sprint
running, the repeated eccentric actions performed during
the match might cause disturbances in movement control
(Bottas et al. 2005) aVecting more pronouncedly the run-
ning performance, which likely rely to a greater extent on
muscular coordination than a single jump or leg curl and
extension.
In summary, the impact of LIST and match did not diVer
regarding the observed muscle damage markers and some
neuromuscular parameters, although match requires higher
cardiac demand and induced higher changes on redox
status, adenine nucleotide and on lymphocyte metabolism
than LIST, which should be taken into account when using
LIST to simulate a soccer match to study these type of
physiological and biochemical-related endpoints.
Acknowledgments We would like to thank to soccer players
involved in the study for their committed participation. The excellent
technical and practical assistance and skillful involvement of Sergio
Ribeiro, Ricardo Ladeira, Laura Pereira, Bárbara Duarte, Henrique
Reguengo, and camera operators as well as the friendly help of André
Seabra in the statistics revision is also appreciated. The authors are
grateful to City Council of Maia for providing the pitch where soccer
match was carried out. António Ascensão is supported by a grant from
the Portuguese Foundation for Science and Technology (SFRH/BPD/
42525/2007).
References
Andersson H, Raastad T, Nilsson J, Paulsen G, Garthe I, Kadi F (2008)
Neuromuscular fatigue and recovery in elite female soccer: eVects
of active recovery. Med Sci Sports Exerc 40:372–380
Ascensao A, Ferreira R, Marques F, Oliveira E, Azevedo V, Soares J,
Magalhaes J (2007) EVect of oV-road competitive motocross race
on plasma oxidative stress and damage markers. Br J Sports Med
41:101–105
Ascensao A, Rebelo A, Oliveira E, Marques F, Pereira L, Magalhaes J
(2008) Biochemical impact of a soccer match—analysis of oxida-
tive stress and muscle damage markers throughout recovery. Clin
Biochem 41:841–851
Bailey DM, Erith SJ, GriYn PJ, Dowson A, Brewer DS, Gant N,
Williams C (2007) InXuence of cold-water immersion on indices
of muscle damage following prolonged intermittent shuttle run-
ning. J Sports Sci 25:1163–1170
Bangsbo J (1994) The physiology of soccer—with special reference to
intense intermittent exercise. Acta Physiol Scand Suppl 619:1–
155
Bishop NC, Blannin AK, Robson PJ, Walsh NP, Gleeson M (1999)
The eVects of carbohydrate supplementation on immune respons-
es to a soccer-speciWc exercise protocol. J Sports Sci 17:787–796
Bottas R, Linnamo V, Nicol C, Komi PV (2005) Repeated maximal
eccentric actions causes long-lasting disturbances in movement
control. Eur J Appl Physiol 94:62–69
Cooper CE, Vollaard NB, Choueiri T, Wilson MT (2002) Exercise,
free radicals and oxidative stress. Biochem Soc Trans 30:280–285
Drust B, Reilly T, Cable NT (2000) Physiological responses to labora-
tory-based soccer-speciWc intermittent and continuous exercise.
J Sports Sci 18:885–892
Foskett A, Williams C, Boobis L, Tsintzas K (2008) Carbohydrate
availability and muscle energy metabolism during intermittent
running. Med Sci Sports Exerc 40:96–103
Greig MP, McNaughton LR, Lovell RJ (2006) Physiological and
mechanical response to soccer-speciWc intermittent activity and
steady-state activity. Res Sports Med (Print) 14:29–52
Hertogh C, Chamari K, Damiani M, Martin R, Hachana Y, Blonc S,
Hue O (2005) EVects of adding a preceding run-up on perfor-
mance, blood lactate concentration and heart rate during maximal
intermittent vertical jumping. J Sports Sci 23:937–942
Hu M-L (1990) Measurement of protein thiol groups and GSH in
plasma. In: Parker L (ed) Methods in enzymology. Academic
Press, San Diego, pp 380–385
Ispirlidis I, Fatouros IG, Jamurtas AZ, Nikolaidis MG, Michailidis I,
Douroudos I, Margonis K, Chatzinikolaou A, Kalistratos E,
Katrabasas I, Alexiou V, Taxildaris K (2008) Time-course of
changes in inXammatory and performance responses following a
soccer game. Clin J Sport Med 18:423–431

48 Eur J Appl Physiol (2010) 108:39–48
123
Kingsley MI, Wadsworth D, KilduV LP, McEneny J, Benton D (2005)
EVects of phosphatidylserine on oxidative stress following inter-
mittent running. Med Sci Sports Exerc 37:1300–1306
Krustrup P, Mohr M, Steensberg A, Bencke J, Kjaer M, Bangsbo J
(2006) Muscle and blood metabolites during a soccer game:
implications for sprint performance. Med Sci Sports Exerc
38:1165–1174
Lee J, Clarkson PM (2003) Plasma creatine kinase activity and gluta-
thione after eccentric exercise. Med Sci Sports Exerc 35:930–936
Leiper JB, Nicholas CW, Ali A, Williams C, Maughan RJ (2005) The
eVect of intermittent high-intensity running on gastric emptying
of Xuids in man. Med Sci Sports Exerc 37:240–247
Lowry OH, Rosenbrough N, Farr AL, Radall RJ (1951) Protein
measurement with the folin phenol reagent. J Biol Chem
193:265–275
MacIntyre DL, Reid WD, McKenzie DC (1995) Delayed muscle sore-
ness. The inXammatory response to muscle injury and its clinical
implications. Sports Med 20:24–40
Magalhaes J, Oliveira J, Ascensao A, Soares J (2004) Concentric quad-
riceps and hamstrings isokinetic strength in volleyball and soccer
players. J Sports Med Phys Fitness 44:119–125
Magalhaes J, Ferreira R, Marques F, Oliveira E, Soares J, Ascensão A
(2007) Indoor climbing elicits plasma oxidative stress. Med Sci
Sports Exerc 39:955–963
Malm C, Nyberg P, Engstrom M, Sjodin B, Lenkei R, Ekblom B,
Lundberg I (2000) Immunological changes in human skeletal
muscle and blood after eccentric exercise and multiple biopsies.
J Physiol 529(Pt 1):243–262
Mohr M, Krustrup P, Bangsbo J (2003) Match performance of high-
standard soccer players with special reference to development of
fatigue. J Sports Sci 21:519–528
Mohr M, Krustrup P, Bangsbo J (2005) Fatigue in soccer: a brief
review. J Sports Sci 23:593–599
Morris JG, Nevill ME, Boobis LH, Macdonald IA, Williams C (2005)
Muscle metabolism, temperature, and function during prolonged,
intermittent, high-intensity running in air temperatures of 33
degrees and 17 degrees C. Int J Sports Med 26:805–814
Nicholas CW, Williams C, Lakomy HK, Phillips G, Nowitz A (1995)
InXuence of ingesting a carbohydrate-electrolyte solution on
endurance capacity during intermittent, high-intensity shuttle run-
ning. J Sports Sci 13:283–290
Nicholas CW, Tsintzas K, Boobis L, Williams C (1999) Carbohydrate-
electrolyte ingestion during intermittent high-intensity running.
Med Sci Sports Exerc 31:1280–1286
Nicholas CW, Nuttall FE, Williams C (2000) The Loughborough
Intermittent Shuttle Test: a Weld test that simulates the activity
pattern of soccer. J Sports Sci 18:97–104
Quindry JC, Stone WL, King J, Broeder CE (2003) The eVects of acute
exercise on neutrophils and plasma oxidative stress. Med Sci
Sports Exerc 35:1139–1145
Reilly T (1997) Energetics of high-intensity exercise (soccer) with par-
ticular reference to fatigue. J Sports Sci 15:257–263
Rohn TT, Hinds TR, Vincenzi FF (1993) Ion transport ATPases as tar-
gets for free radical damage. Protection by an aminosteroid of the
Ca2+ pump ATPase and Na+/K+ pump ATPase of human red
blood cell membranes. Biochem Pharmacol 46:525–534
Simpson RJ, Florida-James GD, Whyte GP, Black JR, Ross JA, Guy K
(2007) Apoptosis does not contribute to the blood lymphocytope-
nia observed after intensive and downhill treadmill running in
humans. Res Sports Med 15:157–174
Sunderland C, Morris JG, Nevill M (2008) A heat acclimation protocol
for team sports. Br J Sports Med 42:327–333
Thompson D, Nicholas CW, Williams C (1999) Muscular soreness
following prolonged intermittent high-intensity shuttle running.
J Sports Sci 17:387–395
Thompson D, Williams C, Kingsley M, Nicholas CW, Lakomy HK,
McArdle F, Jackson MJ (2001a) Muscle soreness and damage
parameters after prolonged intermittent shuttle-running following
acute vitamin C supplementation. Int J Sports Med 22:68–75
Thompson D, Williams C, McGregor SJ, Nicholas CW, McArdle F,
Jackson MJ, Powell JR (2001b) Prolonged vitamin C supplemen-
tation and recovery from demanding exercise. Int J Sport Nutr
Exerc Metab 11:466–481
Thompson D, Williams C, Garcia-Roves P, McGregor SJ, McArdle F,
Jackson MJ (2003) Post-exercise vitamin C supplementation and
recovery from demanding exercise. Eur J Appl Physiol 89:393–400
Thompson D, Bailey DM, Hill J, Hurst T, Powell JR, Williams C
(2004) Prolonged vitamin C supplementation and recovery from
eccentric exercise. Eur J Appl Physiol 92:133–138
Twist C, Eston R (2005) The eVects of exercise-induced muscle dam-
age on maximal intensity intermittent exercise performance. Eur
J Appl Physiol 94:652–658