Performance Evaluation of Spectrum Sharing between …567920/FULLTEXT01.pdf · Performance...
47
Master of Science Thesis Stockholm, Sweden 2012 TRITA-ICT-EX-2012:101 SHEN SUN Performance Evaluation of Spectrum Sharing between LTE Femtocell and GSM Networks KTH Information and Communication Technology
Transcript of Performance Evaluation of Spectrum Sharing between …567920/FULLTEXT01.pdf · Performance...

Master of Science ThesisStockholm, Sweden 2012
TRITA-ICT-EX-2012:101
S H E N S U N
Performance Evaluation of SpectrumSharing between LTE Femtocell and
GSM Networks
K T H I n f o r m a t i o n a n d
C o m m u n i c a t i o n T e c h n o l o g y

Master’s Thesis
Performance Evaluation of Spectrum Sharing between LTE Femtocell and GSM Networks
By
Shen Sun
School of Electrical Engineering
KTH Royal Institute of Technology
Stockholm, Sweden

i
Abstract
In recent years, as the data traffic demand grows rapidly, GSM spectrum refarming is emerging as one cost effective solution for operators to improve its efficiency on spectrum utilization. Among several refarming strategies, a coexistence network where LTE femtocells share the radio spectrum with the existing GSM users is regarded as one with great potential in the future practice.
One focus of the coexistence network research is to study the mutual impacts between the legacy GSM network and the newly deployed LTE femtocells on each other’s performance. Among all the aspects of the study, one major concern is about how the LTE femtocells’ performances are affected by the GSM deployment conditions. Targeting this issue, a coexistence network simulator is created and performance metrics are defined in this thesis. Having decent GSM service quality as a precondition, the impacts of GSM network conditions (cell size, frequency reuse factor, and traffic load) on the LTE femtocells’ performance are investigated by simulation.
In order to increase the LTE’s utilization of GSM spectrum without degrading the legacy GSM service, the interference between GSM and LTE users should be properly restrained, which attaches great importance to the research on interference management methods. In this thesis, an approach based on LTE femtocell exclusion region is studied and presented. Aiming at reducing the LTE’s interference to GSM, we delimit a region on the edge of each GSM cell, where no LTE femtocell is allowed to be deployed. Simulation results show that the approach lowers the LTE’s interference to GSM network and can greatly improve the LTE femtocells’ overall performance. Another approach to controlling the interference is to devise advanced channel allocation schemes. In this thesis, we propose a novel 6-sector frequency planning scheme which divides a GSM macrocell into six sectors and allocates the available GSM spectrum to each LTE femtocell according to the information on which sector it is located inside. Simulation results show that our scheme substantially outperforms the previously proposed one in terms of supporting higher LTE’s overall utilization of GSM spectrum. Besides, this channel allocation scheme enables the operator to make a trade-off between overall spectrum utilization and individual femtocell capacity based on the real data traffic demands by adjusting the frequency utilization factor (FUF) adopted in the scheme.

ii
Acknowledgement
First, I would like to express my utmost gratitude to my thesis advisor, Dr. Ki Won Sung, who introduced to me this topic of coexistence network of GSM and LTE femtocells and spared no effort to provide me constructive guidance and advice since the first day. I would also like to give my special thanks to Prof. Jens Zander, from whose knowledgeable lectures I started my enjoyable journey in the world of wireless networks.
During my two years’ experience of studying in Wireless Systems at KTH,
many of my peer students have offered me great help with my study, which I truly appreciate. Among them, I would especially like to thank Yong Wang, who has worked together with me on the most challenging school work and projects and never stopped surprising me with his wisdom and knowledge during our discussions. Finally, I would like thank my parents, who have always been supportive for my study and life.
Shen Sun

iii
Table of Contents
Abstract ................................................................................................................................... i Acknowledgement ............................................................................................................... ii Table of Contents ............................................................................................................... iii Introduction .......................................................................................................................... 1
1.1 Background ........................................................................................................ 1 1.2 Problem formulation ...................................................................................... 2 1.3 Thesis Outline ................................................................................................... 3
2. System Model ................................................................................................................ 4 2.1 GSM cellular network model ......................................................................... 4 2.2 LTE indoor femtocell model .......................................................................... 5 2.3 Coexistence model ........................................................................................... 6 2.4 SINR of GSM and LTE Femtocell in Uplink ................................................ 7 2.5 Performance Metrics ...................................................................................... 8
3. Interference Management Methods ................................................................... 10 3.1 LTE exclusion region .................................................................................... 10 3.2 Channel allocation schemes ...................................................................... 10
3.2.1 Previously Proposed Channel Allocation Scheme .................. 10 3.2.2 A Six-Sector Frequency Planning Scheme ................................. 13
4. Simulator Description ............................................................................................. 16 4.1 Coexistence Network Simulator ............................................................... 16 4.2 General Simulation Assumptions and Parameters ............................ 17
5. Simulation Results .................................................................................................... 19 5.1 GSM’s Impact on LTE Femtocell Performance..................................... 19
5.1.1 Impact of GSM Cell Size and Frequency Reuse Factor ........... 19 5.1.2 Impact of GSM Traffic Load ............................................................ 23
5.2 Results for LTE Femtocell Exclusion Region ......................................... 26 5.3 Results for the Proposed Channel Allocation Scheme ...................... 29
6. Conclusions and Future Work .............................................................................. 33 References .......................................................................................................................... 35 Appendix ............................................................................................................................. 36 List of Figures .................................................................................................................... 38 List of Tables ...................................................................................................................... 40 List of Acronyms ............................................................................................................... 41
1
Introduction
1.1 Background
With the increasing multimedia applications get developed and become available to the mobile users, mobile network operators have been observing rapid growth of data traffic demand in their networks. Some study shows that the total wireless network traffic generated from voice and data services will increase ten-fold by 2015 compared to that in 2009 in developed regions [1]. As the demand for the wireless network services increases, the network operators and vendors are challenged to find new ways to increase the system capacity with their limited spectrum resources. One of the most cost effective solutions they find for incumbent operators with GSM licenses is called GSM refarming.
The GSM refarming refers to ceasing currently used GSM services and reallocating the frequency spectrum to more spectrum-efficient technology such as LTE. However, the process of phasing out GSM networks is a time consuming one, as GSM still provides the backbone of voice communication and global roaming. [2] Moreover, in expanding markets such as China, India, and Latin America, the GSM/EDGE cellular market has still experienced huge subscriber growth during the past years. [3] Hence, the GSM shutdown would not be considered by incumbent operators in a short period of time and thus its spectrum cannot be reallocated to LTE.
In order to address the challenge of growing data demand and meanwhile maintain the GSM services, the coexistence of LTE systems with existing GSM cellular networks is proposed and studied in [4]. In this coexistence system, LTE femtocells are deployed in the GSM cells and operating in the GSM bands under certain spectrum sharing scheme, which is a potential solution for facilitating the smooth transition to LTE in GSM spectrum band. Before the deployment of LTE femtocells in the GSM cellular networks, two fundamental questions need to be answered through investigation are: how many LTE femtocells can be accommodated in a GSM macro cell and how should they be deployed (locations, spectrum sharing schemes and etc.)? In their paper, a channel allocation schemes for LTE femtocells is proposed as the femtocells would be assigned all the channels except those are in use by the GSM macrocell where the femtocells are located in. Under this spectrum sharing scheme, the uplink performance of the coexistence network is studied and the numerical results based on average SINR evaluation has shown that it is desirable to deploy femtocells near the center of GSM cells for the protection of the GSM service quality, while this results in the decrease in the femtocell SINR due to the increasing interference coming from other femtocells. The results in the paper also shed some light on the issue of how many LTE femtocells can be accommodated in a GSM
2
macro cell by showing the outage probability of GSM uplink versus the number of LTE femtocells deployed in each GSM macro cell.
However, to answer the questions of how many LTE femtocells can be accommodated in a GSM macro cell and how should they be deployed, more work is needed for several reasons. One reason is that the previous research does not directly answer the question that how many femtocells can be accommodated per GSM macro cell when the quality of both GSM and LTE networks is met. Their work shows the change of GSM outage probability as the number of LTE femtocells in a GSM cell increases when femtocells are uniformly distributed in circles with different radius. However, a situation that LTE femtocells uniformly distributed in the whole area of each GSM cell is more close to the realistic case. Another reason is that in the prior research the adopted power control method of GSM networks is the constant received power (CRP) technique, which is not the power control technique in a real GSM network. In the real GSM network, the power control algorithm adjusts the transmitted powers to the level of received SINR and thus may show better performance than CRP in power regulation when new interference source as LTE femtocells get deployed on the same frequency band. Also, the viability of the coexistence is greatly dependant on the conditions of GSM network deployment. To further evaluate the feasibility of the coexistence network, the impacts of various deployment conditions such as GSM cell size, traffic load and frequency reuse factors are also worth investigation. Moreover, although GSM outage probability and LTE femtocell SINRs in the coexistence network are studied and presented in [4], to accurately evaluate the coexistence network’s performance and LTE’s utilization on GSM spectrum, more metrics need to be defined and compared in different scenarios. Finally, although the channel allocation scheme previously proposed has simplicity and can help to avoid severe interference to the GSM network, it is still interesting to explore other spectrum sharing schemes and interference management schemes which enable higher GSM spectrum utilization by the LTE users.
1.2 Problem formulation
The objective of the thesis work is to evaluate the performance of spectrum sharing between LTE femtocells and GSM networks in the coexistence system and to investigate on methods that can help improve the performance. To achieve the objective, several problems need to be scrutinized and studied, which are listed below: In this coexistence network of GSM and LTE, how are the LTE femtocells’
performances affected by the conditions of GSM network deployment (Cell Size, Frequency Reuse Factor, and Traffic Load)? How will the performance change as the deployment conditions change?
Can LTE’s utilization of the GSM spectrum in such coexistence network be improved by introducing some carefully devised interference management
3
schemes? If so, how can those schemes be designed and how much improvement they can help the femtocells to achieve?
Targeting these problems, a coexistence system simulator is developed for this thesis study. The mutual interference of GSM and LTE is measured in the simulation. In our study, several different channel allocation schemes and scenarios for LTE femtocells will be devised and compared for the possibility of realizing spectrum sharing between LTE femtocells and GSM networks and further increasing the LTE femtocells’ utilization of the GSM bands. Also, based on the conclusion drawn in [4] about the impact of LTE femtocells locations on the performance of the GSM system, a femtocell exclusion region located in the outskirt of the macro cell is worth investigation to reduce the interference from LTE users to GSM ones.
In our research, we employ the received signal to interference and noise ratio (SINR) as the metric for the quality of GSM services. The percentage of users in services whose received SINR stays below SINR threshold for acceptable communication is denoted as outage probability. In order to maintain decent service quality of existing GSM networks, the outage probability should be always controlled under a certain level, and the research on LTE accommodation and spectrum sharing schemes should always be conducted under this condition. In order to evaluate the coexistence network performance, several performance metrics such as maximal number of accommodated LTE femtocell per macrocell, average area throughput, and average femtocell throughput are defined in the study. Based on these metrics, the impacts of different GSM network parameters on femtocell performance are measured, the proper exclusion region is delimited and spectrum sharing schemes are compared.
1.3 Thesis Outline
The rest of thesis report is organized as following: Chapter 2 presents the system model in this study: GSM and LTE femtocell network respectively, followed by Coexistence Network model as a whole. Chapter 3 explores several Interference Management methods that have the potential to improve the coexistence network performance. Exclusion region and a 6-sector frequency planning scheme is proposed and discussed in this chapter.
In Chapter 4, the system simulator is described in details. The assumptions made for reducing the simulator’s complexity are also listed together with the common simulation parameters.
In Chapter 5, the impact of GSM on the LTE femtocell performance is investigated. Factors as GSM cell size, frequency reuse factors and traffic load are scrutinized for their impact on LTE femtocells. Besides, the results of exclusion region and proposed spectrum sharing scheme are presented and discussed.
Finally, the conclusions are drawn in Chapter 6. Additionally, some suggestions on future work are also included.
4
2. System Model
2.1 GSM cellular network model
a. GSM in general GSM operates in various spectrum bands, and here the 1.8GHz band is
considered. However, the analysis and simulation can be adapted to other frequencies whenever it is required. As a technology based on time division multiple access (TDMA), GSM employs frequency reuse and cluster formation to utilize the spectrum resources. Spectrum allocated to an operator is divided into K groups and shared by each reuse cluster. The K is named as reuse factor. A cluster can contain all the frequencies allocated to the operator, in the form of a number of channels with 200kHz bandwidth each.
Like in [4], only uplink of GSM is considered in this study. The system’s traffic load is adjustable for investigation of its impact the LTE femtocells’ performances. We consider hexagonal cell model having an Omni-directional base station in the center with cell radius R . Mobile stations (MSs) are uniformly generated and moving towards random directions in the system.
For the propagation model, COST231 Hata model [5] with the center frequency of 1.8GHz is adopted, with BS antenna height as 30m, and MS height as 1.5m, the
pathloss ( )L d in dB scale is given as follows:
10( ) 136.2 35.2 log ( [ ])L d d km= + (1)
Antenna gain of 10dB is also considered for GSM BSs. For channel model, shadow fading of 6 dB standard deviation is considered. Moreover, in our study, 50% of the GSM users are indoor users, whose transmitted signals suffer from additional 5 dB wall penetration loss than the outdoor users.
As for the traffic load of the GSM system, it is defined as the channel occupancy rate. For instance, if the system is 80% loaded, then each GSM channel is occupied in 80% of the time.
b. GSM Power Control In GSM, power classes are used for classification of base and mobile stations. In
GSM uplink power control, the mobile station transmitted power is controlled in steps of 2dB [7]. The purpose of the GSM power control is to limit the mobile station’s transmitted power to the minimum necessary level so that the received signal power from different mobile stations can stay on similar levels. Sixteen power control steps, from Step 0 (30dBm) to Step15 (0 dBm), are adopted in GSM uplink. Starting with the lowest, Step 15, the transmitted power of the mobile station can be incremented in steps of 2dBm up to Step 0, the maximum power level that can be adopted by the

5
mobile station. Two measurement values RXLEV and RXQUAL are used for transmission power control with upper and lower thresholds defined for both of them. If the value of RXLEV or RXQUAL for the last N (an adjustable parameter) calculated mean values is above or below the respective threshold value, the system will send power adjustment command to the mobile station, and the transmitted power will be adjusted by the mobile station. The GSM uplink power control can be formulated as follows:
max ( ) ( )TX filtered filteredP P ssdes rxlev qdesDB rxqualDBa β= + × − + × − (2)
, where ssdes and qdesDB denote the target received power and target received
quality respectively; filteredrxlev and filteredrxqualDB denote the real received power and quality [8]. The power control scheme takes the received signal quality i.e. SINR into account, and would make the users increase the transmitted power if additional interference gets introduced, which is also mentioned earlier above in the case of interference-limited users. This power control scheme would help some of the GSM users (more likely for users closer to the center of the macro cells) maintain their service availability and immune to the extra interference from LTE. The boosted transmitting power by the GSM users, on the other hand, would cause considerably more interference to LTE users. Therefore the effects of GSM uplink power control should be taken into account in the research.
2.2 LTE indoor femtocell model
The LTE femtocells are assumed to be used only in indoor environment, and thus Motley-Keenan formula is used to model the indoor propagation.[9] The BS and MSs in each femtocell are assumed to be on the same floor of a building. Propagation loss at 1.8GHz is described as below:
10( ) 37.5 20log ( [ ])L d d m= + (3)
Distance between MS and BS in the femtocell is assumed to be 20m. Wall penetration loss of 5 dB is also taken into account for propagation between indoor and outdoor entities. Here a Line-of-Sight pathss loss model is adopted, which make the interference from LTE femtocells to GSM BSs over-estimated. Therefore, the results we obtain
The LTE femtocells will operate on a number of GSM channels, and thus will interfere with the GSM transmission. In the calculation of interference from LTE femtocells to GSM, one thing in terms of LTE operation that deserves discussion is its uplink power control. The Uplink Power Control for LTE can be formulated as follows:
6
{ }max 0 10min , 10logTX DLP P P M PLa= + + × (4) , where M is the number of physical resource blocks. a is the path loss
compensation factor. DLPL is the down link path loss estimate. 0P is cell/UE
specific parameter, which is used to control SNR target and can be viewed as the
desired received power. The value of 0P takes the interference level into account and
may thus vary in time as the interference level varies. Alternatively, the value of 0P
is chosen to provide sufficient margin for the maximum interference level expected within the cell. [10] Since it is indoor cell system that we are dealing with, the propagation loss for different users would not vary to a considerable extent, which
makes the transmitted power TXP would not have great distinction among the users
in the same cell. Moreover, if we assume that the LTE system is fully loaded, i.e. the whole allocated spectrum is always utilized by one or several users who adopt more or less the same transmission powers and experience similar path losses. Therefore, in the interference calculation, the LTE femtocell can be regarded as a single entity and
the power control is negligible as long as we determine a proper 0P for all the users
in the cell. Furthermore, for the convenience of calculating the interference, we define effective transmission power of LTE femtocell which is the portion of transmission
power affecting a single GSM frequency channel, denoted by leffP . The received
signal power corresponding to leffP is denoted by l
effQ .
2.3 Coexistence model
The coexistence network should be one where acceptable performances of both GSM and LTE systems can be ensured. In other words, the deployment of LTE femtocells should not degrade the performance of GSM networks to unacceptable level, and meanwhile provide decent service in the newly deployed systems. In the coexistence network, the LTE femtocells operate on orthogonal frequency division multiplexing (OFDM) technology and thus are able to utilize several fractions of radio spectrum without interfering with other parts of the spectrum lying in between. In the study on the GSM’s impacts on LTE’s perfromance, the same spectrum sharing scheme proposed in [4] is adopted as the femtocells would be assigned all the channels except those are in use by the GSM macrocell where the femtocells are located in. For example, we can consider a GSM cell in frequency
reuse cluster 2f . The femtocells located in this GSM cell cannot use 2f in order to

7
prevent detrimental interference to the GSM base stations. They can utilize remaining clusters by means of OFDM.
The operator can control the number of LTE femtocells deployed in each GSM macro cell. However their locations may have some randomness in the realistic case. The locations of requirement for LTE femtocell service are likely to vary from one cell site to another, and be opportunistic rather than planned. Research that embraces instead of neglecting randomness will naturally provide more accurate results and more plausible insights. Therefore, in our study, the LTE femtocells are uniformly distributed in each macro cell. Furthermore, since the previous research shows that it is desirable to deploy the femtocells near the center of GSM cells for the protection of the GSM system [4], a femtocell exclusion region located in the outskirt of the macro cell is also investigated and determined.
2.4 SINR of GSM and LTE Femtocell in Uplink
One purpose of our study is to investigate the impact of LTE femtocells on the performance of existing GSM system. Let jfΨ( ) denote a set of GSM cells that use
the thj reuse cluster jf . In the coexistence network, to a GSM radio link in a cell that belongs to jfΨ( ) , the interference comes from two groups of sources: other GSM MSs connected to cells∈ jfΨ( ) and LTE femtocells located in GSM cells∉ jfΨ( ) .
Let gQ denote the received signal power at the GSM BS, ggjI denote the
interference from a GSM MS in cell j to the considered GSM BS, lgkI denote the
interference from a LTE femtocell in GSM cell k to the considered BS, gbN denote the
background noise, and gg denote the SINR of the considered GSM link. Then,
j j
gg
gg lg gj k b
j f k f
QI I N
g
∈Ψ( ) ∉Ψ( )
=+ +∑ ∑ (5)
The SINR of LTE femtocells is measured on each individual GSM frequency channel. We analyze the SINR of femtocell located in cell s for a frequency channel in the cluster jf . The femtocell is interfered by GSM MSs that employ jf , femtocells in other GSM cells∉ jfΨ( ) , and femtocells in the same cell.
Let leffQ denote the effective received power on the GSM channel, gl
jI denote interference from a GSM MSs that employs jf , ll
kI denote interference from a
femtocell in other GSM cells, llsI denote the sum interference from other femotocells
in the same cell, lbN denote the background noise and lg denote the SINR of the
femtocell on this one GSM frequency channel. Then,

8
jj
leffl
gl ll ll lj k s b
k fj fk s
QI I I N
g
∉Ψ( )∈Ψ( )
≠
=+ + +∑ ∑ (6)
2.5 Performance Metrics
Several performance metrics are defined to evaluate the LTE femtocells’ performance. Together with the GSM outage probability, the coexistence network’s performance can be measured and evaluated.
Maximum Number of Femtocells per GSM Macrocell (M). The maximum number of femtocells per GSM macrocell is defined as the
maximum number of femtocells that can be accommodated by each GSM macrocell in the coexistence network where the GSM outage probability is not greater than 5%.
Spectrum Sharing Factor (SSF)
In order to evaluate the performance of channel allocation scheme for LTE femtocells in GSM networks, Spectrum Sharing Factor is introduced in our study. The Spectrum Sharing Factor is defined as the ratio of the total sum number of times that GSM channels are utilized by all the LTE femtocells located in each GSM cluster to total number of available GSM channels:
utilized
tot
ChSSFCh
=
, where utilizedCh denotes the sum number of times that GSM channels are utilized by
all the LTE femtocells located in one GSM reuse cluster, repetitive utilization of GSM channels among different femtocells is also counted. For instance, considering an
operator with 100 available GSM channels ( totCh ) and reuse factor 4K = . In the
channel allocation scheme proposed in [4], each LTE femtocell can utilize 3/4 of the GSM channels, which are all the channels except those are used by the GSM macro
cell it is located in. Suppose that the current scheme can enable 2FN = femtocells to
be deployed in each GSM cell. Then 3100 6004utilized FCh N K= × × × = . Therefore, the
LTE utilization factor in this coexistence network is 6U = . Higher SSF indicates higher number of times that GSM channels are in utilization by LTE femtocells. Average Femtocell Throughput (AFT) In order to measure the throughput performance of each LTE femtocell on
average, Average Femtocell Throughput (AFT) is defined as:

9
1
[ ]
tot
Ui
Miji
j Ch
tot
CAFT bps
M
=∈=
∑ ∑
, where ijC denotes the throughput of LTE femtocell i on channel j , totM is the total
number of deployed LTE femtocells in the entire network, UiCh is the group of channels that are utilized by femtocell i.
The throughput capacity on each channel for each LTE femtocell is calculated by the following equation:
min( ,30)10
2log (1 10 )LTESINR
SINRC B η= + ⋅
, where B is the channel bandwidth, SINRη is the SINR efficiency of the LTE femtocell
system. Moreover throughput is assumed to be saturated at the SINR of 30dB considering a practical modulation and coding scheme. [12][13][14] Femtocell Throughput Standard Deviation (FTSTD) In order to measure the variability of the throughput capacity of LTE femtocells,
Femtocell Throughput Standard Deviation (FTSTD) is defined as:
21
( )[ ]
tot
Ui
Miji
j Ch
tot
C AFTFTSTD bps
M
=∈
−=∑ ∑
Average Area Throughput (AAT)
As a metric for system throughput performance in different layouts and channel allocation schemes, average area throughput is defined as the sum of LTE femtocell throughput per unit area that the coexistence network can support:
12[ / ]
tot
Ui
Miji
j ChC
AAT bps mS
=∈=
∑ ∑
, where S is the total service area of the coexistence network. The average area throughput (AAT) indicates how effectively the GSM spectrum
can be utilized by the LTE femtocells in coexistence networks in different scenarios.
10
3. Interference Management Methods
3.1 LTE exclusion region
From the conclusions drawn in [4], we know that it is desirable to deploy the femtocells near the center of GSM cells for the protection of the GSM system. Based on this knowledge, a reasonable method to alleviate the interference from LTE to GSM in the coexistence network is to define an exclusion region for LTE femtocells on the edge of each GSM macrocell. LTE exclusion region refers to a region in each GSM macrocell, where no LTE femtocells are deployed for the sake of restraining the interference caused by them; similar schemes have been proposed in [11] and adopted in the CSMA scheduler in the 802.11 standard. In this study, for protecting the GSM quality of service, the exclusion region is a ring-shape region delimited on the outskirt part of each GSM macrocell.
Another conclusion drawn in [4] is that deploying femtocells near the center of macrocells can also, on the other hand, result in the decrease of the femtocell SINR due to increased interference coming from other femtocells in the same macrocell.
Therefore, a proper exclusion region radius ,f excR should be obtained by close
investigation.
3.2 Channel allocation schemes
3.2.1 Previously Proposed Channel Allocation Scheme
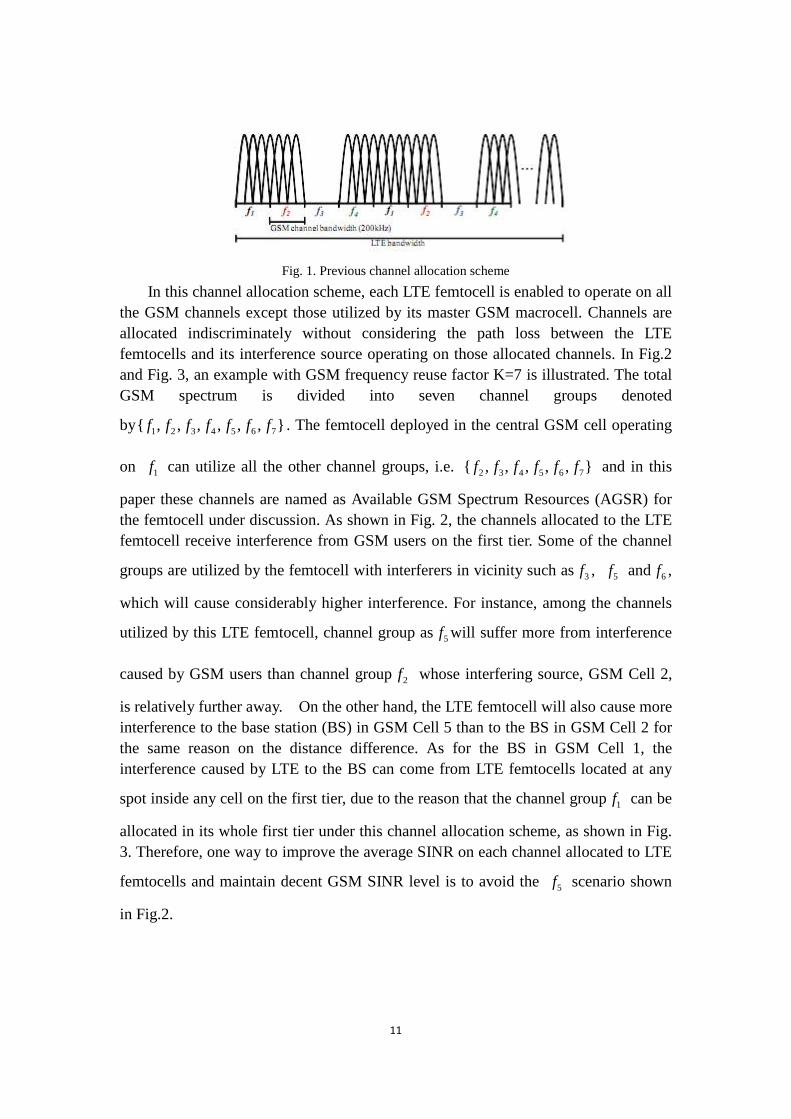
A channel allocation scheme is proposed in [4], which allows each LTE femtocell to utilize all the remaining channels except those are used by the GSM macrocell it is
located in. For instance, let us consider a GSM cell employing reuse cluster 3f . LTE
femtocells located in this GSM cell are not allowed to use 3f in order to prevent
severe interference to the GSM BS. Instead, each of them can utilize remaining
clusters 1 2 4f f f by means of OFDM as depicted in Fig.1.
11
Fig. 1. Previous channel allocation scheme
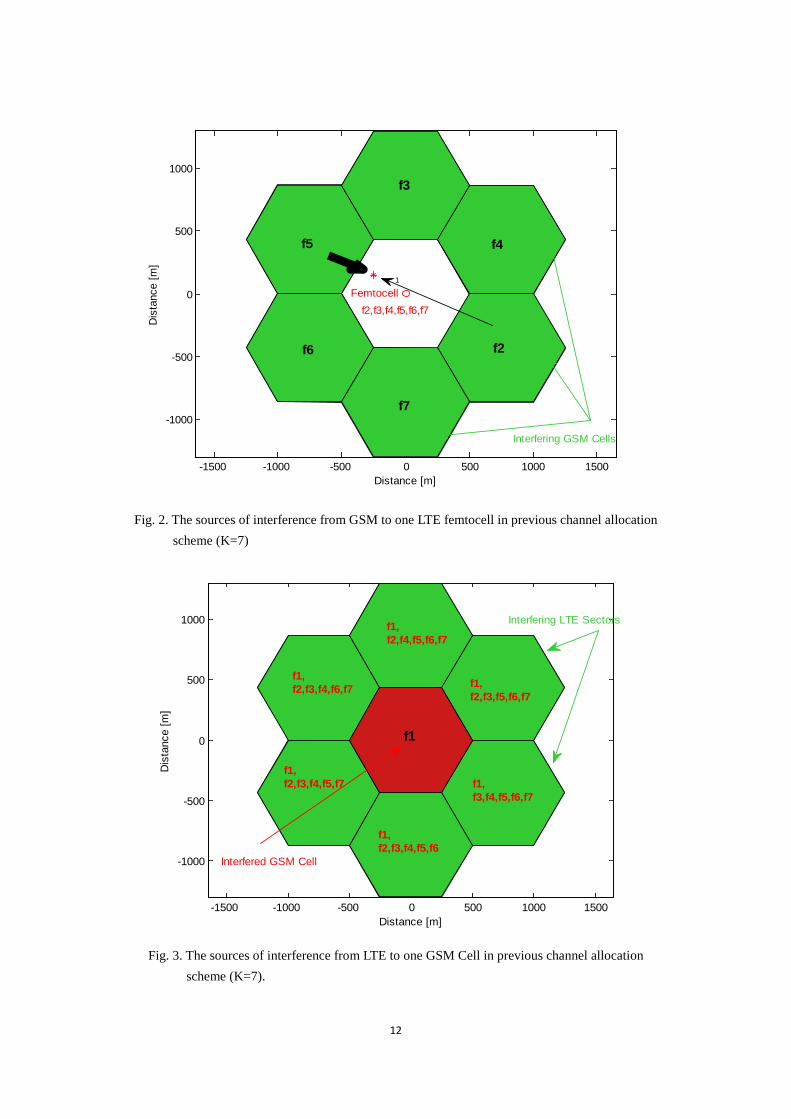
In this channel allocation scheme, each LTE femtocell is enabled to operate on all the GSM channels except those utilized by its master GSM macrocell. Channels are allocated indiscriminately without considering the path loss between the LTE femtocells and its interference source operating on those allocated channels. In Fig.2 and Fig. 3, an example with GSM frequency reuse factor K=7 is illustrated. The total GSM spectrum is divided into seven channel groups denoted
by 1 2 3 4 5 6 7{ , , , , , , }f f f f f f f . The femtocell deployed in the central GSM cell operating
on 1f can utilize all the other channel groups, i.e. 2 3 4 5 6 7{ , , , , , }f f f f f f and in this
paper these channels are named as Available GSM Spectrum Resources (AGSR) for the femtocell under discussion. As shown in Fig. 2, the channels allocated to the LTE femtocell receive interference from GSM users on the first tier. Some of the channel
groups are utilized by the femtocell with interferers in vicinity such as 3f , 5f and 6f ,
which will cause considerably higher interference. For instance, among the channels
utilized by this LTE femtocell, channel group as 5f will suffer more from interference
caused by GSM users than channel group 2f whose interfering source, GSM Cell 2,
is relatively further away. On the other hand, the LTE femtocell will also cause more interference to the base station (BS) in GSM Cell 5 than to the BS in GSM Cell 2 for the same reason on the distance difference. As for the BS in GSM Cell 1, the interference caused by LTE to the BS can come from LTE femtocells located at any
spot inside any cell on the first tier, due to the reason that the channel group 1f can be
allocated in its whole first tier under this channel allocation scheme, as shown in Fig. 3. Therefore, one way to improve the average SINR on each channel allocated to LTE
femtocells and maintain decent GSM SINR level is to avoid the 5f scenario shown
in Fig.2.
12
-1500 -1000 -500 0 500 1000 1500
-1000
-500
0
500
1000
1
2
3
45
6
7
f2,f3,f4,f5,f6,f7Femtocell
Interfering GSM Cells
Distance [m]
Dis
tanc
e [m
]
f3
f4
f2
f5
f6
f7
Fig. 2. The sources of interference from GSM to one LTE femtocell in previous channel allocation scheme (K=7)
-1500 -1000 -500 0 500 1000 1500
-1000
-500
0
500
1000
1
2
3
45
6
7
Interfered GSM Cell
Interfering LTE Sectors
Distance [m]
Dis
tanc
e [m
]
f1,f2,f3,f5,f6,f7
f1,f2,f4,f5,f6,f7
f1,f2,f3,f4,f6,f7
f1,f2,f3,f4,f5,f7
f1,f2,f3,f4,f5,f6
f1,f3,f4,f5,f6,f7
f1
Fig. 3. The sources of interference from LTE to one GSM Cell in previous channel allocation
scheme (K=7).
13
3.2.2 A Six-Sector Frequency Planning Scheme
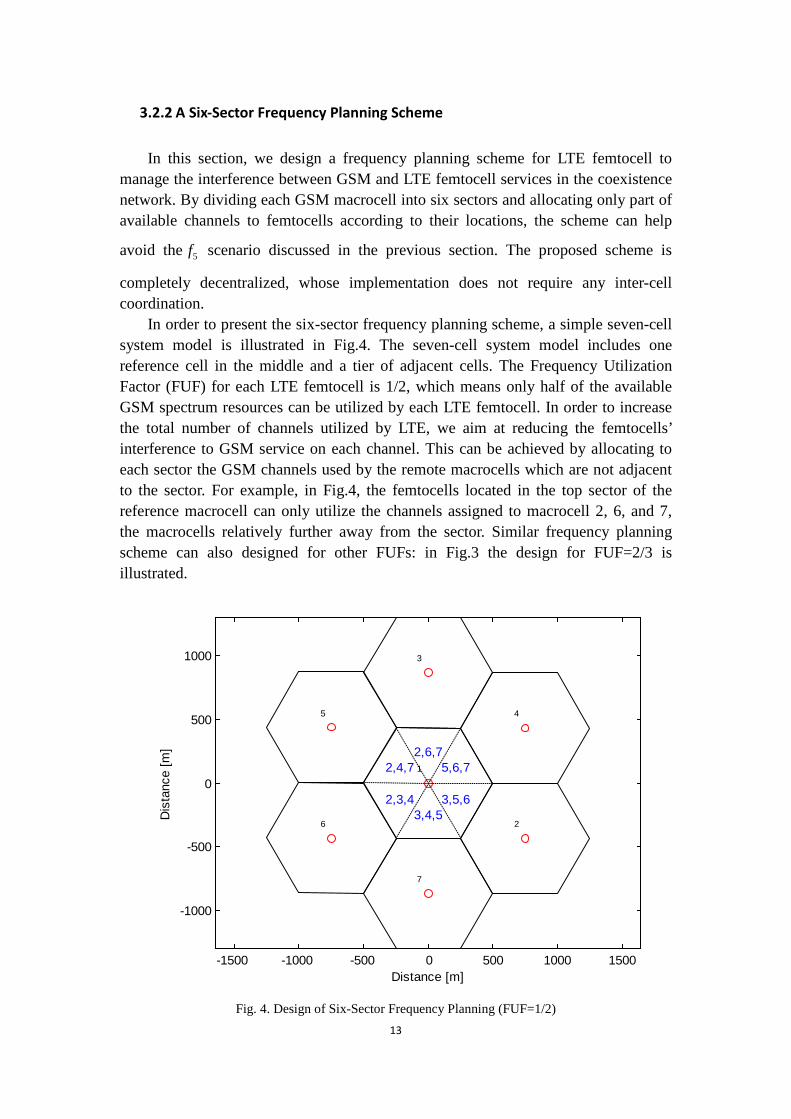
In this section, we design a frequency planning scheme for LTE femtocell to manage the interference between GSM and LTE femtocell services in the coexistence network. By dividing each GSM macrocell into six sectors and allocating only part of available channels to femtocells according to their locations, the scheme can help
avoid the 5f scenario discussed in the previous section. The proposed scheme is
completely decentralized, whose implementation does not require any inter-cell coordination.
In order to present the six-sector frequency planning scheme, a simple seven-cell system model is illustrated in Fig.4. The seven-cell system model includes one reference cell in the middle and a tier of adjacent cells. The Frequency Utilization Factor (FUF) for each LTE femtocell is 1/2, which means only half of the available GSM spectrum resources can be utilized by each LTE femtocell. In order to increase the total number of channels utilized by LTE, we aim at reducing the femtocells’ interference to GSM service on each channel. This can be achieved by allocating to each sector the GSM channels used by the remote macrocells which are not adjacent to the sector. For example, in Fig.4, the femtocells located in the top sector of the reference macrocell can only utilize the channels assigned to macrocell 2, 6, and 7, the macrocells relatively further away from the sector. Similar frequency planning scheme can also designed for other FUFs: in Fig.3 the design for FUF=2/3 is illustrated.
-1500 -1000 -500 0 500 1000 1500
-1000
-500
0
500
1000
1
2
3
45
6
7
2,6,7
3,4,5
2,4,7 5,6,7
2,3,4 3,5,6
Distance [m]
Dis
tanc
e [m
]
Fig. 4. Design of Six-Sector Frequency Planning (FUF=1/2)

14
-1500 -1000 -500 0 500 1000 1500
-1000
-500
0
500
1000
1
2
3
45
6
7
2,4,6,72,5,6,7
2,3,4,7 3,5,6,7
2,3,4,53,4,5,6
Distance [m]
Dis
tanc
e [m
]
Fig. 5. Design of Six-Sector Frequency Planning (FUF=2/3)
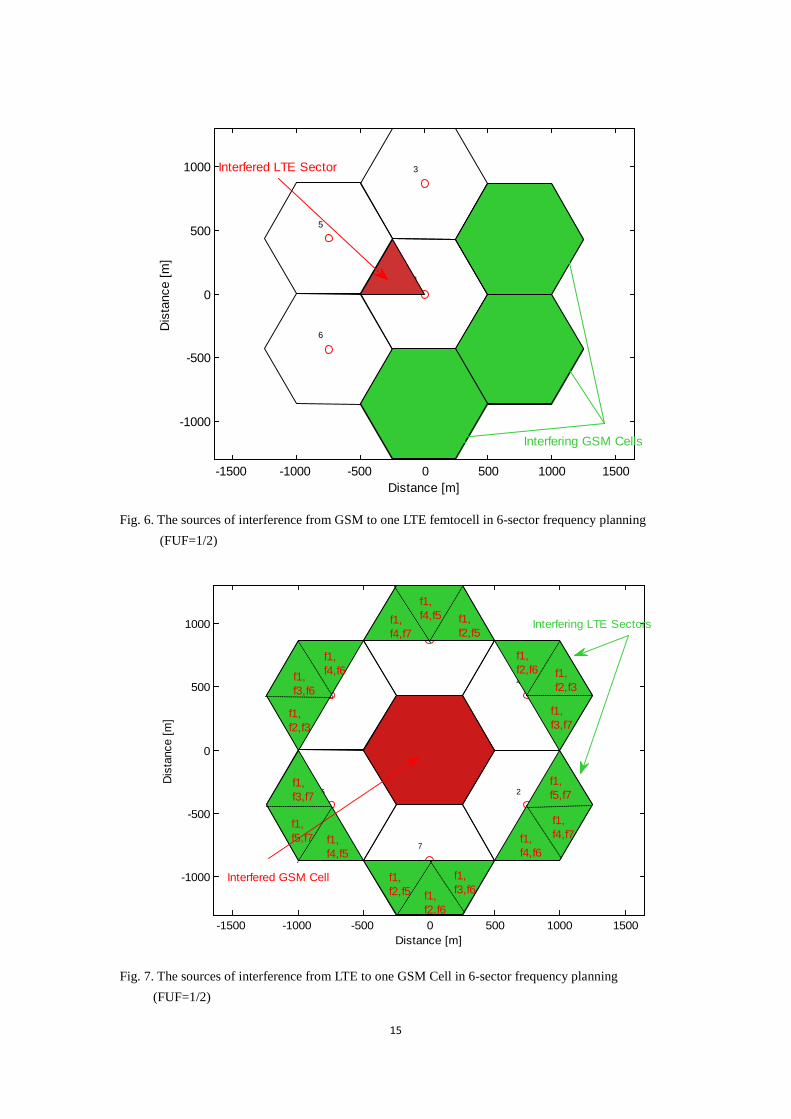
In the 6-sector frequency planning scheme, each channel is allocated with the consideration of path loss between the LTE femtocells and its GSM interfering cells which operate on that particular channel to be allocated. Each LTE femtocell is enabled to operate only on the channels utilized by the GSM macrocells outside its vicinity. In Fig.6 and Fig.7, with FUF=1/2, the same example of GSM frequency reuse factor K=7 is illustrated. From Fig. 6 we can see that the channels allocated to the LTE femtocells in the red sector of the central GSM macrocell receive interference only from GSM users in Macrocell 2, 4 and 7 on the first tier. Channel groups such
as 3f , 5f and 6f with interferers in vicinity are not allocated to the femtocell. On the
other hand, regarding the first-tier interference, each GSM base station only suffers from the interference caused by LTE femtocells located in the outer sectors, as shown in Fig. 7. Therefore, the proposed frequency planning scheme can help reduce the interference level on each co-used channel for both LTE femtocells and GSM base stations.
15
-1500 -1000 -500 0 500 1000 1500
-1000
-500
0
500
1000
1
2
3
45
6
7
Interfered LTE Sector
Interfering GSM Cells
Distance [m]
Dis
tanc
e [m
]
Fig. 6. The sources of interference from GSM to one LTE femtocell in 6-sector frequency planning (FUF=1/2)
-1500 -1000 -500 0 500 1000 1500
-1000
-500
0
500
1000
1
2
3
45
6
7
Interfered GSM Cell
Interfering LTE Sectors
Distance [m]
Dis
tanc
e [m
]
f1,f4,f5
f1,f3,f6
f1,f4,f6
f1,f2,f3
f1,f3,f7
f1,f5,f7 f1,
f4,f5
f1,f2,f5 f1,
f2,f6
f1,f3,f6
f1,f4,f6
f1,f5,f7
f1,f2,f3
f1,f3,f7
f1,f4,f7
f1,f2,f5
f1,f2,f6
f1,f4,f7
Fig. 7. The sources of interference from LTE to one GSM Cell in 6-sector frequency planning (FUF=1/2)
16
4. Simulator Description
4.1 Coexistence Network Simulator
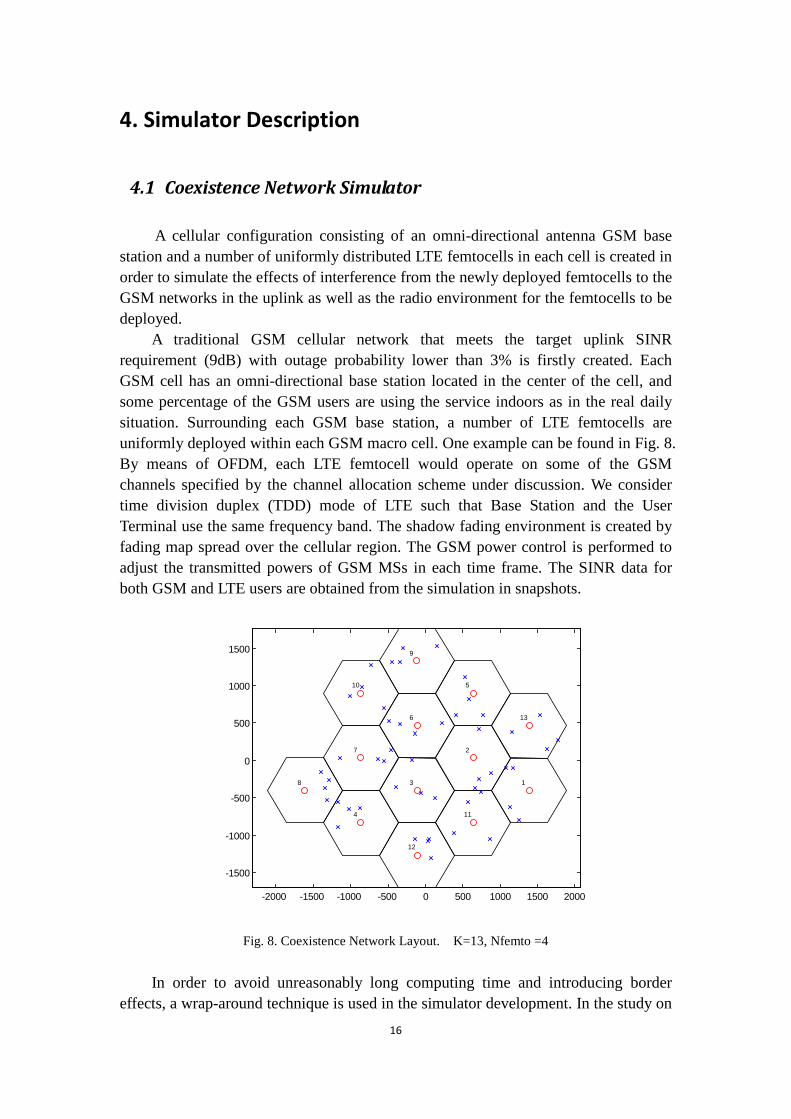
A cellular configuration consisting of an omni-directional antenna GSM base station and a number of uniformly distributed LTE femtocells in each cell is created in order to simulate the effects of interference from the newly deployed femtocells to the GSM networks in the uplink as well as the radio environment for the femtocells to be deployed.
A traditional GSM cellular network that meets the target uplink SINR requirement (9dB) with outage probability lower than 3% is firstly created. Each GSM cell has an omni-directional base station located in the center of the cell, and some percentage of the GSM users are using the service indoors as in the real daily situation. Surrounding each GSM base station, a number of LTE femtocells are uniformly deployed within each GSM macro cell. One example can be found in Fig. 8. By means of OFDM, each LTE femtocell would operate on some of the GSM channels specified by the channel allocation scheme under discussion. We consider time division duplex (TDD) mode of LTE such that Base Station and the User Terminal use the same frequency band. The shadow fading environment is created by fading map spread over the cellular region. The GSM power control is performed to adjust the transmitted powers of GSM MSs in each time frame. The SINR data for both GSM and LTE users are obtained from the simulation in snapshots.
-2000 -1500 -1000 -500 0 500 1000 1500 2000
-1500
-1000
-500
0
500
1000
1500
1
2
3
4
5
6
7
8
9
10
11
12
13
Fig. 8. Coexistence Network Layout. K=13, Nfemto =4
In order to avoid unreasonably long computing time and introducing border
effects, a wrap-around technique is used in the simulator development. In the study on

17
LTE exclusion region, the LTE femtocells are not deployed in the exclusion region but still uniformly deployed in the allowed region.
4.2 General Simulation Assumptions and Parameters
In order to simplify the design of simulator without loss of practicality, several assumptions are made in the simulation.
Each GSM channel can be fully utilized by LTE femtocells based on orthogonal frequency division multiplexing (OFDM) technology.
The BS and MS of a femtocell are not distinguished by GSM system because the separation between them is negligible compared to the size of GSM cell. Therefore a LTE femtocell is regarded as a single entity in the calculation of interference.
In TABLE 1, the common parameters used throughout all the simulations have been listed.
TABLE 1: Common Parameters used in the simulation
Parameter Value
GSM Cellular layout Antenna sectors
Reuse factor (number of cells/cluster) Macrocell Radius [m] Femtocell Radius [m]
GSM Spectrum bandwidth at disposal Carrier frequency
GSM indoor user probability Target SINR of GSM
Target Outage Probability of GSM Macrocell Path loss exponents
Macrocell Gain at 1 meter distance Femtocell Path loss exponents
Femtocell Gain at 1 meter distance Femtocell Wall Penetration loss
Wall Penetration loss for indoor GSM Standard deviation for the lognormal fading (Macro)
Lognormal fading correlation distance (Macro) Noise spectrum density
Noise figure Maximum GSM mobile terminals transmitted power LTE mobile terminals transmitted power (constant)
GSM power control RXLEV
Hexagonal 1
7, 9, 12 300,400,500,600,700,800,900,1000
20 20MHz 1.8GHz
50% 9 dB 3% 3.52
-30.6dB 2
-37.5dB 5dB 5dB 6 dB 110m
-174dBm 5dB
30dBm 6dBm
-73 dBm

18
GSM power control RXQUAL GSM power control a
GSM power control β
9 dB 0.5
0.5

19
5. Simulation Results
5.1 GSM’s Impact on LTE Femtocell Performance
In this section, the impact on LTE femtocells performances by factors of GSM network is studied via simulation. In this part of our study, the channel allocation scheme previously introduced in [4] is adopted, where each LTE femtocell in the coexistence network utilizes its own due available spectrum resources, i.e. all the GSM channels except those allocated to its master GSM macrocell.
5.1.1 Impact of GSM Cell Size and Frequency Reuse Factor
In the coexistence network, the GSM cell size can have great impact on the GSM users’ received signal powers, and the interference between femtocell user equipments and their neighboring GSM cells. In the network with larger GSM macrocells, the GSM uplink received signal powers are expected to be higher in general due to shorter communication distance; however, the interference to GSM base stations and LTE femtocells are also expected to be mounted for the same reason. As for the GSM frequency reuse factor, GSM users in a network with smaller frequency reuse factor are expected to be more vulnerable to additive interference from the newly deployed LTE femtocells than users in one with bigger reuse factor. This may affect the maximal number of accommodated femtocells and other aspects LTE femtocells’ performances.
To get a clear view on the relationship between the GSM cell radius/GSM frequency reuse factor and femtocell performance, a study based on simulation is conducted. In TABLE 2., the configuration parameters for the simulation are listed. Three reuse factors and a number of macrocell radius are studied under the condition that the target GSM outage probability is lower than 5%.
TABLE 2: Configuration Parameters
Parameter Value Reuse factor (number of cells/cluster) 7, 9, 12 Macrocell Radius [m] 300,400,500,600,700,800,900,1000 Traffic load 1.0 Target Outage Probability of GSM in Coexistence Net.
5%

20
300 400 500 600 700 800 900 10001
2
3
4
5
6
7
Cell Radius [m]
Max
imum
Num
ber o
f Fem
toce
ll pe
r Mac
roce
ll (M
)
K=7K=9K=12
Fig. 9. Maximum Number of Femtocell per Macrocell (M) versus Cell Radius of GSM Macrocell (R)
Fig.9. shows how the maximum number of accommodated LTE femtocells per
GSM macrocell changes as the cell radius increases for three different reuse factor scenarios. The maximum number of accommodated LTE femtocells tends to decrease as the cell radius increases except from R=300m to R=400m when reuse factor 7 is adopted. This exception can be ascribed to ineffectiveness of the GSM power control technique in the simulator when a small cell with a small reuse factor is adopted. We can also observe that network with larger GSM frequency reuse factor can accommodate greater number of LTE femtocells in each macrocell with a certain cell radius.

21
300 400 500 600 700 800 900 10001.3
1.35
1.4
1.45
1.5
1.55
1.6x 10
5
Cell Radius [m]
Ave
rage
Fem
toce
ll Th
roug
hput
(AFT
) [kb
its/s
]
K=7K=9K=12
Fig. 10. Average Femtocell Throughput (AFT) versus Cell Radius (R)
From Fig.10, we can see that the average throughput capacity supported by
each individual LTE femtocell deployed in the coexistence network increases as the GSM Cell Radius grows. In a network with larger GSM cells, the LTE femtoells are deployed in a more dispersed manner within each macrocell. This will reduce the inter-femtocell interference, and thus increase the average SINR of each femtocell. Also, we can observe that among the three GSM frequency reuse factors used in our study, reuse factor 9 gives the highest Average Femtocell Throughput when all other parameters are the same.

22
300 400 500 600 700 800 900 10000
0.5
1
1.5
2
2.5
3
3.5x 10
4
Cell Radius [m]
Fem
toce
ll Th
roug
hput
Sta
ndar
d D
evia
tion
(FTS
TD) [
kbits
/s]
K=7K=9K=12
Fig. 11. Femtocell Throughput Standard Deviation (FTSTD) versus Cell Radius (R)
As the average femtocell throughput ascends, the standard deviation,
however, declines as the cell radius increases, which is shown in Fig.11. The drop of the standard deviations indicates that the throughput capacity supported by each LTE femtocell becomes less variable as the GSM macro cell radius of the network increases. For the same cell radius, network with smaller reuse factor has lower Femtocell Throughput Standard Deviation (FTSTD).
300 400 500 600 700 800 900 10000
0.5
1
1.5
2
2.5
3
3.5
Cell Radius [m]
Ave
rage
Are
a Th
roug
hput
(AA
T) [k
bits
/s/(m
2 )]
K=7K=9K=12
Fig. 12. Average Area Throughput versus Cell Radius

23
. Fig.12. shows that that the Average Area Throughput (AAT) of the whole network
declines as the Cell Radius (R) of GSM macrocell increases. This indicates that in the process of cell radius growing, the increase of Average Femtocell Throughput is slower than the increase of network coverage area. We can also find that the change of AAT during this process can be dramatic; for example, the AAT drops from 1.369 to 0.2415 when the cell radius grows from 500m to 1000m in the case that K=12. Moreover, Fig. 12 shows that in one network with a certain cell radius, larger GSM frequency reuse factors give larger LTE Average Area Throughput.
Based on all the results shown above, we find that it is more desirable to deploy LTE femtocells in larger GSM cells if the throughput performance of each individual LTE femtocell is the major concern. On the other hand, if it is the utilization of GSM spectrum by LTE femtocells that we are concerning about, the femtocells should be deployed in a GSM network with smaller macrocells and larger frequency reuse factors.
5.1.2 Impact of GSM Traffic Load
As more and more users migrate to UMTS and LTE networks accompanied with the advent of Voice over LTE (VoLTE), the traffic load in GSM network is expected to continuously decline in the future. In this context, how the traffic change would impact on the LTE femtocell network performance is one of the interests in our study.
The GSM traffic load in the study is defined as the probability that each allocated GSM channel in a cell is occupied. For example, to simulate the coexistence network with 50% GSM traffic load, the GSM macro-cells of interest are fully loaded, whereas each channel allocated to each surrounding macro-cell has the probability of 50% to be occupied in the snapshot, i.e. the surrounding macro-cells are 50% loaded. The impact of GSM traffic load is studied in the simulation with special parameters listed in TABLE 3.
TABLE 3: Configuration Parameters
Parameter Value
Reuse factor (number of cells/cluster) 7, 9, 12 Macrocell Radius [m] 500 Traffic load 0.5, 0.6, 0.7, 0.8 0.9, 1.0 Target Outage Probability of GSM in Coexistence Net.
5%

24
0.5 0.55 0.6 0.65 0.7 0.75 0.8 0.85 0.9 0.95 13.5
4
4.5
5
5.5
6
6.5
7
7.5
GSM Traffic Load
Max
imum
Num
ber o
f LTE
Fem
toce
lls p
er G
SM
cel
l
K=7K=9K=12
Fig. 13. Maximum Number of Femtocell per Macrocell (M) versus GSM Traffic Load
0.5 0.55 0.6 0.65 0.7 0.75 0.8 0.85 0.9 0.95 10.8
0.9
1
1.1
1.2
1.3
1.4
1.5
1.6
1.7
1.8
GSM Traffic Load
Ave
rage
Are
a Th
roug
hput
(AA
T) [k
bits
/s/(m
2 )]
K=7K=9K=12
Fig. 14. Average Area Throughput versus GSM Traffic Load

25
Fig.13. shows that the Maximum Number of Femtocell per Macrocell that can be accommodated by the coexistence network tends to increase as the GSM traffic load drops. This is not difficult to interpret, given that less GSM traffic means less co-channel interference between GSM users and thus more interference produced by LTE femtocells can be tolerated under the same GSM outage probability. From Fig.14, we can see that the Average Area Throughput also tends to increase as the GSM traffic load drops: for K=7, the average area throughput increases for 52% when the GSM traffic load decreases from 1 to 0.5. However the pronounced increase happens only when the Maximum Number of Femtocell per Macrocell jumps to a higher value. When the Maximum Number of Femtocell per Macrocell stays unchanged as the GSM traffic load declines, it increases almost indiscernibly.
0.5 0.55 0.6 0.65 0.7 0.75 0.8 0.85 0.9 0.95 11.41
1.42
1.43
1.44
1.45
1.46
1.47
1.48
1.49
1.5
1.51x 10
5
GSM Traffic Load
Ave
rage
Fem
toce
ll Th
roug
hput
(AFT
) [kb
its/s
]
K=7K=9K=12
Fig. 15. Average Femtocell Throughput (AFT) versus GSM Traffic Load
Fig.15. shows that the Average Femtocell Throughput is not very sensitive to the
change of GSM traffic load. The change does not even go beyond 2% when the traffic load declines from 1 to 0.5. This indicates that under this channel allocation scheme, the major interference source to a LTE femtocell is other LTE femtocells deployed in the same macrocell and operating on the same spectrum. The change of GSM traffic does not have great impact on its SINR.

26
5.2 Results for LTE Femtocell Exclusion Region
In the network with LTE femtocell exclusion region (ER), the GSM received SINRs are expected to be higher than those received in the network with same parameters but without delimited exclusion region. On the other hand, the LTE received SINRs are expected to be lower in the network with ER due to increased inter-femtocell interference. Adopting the LTE femtocell channel allocation scheme proposed in [4], the impact of exclusion region on the coexistence network performance has been investigated in the simulation with configuration parameters listed in TABLE 4.
TABLE 4: Configuration Parameters
Parameter Value
Reuse factor (number of cells/cluster) 7, 9, 12 Macrocell Radius [m] 500 Traffic load 1.0 Normalized Exclusion Width [R] 0, 0.1, 0.2, 0.3, 0.4, 0.5, 0.6, 0.7, 0.8, 0.9 Target Outage Probability of GSM in Coexistence Net.
5%
27
2 4 6 8 10 12 14 16 180
0.05
0.1
0.15
0.2
0.25
GSM SINR [dB]
Per
cent
age
GSM SINR CDF
Rexc=0
Rexc=0.5R
Rexc=0.9R
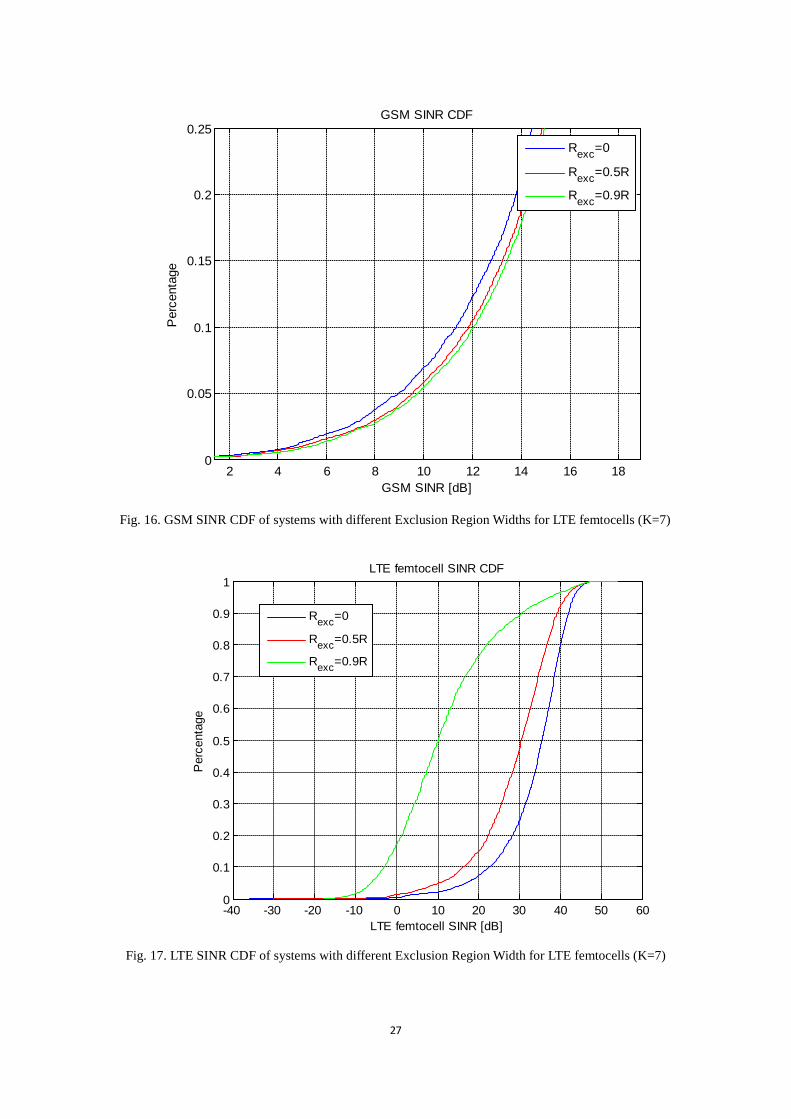
Fig. 16. GSM SINR CDF of systems with different Exclusion Region Widths for LTE femtocells (K=7)
-40 -30 -20 -10 0 10 20 30 40 50 600
0.1
0.2
0.3
0.4
0.5
0.6
0.7
0.8
0.9
1
LTE femtocell SINR [dB]
Per
cent
age
LTE femtocell SINR CDF
Rexc=0
Rexc=0.5R
Rexc=0.9R
Fig. 17. LTE SINR CDF of systems with different Exclusion Region Width for LTE femtocells (K=7)
28
From Fig.16 and Fig.17, we find the simulation results meet our expectations about the comparison on GSM and LTE SINRs between the network with ER and one without. In the network with ER, the GSM SINRs are generally higher while the LTE SINRs are lower in comparison. Besides, the general GSM SINR ascends as the Exclusion Region Width increases, which coincides with the conclusion drawn in [4] that it is desirable to deploy the femtocells near the center of the GSM cell in order to protect the GSM service. On the other hand, the increase of Exclusion Region Width narrows down the inter-femtocell distance in each macrocell, and thus increases interference coming from each other. Therefore, the LTE femtocell SINR decrease in general as the exclusion region width grows up. Now we would like to study in detail how the coexistence network performance changes as the exclusion region does. We choose the coexistence network with GSM cell radius R=500 m and frequency reuse factor K=7.
0 0.1 0.2 0.3 0.4 0.5 0.6 0.7 0.8 0.90.4
0.6
0.8
1
1.2
1.4
1.6
1.8
2
Normalized Exclusion Width [R]
Ave
rage
Are
a Th
roug
hput
(AA
T) [k
bits
/s/(m
2 )]
K=7K=9K=12
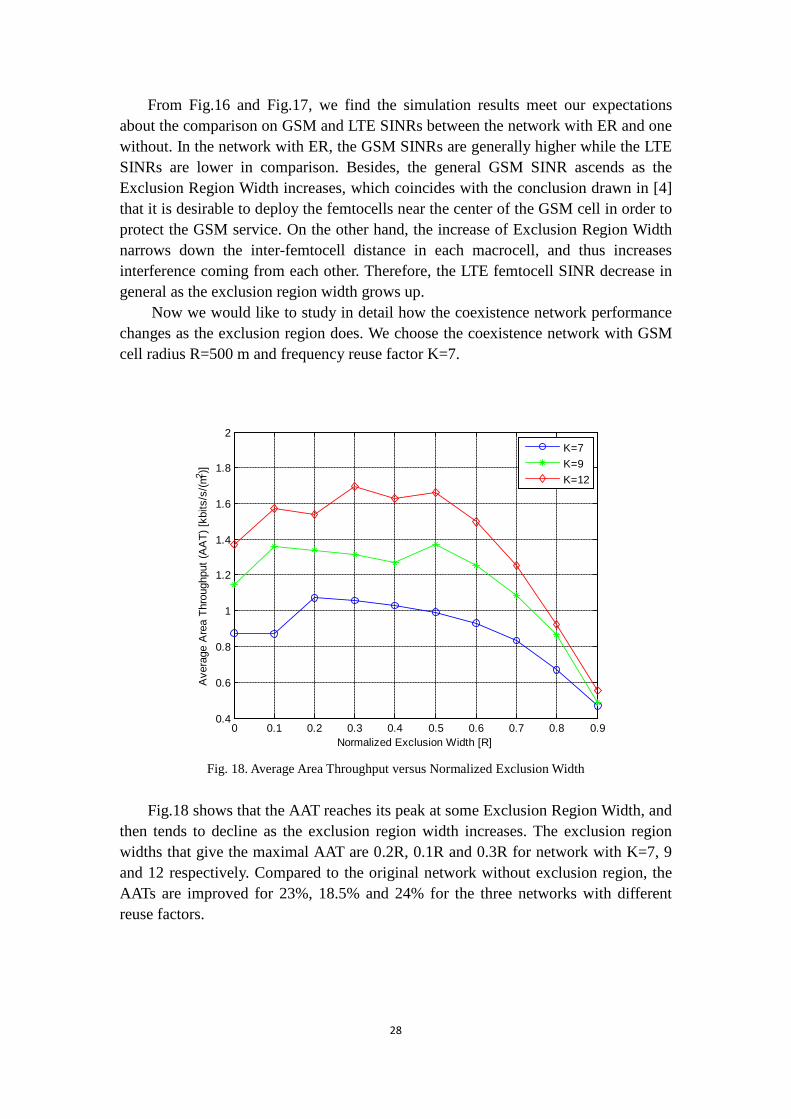
Fig. 18. Average Area Throughput versus Normalized Exclusion Width
Fig.18 shows that the AAT reaches its peak at some Exclusion Region Width, and
then tends to decline as the exclusion region width increases. The exclusion region widths that give the maximal AAT are 0.2R, 0.1R and 0.3R for network with K=7, 9 and 12 respectively. Compared to the original network without exclusion region, the AATs are improved for 23%, 18.5% and 24% for the three networks with different reuse factors.
29
0 0.1 0.2 0.3 0.4 0.5 0.6 0.7 0.8 0.92
4
6
8
10
12
14
16x 10
4
Normalized Exclusion Width [R]
Ave
rage
Fem
toce
ll Th
roug
hput
(AFT
) [kb
its/s
]
K=7K=9K=12
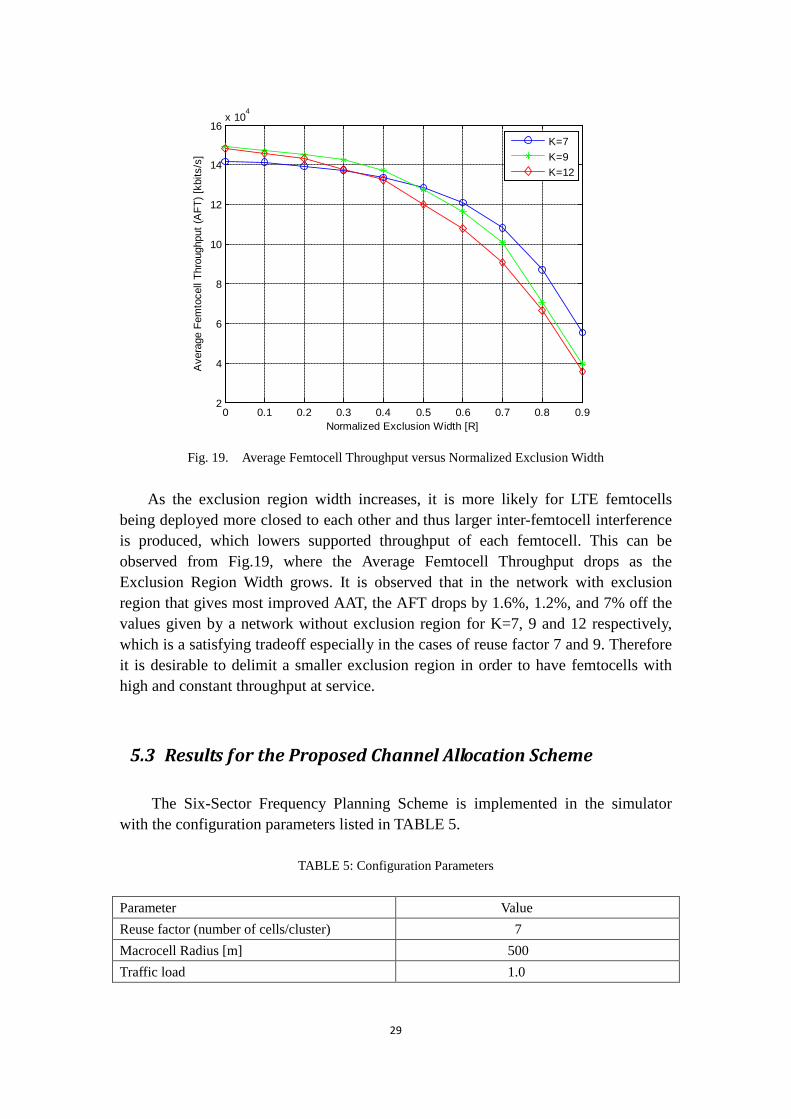
Fig. 19. Average Femtocell Throughput versus Normalized Exclusion Width
As the exclusion region width increases, it is more likely for LTE femtocells
being deployed more closed to each other and thus larger inter-femtocell interference is produced, which lowers supported throughput of each femtocell. This can be observed from Fig.19, where the Average Femtocell Throughput drops as the Exclusion Region Width grows. It is observed that in the network with exclusion region that gives most improved AAT, the AFT drops by 1.6%, 1.2%, and 7% off the values given by a network without exclusion region for K=7, 9 and 12 respectively, which is a satisfying tradeoff especially in the cases of reuse factor 7 and 9. Therefore it is desirable to delimit a smaller exclusion region in order to have femtocells with high and constant throughput at service.
5.3 Results for the Proposed Channel Allocation Scheme
The Six-Sector Frequency Planning Scheme is implemented in the simulator with the configuration parameters listed in TABLE 5.
TABLE 5: Configuration Parameters
Parameter Value Reuse factor (number of cells/cluster) 7 Macrocell Radius [m] 500 Traffic load 1.0

30
0.02 0.025 0.03 0.035 0.04 0.045 0.05 0.055 0.06 0.065 0.070
0.5
1
1.5
2
2.5
GSM Outage Probability
Ave
rage
Are
a Th
roug
hput
(AA
T) [k
bits
/s/(m
2 )]
6-sector Freq Plan (FUF=1/2)6-sector Freq Plan (FUF=2/3)Random Freq Alloc (FUF=1/2)Previous Freq Alloc (FUF=1)
Fig. 20. Average Area Throughput versus GSM Outage Probability with 4 different channel allocation schemes.
Fig.20 is obtained by simulation and curve fitting. From the figure we can see
that the LTE Average Area Throughput is considerably increased in our 6-sector frequency planning scheme with FUF as 2/3 and 1/2. With the GSM outage probability equal to 5%, the AAT provided by our scheme with FUF =1/2 is more than twice of the one given by the previously proposed scheme. Disregarding the femtocells’ locations in its channel allocation, the random frequency allocation scheme with FUF 1/2 has very close performance to the previously proposed full FUF scheme and turns out to be greatly outperformed by its counterpart in the 6-sector frequency planning scheme.
It is also very interesting to compare the performance of the different schemes when in those schemes the GSM channels are utilized by LTE femtocells for the same total number of times. This can be achieved by comparing the GSM outage probabilities and LTE average area throughputs in the coexistence networks with different channel allocation schemes but the same spectrum sharing factor (SSF).

31
0 10 20 30 40 50 600.02
0.03
0.04
0.05
0.06
0.07
0.08
0.09
0.1
Spectrum Sharing Factor
GS
M O
utag
e P
roba
bilit
y
Previous Freq Alloc (FUF=1)6-sector Freq Plan (FUF=2/3)6-sector Freq Plan (FUF=1/2)
Fig. 21. GSM Outage Probability versus Spectrum Sharing Factor for three schemes
0 10 20 30 40 50 600
0.5
1
1.5
2
2.5
Spectrum Sharing Factor
Ave
rage
Are
a Th
roug
hput
(AA
T) [k
bits
/s/(m
2 )]
Previous Freq Alloc (FUF=1)6-sector Freq Plan (FUF=2/3)6-sector Freq Plan (FUF=1/2)
Fig. 22. Average Area Throughput versus Spectrum Sharing Factor for the three schemes
32
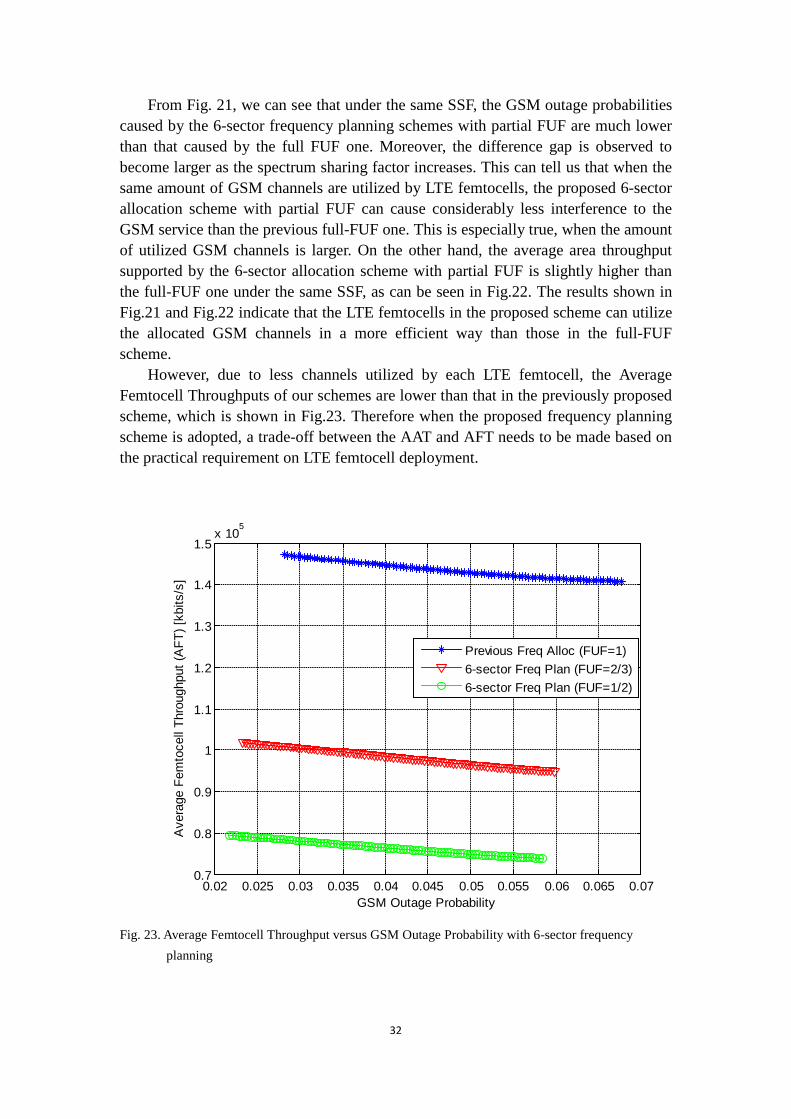
From Fig. 21, we can see that under the same SSF, the GSM outage probabilities caused by the 6-sector frequency planning schemes with partial FUF are much lower than that caused by the full FUF one. Moreover, the difference gap is observed to become larger as the spectrum sharing factor increases. This can tell us that when the same amount of GSM channels are utilized by LTE femtocells, the proposed 6-sector allocation scheme with partial FUF can cause considerably less interference to the GSM service than the previous full-FUF one. This is especially true, when the amount of utilized GSM channels is larger. On the other hand, the average area throughput supported by the 6-sector allocation scheme with partial FUF is slightly higher than the full-FUF one under the same SSF, as can be seen in Fig.22. The results shown in Fig.21 and Fig.22 indicate that the LTE femtocells in the proposed scheme can utilize the allocated GSM channels in a more efficient way than those in the full-FUF scheme.
However, due to less channels utilized by each LTE femtocell, the Average Femtocell Throughputs of our schemes are lower than that in the previously proposed scheme, which is shown in Fig.23. Therefore when the proposed frequency planning scheme is adopted, a trade-off between the AAT and AFT needs to be made based on the practical requirement on LTE femtocell deployment.
0.02 0.025 0.03 0.035 0.04 0.045 0.05 0.055 0.06 0.065 0.070.7
0.8
0.9
1
1.1
1.2
1.3
1.4
1.5x 10
5
GSM Outage Probability
Ave
rage
Fem
toce
ll Th
roug
hput
(AFT
) [kb
its/s
]
Previous Freq Alloc (FUF=1)6-sector Freq Plan (FUF=2/3)6-sector Freq Plan (FUF=1/2)
Fig. 23. Average Femtocell Throughput versus GSM Outage Probability with 6-sector frequency planning
33
6. Conclusions and Future Work
In this thesis, the impacts of several GSM factors on the LTE femtocell performance have been evaluated in the coexistence network. Aiming at reducing the LTE’s interference to GSM, we delimit a region on the outskirt of each GSM macrocell where no LTE femtocell is deployed, which is named as femtocell exclusion region. Moreover, in the pursuit of improved spectrum sharing performance, a 6-sector frequency planning scheme is proposed in the coexistence network. The scheme divides a GSM macrocell into six sectors and allocates available GSM channels to each LTE femtocell based on the information that in which sector the femtocell is located.
In the study of GSM’s impact, we find that the average femtocell throughput (AFT) increases as macrocell radius grows, but the average area throughput (AAT) decreases in the mean time. Also, in the network with full GSM traffic load, larger frequency reuse factor gives larger average area throughput. Therefore, it is more desirable to deploy LTE femtocells in larger GSM cells if the throughput performance of each individual LTE femtocell is the major concern. On the other hand, if it is the utilization of GSM spectrum by LTE femtocells that we are mainly concerning about, the femtocells are preferably deployed in a GSM network with smaller macrocells and larger frequency reuse factors. As for the impact of GSM traffic load, we find that the network’s average area throughput tends to increase as the GSM traffic load drops. However, the average femtocell throughput is not very sensitive to that change.
In this thesis, the effects of femtocell exclusion region are also investigated. With exclusion region delimited properly, the network’s average area throughput supported by LTE femtocells can be increased by 23%, 18.5% and 24% with loss of only 1.6%, 1.2%, and 7% in the average femtocell throughput for K=7, 9 and 12 respectively. This result indicates that it is advisable to delimit proper femtocell exclusion regions to improve the spectrum utilization. To further boost the LTE’s utilization of GSM channels, we proposed a 6-sector frequency planning scheme. Our scheme is compared with previously proposed channel allocation and random allocation schemes. It is observed that our scheme can make a tradeoff between the system’s average area throughput and the average femtocell throughput by adjusting the adopted frequency utilization factor (FUF). The simulation results show our scheme with partial-FUF outperforms both previously proposed and random allocation in terms of giving higher average area throughput and causing lower GSM outage probability. However due to less channels allocated to each femtocell in partial-FUF scheme, the average femtocell throughput is lower than what is supported by the full-FUF one. This enables our frequency planning scheme to be applied in a network with higher concern on overall spectrum utilization than individual femtocell’s throughput capacity.
In the future research, a more realistic system model should be used to help obtain results close to the real situation. Dynamic Channel Allocation Schemes based on 6-sector frequency planning can also be designed and investigated to adapt to the
34
changing traffic demands within each femtocell and further improve the system’s performance. Also, an upper bound value for LTE’s utilization of GSM spectrum can be studied by solving formulated optimization problems, which can also shed some light on the pursuit of optimal channel allocation scheme for the coexistence network.
35
References
[1] T. Norman, “The Road to LTE for GSM and UMTS Operators”, Analysis Mason Ltd. White Paper, Jan. 2009
[2] “Spectrum Analysis for Future LTE Deployments”, Motorola, Inc., white paper, 2007 [3] GSM Association - http://www.gsmworld.com. [4] K.W.Sung, L. Shi and J. Zander “Coexistence of LTE Femtocells with GSM Cellular
Network” [5] T.S. Rappaport, Wireless Communications: Principles and Practice, 2nd ed. New Jersey:
Prentice Hall, 2001 [6] Håkan Olofsson, Jonas Näslund, and Johan Sköld, ”Interference Diversity Gain in Frequency
Hopping GSM”, in 45th IEEE Vehicular Technology Conference, 1995 [7] Jörg Eberspächer and Hans-Jörg Vögel, GSM Switching, Services and Protocols, page 82,
WILEY 1999. [8] Fredrik Hägglund, “ Improved Power Control for GSM/EDGE” Master’s Thesis “ Luleå
University of Technology, Sweden, 2005 [9] M.J.Nawrocki, M.Dohler, and A.H.Aghvami, Understanding UMTS Radio Network Modelling,
Planning and Automated Optimisation, Chichester: John Wiley & Sons, 2006 [10] E. Dahlman, S. Parkvall, J. Skold and P. Beming, “3G Evolution HSPA and LTE for Mobile
Broadband 2nd edition”, Elsevier 2008. [11] Chandrasekhar, V. and Andrews, J. “Uplink Capacity and Interference Avoidance for Two-tier
Femtocell Networks” IEEE Trans. On Wireless Communications, VOL. 8, NO. 7, 2009 [12] Mogensen, P. and etc. “LTE Capacity Compared to the Shannon Bound” Vehicular
Technology Conference, 2007 [13] Yasuda, H. and etc. “A Study on Spectrum Sharing for Heterogeneous Networks Using Full
3D Area Model” World Telecommunications Congress (WTC), 2012. [14] Gia Khanh Tran and etc. “Spectrum Allocation Strategies for Heterogeneous Networks”,
Cognitive Radio Oriented Wireless Networks and Communcations (CROWNCOM), 2011
36
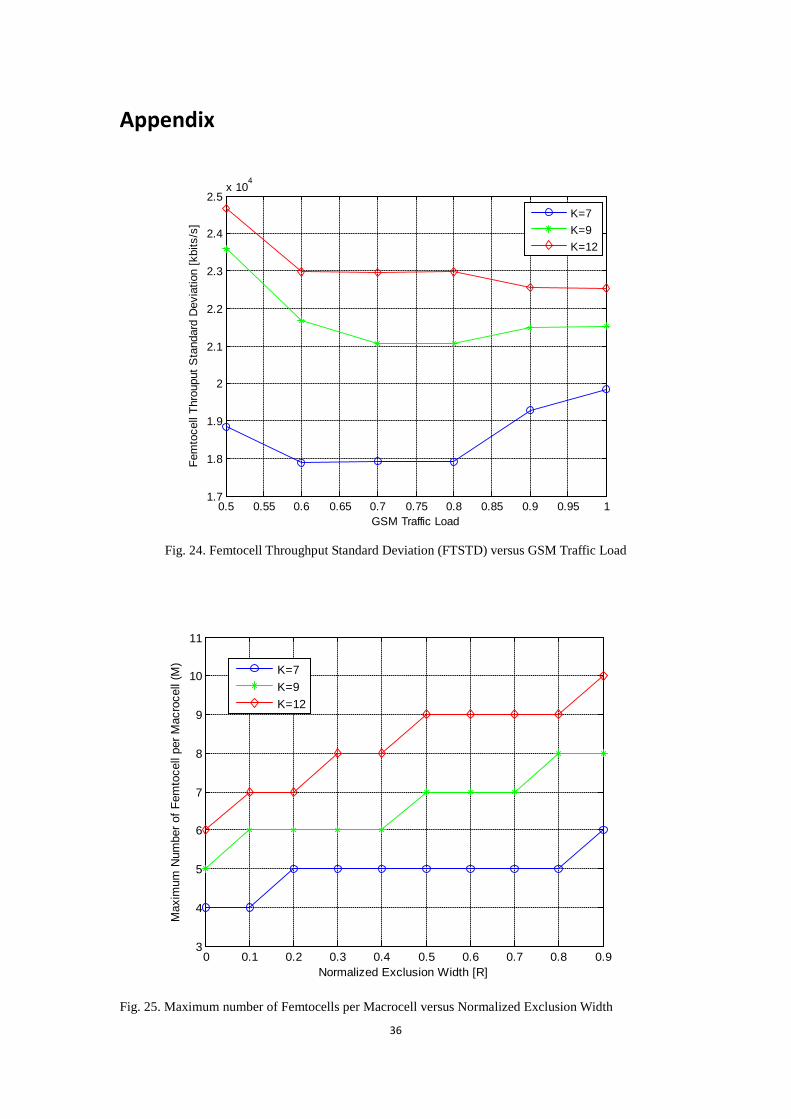
Appendix
0.5 0.55 0.6 0.65 0.7 0.75 0.8 0.85 0.9 0.95 11.7
1.8
1.9
2
2.1
2.2
2.3
2.4
2.5x 10
4
GSM Traffic Load
Fem
toce
ll Th
roup
ut S
tand
ard
Dev
iatio
n [k
bits
/s]
K=7K=9K=12
Fig. 24. Femtocell Throughput Standard Deviation (FTSTD) versus GSM Traffic Load
0 0.1 0.2 0.3 0.4 0.5 0.6 0.7 0.8 0.93
4
5
6
7
8
9
10
11
Normalized Exclusion Width [R]
Max
imum
Num
ber o
f Fem
toce
ll pe
r Mac
roce
ll (M
)
K=7K=9K=12
Fig. 25. Maximum number of Femtocells per Macrocell versus Normalized Exclusion Width

37
0 0.1 0.2 0.3 0.4 0.5 0.6 0.7 0.8 0.91.5
2
2.5
3
3.5
4
4.5x 10
4
Normalized Exclusion Width [R]
Fem
toce
ll Th
roug
hput
Sta
ndar
d D
evia
tion
(FTS
TD) [
kbits
/s]
K=7K=9K=12
Fig. 26. Femtocell Throughput Standard Deviation versus Normalized Exclusion Width
38
List of Figures
Fig. 1. Previous channel allocation scheme .......................................................... 11 Fig. 2. The sources of interference from GSM to one LTE femtocell in previous
channel allocation .......................................................................................... 12 Fig. 3. The sources of interference from LTE to one GSM Cell in previous
channel allocation .......................................................................................... 12 Fig. 4. Design of Six-Sector Frequency Planning (FUF=1/2) .............................. 13 Fig. 5. Design of Six-Sector Frequency Planning (FUF=2/3) .............................. 14 Fig. 6. The sources of interference from GSM to one LTE femtocell in 6-sector
frequency planning (FUF=1/2) ...................................................................... 15 Fig. 7. The sources of interference from LTE to one GSM Cell in 6-sector
frequency planning (FUF=1/2) ...................................................................... 15 Fig. 8. Coexistence Network Layout. K=13, Nfemto =4 ................................... 16 Fig. 9. Maximum Number of Femtocell per Macrocell (M) versus Cell Radius of
GSM Macrocell (R) ....................................................................................... 20 Fig. 10. Average Femtocell Throughput (AFT) versus Cell Radius (R) ............... 21 Fig. 11. Femtocell Throughput Standard Deviation (FTSTD) versus Cell Radius
(R) .................................................................................................................. 22 Fig. 12. Average Area Throughput versus Cell Radius ......................................... 22 Fig. 13. Maximum Number of Femtocell per Macrocell (M) versus GSM Traffic
Load ............................................................................................................... 24 Fig. 14. Average Area Throughput versus GSM Traffic Load .............................. 24 Fig. 15. Average Femtocell Throughput (AFT) versus GSM Traffic Load .......... 25 Fig. 16. GSM SINR CDF of systems with different Exclusion Region Widths for
LTE femtocells (K=7) .................................................................................... 27 Fig. 17. LTE SINR CDF of systems with different Exclusion Region Width for
LTE femtocells (K=7) .................................................................................... 27 Fig. 18. Average Area Throughput versus Normalized Exclusion Width ............. 28 Fig. 19. Average Femtocell Throughput versus Normalized Exclusion Width . 29 Fig. 20. Average Area Throughput versus GSM Outage Probability with 4
different channel allocation schemes. ............................................................ 30 Fig. 21. GSM Outage Probability versus Spectrum Sharing Factor for three
schemes .......................................................................................................... 31 Fig. 22. Average Area Throughput versus Spectrum Sharing Factor for the three
schemes .......................................................................................................... 31 Fig. 23. Average Femtocell Throughput versus GSM Outage Probability with
6-sector frequency planning ........................................................................... 32 Fig. 24. Femtocell Throughput Standard Deviation (FTSTD) versus GSM Traffic
Load ............................................................................................................... 36 Fig. 25. Maximum number of Femtocells per Macrocell versus Normalized
39
Exclusion Width ............................................................................................. 36 Fig. 26. Femtocell Throughput Standard Deviation versus Normalized Exclusion
Width .............................................................................................................. 37

40
List of Tables
TABLE 1: Common Parameters used in the simulation ....................................... 17 TABLE 2: Configuration Parameters .................................................................... 19 TABLE 3: Configuration Parameters .................................................................... 23 TABLE 4: Configuration Parameters .................................................................... 26 TABLE 5: Configuration Parameters .................................................................... 29
41
List of Acronyms AAT AFT AGSR BS ER FTSTD FUF GSM LTE MS OFDM SSF SINR TDD
Average Area Throughput Average Femtocell Throughput Available GSM Spectrum Resources Base Station Exclusion Region Femtocell Throughput Standard Deviation Frequency Utilization Factor Global System for Mobile Communications Long Term Evolution Mobile Stations Orthogonal Frequency- Division Multiplexing Spectrum Sharing Factor Signal to Interference plus Noise Ratio Time-Division Duplexing
www.kth.se
TRITA-ICT-EX-2012:101