
PERFORMANCE EVALUATION OF IoT PLATFORMS IN GREEN …
63
Lappeenranta University of Technology School of Engineering Science Erasmus Mundus Master’s Programme in PERvasive Computing and COMmunication for Sustainable Development (PERCCOM) Daniyal Akhtar Qureshi PERFORMANCE EVALUATION OF IoT PLATFORMS IN GREEN ICT APPLICATIONS 2018 Examiners: Professor Eric Rondeau (University of Lorraine) Professor Jari Porras (Lappeenranta University of Technology) Associate Professor Karl Andersson (Luleå University of Technology) Supervisors: Professor Arkady Zaslavsky (CSIRO Australia) Dr. Saguna Saguna (Luleå University of Technology) Dr. Prem Prakash (Swinburne University of Technology)
Transcript of PERFORMANCE EVALUATION OF IoT PLATFORMS IN GREEN …

Lappeenranta University of Technology
School of Engineering Science
Erasmus Mundus Master’s Programme in PERvasive Computing and COMmunication for
Sustainable Development (PERCCOM)
Daniyal Akhtar Qureshi
PERFORMANCE EVALUATION OF IoT PLATFORMS IN GREEN
ICT APPLICATIONS
2018
Examiners: Professor Eric Rondeau (University of Lorraine)
Professor Jari Porras (Lappeenranta University of Technology)
Associate Professor Karl Andersson (Luleå University of Technology)
Supervisors: Professor Arkady Zaslavsky (CSIRO Australia)
Dr. Saguna Saguna (Luleå University of Technology)
Dr. Prem Prakash (Swinburne University of Technology)

ii
This thesis is prepared as a part of Erasmus Mundus Joint Master’s Degree Programme
PERCCOM – PERvasive Computing and COMmunications for Sustainable Development.
This thesis has been accepted by partner institutions of the consortium (cf. UDL-DAJ,
n°1524, 2012 PERCCOM agreement).
Successful defense of this thesis is obligatory for graduation with the following national
diplomas:
• Master in Complex Systems Engineering (University of Lorraine, France)
• Master of Science in Technology (Lappeenranta University of Technology,
Finland)
• Master of Science in Computer Science and Engineering, specialization in
Pervasive Computing and Communications for Sustainable Development (Luleå
University of Technology, Sweden)

iii
ABSTRACT
Lappeenranta University of Technology
School of Engineering Science
Erasmus Mundus Master’s Programme in PERvasive Computing and COMmunication for
Sustainable Development (PERCCOM)
Daniyal Akhtar Qureshi
Performance Evaluation of IoT Platforms in Green ICT Applications
Master’s Thesis
63 Pages, 24 Figures, 4 Tables, 2 Appendices
Examiners: Professor Eric Rondeau (University of Lorraine)
Professor Jari Porras (Lappeenranta University of Technology)
Associate Professor Karl Andersson (Luleå University of Technology)
Keywords: IoT Platform, Internet of Things, Middleware, Performance.
With the advent of Internet of Things (IoT), its deployment and applications has grown
exponentially in the past decade. This growth has had led scientists and stakeholders to the
prediction that about 30 billion of things (IoT) will be connected by 2020 in diverse
applications such as transport, healthcare, utility, education and home automation. Large
data streams generated by sensors; be it data acquisition, storage, or processing, derived the
development of cloud-based middleware (or otherwise known as IoT Platform) for IoT. To
date, hundreds of IoT platforms fluxing the market (both open-source and commercial)
with various complexities, pricing and services. In this thesis, we proposed a IoT Platform
Benchmarking Methodology comprised of four different evaluations namely; Technical,
Usability, Sustainability and Market Competency. We discussed in detail Technical
Evaluation based on TPC-IoT benchmarking to evaluate the performance of any IoT
platform. The main objective of this research is to provide insight into key parameters in
each layer of the platform affecting the overall performance. A preliminary evaluation of
data ingestion of open-source IoT platform will be presented based on benchmarking
methodology (TPC-IoT).
iv
ACKNOWLEDGEMENTS
This thesis work is part of Erasmus Mundus Master PERCCOM program, supported and
funded by the European Union (PERCCOM- FPA 2013-0231) [1].
I would like to thank my supervisor Professor Arkady Zaslavsky for his continuous support
and guidance during the thesis work. Furthermore, I would like to credit Dr. Saguna
Saguna and Dr. Prem Prakash for their time to time help and guidance.
I am also grateful to PERCCOM coordinators for their countless efforts for the program
especially Porf. Eric Rondeau, Prof. Karl Andersson and Prof Jari Porras.
I cannot forget any staff, teachers, trainers or prof. who provide me valuable insights on
various topics, hands-on labs, seminars or help during the administrative processes along
the Erasmus journey. I would like to mention some names: Prof. Jean Philippe Georges,
Prof. Francis Lepage, Prof. Thierry Devoux, Dr. Alexsandra Klimova, Prof. Colin
Pattinson, Dr. Ah-Lian Kor, Caroline Schrepff, Dorine Petit, Maria Palacin Silva, Dr. Ari
Happonen, Prof. Olaf Droegehorn, Ritta Salminen, Prof. Oleg Sadov, Margarita, Prof.
Shahadat Hossain, Ewa Rising, Marianne Tyboni and Raihan ul Islam.
I also feel lucky to have PERCCOM family and my cohort 4. Thankful to them for all the
beautiful memories especially, Ahmed, Al-Hussein, Asif, Farniba, Tawseef Kristian,
Madhu and Mina.
Finally, I would like to credit my mother, father and other family members for their
blessings and unlimited support throughout my life, without them it was not possible.

1
TABLE OF CONTENTS
1 INTRODUCTION ............................................................................................ 5
1.1 BACKGROUND.......................................................................................................... 6
1.2 MOTIVATOIN ........................................................................................................... 8
1.3 RESEARCH QUESTIONS & AIM ................................................................................. 9
1.4 METHODOLOGY ....................................................................................................... 9
1.5 SUSTAINABILITY .................................................................................................... 10
1.6 THESIS OUTLINE .................................................................................................... 12
2 BACKGROUND AND RELATED WORKS ................................................... 13
2.1 THE INTERNET OF THINGS ..................................................................................... 13
2.2 INTERNET OF THINGS ARCHITECTURE ................................................................... 14
2.3 IOT PLATFORMS OR MIDDLEWARE ........................................................................ 16
2.4 OPENIOT PLATFORM ............................................................................................. 17
2.4.1 Architecture ............................................................................................... 18 2.4.2 Utility/Application Plane ........................................................................... 19
2.4.3 Virtualized Plane ....................................................................................... 20
2.4.4 Physical Plane ............................................................................................ 21
2.5 KAA PLATFORM ..................................................................................................... 21
2.5.1 Components ............................................................................................... 22
2.5.2 Architecture ............................................................................................... 24
2.5.3 Applications ............................................................................................... 25 2.6 IOT APPLICATION PROTOCOLS............................................................................... 26
2.6.1 Constrained Application Protocol (CoAP) ................................................ 26
2.6.2 Message Queue Telemetry Transport (MQTT) ......................................... 27 2.6.3 Advanced Message Queuing Protocol (AMQP) ....................................... 28
3 BENCHMARKING METHODOLOGY .......................................................... 30
3.1 CLOUD-BASED ARCHITECTURE OF IOT PLATFORMS .............................................. 30
3.2 KEY PARAMETERS INDICATORS.............................................................................. 30
3.2.1 The Ingestion rate or arrival request per second ........................................ 30 3.2.2 Data Distribution (buffer distribution) ...................................................... 30
3.2.3 Messaging Protocol (size, time, processing) ............................................. 31 3.2.4 Network Bandwidth (protocols overheads, processing and memory) ....... 31 3.2.5 Instance Type (i.e. based on platform what instance is assigned) ............. 31 3.2.6 Smart City Scenario ................................................................................... 31
3.3 TPC-IOT BENCHMARKING..................................................................................... 32

2
3.3.1 Performance Metrics .................................................................................. 34 3.3.2 Qualify for Evaluation? ............................................................................. 35
3.4 PROPOSED BENCHMARKING METHODOLOGY ........................................................ 36
3.4.1 Technical Evaluation ................................................................................. 36 3.4.2 Usability & Interoperability ....................................................................... 39 3.4.3 Sustainability Aspects ................................................................................ 40 3.4.4 Market Competency .................................................................................. 41
4 EXPERIMENTS AND RESUTLS ................................................................... 43
4.1 EXPERIMENT ENVIRONMENT ................................................................................. 43
4.2 FIRST SCENARIO .................................................................................................... 44
4.3 SECOND SCENARIO ................................................................................................ 46
4.4 RESULTS ................................................................................................................ 48
4.4.1 First Scenario ............................................................................................. 48 4.4.2 Second Scenario ........................................................................................ 49
5 CONCLUSIONS AND FUTURE WORK ........................................................ 51
REFERENCES ...................................................................................................... 52
APPENDIX 1
APPENDIX 2

3
LIST OF SYMBOLS AND ABBREVIATIONS
BW Bandwidth
CoAP Constrained Application Protocol
CPU Central Processing Unit
EU European Union
HTTPs Hypertext Transfer Protocol(secure)
IT Information Technology
IETF Internet Engineering Task Force
IP Internet Protocol
IoT Internet of Things
LAN Local Area Network
M2M Machine to Machine
MQTT Message Queuing Telemetry Transport
NGSI Next Generation Services Interface
PaaS Platform as a Service
REST Representational State Transfer
RFID Radio Frequency IDentification
SaaS Software as a Service
SD Sustainable Development
TCP Transmission Control Protocol
UDP User Datagram Protocol
WSN Wireless Sensors Network

4
LIST OF FIGURES
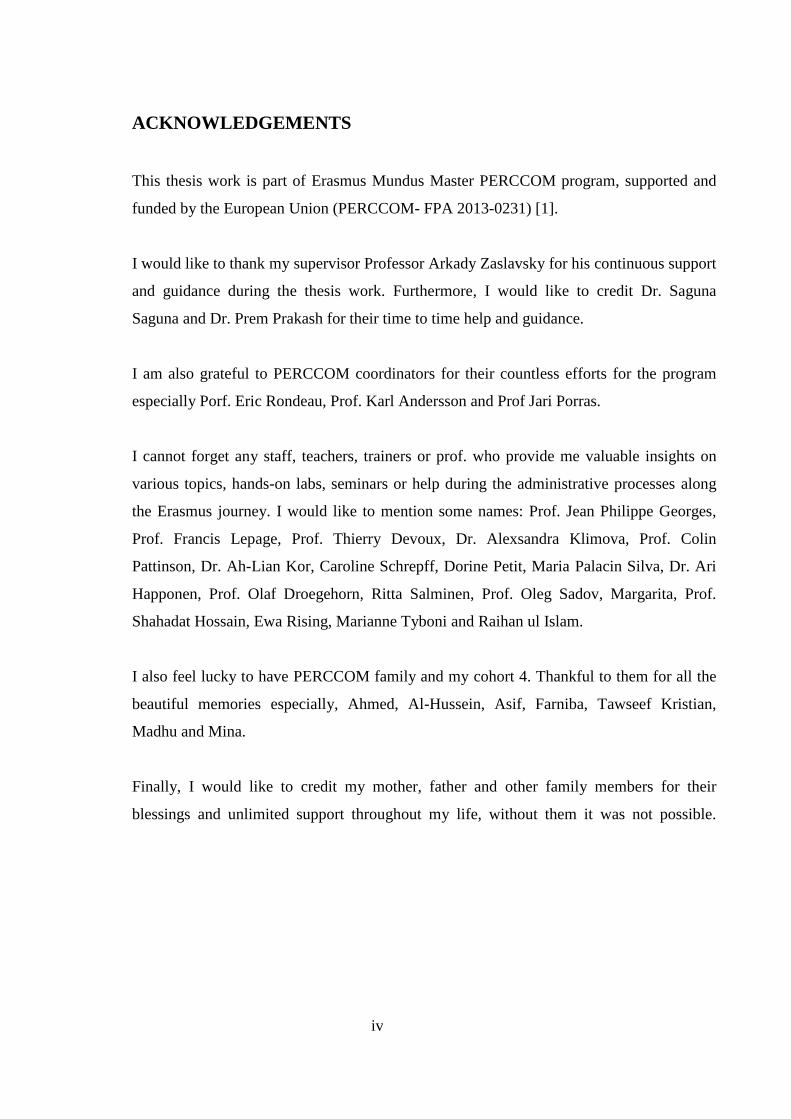
Fig. 1. Scope of Internet of Things........................................................................................4
Fig. 2. Smart City Example………………………………………………….………...……6
Fig. 3. Cloud Based IoT Architecture……………………………………….……….……..7
Fig. 4. Becker’s Sustainability Analysis..............................................................................10
Fig. 5. Cloud Based IoT Architecture………………………………………….………….13
Fig. 6. OpenIoT Architecture...............................................................................................18
Fig. 7. KAA Platform Architecture…………………………………………….………….21
Fig. 8. High Level KAA Architecture..................................................................................23
Fig. 9. KAA Applications……………………………………………………….….……..25
Fig. 10. CoAP Architecture……………………………………………………….....…….26
Fig. 11. MQTT Pub-Sub…………………………………………………………….…….27
Fig. 13. TPC IoT Benchmark Architecture………………………………….....…...……..32
Fig. 14. Reference Architecture for Benchmark……………………………….…….…....33
Fig. 15. Proposed Benchmarking Methodology……………………………….…….……35
Fig. 16. Edge Gateways within Cloud………………………………………..……….…..38
Fig. 17. Overview of Implementation..................................................................................42
Fig. 18. Experimental Topology..........................................................................................43
Fig. 19. Messaging Work Flow............................................................................................44
Fig. 20. Example Snippet....................................................................................................45
Fig. 21. Multiple Endpoints Scenario..................................................................................46
Fig. 22. Log Schema Snippet...............................................................................................47
Fig. 23. Avg. Time for Delivery Time Intervals..................................................................48
Fig. 24. Ingestion Rate of KAA vs OpenIoT………………………………………….......49
LIST OF TABLES
TABLE I Smart City Service Requirement……………………………………………….31
TABLE II Comparison of MQTT and CoAP………………………………………..…...36
Table III Message Delivery Intervals of KAA Platform....................................................48
TABLE IV Data Ingestion and Standard Deviaton............................................................49
5
1 INTRODUCTION
The pace of technology evolved in the last decades observe the shifting of trends from
third industrial revolution to a new paradigm [2]. Scientists, cloud vendors, manufacturers,
network providers and researchers proposed that the number of connected things over
internet (IoT) will grow exponentially to a figure of tens of billions, in the next decade [3]
[4] [5].
Development in ubiquitous computing, adoption of wireless sensors networks and cloud
technology is developing a paradigm of IoT-Internet of things [6]. The IoT is a complex
network of interconnected things and people – all of which share and collect data about the
way they are used and about the environment around them. It is considered as the future
estimation of the Internet of Things considering machine-to-machine (M2M) learning [7]
with or least human intervention to allow exchange of data by secure and autonomous
connection between real world devices and applications [8].
Fig. 1. Scope of Internet of Things. [8]
Deployment of IoT system and its components can be composed of three major layers.
Data Ingestion or sensing, Data Storage & Processing and upper layer can be named as
Control and Application layer where users can deploy applications depending upon the
scenario. Sensing layer is responsible for gathering data from sensors and APIs or other
networks and actuators are also deployed in this layer. Actuators and sensor are usually
energy and computing constraints. Suitable storage and compute platform is required for
the processing and storage of data gathered from the sensing layer. Device management
also plays an important role. Factors need to be consider are scalability, security and

6
availability of the cloud [9]. That’s why it is proposed to deploy IoT components in a
cloud-based computing platform which can provide functionalities discussed earlier.
Typical infrastructure of an IoT Platform can be sketch into three layers which will be
discussed in detailed in chapter 2.
1.1 Background
According to [10] the human population in 2008 has surpassed the settlement in urban
areas than non-urbans. And as the rate of growth, by 2030 about 73% of the global
population is expected to live in urban areas. Policy makers, governments, technology
providers, companies, international organizations, and civil society across the globe have
serious consideration over the current infrastructure and its limitations for the future
challengesto transform the potential of rapid urbanization is an opportunity to encourage
development and prosperity in societies [9]. However, ICT enabled disruptive innovations
and research on cloud computing, automation & robotics, simulation, AI and IoT and their
applications that make able to regulate and optimize their environment and affects all
walks of life for instance, smart transportation, smart healthcare system, smart education,
governance combinedly referred as “smart cities” [11].
The concept of smart cities has been in the technology buzz recently and is defined by
European Commission [12] as “In a smart city environment, various systems based on
smart technologies are interconnected to provide required services (health, utilities,
transportation, government, homes and buildings) which could be seen as an application
of ubiquitous services, aims to improve the quality of life in the city by making it easier and
more convenient for the residents to find information of interest.”
In the smart city paradigm, the IoT will be the main player to monitor and regulate
resources based on constant data collection from sensors and devices and will be processed
using IoT Platforms to take value and make decisions. Gartner defines an IoT platform as
“a software suite or a PaaS cloud offering that monitors, and may manage and control,
various types of endpoints, often via applications end users build on the platform. It
facilitates operations involving IoT endpoints and integration with enterprise resources”

7
[13]. It can be implemented on any infrastructure, healthcare, let say for betterment of
citizens and environment. One of the application can be environment or air-quality
monitoring so that measures can be taken for any area affected by air pollution. For
example, transportation system can be optimized based on vehicle monitoring and
congestions can be controlled and infrastructure (road, subways, tramways) [14].
Fig. 2. Smart City Example. [14]
Deployment of IoT system and its components can be composed of three major layers.
Data Ingestion or sensing, Data Storage & Processing and upper layer can be named as
Control and Application layer where users can deploy applications depending upon the
scenario. Sensing layer is responsible for gathering data from sensors and APIs or other
networks and actuators are also deployed in this layer. Actuators and sensor are usually
energy and computing constraints. Suitable storage and compute platform is required for
the processing and storage of data gathered from the sensing layer. Device management
also plays an important role. Factors need to be consider are scalability, security and
availability of the cloud [15]. That’s why it is proposed to deploy IoT components in a
cloud computing platform which can provide functionalities discussed earlier. Typical
infrastructure of an IoT Platform can be sketch into three layers as shown in below figure
[7].

8
Fig. 3. Cloud Based IoT Architecture. [7]
1.2 Motivatoin
According to Gartner reports there will be 50b of devices connected by 2030 and as
discussed above that it will populate the smart city and generate thousands of bits of data.
As said in [8] the cloud-based platforms are needed to store, process and manage data.
These platforms are known as IoT Platforms. The capabilities of a typical IoT platform
includes data storage, sensor or objects management, data handling and processing. It also
ensures security, event processing, interfeace for administartion, elements for application
development, users and developers. Existing platforms of Internet of Things seriously vary
in pricing formula, perfromance, limitation and functionality [13].
This thesis aims to target the performance evaluation on the basis of two factors load
scalability of a OpenIoT platform for air quality monitoring application (where hundreds of
sensors are updating data continuously). Performance is based on the matrix of latency,
throughput and resource utilization of OpenIoT.
This cloud-based system needs to be scalable to handle such requests. For our
experimentation we will take approaches, horizontal scaling and vertical scaling of
resources.

9
1.3 Research Questions & Aim
To propose a benchmarking methodology for performance evaluation of IoT Platforms.
Validate benchmarking by comparing performance (data ingestion and scalability) of two
platforms subjected to an application (use case).
Following research questions has been raised to achieve the afore mentioned aim:
1. What are the factors involved in Benchmarking for Performance Evaluation of an
IoT Platform?
2. What is Performance of OpenIoT based on TPC-IoT benchmarking? (Scalability)
as compared to another open IoT platform?
3. Suitable candidate for use case (air quality monitoring -IoT application).
1.4 Methodology
In this research we followed Qualitative research to propose a benchmarking methodology
for performance evaluation of IoT Platforms and then Quantitative Analysis will be
provided for validation based on use case.

10
1.5 Sustainability
Sustainability concern become visible in society in late 1970s, with the emegre of
environmental aspects. In the beginning it was define on the basis of three pillar model,
namely environment, social and economy. Last decade, Rachel Carson wrote a book titled
The Silent Spring which had shed light on climate change and global warming related
issues and effects to the public, making his point related to the topic of the environment
rise. Sustainability gained prominance recent years since many scientists felt environmenal
changes like global warming etc. And their effects on economies and socities [16].
The term sustainability or equally used term Sustainable Develeompment is defines as ”a
development that meets the need of the present withour compromising the ability ofthe
future generations to meet their own needs” [17]. As discussed above there are three major
aspects of Sustainable Development:
Economic Pillar: This pillar focus on the economical and financial benefits.
Environment Pillar: This domain emphasize on the natural resources and affects of
development on environment for instance carbon footprint.
Social Pillar: Social stability and evolution are main features of this factor of the
sustainable development.
As part of Erasmus PERCCOM program this thesis emphasize on the sustainability aspects
based on Becker’s model [1] as shown in fig. 4. There are five dimensions namely,
Economical, Technical, Social, Individual and Environmental divided into three categories
Immediate, Enabling and Strucutural affects of each dimension. This thesis focus on
Technical, Economic and Environmtal dimensions with Immediate Effects. Performance
Benchmarking of IoT platform will enable stackholders to chose the right platform for
available applciation hence its improve the resource utilisation and also enables
stakeholders to balance the environmental effects i.e. carbon footprint of the solutions. In
enabling effect, it will directly targets the social, individual and economic dimensions as
details are mentined in the fig. 4 below.

11
Fig. 4. Becker’s Sustainability Analysis

12
1.6 Thesis Outline
Thesis organization is constructed as following chapters with description.
Chapter 1 provides Introduction to the thesis topic and motivation. It also shed light to
discuss the research problem and aim of this project.
Chapter 2 presents the literature review and provides insight into the infrastructure,
limitation and challenges of the IoT Platforms in the market. It will also shed light on
OpenIoT and KAA opensource IoT platform and study case, air quality monitoring.
Chapter 3 describes the main research methodology in terms of proposing the
Benchmarking criteria for Internet of Things Platform performance.
Chapter 4 presents the experimentation setup, results and evaluation of the results and
compare with the previous work.
Chapter 5 will conclude thesis with Conclusion and future work.

13
2 BACKGROUND AND RELATED WORKS
In this chapter we will describes the literature review of the topic and technical background
in the domain of IoT Platforms, Internet of Things and covers topics related to open source
IoT platforms namely OpenIoT and KAA.
2.1 The Internet of Things
The term IoT (nternet of Things) was first introduced in 1999 by the Kevin Ashton in chain
supply management, it was an idea of ubiqitous sensing so that all the things or objects
would be connected via internet and having some compuational power. The idea of
Internet of Things evovled over the decades with the advent in sensor technology, system
on chips and cheap acces of internet. Its a vision where day to day life things or objects are
inter-connected to sense their environment, pull data, communicate with each other
without any human intervention, take smart decisions and affect the envirnement
accordingly [18].
By the time with development and the research in the vision of Internet of Things brought
its applications in all walks of life, for instance, transportation, healthcare, agriculture you
name it. This rapid growth appeared due to evolving sensor technology, computation and
cloud computing [19]. However, there are still some challenges to be addressed and
questions to be answered in terms of standardization, cross-platform interfaces, security
and communication protocols where lots of players are eveolving in the market.
Although this vision has its implications and still in its infacy but research and market
reports expect that over all annual impact by IoT would have a revenue of 2-6 trillion US
dollars by 2025. Machine to Machine traffic will comprise of almost 50% of the internet
traffic and 20-30 billion of smart devices or objects will be connected by the next decade.
Ofcourse, the range of applications and the benefits society will reap, target to improve the
over all quality of life. Be it healthcare, education, agriculture or smart city life [18].
The concept of Internet of Things will also target the sustainability aspects. It has good

14
potential to target many sectors to increase the efficiency of systems into the economy by
optimizing the processes of business models and industries. Research shows that it can
eradicate 15% of carbon emissions gobaly using the smart technologies by 2020 [20].This
chapter will cover the fundamental architectural elements of Internet iof Things. Later, we
elaborate the middleware and frameworks in the concept of Internet of Things. Lastly, Two
of the open source IoT platforms, OpenIoT and KAA and their functionality will be
discussed. Their architecture, specifications and componencts to build applications.
2.2 Internet of Things Architecture
According to [7-8], IoT architecture can be broadly divided into 3 main elements or layers:
1. Hardware: sensing devices, communication hardware, actuators.
2. Middleware: compute and storage resources for data handling.
3. Presentation: interpretation and visualization tools.
Fig. 5. Cloud Based IoT Architecture. [7]
15
Currently the Internet of Things is hot debate amongst researchers and stakeholders, and
characterized by various standards, initiatives and technology enablers. Therefore
interoperability, security and standardization are one of the challenges yet to addressed
[21]. Various applications have been developed with their customized architecture and
protocols in the vertical domain in field of logistic and smart transportation system.
However, initiatives are taken to converge standards and protocols for instance OMA
LWM2M and interoperability initiatives like INTER-IoT [22]. Key enablers like IoT-EPI
projects [23] like bIoTope, AGILE and INTER-IoT are efforts to bring together different
players, implementations which can be re-usable across different application domains.
The next crucial element or component in Internet of Things architecture, is define and
characterized in many surveys by Al-Fuqaha and others in [5-10] and by Gubi et in [18] is
known as ‘sensing’. It is the baseline of the Internet of Things architecture, which is also
known as ‘things’, includes the sensors which are responsible to measures any physical
phenomenon, actuators trigger any action in response back from the system. Hundreds of
millions of ‘things’ or devices will be connected to become an element of Internet of
Things, and particular addressing schemes and identification tags are required due to large
scale of their deployments. These things need to be ‘connected’ so communication
elements are also required to connect heterogenous devices. Wireless Sensor Networks
(WSNs), Radio Frequency Identification (RFID) and IEEE protocols for instance Wi-fi
(802.11), Bluetooth (802.15) and IETF Personal Area Networks (6LoWPAN) are some of
the widely used technologies for connectivity [18].
Data acquisition and storage is the next step in the characterization of Internet of Things
paradigm. Processing and analytics are needed to be done from raw data acquired from
sensors. Data with context or knowledge is produced through processing, machine learning
algorithms or analytics for smart applications. This process is usually part of cloud layer of
the architecture as shown earlier in figure 5 and discussed in [7] as domestic solutions are
not feasible for large data sets.
Al-Fuqaha et al [7] elaborate classification of services into Ubiquitous Services, Identity-
related Services, Collaboration Aware Services and Information-Aggregation services.

16
According to the classification mentioned, the functionality of Identity Service is to
distinguish the deployed devices. Collaborative Aware Services retrieve data from
Information Aggregation Services to take decisions to implement in the application which
makes it smart. Information and Aggregation Services are used to enable the aquisition and
summarize data from sensors. [7]. The sensing layer is responsible to manage physical
objects to sense the phenomenon in surrounding environment, whereas the network layer is
the infrastructure that is responsible for communication between these things. Moreover,
the service layer enables the services utilized by user and applications. Finally, the
interaction method by users and application is defined by the Interface Layer.
2.3 IoT Platforms or Middleware
IoT platform otherwise middleware is responsible for communication amongst
heterogeneous devices, by providing a connectivity layer as shown earlier in fig. 5 that is
used by physical layer devices and by the application layers to provide services in the
Internet of Things [23]. Middleware platform function as bridge to supports Application
Program Interfaces (APIs), protocols and services, to support the environment that enables
devices to communicate each otehr, applications and networks that are required to
communicate in the Internet of Things [24]. The middleware providers market is evolving
rapidly. There are lots of challenges arising for instance, scalability, interoperability and
security which are also suggested as one of the criteria for evaluation of platforms.
Existing solutions addressed different technical solutions that may include pub/sub model,
context-awareness and service oriented architectures [25]. Furthermore, there are
commercial and open source middleware projects for real world application deployments
available in the market recently. These projects are not just for research prototypes but also
target the consumer market to be adopted. Middleware and technology ecosystems are
developed by these initiatives, with the direct or indirect support of giant companies and
non-commercial organizations, including government bodies, Industrial manufecturers
standards organizations. For example, the Linux Foundation’s IoTivity, Alphabet’s
(Google) Thread, and the Lightweight M2MT by Open Mobile Alliance [26]. Opensource
examples may include the European Initiatives like OpenIoT middleware, and the
European initiative OpenIoT which is cruicial piece to play a role in smart cities.

17
2.4 OpenIoT Platform
The OpenIoT – The Opensurce Internet of Things is joint venture of research partners to
provide an opensource utility for large scale intelligent IoT deployments based on cloud
computing model. OpenIoT is a middleware infrastructure that supports integrating
Internet of Things solutions by provied following services [26]:
1. Providing a physical platform for collecting and processing data from any type
of sensors, including virtual sensors, physical devices or APIs. It has X-GSN
(Extended Global Sensor Networks) module which enables integration of any
kind of device, object which can provide observation of physical ohenomeno.
2. It semantatically annotates sensor data with specific to the standards of W3C
Semantic Sensor Networks (SSN)
3. After acquiring data from the sensors its responsible for streaming data to cloud
computing layer for storage and analytics.
4. Dynamically querying/discovering sensors and their data.
5. Make sure to deliver IoT services that are converging from different resources.
6. Visulaisation layer help for data visualization based on appropriate techniques
(maps, grapgh or charts etc).
7. Optimization of resources within the OpenIoT infrastructure and cloud
computing module.
OpenIoT is updated of cloud computing, which is responsible to enable IoT based
capabilities and increasingly important resources. In particular, OpenIoT enables the means
for managing and formulating the ecosystem comprising IoT resources, enables on demand
utility or IoT servcie for example the sensing-as-a-service.
OpenIoT is spreaded to a wide range of technologies and interrelated scientific areas
spanning [27]:

18
• Middleware, i.e. for sensors integration and wireless sensor networks.
• Ontologies, annotation and models for enabling internet-connected devices, with
semantically linked data techniques.
• Utility based Cloud computing, including privacy and security schemes.
2.4.1 Architecture
In OpenIoT the X-GSN (extended global sensor network) module is responsible for the
integration of sensors, registration and data-acquisition from sensors. It is also responsible
for semantically annotating the metadata and sensor data [26].
Virtual sensor represents any abstract entity (physical device) and it needs to register
within LSM (Linked Sensor Middleware). RDF (triple data entity composed of subject-
predicate-object database).
The OpenLink developed Virtuoso (Virtuos Universal Server) serves as the core database
of the OpenIoT platform. It is a database engine which has hybrid features of ORDMBS, a
virtual database, traditional XML, web-application server, Resource Description
Framework hence, provides different services in a single database system [27].
Mostly Internet of Things platforms proposed these storage types: relational data base, in
memory, Resource Description framework, column-oriented. Blob storage are usually
performed using OpenStack Swift. RabbitMQ and Apache Kafka are one of the best high
performance and scalable in terms of message queuing. Internet of things platforms usually
performs Big Data processing based on Apache Spark or Apache Hadoop [27].

19
Fig. 6. OpenIoT Architecture [27]
2.4.2 Utility/Application Plane
The Utility plane is composed of three components, namely request definition, request
presentation and monitoring. Request Definition component provides a Web 2.0 interface
so that it allows on-the-fly specification of service requests to the OpenIoT platform. It is
composed of a set of services for formulatinf and specifying and formulating web requests,
while also submitting them to the Global Scheduler [28].
The second component Request Presentation enables the selection of mashups from a
specific library in order to provide a service presentation in a Web 2.0 interface. In order to
have visualization of these services it communicates directly with the third component
known as Service Delivery & Utility Manager, to retrieve the relevant data [28].
The third Monitoring & Configuration component provides configuration and the
management of functionalities over the deployed sensors and the (OpenIoT) services like
20
sensor integration, that are deployed within the OpenIoT platform. Moreover, it enables the
user to monitor the health of the different deployed modules.
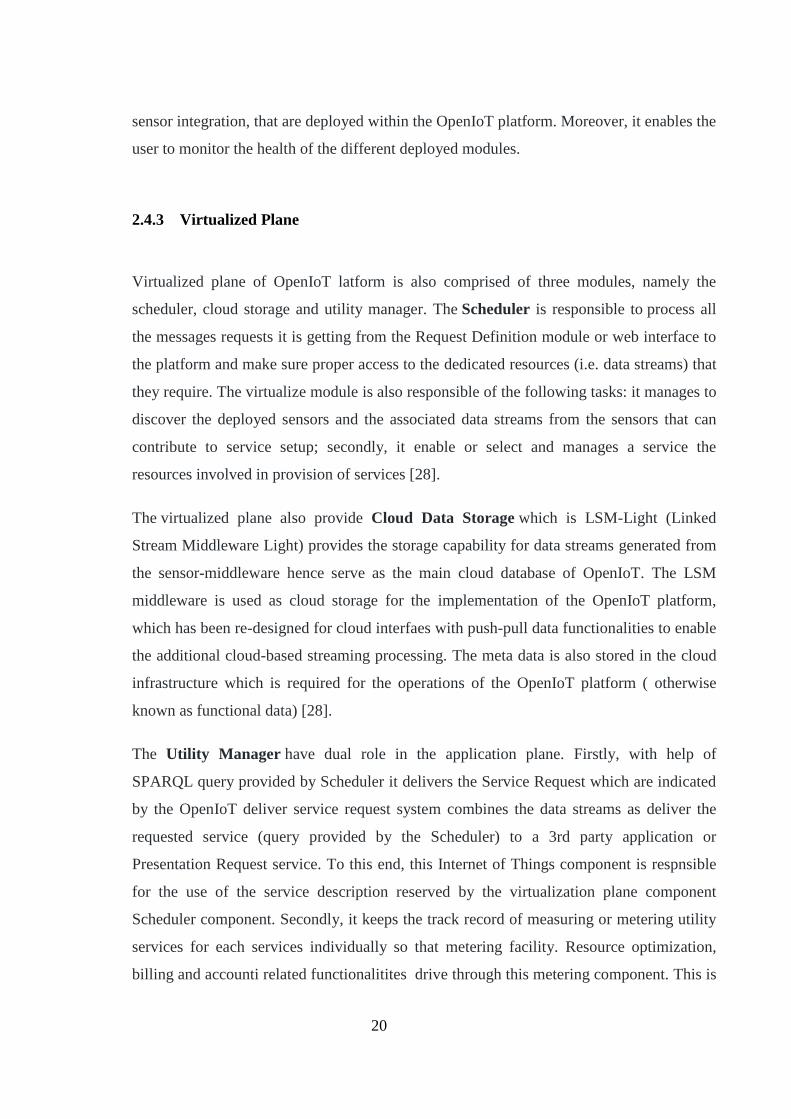
2.4.3 Virtualized Plane
Virtualized plane of OpenIoT latform is also comprised of three modules, namely the
scheduler, cloud storage and utility manager. The Scheduler is responsible to process all
the messages requests it is getting from the Request Definition module or web interface to
the platform and make sure proper access to the dedicated resources (i.e. data streams) that
they require. The virtualize module is also responsible of the following tasks: it manages to
discover the deployed sensors and the associated data streams from the sensors that can
contribute to service setup; secondly, it enable or select and manages a service the
resources involved in provision of services [28].
The virtualized plane also provide Cloud Data Storage which is LSM-Light (Linked
Stream Middleware Light) provides the storage capability for data streams generated from
the sensor-middleware hence serve as the main cloud database of OpenIoT. The LSM
middleware is used as cloud storage for the implementation of the OpenIoT platform,
which has been re-designed for cloud interfaes with push-pull data functionalities to enable
the additional cloud-based streaming processing. The meta data is also stored in the cloud
infrastructure which is required for the operations of the OpenIoT platform ( otherwise
known as functional data) [28].
The Utility Manager have dual role in the application plane. Firstly, with help of
SPARQL query provided by Scheduler it delivers the Service Request which are indicated
by the OpenIoT deliver service request system combines the data streams as deliver the
requested service (query provided by the Scheduler) to a 3rd party application or
Presentation Request service. To this end, this Internet of Things component is respnsible
for the use of the service description reserved by the virtualization plane component
Scheduler component. Secondly, it keeps the track record of measuring or metering utility
services for each services individually so that metering facility. Resource optimization,
billing and accounti related functionalitites drive through this metering component. This is

21
one of the essential feature in the scope of pay-as-you-go scope of utility oaradigm adopted
by the OpenIoT platform.
2.4.4 Physical Plane
The Sensor Middleware or physical plane is consist of X-GSN (Extended Global Sensor
Networks) [29] module which is reponsible to filter, collects, combines, and annotates
(semantically) data streams from the things or objects i.e. virtual sensors or physical
devices integrated to the X-GSN. It enables the connectivity of the things/sensors i.e.
physicall world to the OpenIoT platform. The Sensor Middleware is deployed on on the
basis of one or more available distributed instances (nodes), which might belongs to the
different administrative entities. The prototype or market ready implementation of the
OpenIoT platform available at site cirrently uses the GSN sensor middleware that has been
extended and called X-GSN (Extended GSN).
2.5 KAA Platform
Kaa is also an open source middleware (cloud based) platform which is developed by the
CyberVision Corporation. Which enables various Internet of Things applications, provides
development for Internet of Things utility services, and smart products. KAA platform
offers a variety of tools for Internet of Things products-development and hence thus
drastically reduces risks, development cost and marketing time. The platform also provides
device management through cloud connectivity which helps to acquire and provides data
analytics, some ready-made prototypes for traditional applications, also support hundreds
of thousands of endpoints: can be deployed on cloud or premises. KAA platform offers a
sanbox Image to install in VM for small scale uses cases, development, testing or
experimentation [30]. It is open-source, hence provides packages and source-code for Kaa
cluster installations. KAA is one of the most: easy to learn, deployed and most usable
middleware available in the Internet of Things platform market to date. Following section
will elaborate on its components followed by architecture to have thorough review before
we analyze it performance in the later chapter based on TPC Benchmarking.

22
2.5.1 Components
KAA platform has three major components. Endpoint SDK enables low layer
infrastructure and provides connectivity to the sensors or things enables data management
for connected objects by providing server. The SDK is designed to embedd into connected
devices and provides two bidirectional exchange of data via the server. SDKs have
capability to be integrated into any kinds of objects or devices by providing highly
supported hardware agnostic solutions. The high-level component structure is shown in
figure 7 below [30].
Whereas the overall functionality of back-end is supported by the Kaa server provides
which operates on large scale IoT solutions. KAA server is responsible to handles
communication and integration of connected objects, device interoperability, data
communication and security and non-failure connectivity. Kaa server also enables to
feature established interfaces to integrate the analytics and data management systems. It
acts as a scalable-foundation which enables the back-end system that which can be
expanding to meet the needs and be able to customize accordingly.
Fig. 7. KAA Platform Architecture [30]

23
Kaa Internet of Things platform consist of the endpoint SDK and the server component
which is integrated into client applications. For more information on the functionality of
Kaa server and its architecture, following section will elaborate in detail.
Main features of Kaa are defined as follows [31]:
Event: KAA supports a function which enables messages to be configured for the delivery
of event messages between the connected devices. Events could be configured as unicast or
multicast based on what it is meant to be sent to single or multiple users. Events are
responsible for developing ‘event’ model for integration of APIs, enforce data validity and
security and making sure that the data is delivered to the receiver.
Data collection: Endpoints in KAA platform store data ‘logs’ for temporary storage in any
defined structure. Endpoints SDK then triggers the periodic log upload to the server. Then
server comes into picture and upload these logs into the filesystem, which later transferred
to the big data analytics platforms, for instance MongoDB or Hadoop for the data
analytics. Furthermore, these logs also help to reduce the bugs in the client application,
identify and rectify any kind of anomalies, used for user behavior analysis, etc.
Profiling and grouping: KAA proposed the idea of profiling which means that endpoint
may consist of server-side parts or client sides parts. Server-side profile is the collection of
data sets which is created by KAA Administration User Interface or any REST API
configured by the server application. Whereas, Client-side profile is the collection of data
sets which are produced by the clients for KAA application. These KAA profiles are
managed to sort the endpoint into the groups. These groups then later be utilized for target
messages or set notifications for setting up behavior.
Notifications delivery: KAA proposed a system of notifications that enables server to send
messages to any endpoints based on a topic-based structure. The access is available only to
the groups of the endpoints discussed in profiling sections.
24
Data distribution: KAA also enables function to data update for configuration,
operational data for endpoints etc. This function is used to make the configuration in a
centralized manner, for distribution of content, etc. Data schemes may be used by
developers or able to define type of data, data structure, and their constraints.
Transport abstraction: KAA also enables vendor freedom by providing the architecture
abstraction which enables the centralized configuration for content distribution. It also
provides opportunity to choose network stack for communication without any restrictions,
for example: Ethernet, CoAP, WiFi, HTTP for building application to connect to any kind
of network or end devices.
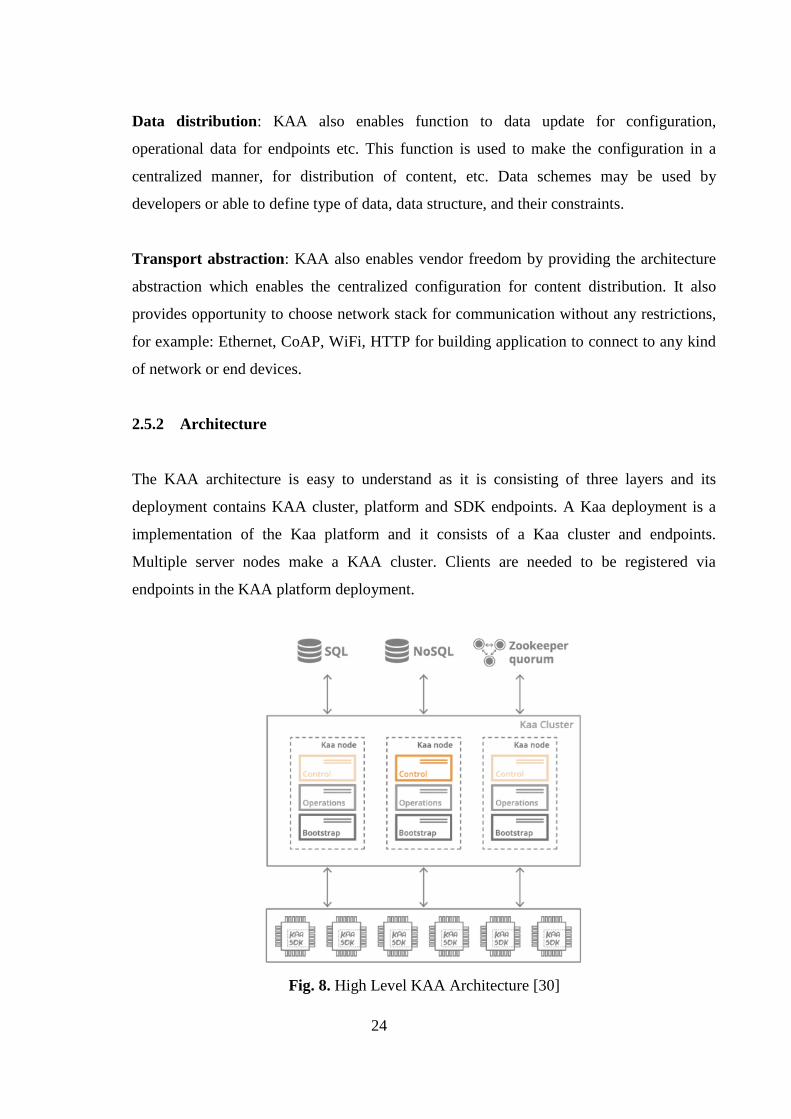
2.5.2 Architecture
The KAA architecture is easy to understand as it is consisting of three layers and its
deployment contains KAA cluster, platform and SDK endpoints. A Kaa deployment is a
implementation of the Kaa platform and it consists of a Kaa cluster and endpoints.
Multiple server nodes make a KAA cluster. Clients are needed to be registered via
endpoints in the KAA platform deployment.
Fig. 8. High Level KAA Architecture [30]

25
Figure illustrates the high-level architecture of KAA platform where KAA cluster is
comprised of various nodes which able to co-ordinate via ZooKeeper for services and
NoSQL is used for data storage. It is consisting of Bootstrap, Operations and Control of the
KAA services. KAA Control enables the management of data in the system, for example: it
delivers data to operations services, it help process the API function call from the webUI to
the external system. Moreover, the control service enables webUI which allows developers
to create user application, create groups of endpoints, configure and register endpoints.
Operations in KAA is a service which handles the concurrent requests from multiple
clients. It is known as worker service. Mostly it is responsible for endpoints processing,
register distribution update, and configuration. Horizontal scaling is possible for multiple
cluster enablement in KAA platform.
There is also Bootstrap service which is responsible for assigning the endpoint to the
Operation Service. Endpoints in KAA platform has built-in bootstrap service for
deployment.
ECs are grouped into event class families (ECF) by subject areas. ECFs are registered
within the Kaa tenant together with the corresponding event class family schemas. An ECF
is uniquely identified to prevent naming collisions during the SDK generation. Once the
application and ECF are created, the tenant administrator can create a mapping between
these two entities by assigning a certain version of the ECF to the application. This
mapping in Kaa is called event family mapping.
2.5.3 Applications
While the Internet of Things has opened up a new technical innovations, which are equally
valuable for a broad variety of industries. As figure 2.6 shows[20], Kaa platform provides
many good IoT use case solutions on agriculture, automotive, consumer electronics,
healthcare, industrail IoT, logistics, smart city, smart energy, smart retail, sport & fitness,
wearables, etc

26
Fig. 9. KAA Applications [30]
2.6 IoT Application Protocols
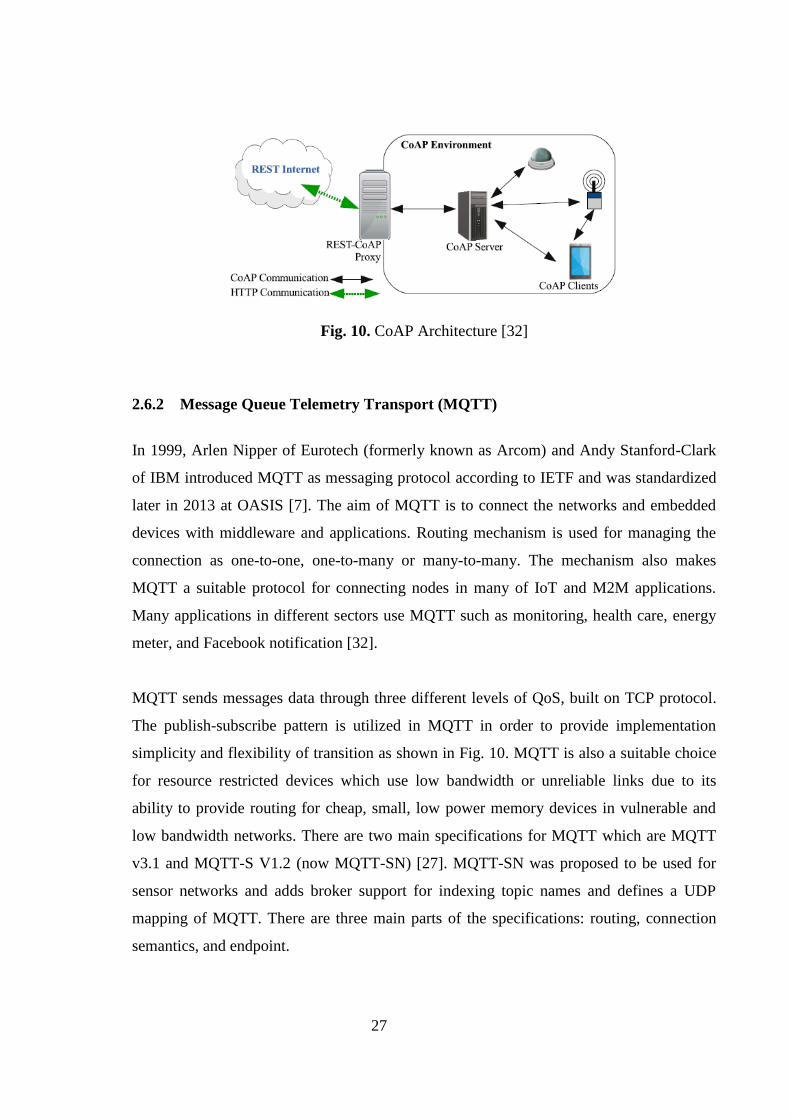
2.6.1 Constrained Application Protocol (CoAP)
CoAP is an application layer protocol [7], [32] for IoT applications that was designed by
RESTful Environments (CoRE) working group and constrained by IETF. This protocol
defines a web transfer protocol based on REpresentational State Transfer (REST) on top of
HTTP operations. In order to simplify exchanging the date between clients and servers by
using HTTP, REST transfer model is used [33]. The REST is described as a cacheable
connection protocol which relies on model of stateless client-server schema. It uses HTTP
put. post, delete, and get methods, it removes vagueness and it can be used in mobile
network applications. This model aslso makes it possible for server & clients to consume
and share and the web services, for example SOAP in a simpler method than using
Uniform Resource Identifiers (URIs) and HTTP verbs methods and it does not need XML
to exchange messages. In contrast to REST, CoAP is limited to use UDP by default, hence
it is more appropriate to be used in IoT applications. Moreover, in order to meet the IoT
requirements like operating in links contain noise and low power usage, CoAP does some
modifiications to set of HTTP functionalities. The exchanging between REST and CoAP
protocols in the REST-CoAP proxies is simple despite the fact that CoAP is designed
based on REST. The general functionionality of CoAP protocol is shown in the figure
below [32].
27
Fig. 10. CoAP Architecture [32]
2.6.2 Message Queue Telemetry Transport (MQTT)
In 1999, Arlen Nipper of Eurotech (formerly known as Arcom) and Andy Stanford-Clark
of IBM introduced MQTT as messaging protocol according to IETF and was standardized
later in 2013 at OASIS [7]. The aim of MQTT is to connect the networks and embedded
devices with middleware and applications. Routing mechanism is used for managing the
connection as one-to-one, one-to-many or many-to-many. The mechanism also makes
MQTT a suitable protocol for connecting nodes in many of IoT and M2M applications.
Many applications in different sectors use MQTT such as monitoring, health care, energy
meter, and Facebook notification [32].
MQTT sends messages data through three different levels of QoS, built on TCP protocol.
The publish-subscribe pattern is utilized in MQTT in order to provide implementation
simplicity and flexibility of transition as shown in Fig. 10. MQTT is also a suitable choice
for resource restricted devices which use low bandwidth or unreliable links due to its
ability to provide routing for cheap, small, low power memory devices in vulnerable and
low bandwidth networks. There are two main specifications for MQTT which are MQTT
v3.1 and MQTT-S V1.2 (now MQTT-SN) [27]. MQTT-SN was proposed to be used for
sensor networks and adds broker support for indexing topic names and defines a UDP
mapping of MQTT. There are three main parts of the specifications: routing, connection
semantics, and endpoint.

28
Fig. 11. MQTT Pub-Sub [32]
On the other hand, there are three components that form MQTT, which are the publisher,
subscriber, and broker. The operation is done as follows: It starts with registering the
interested device as a subscriber for particular topics to be notified by the broker when
publishers announce topics of interest. The second task for the publisher is to transmit the
information to the previously registered subscribers through the broker. The publisher
performs the task of generating data of interest. Moreover, security is accomplished by
checking authorization of subscribers and publishers which is the broker’s task [33]. The
utilization of publish-subscribe process by MQTT is illustrated in Fig. 9 and the message
format that MQTT protocol uses is shown in Fig. 11 [32]. The message header reserves the
first two bytes of the message. PUBLISH (1), CONNACK (2), SUBSCRIBE (3),
CONNECT (8), etc., represent a set of various messages based on their message type
field’s value.
2.6.3 Advanced Message Queuing Protocol (AMQP)
The IETF’s standardized application AMQP [7] is an open layer protocol for the IoT which
mainly focuses on the message-oriented environments. AMQP supports the publish-
subscribe communications approach. Reliable communications are supported by AMQP
via its three types of primitives for ensuring message. This protocol requires using TCP as
a reliable transport protocol to send and receive messages and it defines a layer of
messaging the effect on top of its transportation layer where it enables the messaging
handled. AMQP implementations can interoperate with each other, by defining a wire-
level protocol. There are two main components to handle the communications: the message

29
exchanges and queue. The exchanges are utilized for routing the messages to suitable
queues based on pre-defined orders and conditions. It is possible to store the messages in
message queues and then forward them to receivers. There are two types of messages
defined by AMQP: the massages supplied by the sender (bare messages) and annotated
messages could be seen at the receiver side. The format of AMQP’s message is illustrated
in [32]. Conveying the delivery parameters such as priority, durability, first acquirer, time
to live, and delivery count, is the responsibility of the header.

30
3 BENCHMARKING METHODOLOGY
3.1 Cloud-Based Architecture of IoT Platforms
Generally, in [7], [22] and [26] there are fundamental elements proposed of the IoT
platform based on PaaS definition:
1. Physical Layer: sensors, actuators, embedded communication hardware and
Connectivity.
2. Middleware: storage and computing resources for data handling and prediction.
3. Application: User Application, Utility Management, data visualization and M2M
communication.
3.2 key Parameters Indicators
3.2.1 The Ingestion rate or arrival request per second
The ingestion rate or otherwise known as arrival request is defined as the data ingestion by
the sensing layer or messages by sensors, it is usually expressed in requests per unit of time
(e.g., per second). The gateway or the middleware of the platoform or system is required to
process and ingest load from the sensing layer. The stress test usually is determines the
load handling capacity of the system my increasing the load or data into the system and test
the limit. Rapid increase in the arrival message requests requires the system to acquire that
data (buffer) then process it means need of computational resources and results in queue
which ultimately raised the response time or iverliad the system. That point is klnown as
system crash state [34-35].
3.2.2 Data Distribution (buffer distribution)
The ingestion rate only defines the average arrival rate of the load of data per unit time, but
it doesn’t clarify the over-all distribution of data over long period of time. The amount of
ingestion data, for example, be distributed evenly spaced or linearly distributed or could
occur about the similar time fashion with specific offset of time period. Mathematically,
distributions, for example: Bell disribution, Gamma, or Poisson or normal distributions are

31
are often described as statistical distributions which states the oevr-all pattern or curve of
the laod over time interval to specify the anture of load [34-35].
3.2.3 Messaging Protocol (size, time, processing)
Messaging protocols also plays a vital role in terms of performance as they vary in
overheads, technology and how the size of information is managed. Transport protocols for
IoT like MQTT, CoAP or NGSI have varying overheads bytes when it comes to memory
allocation, messages processing time, or bandwidth distribution. Potocols for Internet if
Things needs to be reengineered or push to reduce the overheads so that it will be efficient
for load management [33].
3.2.4 Network Bandwidth (protocols overheads, processing and memory)
Network Bandwidth is totlally depends upon overhead processing, message transmission
period and disk I/O which overall has combined affect on transmission unit or Bandwidth
of the sysytem [34].
3.2.5 Instance Type (i.e. based on platform what instance is assigned)
In cloud computing the instanes are defined as the unit of resources allocated for the
specific virtual machine hence they have varying performance features. For example,
Amazon Web Services define instances as size of RAM, the assigend CPUs virtually, and
also network capacity which is usually defined as high, moderate or low. Amazon Web
Servcies also provide instances for specific pupose, for example: memory based, compute
optimized, or Input/Output based optimization of instances. These parameters directly
affect the performance of the application as if instances are based on computational
resources assigned to them [35].
3.2.6 Smart City Scenario
The smart city concept is a form of interconnected physical world and utility services by
the Internet of Things systems which creates the opportunity for smart city market. In
today’s market the bottlenecks are customized building block of IoT systems, lack of
standardization, incompatible architecture no or less interoperability between the services,

32
that creates an opportunity for forums like EU to play stockholder and start initiatives like
INTER-IoT or bIoTope. Table I illustrate some of the features and requirement in this
regard [10] and [36].
Dameri introduce the definition of smart cities as:
”A smart city is a well defined geographical area, in which high technologies such as ICT,
logistic, energy production, and so on, cooperate to create benefits for citizens in terms of
well being, inclusion and participation, environmental quality, intelligent development; it
is governed by a well defined pool of subjects, able to state the rule and policy for the city
government and development” [10].
TABLE I Smart City Service Requirement [10,36]
Smart City Requirement Cloud Architecture Component
Ability to interchange information
amongst the Internet of Things systems
and within the IoT system
Edge networks, Cloud, Internet of Things
Gateway
Standardization in communication
protocols for IoT
Device management, Internet of Things
Gateway, IoT Connectivity and
transformations
System access or remote control API management, Devcie handling and
Edge Services
Ability to acquire data from different
resources and make decisions for utility
serviecs
Visualization of data, data analytics
Data integration from different
resources
Edge Services and Internet of Things
Gateway
On time data services Data analytics and Edge Servcies
3.3 TPC-IoT Benchmarking
Founded in 1988 [37], the Transaction Processing Performance Council (TPC) is an
independent body that targets, create and maintain benchmarks to measure performance in
standardized, objective and verifiable manner. Last year, they publish TPCx-IoT
Benchmark as IoT is being adopted across almost every industry_triggering a massive
influx of data that must be analyzed for insights. Typical IoT topology consists of
three_tiers: edge devices, gateway systems and backend data center.

33
TPC-IoT provides a promising measure of hardware, data storage, operating system and
data management systems to provide the IoT industry with verifiable performance,
availability metric, price-performance for systems which are meant to ingest and persist
massive amounts of data from large number of IoT devices, and provide real time insights,
typical in IoT gateway systems_running commercially available software and hardware
[38].
Following figure shows the high-level architecture of the benchmark as it sits between_the
sensing layer and middleware as IoT gateway.
Fig. 13. TPC IoT Benchmark Architecture [37]
The Internet of Things gateways are responsible for several purposes:
• Standardization of protocols for the connecting diffrent devices.
• Internet of Things gateways will be enable to filter, store, and verify data so that the end
devices or sensors will be less stressed as they have limited capabilitites.
• It will help to build data analytics easier and make decision making more instatnt by
providing data from otehr oarts of the system.
• Current interne tof things gateways will be enable to compute and function as computing
platform or near to their performance. This feature will help to put logics and analytics
near to data acquisition system hence it will result in abetetr times response fo rsome

34
critical applications.
Fig. 14. Reference Architecture for Benchmark [38]
3.3.1 Performance Metrics
Scale Factor: The current version of the TPCx-IoT Kit follows a continuous Scale Factor.
Scale Factor is defined as the number of records to be ingested. Benchmark sponsor can
pick any Scale Factor [37].
Metric
TPCx-IoT defines the following primary metrics:
1. IoTps, the Performance Metric
2. $/IoTps , the Price-Performance metric
3. System availability
Performance Metric
The performance metric is used to define the effective or overall throughput of the System
Under Test IoTps = SF/(T) Where SF is the Scale Factor. See Clause SF T is the time
elapsed in seconds.
Price Performance Metric
The price-performance metric is defined as: $/IoTps = P/ IoTps P represents the total cost
of the system under test.

35
3.3.2 Qualify for Evaluation?
The following characteristics shall be used to make this judgment:
• Is it complicated to setup the environment? What about the documentation and customer
supprot?
Yes (for both platforms).
• Does Is there any limitatioons by the servcie provider about implementations which
restricts the TPCx-IoT benchmarking of the platform?
No (for both platforms).
• Is What about the archotectural implementation of the platform which might affect the
some parts or tools for the application devvelopment for any specific utility?
No (for both platforms).
• Is the available platform set-up is not supported by vendor for any specific region or any
other restrictions? (This might includes promotion of similarity to other products and
technologies.)
No (for both platforms).
• Does the setup needs some extra non standardized sophistication on the side of the
system admin, programmer or enduser?
No (for both platforms).
• Are there any implications in the released versions, for example purchasing license or
some specific application in the market which can not benefit from it? How penetrating is
the market? How many end-users can be benefited from it?
Yes (for both platforms).
• Is it opensource or based on pricing, if later case is valid then how the TPC pricing
maetriz fit the case, based on the rovided documentation.
Opensource (for both platforms).

36
3.4 Proposed Benchmarking Methodology
Based on literature review and keeping other factors into account the proposed
benchmarking methodology is composed of four major domains as shown in figure 4. Each
domain is further explored into factor which are described in detail.
Fig. 15. Proposed Benchmarking Methodology
3.4.1 Technical Evaluation
Network, network parameters for QoS, for instance latency, bandwidth, jitter, capacity
packet loss etc can leave devastating effects on overall performance. It depends on how the
overall network architecture is implemented let say for propagation of data from an
endpoint (sensor and/or device) to be processed by rule engine in the cloud back-end and
then the response is sent back to the application [40].
In the network layer, traffic of the networks is usually determined in one of the two ways:
1) B class services which can sustain delay, they are data base based services which rely on
heavy analytics but not time sensitive. 2) Time or delay sensitive services, includes

37
application or services which require instantanous analytics [41]. Following is one of the
solutions for such services 1) capacity of the network shoudl be maximize by increasing
the BW so that throughput will increased without compromising the Qulaity of Service
[40]. 2) Consider the jitter, throughput and delay into account while allocation rate. 3)
Throughput needs to be optimized and power or energy efficiency strategy should be
designed for network layer.
Protocols, most common application layer protocols used in IoT are MQTT, CoAP,
AMQP, XMPP being supported by IoT platforms while MQTT and CoAP are widely used
[33]. MQTT is a lightweight protocol and has much lower overhead due to its pub-sub
binary nature. However, as system will evolves in future, protocols need to be evaluated to
accommodate more devices or reduce messaging latency which can affect the overall
performance of an IoT system or platform.
To make our case, below we are comparing the two most commonly used IoT application
protocols [41] as use-case and their effects on performance in table II [42].
TABLE II Comparison of MQTT and CoAP [42]
Parameter MQTT CoAP
Latency High Low
Packet Loss Low High
BW Consumption vs
Packet Loss
Very Low High
QoS ✓ ✓
RESTful ✓
Transport TCP UDP
Request/Response ✓
Header Size (B) 4 2
Security SSL DTSL

38
Scalability is the ability of the system to accommodate the increasing load or elements
gracefully without degradation of performance into the process. It is one of the most
crucial element of the IoT infrastructure which effects the performance and the biggest
USP of every cloud platform provider in the market. There are different types of
scalability, load scalability is one of the element of cloud-based IoT platform is subjected
here which effect largely on performance (directly effects on resources, throughput and
jitter of the platform) [43].
Designing an IoT infrastructure for handling 100 devices is totally different from one
which can handle a million or scalable. Increasing number of sensors cause increase in
load which require the processing of more data and analytics to generate responses. A
usual approach to address this issue is to creating load balancers and distribute load over
multiple servers via clustering which leads to increase in latency between the nodes [44].
System Performance: Every IoT platform initiate rule-based triggers, which are
automatically raised once an event happens or anomalous data enters into the system. As
more and more devices will get connected to the cloud back-end platform, the average time
it takes to handle and analyze each event will increase eventually. A simple performance
criterion for any IoT device is to trigger a signal and measure the average time or latency it
takes for the cloud platform to take an action on that event [45].
Edge Computing with the pace IoT is growing, the future of platform is shifting towards
distributed, edge intelligence. As edge devices or gateways are becoming more powerful, it
is possible to take autonomous decision using local data rather than putting load of each
instance to cloud unless there any anomaly is found. It can increase the application
performance due to less delay and less load on back-end cloud [43]. Here it needs to be
emphasized that there are significant differences in scale between cloud and edge
computing as cloud has non-comparable communication, storage, compute and data
analytics capabilities in comparison to edge [45].
Fig. 16. Shows the architecture of cloud back-end and edge-gateways to deliver services to
the end-user.

39
Fig. 16. Edge Gateways within Cloud [45]
It can improve IoT platform for the optimal performance based on following features
which make huge impact on performance:
• Location
• Distribution (storage, compute and communication)
• Scalability (Network, load, and virtualization)
• Density of Devices
• Mobility Support
• Real-Time Response
Backup/redundancy: Outage can happen in any IT system so is the case with IoT
Platform. There are some questions to be addressed while assessing any IoT platform. For
example, does this cloud-backend provide data backup plan? How often it takes place?
What if any cluster goes off? Is there failover provisioned? Is it shared or dedicated
services within customers?
Security: It is one of the significant challenge in IoT due to the lack of standards and
architecture as it is still growing. As the scope of IoT infrastructure includes many
heterogenous devices, system and networks, it is a very challenging task to provide
security and privacy to the users or endpoints. As there are hundreds of endpoints.
3.4.2 Usability & Interoperability
Interoperability: As of the vision of IoT for being connected to anything, anytime, and
anywhere will rise the heterogeneity among the IoT systems and platform making it hard to
be interoperable the devices, software or services amongst other IoT platform [47]. Just

40
imagine the situation of smart city where hundreds of IoT platform are deployed and they
are not interoperable it will be huge over utilization of resources. To target the issue of
Interoperable IoT systems, the INTER-IoT aim to design and test IoT framework which
will allow voluntary the solution of interoperability amongst the different IoT platform
using a bottom-up-approach [48] under the EU funded project for H2020. INTER-IoT will
encourage any stakeholder to to design devices, services, platform based on existing eco-
system and solution more interoperable in the market or smart city scenario.
Deployment of Platform: how easy to deploy platform and it services. If it is user friendly
or no. Such factors are also important for the ease of end users.
• Application Development
• Learning Curve
3.4.3 Sustainability Aspects
The objective of Sustainability is to encourage the prioritization of sustainability goals
by UN as part of the design of commercial projects in IT industry to maximize social
impact, environment and economic effect while delivering, and potentially increasing,
commercial value. TPC is currently working on its new benchmark on energy efficiency in
IoT platform which can be crucial guide for assessing one of the pillar of the sustainability.
These three main pillars of sustainability which needs to account while designing,
implementing, commercializing any IoT platform
• Economic
• Environment
• Social
Sustainability is a concept which is defined earlier in the first chapter that it creates balance
the way we utilize the resources so that we can use servcies or resources to fulfil the
current needs without leaving the negative impact on the environment so that the upcoming
generations will have their share. In software systems or IT technologies it is defiend as the
capacity of software system to endure in certain ecosystem under current and future
conditions while satisfying the needs of users today and tomorrow without impacting
negatively on the environment and continuously support business growth and societal

41
values [49].
Sustainable software design is one inwhoch the services or the application of the software,
direct or the indirect will have least negative impact on the environment while have best
practices for human, help to raise the business or economy, easy to deployed, less
resourceful, easy to modular for future upgradation, follwoing the standards or least
customized. Such design or solutions are easy to reuse, scalable, portable or eas yto
maintain and efficient.
Individual sustainability is usually target the efforts by the individual human to maintaine
the software system or engineering(SE), for example: How can a software or IT soulution
may be designed which can help developer to create and maintaine it so that it can satisfy
its job over a long period of time. Whereas social sustainability defined as preserving the
social communities and maintaining the capital. For SE: What effects do software systems
and applications have on the society (e.g. communication, interaction, government)?
Economic sustainability aims at maintaining assets. For SE: How can software systems be
created so that the stakeholders’ long term investments are as safe as possible from
economic risks? Environmental sustainability seeks to improve human welfare by
protecting natural resources. For SE: It is one of the important question to rasie that how
the software development affect the enviroment after or during the development phase?
Furthermore, technical sustainability raise awareness regarding how long the solution will
be persistant? And adequate for the upcoming situation? SE: How it will be able to adopt
the changes or how modular it is in nature?
3.4.4 Market Competency
Just imagine an industrial manufacturer consuming IoT services using an IoT platform, and
with the pace of technological advancements it is likely to raise question about the life time
of the solution as older systems are becoming discrete new versions of sw are available so
one need long-time support. It is very important to achieve a vendor/technology solution
which is easily transferable or upgradable in case such need arises. Avoiding vendor lock-
in is one of prime importance while creating a future-proof architecture for IoT platform
42
[52]. One should keep in mind while availing the services:
• Solution Lifetime
• Community/Customer Service
• Vendor Lock In/Exit

43
4 EXPERIMENTS AND RESUTLS
We have discussed the both platforms, OpenIoT and KAA in detail in literature review
chapter and later proposed a benchmarking criterion for Performance Evaluation in 4 step
process which includes; technical evaluation, Usability & Interoperability, Market
Competency and Sustainability. This chapter we will discuss how we design experiments
for technical evaluation (due to time limitation only one of the evaluation process is being
tested) based on TPCx-IoT benchmarking criterion i.e. message delivery from the end
points and secondly data ingestion capability i.e. data collection from many endpoints or
sensors.
4.1 Experiment Environment
To evaluate performance two scenarios are designed based on TPCx-IoT criterion. Both
are very simple and applicable to any type of IoT platforming the market. First scenario
examines the delivery between two end points in IoT system. It’s very common in IoT
platform that IoT application has to send messages between the nodes or end points for any
kind of use case be it environment monitoring or smart transport system. Second scenario
is based on data ingestion principle, collecting data for post processing or analytics. It’s
like a scenario where one node is collecting data from multiple end points for instance
KAA SDK or X-GSN module in respective platforms. The experiment environment
considers locally in one network i.s. LAN as we are not measuring cloud performance.
Figure 16 shows the overall atrchitecture and details of experiments will be discussed in
section 4.1. In both scenarios the end points deliver messages through IoT platforms. The
details are mentioned in section 4.2 and 4.3.
Fig. 17. Overview of Implementation

44
Experiment environment where we discussed two scenarios are explained here. KAA
platform has a central server where all the end points get connected. To limit the overall
network behavior and other complications we put all the nodes in the same network i.e.
LAN (Local Area Network). The overall experiment topology is shown in the figure 17. It
is necessary to mention here that KAA sandbox is implemented as a single server in
Virtual Machine instead of a cluster. Private IPs are used for all the devices in the LAN,
1 Raspberry pi with Linux occupying 512MB memory.
2 Laptop with Linux 4GB memory.
3 VirtualBox VM for KAA sandbox running on 4GB memory.
4 Nodes are implemented in laptop and pi.
Fig. 18. Experimental Topology
4.2 First Scenario
The main function as described earlier in the first scenario is message delivery among the
two nodes or end points which is considered as the fundamental operation in any Internet
of Things application. Different increasing ranges of data rates will be used to test system
under test for measuring its capability of handling messages.
As illustrated in figure 18, there is exchange of messages among the 2 nodes. Where node
A sends packets or messages continuously to node B and B sends a response back as
acknowledgment if the message is received successfully. At the node A we can measure
time taken by messages by time stamping, later with series of arrival time we can analyze

45
the performance of message handling by increasing the rate of messages between the two
nodes.
Fig. 19. Messaging Work Flow
KAA platform has an Event subsystem to balance the load of the messages between the
nodes. It’s a module provided by the kAA platform. Event classes needed to be configured
as well as define event family to address the message structure. Every event contains a
time stamp of data type long. Using Web User Interface of KAA we generated SDK.
Configurations settings of Event Class and Event Class Family are provided in Appendix
A. KAA sandbox run as central server where A and B nodes sends message through it.
End point A which is laptop and End point B which is raspberry pi, first estyablosh a
connection to the central SDK server. Then A starts sending packets or messages to B
periodically. All the messages known as events are first handled by the SDK server then it
send to B. If B received the message it send back acknowledgment to the A via the same
route. As soon as A gets the response it calculates the time period using the above
mentioned technique. Each of the rounds contains hundreds of messages and delivery time
may vary from 10ms to 1kms. Following small snipet is provided for this simple scenario.
The detailed code is provided in appendix A.

46
Fig. 20. Example Snippet
4.3 Second Scenario
In the second scenario, which is also one of the common feature in any application in IoT
applications. It is to data ingestion, or otherwise getting data or messages from all the
sensors or end point and collect them in a single node to store and forward to the cloud for
data analytics. So in this scenario we implemented multiple endpoints to deliver multiple
messages to the sever to evaluate the platform performance. Figure 19 illustrates the the
handling of messages in this scenario. Although kAA platform has a powerful sever to
handle this messages load.
It uses it log subsystem to to periodically handle data to the server. The log system enables
end points to push load to the server. Where as it receivers messages to store them in
adatabase, sends back an acknowledgment to the endpoints. It is similar to log schema and
needs to be pre-configured. For the fair load distribution and measurements all the source
modes are configured on laptop.
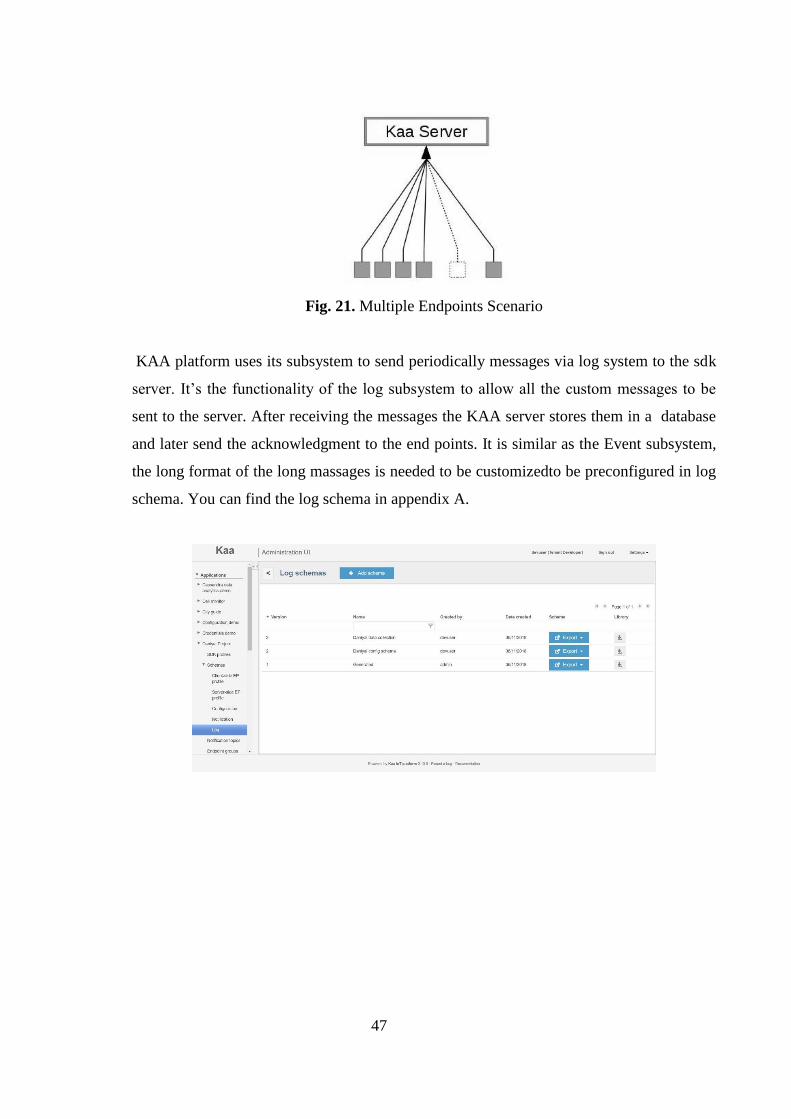
47
Fig. 21. Multiple Endpoints Scenario
KAA platform uses its subsystem to send periodically messages via log system to the sdk
server. It’s the functionality of the log subsystem to allow all the custom messages to be
sent to the server. After receiving the messages the KAA server stores them in a database
and later send the acknowledgment to the end points. It is similar as the Event subsystem,
the long format of the long massages is needed to be customizedto be preconfigured in log
schema. You can find the log schema in appendix A.

48
Log Schema
{
"type" : "record",
"name" : "IoT_Test_For_S2",
"namespace" : "com.company.project",
"fields" : [ {
"name" : "NodeID",
"type" : {
"type" : "string",
"avro.java.string" : "String"
}
}, {
"name" : "MsgID",
"type" : "int"
}, {
"name" : "timestamp",
"type" : "long"
} ]
}
Fig. 22. Log Schema Snippet
4.4 Results
Finally, we will discuss the results obtained from the above two scenarios. We use excel
for processing data to analyze different graphs and later explain those curve in each
scenario.
4.4.1 First Scenario
For first scenario we set delivery time interval as 10, 50, 100, 500 and 1000ms. For each
interval, the messages exchanges between the endpoints is 100. Below table shows
standard and avg. deviation of time stamps. It can be observed that during shorter intervals,
for instance 50 ms the average message exchange time stamps is in 1000s while for longer
intervals it is around 100ms.
The standard and average deviation of time interval for message exchange of KAA
platform is shown in the table 3 It can be observed clearly that for intervals shorter than
50ms, the exchange time interval of exchange messages is in 1000s. And for intervals
longer than 100ms, the exchange time interval of exchange messages is in 100s.

49
Table III Message Delivery Intervals of KAA Platform
Intervals (ms) 10 50 100 500 1000
Average Time (ms) 4638.41 2398.83 126.73 109.31 163.59
St. Deviation 907.88 1484.72 87.13 59.16 129.9
Fig. 23 clearly illustrates that for smaller delivery intervals, for instance 50 ms or less; the
average message exchange time increases smoothly upto 5000ms with the incerement of
packets or messages and then goes stable after about 40 packets to the level of 5500ms.
Whereas for the delivery intervals higher or equal to 100ms the average message delivery
time remains stable around 200ms.
Fig. 23. Avg. Time for Delivery Time Intervals
4.4.2 Second Scenario
Some of the prominent values of the results from the second scenario is shown in table 4.
The endpoints vary from 4 to 2o in this case. As it can be observed that the average round-
trip time rises with the increment of number of end points, but some anomalies can also be
seen for the values of 16 and 18. Delivery time out cases can also be taken into accounts
whenever the roundtrip time is more than 6o seconds (end points acknowledge the KAA

50
server for such cases). For the standard deviation, it has the trend of direct relationship
with the increment of number of endpoints.
TABLE IV Data Ingestion and Standard Deviaton [53]
No. Of
Endpoints
4 6 8 10 13 14 16 18 20
Avg. RTT (ms) 57.17 151.91 163.76 223.39 287.51 511.87 305.71 426.87 912.01
Std. Deviation 191.3 526.65 487.28 607.25 645.98 1043.7 759.37 793.8 2179.7
0
10
20
30
40
50
60
70
80
90
100
1 5 10 15 20 25 30 35 40
IPS
Fig. 24. Ingestion Rate of KAA vs OpenIoT

51
5 CONCLUSIONS AND FUTURE WORK
In this thesis, we proposed a methodology comprised of four different evaluation, for
instance Technical Evaluation, Usability/Interoperability Sustainability and Market
Competence including Technical Evaluation based on TPC-IoT benchmarking to evaluate
the performance of any IoT platform. This research is to provide insight into key
parameters in each layer of the platform affecting the overall performance. Air quality
monitoring using an open-source IoT Platform as a use-case is used for the deployment of
methodology (technical evaluation). A preliminary evaluation of data ingestion of open-
source IoT platform is evaluated presented based on benchmarking methodology (TPC-
IoT) as a use-case how to evaluate performance.
In future, comparison of different IoT platform can be evaluated to provide an insight
how this research can be a guide for evaluating and choosing the right platform for specific
application. Furthermore, some key parameters needed to be study in detail as mention
TPC benchmarking is coming soon on Energy Efficiency of IoT platform as it is one of the
main parameters of sustainability point of view.

52
REFERENCES
1. Klimova, A., Rondeau, E., Andersson, K., Porras, J., Rybin, A.V., and Zaslavsky,
A. (2016). An international Master's program in green ICT as a contribution to
sustainable development. Journal of Cleaner Production, vol. 135, pp. 223-239.
2. D. Evans, "The Internet of things: How the next evolution of the Internet is
changing everything", CISCO, 2011.
3. Gartner, 'Gartner Says 6.4 Billion Connected "Things" Will Be in Use in 2016, Up
30 Percent From 2015'. Available: http://www.gartner.com/newsroom/id/3165317
4. K Rose, S Eldridge, L Chapin, “THE INTERNET OF THINGS: AN
OVERVIEW”, The Internet Society, 2015, pp. 9-17.
5. Ericsson. (2011, February) More than 50 billion connected devices. Available:
http://www.ericsson.com/res/docs/whitepapers/wp- 50-billions.pdf
6. M. Weiser, “The Computer of the 21st Century”, Scientific American, vol. 265, no.
3, Sept 1991, pp. 66-75.
7. Ala Al-Fuqaha, Mohsen Guizani, Mehdi Mohammadi, Mohammed Aledhari, and
Moussa Ayyash. Internet of things: A survey on enabling technologies, protocols,
and applications, IEEE Communications Surveys & Tutorials, 17(4):2347–2376,
2015.
8. Floerkemeier, C., Langheinrich, M., Fleisch, E., Mattern, F., Sarma, S.E.: (eds.)
The Internet of Things. First International Conference, IOT 2008, LNCS 4952,
Springer (2008).
9. P. Magrassi, “Why a Universal RFID Infrastructure Would Be a Good Thing”,
Gartner research report G00106518, 2 May 2002.
10. Survey of IoT adopters conducted by Oxford Economics, sponsored by Verizon,
2015.

53
11. André B Bondi. Characteristics of scalability and their impact on performance. In
Proceedings of the 2nd international workshop on Software and performance, pages
195–203. ACM, 2000.
12. Smart City Scenario, Available:
http://www.europarl.europa.eu/RegData/etudes/etudes/join/2014/507480/IPOL-
ITRE_ET(2014)507480_EN.pdf
13. Žarko, Ivana Podnar, et al. "Interoperability and Open-Source Solutions for the
Internet of Things." (2015).
14. Gonzalez, R.C., Woods, R.E., Digital Image Processing, 3rd edition, Prentice-Hall,
Inc., USA, 2002.
15. Hamouz, M., Kittler, J., Kamarainen, J.-K., Paalanen, P., Kälviäinen, H., Matas, J.,
Feature-based Affine-invariant Localization of Faces, IEEE Transactions on
Pattern Analysis and Machine Intelligence (PAMI), Vol. 27, No. 9, September
2005, pp. 1490-1495.
16. Frans Berkhout and Julia Hertin. Impacts of information and communication
technologies on environmental sustainability: Speculations and evidence. 2001.
17. Graham Hubbard. Measuring organizational performance: beyond the triple bottom
line. Business strategy and the environment, 18(3):177–191, 2009.
18. M. Weiser, “The Computer of the 21st Century”, Scientific American, vol. 265, no.
3, Sept 1991, pp. 66-75.
19. Floerkemeier, C., Langheinrich, M., Fleisch, E., Mattern, F., Sarma, S.E.: (eds.)
The Internet of Things. First International Conference, IOT 2008, LNCS 4952,
Springer (2008).
20. Molly Webb et al. Smart 2020: Enabling the low carbon economy in the
information age The Climate Group. London, 1(1):1–1, 2008.
21. Shancang Li, Li Da Xu, and Shanshan Zhao. The internet of things: a survey.
Information Systems Frontiers, 17(2):243–259, 2015.
54
22. M. A. Razzaque, M. Milojevic-Jevric, A. Palade and S. Clarke, "Middleware for
Internet of Things: A Survey," in IEEE Internet of Things Journal, vol. 3, no. 1, pp.
70-95, Feb. 2016.
23. Ghofrane Fersi. Middleware for internet of things: a study. In Distributed
Computing in
24. Sensor Systems (DCOSS), 2015 International Conference on, pages 230–235.
IEEE, 2015.
25. Jayavardhana Gubbi, Rajkumar Buyya, Slaven Marusic, and Marimuthu
Palaniswami. Internet of things (iot): A vision, architectural elements, and future
directions. Future generation computer systems, 29(7):1645–1660, 2013.
26. Hasan Derhamy, Jens Eliasson, Jerker Delsing, and Peter Priller. A survey of
commercial frameworks for the internet of things. In Emerging Technologies &
Factory Automation (ETFA), 2015 IEEE 20th Conference on, pages 1–8. IEEE,
2015.
27. Soldatos, John, et al. "Openiot: Open source internet-of-things in the
cloud." Interoperability and open-source solutions for the internet of things.
Springer, Cham, 2015.
28. https://github.com/OpenIotOrg/openiot/wiki/OpenIoT-Architecture
29. Kefalakis, Nikos, et al. "A visual paradigm for IoT solutions
development." Interoperability and Open-Source Solutions for the Internet of
Things. Springer, Cham, 2015. 26-45.
30. Hromic, Hugo, et al. "Real time analysis of sensor data for the internet of things by
means of clustering and event processing." Communications (ICC), 2015 IEEE
International Conference on. IEEE, 2015.
31. KAA Platform, Available at: https://www.kaaproject.org/
32. KAA Architecture, Available at:
https://docs.kaaproject.org/display/KAA/Kaa+IoT+Platform+Home
33. Atzori, Luigi, Antonio Iera, and Giacomo Morabito. "The internet of things: A
survey." Computer networks 54.15 (2010): 2787-2805.

55
34. Karagiannis, Vasileios, et al. "A survey on application layer protocols for the
internet of things." Transaction on IoT and Cloud Computing 3.1 (2015): 11-17.
35. David J Lilja. Measuring computer performance: a practitioner’s guide. Cambridge
university press, 2005.
36. Brendan Gregg. Systems Performance: Enterprise and the Cloud. Pearson
Education 2013.
37. Darrell M West. E-government and the transformation of service delivery and
citizen attitudes. Public administration review, 64(1):15–27, 2004.
38. Nambiar, Raghunath, and Meikel Poess. “Performance evaluation and
benchmarking”, Springer Berlin/Heidelberg, 2009.
39. Raghunath Nambiar and Meikel Poess, “Industry Standards for the Analytics Era:
TPC Roadmap” Cisco Systems, Inc., 275 East Tasman Drive, San Jose, CA 95134,
USA, Sep 2017.
40. Attila Klenik and Andr´as Pataricza, “Performance Analysis of Critical Services”,
41. Li, Ling, Shancang Li, and Shanshan Zhao. "QoS-aware scheduling of services-
oriented internet of things." IEEE Transactions on Industrial Informatics 10.2
(2014): 1497-1505.
42. Mangold, Stefan, et al. "Analysis of IEEE 802.11 e for QoS support in wireless
LANs." IEEE wireless communications10.6 (2003): 40-50.
43. Yassein, Muneer Bani, and Mohammed Q. Shatnawi. "Application layer protocols
for the Internet of things: A survey." Engineering & MIS (ICEMIS), International
Conference on. IEEE, 2016.
44. Collina, Matteo, et al. "Internet of Things application layer protocol analysis over
error and delay prone links." Advanced Satellite Multimedia Systems Conference
and the 13th Signal Processing for pace Communications Workshop (ASMS/SPSC),
2014 7th. IEEE, 2014.

56
45. Chen, Yuang, and Thomas Kunz. "Performance evaluation of IoT protocols under a
constrained wireless access network." Selected Topics in Mobile & Wireless
Networking (MoWNeT), 2016 International Conference on. IEEE, 2016.
46. J. Gao, P. Pattabhiraman, X. Bai and W. T. Tsai, "SaaS performance and scalability
evaluation in clouds," Proceedings of 2011 IEEE 6th International Symposium on
Service Oriented System (SOSE), Irvine, CA, 2011, pp. 61-71.
47. Vandikas, Konstantinos, and Vlasios Tsiatsis. "Performance evaluation of an IoT
platform." Next Generation Mobile Apps, Services and Technologies (NGMAST),
2014 Eighth International Conference on. IEEE, 2014.
48. C. Savaglio, G., Fortino, M., Zhou, “Towards interoperable, cognitive and
autonomic IoT systems: An agent-based approach,” in: Internet of Things, 2016
IEEE 3rd World Forum on. IEEE, pp. 58-63, 2016.
49. G. Fortino, et al., “Towards Multi-layer Interoperability of Heterogeneous IoT
Platforms: The INTER-IoT Approach,” Integration, Interconnection, and
Interoperability of IoT Systems. Springer, 199-232, 2018.
50. Klenik, Attila, and Andras Pataricza. "Performance analysis of critical
services." Future IoT Technologies (Future IoT), 2018 IEEE International
Conference on. IEEE, 2018.
51. Ishaq et al., “IETF standardization in the field of the Internet of Things (IoT): A
survey,” J. Sens. Actuator Netw., vol. 2, pp. 235–287, 2013.
52. Molly Webb et al. Smart 2020: Enabling the low carbon economy in the
information age. The Climate Group. London, 1(1):1–1, 2008.
53. G. Fortino, et al., “Towards Multi-layer Interoperability of Heterogeneous IoT
Platforms: The INTER-IoT Approach,” Integration, Interconnection, and
Interoperability of IoT Systems. Springer, 199-232, 2018.
54. Arkady Zaslavsky, et al. "Openiot: Open source internet-of-things in the
cloud." Interoperability and open-source solutions for the internet of things.
Springer, Cham, 2015. 13-25.
57
55. H. Derhamy, J. Eliasson, J. Delsing, and P. Priller, ‘A survey of commercial
frameworks for the Internet of Things’, in <i>Proceedings of 2015 IEEE 20th
International Conference on Emerging Technologies & Factory Automation
(ETFA 2015) : Luxembourg, 8-11 Sept. 2015.
56. Ghofrane Fersi. Middleware for internet of things: a study. In Distributed
Computing in Sensor Systems (DCOSS), 2015 International Conference on, pages
230–235. IEEE, 2015.
57. Calbimonte, Jean-Paul, et al. "XGSN: An Open-source Semantic Sensing
Middleware for the Web of Things." TC/SSN@ ISWC. 2014.

APPENDIX 1.
Scrrenshot of platform.
Table of values of Ingestion [53]

APPENDIX 2.
Codes for the implementation of scenarios I and II.
https://github.com/DaniyalAkhtar?tab=repositories


