PERFORMANCE ET COMPORTEMENT DES VEHICULES
48
Vehicle Performance Pierre Duysinx Research Center in Sustainable Automotive Technologies of University of Liege Academic Year 2021-2022 1
Transcript of PERFORMANCE ET COMPORTEMENT DES VEHICULES

Vehicle Performance
Pierre DuysinxResearch Center in Sustainable Automotive
Technologies of University of Liege
Academic Year 2021-2022
1

Lesson 2Performance criteria
2

Outline
◼ DESCRIPTION OF VEHICLE MOTION
◼ Longitudinal motion
◼ POWER AND TRACTIVE FORCE AT WHEELS
◼ Transmission efficiency
◼ Gear ratio
◼ Expression of power and forces at wheels
◼ Power and forces diagram
◼ VEHICLE RESISTANCE
◼ Aerodynamic
◼ Rolling resistance
◼ Grading resistance
◼ General expression of vehicle resistance forces
3

Outline
◼ STEADY STATE PERFORMANCES
◼ Maximum speed
◼ Gradeability and maximum slope
◼ ACCELARATION AND ELASTICITY
◼ Effective mass
◼ Acceleration time and distance
4

Outline
◼ FUEL CONSUMPTION AND EMISSIONS
◼ Specific consumption of power plant
◼ Vehicle fuel consumption measures
◼ Constant speed consumption
◼ Variable speed consumption and driving cycles
◼ Chassis dynamometer
5

References
◼ T. Gillespie. « Fundamentals of vehicle Dynamics », 1992, Society of Automotive Engineers (SAE)
◼ R. Bosch. « Automotive Handbook ». 5th edition. 2002. Society of Automotive Engineers (SAE)
◼ J.Y. Wong. « Theory of Ground Vehicles ». John Wiley & sons. 1993 (2nd edition) 2001 (3rd edition).
◼ W.H. Hucho. « Aerodynamics of Road Vehicles ». 4th edition. SAE International. 1998.
◼ M. Eshani, Y. Gao & A. Emadi. Modern Electric, Hybrid Electric and Fuel Cell Vehicles. Fundamentals, Theory and Design. 2nd
Edition. CRC Press.
6

Max speed and gradeability
7

Vehicle performances
◼ Vehicle performance are dominated by two major factors:
◼ The maximum power available to overcome the power dissipated by the road resistance forces
◼ The capability to transmit the tractive force to the ground (limitation of tire-road friction)
◼ Performance indices are generally sorted into three categories:
◼ Steady state criteria: max speed, gradebility
◼ Acceleration and braking
◼ Fuel consumption and emissions8

Study of performances with tractive force diagrams
◼ The steady state performances can be studied using the tractive forces / road resistance forces diagrams with respect to the vehicle speed
◼ Newton equation
◼ Stationary condition
◼ Then equilibrium writes
9

Study of performances with tractive force diagrams
◼ One generally defines the net force
◼ One also can use the net force diagram to calculate
◼ The maximum speed
◼ The maximum slope
◼ The reserve acceleration available
10

Study of performances with tractive force diagrams
v
I
II
III
vmax
IV
Fa
Frlt
Max speed of the vehicle
11

Study of performances with tractive force diagrams
v
I
II
III
IV
Vmax
mg sin3
max
mg sin4
max
Fa
Frlt
Max slope that can be overcome with a given gear ratio
12
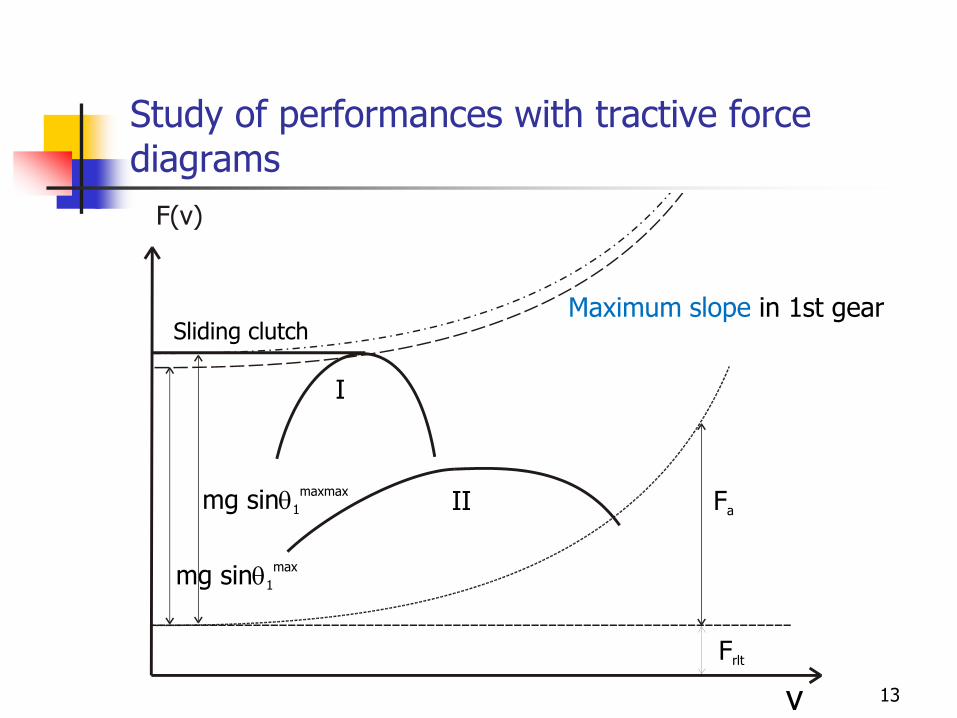
Study of performances with tractive force diagrams
v
I
II
mg sin1
max
mg sin1
maxmax
Sliding clutch
Fa
Frlt
Maximum slope in 1st gear
13

Maximum speed
◼ For a given vehicle, tires, and engine, calculate the transmission ratio that gives rise to the greatest maximum speed
◼ Solve equality of tractive power and dissipative power of road resistance
◼ with
◼ As the power of resistance forces is steadily increasing, the maximum speed is obtained when using the maximum power of the power plant
14

Maximum speed
15

Maximum speed
◼ Iterative scheme to solve the third order equation (fixed point algorithm of Picard)
◼ Once the maximum speed is determined the optimal transmission ratio can be easily calculated by since it occurs for the nom rotation speed:
16

Max speed for given reduction ratio
Proues(v)
v
Pmax
vmax(long)
Présistance(v)
Rapport plus long
Optimal
Rapport plus court
vmax
maxvmax(court)
Rapport plus court
Optimal
Rapport plus long
Max speed is always reduced compared to vmaxmax
17

Max speed for given reduction ratio
◼ Solve equation of equality of tractive and resistance power, but this time, the plant rotation speed is also unknown.
◼ Let’s eliminate the rotation speed of the engine to find a single nonlinear equation to solve
18

Max speed for given reduction ratio
◼ Solve equation of equality of tractive and resistance power, but this time, the plant rotation speed is also varying.
◼ Numerical solution using a fixed-point algorithm (Picard iteration scheme)
19

Selection of the top gear ratio
◼ Design specifications for the top gear ratio in connection with the topo speed criteria (from Wong)◼ To be able to reach a given top speed with the given engine
◼ To be able to maintain a given constant speed (from 88 to 96 km/h) while overcoming a slope of at least 3% with the selected top gear ratio
◼ These specifications enable to select a proper top gear ratio◼ The first requirement enables to select a first gear ratio
◼ The second condition enforces to select a gear ratio that gives rise to an engine rotation speed that is just above the nominal rotation speed (and the max power) in order to save a sufficient power reserve to keep a constant speed while climbing a small slope, overcoming wind gusts or accounting for loss of engine performance with ageing.
20

Maximum slope
◼ For the maximum slope the vehicle can climb, two criteria must be checked:
◼ The maximum tractive force available at wheel to balance the grading force
◼ The maximum force that can be transmitted to the roadbecause of tire friction and weight transfer
21

Maximum slope
22

Maximum slope
◼ Vertical equilibrium
◼ Rotational equilibrium about rear wheels contact point
◼ Rotational equilibrium about rear wheels contact point
23

Maximum slope
◼ Limitation due to the friction coefficient
◼ Normal forces under the front and rear wheel sets
◼ At low speed and constant speed (ax=0)
24

Maximum slope
FOUR-WHEEL DRIVE with electronic power split
Maximum slope
25

Maximum slope
FRONT WHEEL DRIVE
Maximum slope
26

Maximum slope
REAR WHEEL DRIVE
Maximum slope
27

Selection of first gear ration
◼ Maximum slope to be overcome, for instance max = 25%
◼ Tractive force at wheels
◼ Sizing of first gear ration
28

Maximum slope at high speed
◼ What is the maximum grade that can be overcome at a given speed V is:
◼ Gradeability is ruled by the net tractive force available
◼ The tractive force is given by the speed
29
◼ Check also nonslip condition

Maximum slope at high speed
◼ The maximum slope can be evaluated as follows
◼ If we define
◼ It comes :
30

Maximum slope at high speed
◼ It a second order equation in sin
◼ Solving for sin gives
◼ It comes :
31

Selection of gear ratios
◼ Goal of the selected gear ratio: to adapt the characteristics of engine operation (rotation speed, torque) to the vehicle speed.
◼ The top and lowest gear ratios are selected to
◼ Match a given top speed
◼ To be able to drive over given grading conditions, that is to develop sufficiently high tractive forces at wheels
◼ The distribution of intermediate gear ratios in between the top and lowest gear ratio is made to span the full range of operating speeds more or less smoothl
◼ In principle, the different gear ratios should render as much as possible the maximum power curve
32

Accelerations and elasticity
33

Acceleration performance
◼ Estimation of acceleration and elasticity is based on the second Newton law
◼ Warning: when accelerating, the rotation speed of all driveline and transmission components is increasing: wheel sets, transmission shafts, gear boxes and differential, engine…
➔ Effective mass to account for the kinetic energy of all
components (translation + rotation)
34

Effective mass
◼ Total kinetic energy of the vehicle and its driveline :
35

Effective mass
◼ The rotation speed of the driveline components is linked to the longitudinal speed of the vehicle
◼ The kinetic energy writes
36

Effective mass
◼ One defines an effective mass
◼ The calculation of the effective mass requires the knowledge of the geometry and inertia properties of all the driveline components
◼ Empirical formula for preliminary design of cars by Wong
37

Effective mass
◼ Empirical correction formula to estimate the effective mass of passenger car propelled by piston engines (Wong, 2001)
◼ This estimation formula puts forward the major factors of the corrections :
◼ Nearly negligible for low reduction ratios (4th and 5th gear ratios)
◼ Rather important for high gear ratios : 1st and 2nd gear ratios
◼ For railway systems, g is of an order of magnitude 1,02 to 1,30 for classical train and from 1,30 to 3,50 for rack trains)
38
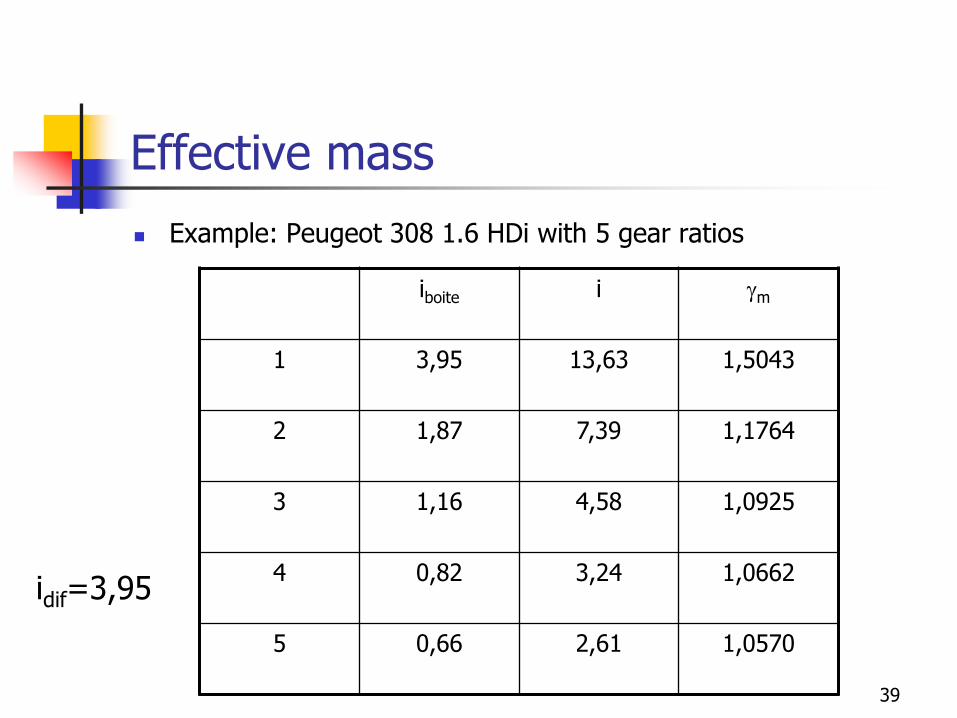
Effective mass
◼ Example: Peugeot 308 1.6 HDi with 5 gear ratios
iboite i gm
1 3,95 13,63 1,5043
2 1,87 7,39 1,1764
3 1,16 4,58 1,0925
4 0,82 3,24 1,0662
5 0,66 2,61 1,0570
idif=3,95
39

Velocity as a function of time
◼ We now proceed to time integration of Newton equation.
◼ Time to accelerate form V1 to V2.
40

Velocity as a function of time
◼ Time to accelerate from V1 to V2:
◼ Alternatively
Genta Fig 4.20 : 1/F as function of time41

Velocity as a function of time
◼ Criteria for gear ratio up shift in order to minimize the acceleration time
◼ If two curves intersects each other: change the ratio at curve intersection
◼ If there is no intersection, then it is necessary to push the ratio up to maximum rotation speed
◼ Lower limit is given by an infinite number of gear ratios, that is a Continuous Variables Transmission (CVT)Genta Fig 4.20 : 1/F as function of time
42

Velocity as a function of time
◼ The solution of differential equation yields the time t as a function of the velocity
◼ The reciprocal function
◼ requires to invert the relation
◼ The changes of gear ratio must be taken into account
43

Velocity as a function of time
G. Genta Fig 4.2144

Distance as a function of the speed
◼ The distance from start can be evaluated by a second integration of the Newton equation
◼ Velocity and distance are linked by the kinematic relation
◼ It comes
45

Distance as a function of the time
◼ One can eliminate the velocity V between the two curves t=f(V) and d=h(V)
◼ On gets the distance as a function of the time:
46

Change of gear ratio
◼ Criteria for changing the gear ratio.
◼ Gear ratio changing is a delicate operation that needs being studied in detail:
◼ Changing the gear box ratio takes some time
◼ Tractive force is interrupted
◼ The vehicle is coasting and slows down
◼ For an expert driver
◼ Small time to change the gear
◼ Reduction of the velocity can be estimated by the first order approximation
47

Change of gear ratio
◼ When several gear change are necessary, the integration needs to be carried out by parts
◼ For instance
◼ with
48


![PERFORMANCE ET COMPORTEMENT DES VEHICULES · Estimation of tire rolling resistance 2001 OE Fitments Size alpha beta a b c mass [kg] SMERF [N] SMERF P SMERF Z Mercury Cougar P205/60R15](https://static.fdocuments.net/doc/165x107/5f553bb9a9e7a6588373f11c/performance-et-comportement-des-estimation-of-tire-rolling-resistance-2001-oe-fitments.jpg)