Performance Based Learning and Assessment Task … Cumbow... · Performance Based Learning and...
21
Performance Based Learning and Assessment Task Discovering Quadratics I. ASSESSSMENT TASK OVERVIEW & PURPOSE: The students are instructed to determine the optimal length of time to maximize the “good” kernels of popped popcorn in the microwave. II. UNIT AUTHOR: Leslie Cumbow, Abingdon High School, Washington County Schools III. COURSE: Algebra II IV. CONTENT STRAND: Algebra II – Functions, Statistics V. OBJECTIVES: • The student will investigate and analyze functions algebraically and graphically. • The student will recognize the general shape of function (absolute value, square root, cube root, rational, polynomial, exponential, and logarithmic) families and will convert between graphic and symbolic forms of functions. A transformational approach to graphing will be employed. Graphing calculators will be used as a tool to investigate the shapes and behaviors of these functions. • The student will investigate and describe the relationships among solutions of an equation, zeros of a function, x-intercepts of a graph, and factors of a polynomial expression. • The student will collect and analyze data, determine the equation of the curve of best fit, make predictions, and solve real-world problems, using mathematical models. Mathematical models will include polynomial, exponential, and logarithmic functions. VI. REFERENCE/RESOURCE MATERIALS: Calculator, Graph paper, Compute access, microwave popcorn (different brand for each group), microwave (at home) VII. PRIMARY ASSESSMENT STRATEGIES: Students will be assessed on how appropriately their data fits the equation. Students will also be assessed on the quality of their marketing presentation. Students will be assessed on how adequately they explain their results. VIII. EVALUATION CRITERIA: • A rubric will be used to include the main points of the discussion. • Determine if functions have been determined correctly. • Check to see if the line of best fit has been calculated correctly • Check the graph of time vs. good kernels and good kernels vs. total kernels IX. INSTRUCTIONAL TIME: The first activity will take approximately two 90 minutes blocks to complete. The second will take one 90 minute block.
Transcript of Performance Based Learning and Assessment Task … Cumbow... · Performance Based Learning and...

Performance Based Learning and Assessment Task
Discovering Quadratics I. ASSESSSMENT TASK OVERVIEW & PURPOSE:
The students are instructed to determine the optimal length of time to maximize the “good” kernels of popped popcorn in the microwave.
II. UNIT AUTHOR: Leslie Cumbow, Abingdon High School, Washington County Schools
III. COURSE: Algebra II
IV. CONTENT STRAND: Algebra II – Functions, Statistics
V. OBJECTIVES: • The student will investigate and analyze functions algebraically and graphically. • The student will recognize the general shape of function (absolute value, square root,
cube root, rational, polynomial, exponential, and logarithmic) families and will convert between graphic and symbolic forms of functions. A transformational approach to graphing will be employed. Graphing calculators will be used as a tool to investigate the shapes and behaviors of these functions.
• The student will investigate and describe the relationships among solutions of an equation, zeros of a function, x-intercepts of a graph, and factors of a polynomial expression.
• The student will collect and analyze data, determine the equation of the curve of best fit, make predictions, and solve real-world problems, using mathematical models. Mathematical models will include polynomial, exponential, and logarithmic functions.
VI. REFERENCE/RESOURCE MATERIALS: Calculator, Graph paper, Compute access, microwave popcorn (different brand for each group), microwave (at home)
VII. PRIMARY ASSESSMENT STRATEGIES: Students will be assessed on how appropriately their data fits the equation. Students will also be assessed on the quality of their marketing presentation. Students will be assessed on how adequately they explain their results.
VIII. EVALUATION CRITERIA: • A rubric will be used to include the main points of the discussion. • Determine if functions have been determined correctly. • Check to see if the line of best fit has been calculated correctly • Check the graph of time vs. good kernels and good kernels vs. total kernels
IX. INSTRUCTIONAL TIME: The first activity will take approximately two 90 minutes blocks to complete. The second will take one 90 minute block.
2
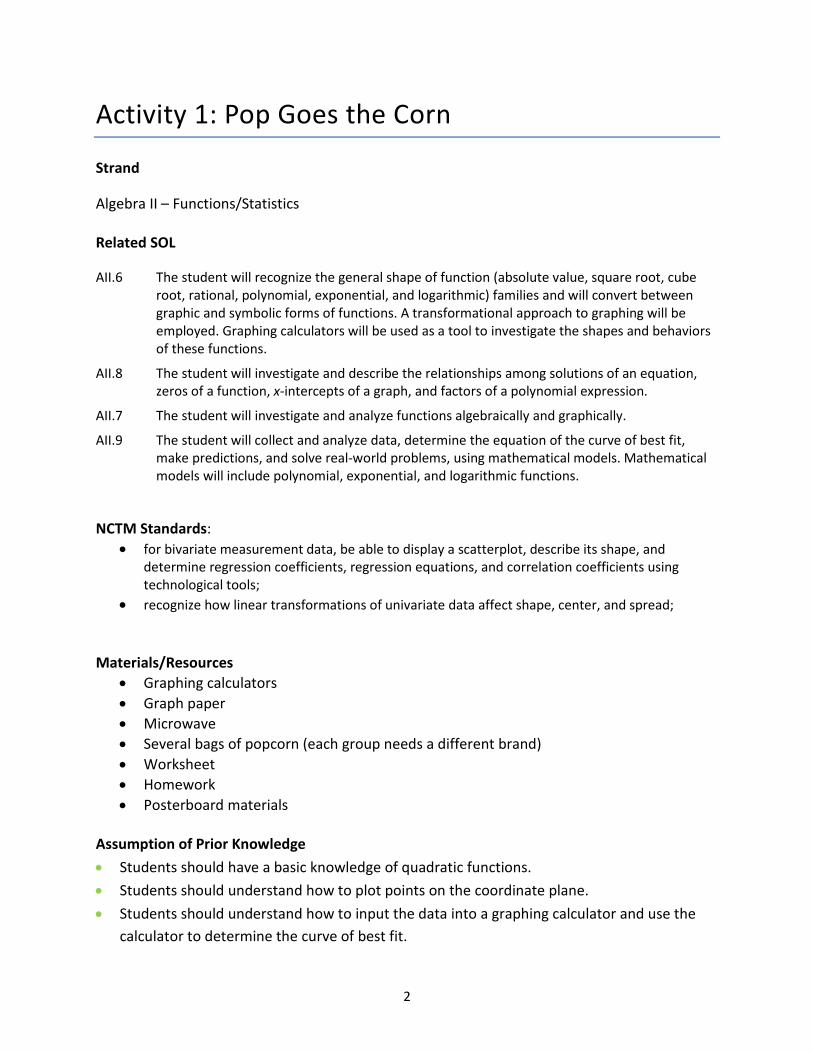
Activity 1: Pop Goes the Corn
Strand
Algebra II – Functions/Statistics Related SOL
AII.6 The student will recognize the general shape of function (absolute value, square root, cube root, rational, polynomial, exponential, and logarithmic) families and will convert between graphic and symbolic forms of functions. A transformational approach to graphing will be employed. Graphing calculators will be used as a tool to investigate the shapes and behaviors of these functions.
AII.8 The student will investigate and describe the relationships among solutions of an equation, zeros of a function, x-intercepts of a graph, and factors of a polynomial expression.
AII.7 The student will investigate and analyze functions algebraically and graphically.
AII.9 The student will collect and analyze data, determine the equation of the curve of best fit, make predictions, and solve real-world problems, using mathematical models. Mathematical models will include polynomial, exponential, and logarithmic functions.
NCTM Standards: • for bivariate measurement data, be able to display a scatterplot, describe its shape, and
determine regression coefficients, regression equations, and correlation coefficients using technological tools;
• recognize how linear transformations of univariate data affect shape, center, and spread;
Materials/Resources
• Graphing calculators • Graph paper • Microwave • Several bags of popcorn (each group needs a different brand) • Worksheet • Homework • Posterboard materials
Assumption of Prior Knowledge • Students should have a basic knowledge of quadratic functions. • Students should understand how to plot points on the coordinate plane. • Students should understand how to input the data into a graphing calculator and use the
calculator to determine the curve of best fit.

3
• Students should know how to use the curve of best fit to make predictions.
Introduction: Setting Up the Mathematical Task In this activity, you will investigate the relationship between the amount of time you microwave a bag of popcorn and how many “good” kernels it produces. A “good” kernel is defined as one that is fully popped and has no burnt places. You will then use this data to make a curve of best fit for your particular brand of popcorn. Activity 1: Popcorn Data Collection
1. Divide into groups of 3-4 2. The teacher will assign your group a brand of popcorn and issue you 8 unpopped bags. 3. Your group will pop the popcorn in the microwave (at home) using various lengths of
time given in the table. 4. After you have popped the bag, you will count the number of “good” kernels (fully
popped with no burnt places) and the total kernels for each bag. 5. You will put your collected data into a table of time versus good kernels and another
table of good kernels versus total kernels. 6. Graph both sets of data on the graph paper and determine what type of function you
have for each. 7. Using the graphing calculator, find the curve of best fit for each table for your brand. 8. Determine the optimal time you should pop your brand to maximize the amount of
good kernels. 9. Use the equations to make predictions about how many kernels other times would
produce and how many total kernels you would have based on how many good kernels you had.
10. Design a poster for a marketing campaign based on your findings and present to the class.
Student Exploration:
• Individual Work – The individual student will make a conjecture of how they think the graph of the time versus “good” kernels would appear. The student must have a basic knowledge before entering small group work.
• Small Group Work - The students will pop their 8 bags of popcorn for 8 different lengths of time and count how many “good” kernels they had in each bag. They will then note the data in the form of a table and enter it into the graphing calculator. Once the data is entered, they should determine the equation for the curve of best fit. After they find the

4
equation for the curve of best fit, they will use it to find the optimal amount of time they should pop their brand of corn to maximize the amount of “good” kernels. Your group will then make a marketing poster for your product to share the results with the class.
• Whole Class Sharing/Discussion – The small groups will then come back together to present their findings to the class.
Student/Teacher Actions: • What should students be doing? The students should be following the directions above
within their small groups. • What should teachers be doing to facilitate learning? Teachers should be constantly
monitoring the groups to ensure they are using the correct processes on the calculator. They should also be available for methodical questions but not hints on the type of function. If students are having trouble, they can use the textbook, internet, or classmates for help.
• Possible questions – Possible problems the students may face are those dealing with what type of function the two graphs create and what the relationship is between them. Once the students choose the correct function and find the curve of best fit, they should be able to discover the correct equation quickly.
• Technology Integration or Cooperative/Collaborative Learning Possibilities – Students will be using the graphing calculator to produce the curve of best fit.
Monitoring Student Responses
o Students will communicate with their peers in a group discussion why they chose the function.
o Students will record those chosen equations that work and also those that will not work and why.
o Teacher will also extend extra instruction to those struggling and will also re-shuffle the groups so that different ideas can be spread by different students into different groups.
• Summary o Students will design a marketing poster of their findings to sell their brand of
popcorn and present the findings to the class. o Students will turn in group work tables and poster and individual paragraphs to
document their work.

5
Assessment List and Benchmarks
Assessment List for Activity: Pop goes the Corn
Earned Assessment
Num Element Point Value
Self Teacher
1 Corn is popped for 10 different lengths of time and data recorded.
2
2 Total good kernels and total kernels for each bag are recorded.
2
3 Tables are correctly labeled and data is entered into the calculator.
2
4 A graph is drawn for the time vs. good kernels 2 5 An equation is generated for the time vs. good
kernels relationship. 2
6 A graph is drawn for the good kernels vs. total kernels 2 7 An equation is generated for the good kernels vs.
total kernels 2
8 Predictions are made based on the equations. 2 9 Written conclusion is turned in with group work. 4 10 Poster and presentation are completed. 10 Total 30

6
RUBRIC FOR ACTIVITY # Element 0 1 2 1 Corn is popped for 10
different lengths of time and data recorded.
No popped bags Only some bags were popped
All bags were popped
2 Total good kernels and total kernels for each bag are recorded.
No data recorded Some data recorded
All data recorded
3 Tables are correctly labeled and data is entered into the calculator.
No tables labeled or entered
Some tables labeled and entered
All tables labeled and entered
4 A graph is drawn for the time vs. good kernels
No graph drawn Graph drawn but not accurately
Accurate graph drawn reflecting data from table.
5 An equation is generated for the time vs. good kernels relationship.
No equation Equation generated but does not fit data
Correct equation generated
6 A graph is drawn for the good kernels vs. total kernels
No graph drawn Graph drawn but not accurately
Accurate graph drawn reflecting data from table.
7 An equation is generated for the good kernels vs. total kernels
No equation Equation generated but does not fit data
Correct equation generated
8 Predictions are made based on the equations.
No predictions made Predictions made but not entirely correct
Predictions made correctly
9 Written conclusion is turned in with group work.
No written conclusion Written conclusion turned in but does not discuss all findings(2)
Written conclusion submitted with all the points of the activity discussed.(4)
10 Poster and presentation are completed.
No poster or presentation
Poster and presentation done but do not include all findings(5)
Poster and presentation completed with all findings included.(10)

7
Benchmarks

8

9
Homework
Use the given data to find the curve of best fit in the calculator.

10

11
1. Divide into groups of 3-4 2. The teacher will assign your group a brand of popcorn and issue you 8 unpopped bags. 3. Your group will pop the popcorn in the microwave (at home) using various lengths of
time given in the table. 4. After you have popped the bag, you will count the number of “good” kernels (fully
popped with no burnt places) and the total kernels for each bag. 5. You will put your collected data into a table of time versus good kernels and another
table of good kernels versus total kernels. 6. Graph both sets of data on the graph paper and determine what type of function you
have for each. 7. Using the graphing calculator, find the curve of best fit for each table for your brand. 8. Determine the optimal time you should pop your brand to maximize the amount of
good kernels. 9. Use the equations to make predictions about how many kernels other times would
produce and how many total kernels you would have based on how many good kernels you had.
10. Design a poster for a marketing campaign based on your findings and present to the class.
Group Members___________________
___________________ ___________________ ___________________
Popcorn Brand ___________________________
Bag number Time Good Kernels 1 90 seconds 2 120 seconds 3 150 seconds 4 180 seconds 5 210 seconds 6 240 seconds 7 270 seconds 8 300 seconds
Equation for Time vs Good Kernels: _________________________
Predictions for 2 other times not in your table: _______________________________

12
Bag number Time Good Kernels Total Kernels 1 90 seconds 2 120 seconds 3 150 seconds 4 180 seconds 5 210 seconds 6 240 seconds 7 270 seconds 8 300 seconds
Equation for Good vs Total: _________________________
Predictions for 2 other good kernel values not in your table: _______________________________

13
What kind of function is each of these? How do you know that it fits this family of functions? What evidence do you have to support your decision for this family of functions (relationship between the data, graphical representations, etc)? What would be the appropriate domain for each function? What does domain represent in each function, in context of the question? What would be the optimal time to pop your brand of popcorn to get the most GOOD kernels? How did you figure this out? What is this value graphically? What is the relationship between the two graphs?

14
Activity 2: The Real Quadratics of the United States
Strand
Algebra II – Functions/Statistics Related SOL
AII.6 The student will recognize the general shape of function (absolute value, square root, cube root, rational, polynomial, exponential, and logarithmic) families and will convert between graphic and symbolic forms of functions. A transformational approach to graphing will be employed. Graphing calculators will be used as a tool to investigate the shapes and behaviors of these functions.
AII.8 The student will investigate and describe the relationships among solutions of an equation, zeros of a function, x-intercepts of a graph, and factors of a polynomial expression.
AII.7 The student will investigate and analyze functions algebraically and graphically.
AII.9 The student will collect and analyze data, determine the equation of the curve of best fit, make predictions, and solve real-world problems, using mathematical models. Mathematical models will include polynomial, exponential, and logarithmic functions.
NCTM Standards: • for bivariate measurement data, be able to display a scatterplot, describe its shape, and
determine regression coefficients, regression equations, and correlation coefficients using technological tools;
• recognize how linear transformations of univariate data affect shape, center, and spread;
Materials/Resources
• Graphing calculators • Graph paper • Computer • Geogebra • Picture of a Quadratic • Activity sheet • Homework
Assumption of Prior Knowledge • Students should have a basic knowledge of quadratic functions including vertex form of a
quadratic equation and identifying the components of a parabola in the graph. • Students should understand how to plot points on the coordinate plane.

15
• Students should understand how to input the data into a graphing calculator and use the calculator to determine the curve of best fit.
• Students should know how to use the curve of best fit to make predictions. • Working knowledge of Geogebra software.
Introduction: Setting Up the Mathematical Task In this activity, the students will find pictures of parabolic curves in the real world using the internet. The students will save these pictures and paste them into Geogebra to find the vertex. They will also need to research the actual dimensions of the object so they can adjust the scale of their axis. Suggestions to offer students: McDonald's sign, bridge, water fountain, hose Activity 2: The Real Quadratics of the United States
1. Find an example of a real world parabolic curve and its dimensions. (You cannot use the Gateway Arch! Can be structural, manmade, or formed by you) 2. Open Geogebra and insert the picture into the file. Include the axis and adjust the scale to correspond to the actual size. 2. Insert a point for the vertex of your picture. 3. Find an additional point that your graph passes through. 4. Calculate the equation in vertex form for the curve using the vertex and the point. 5. Expand your equation into standard form and then pair up. Each partner gives their standard form equation to the other and then attempts to calculate the vertex of their partner's parabola. 6. Perform the requested transformations on each. 7. Be prepared to discuss your findings with the group.
Student Exploration: • Individual Work – Each student should have a picture of a quadratic they can save to
the computer. They will then work individually on finding the equation for their quadratic.
• Small Group Work - The students will work with a partner and attempt to determine the other person’s vertex from the standard form.
• Whole Class Sharing/Discussion – The small groups will then come back together to present talk about their findings as a class.
Student/Teacher Actions:

16
• What should students be doing? The students should be following the directions above individually and within their small groups.
• What should teachers be doing to facilitate learning? Teachers should be constantly monitoring the groups to ensure they are using the correct processes on the computer. They should also be available for methodical questions but not hints on the equation for the function. If students are having trouble, they can use the textbook, internet, or classmates for help.
• Possible questions – Possible problems the students may face are those dealing with how to use the software to find points and how to calculate the equation of the function.
• Technology Integration or Cooperative/Collaborative Learning Possibilities – Students will be using Geogebra software to determine points of their quadratic function.
Monitoring Student Responses
o Students will communicate with their peers in a group discussion why they chose the function.
o Students will record those chosen points that work and also those that will not work and why.
o Teacher will also extend extra instruction to those struggling and will also re-shuffle the groups so that different ideas can be spread by different students into different groups.
• Summary o Students will turn in a copy of their picture with the axis and the points labeled
as well as the equations they determined. o Students will analyze the transformations the teacher assigned and explain how
it would affect the item pictured.

17
Assessment List and Benchmarks Assessment List for Activity: Real Quadratics of the United States
Earned Assessment
Num Element Point Value
Self Teacher
1 Picture is of a parabola 2 2 Dimensions of parabola are noted. 2 3 Picture is inserted into Geogebra correctly 2 4 Vertex and second point are identified correctly 2 5 Equation in vertex form is computed correctly 2 6 Vertex of partner’s equation is calculated correctly 2 7 Transformations are done correctly 2 8 Worksheet is completed 2 9 Presentation is made and findings are explained. 2 Total 18
RUBRIC FOR ACTIVITY # Element 0 1 2 1 Picture is of a parabola No picture is turned in N/A Picture is of a
Parabola 2 Dimensions of parabola are
noted. No dimensions given Dimensions given
incorrectly
3 Picture is inserted into Geogebra correctly
No picture inserted N/A Picture inserted correctly
4 Vertex and second point are identified correctly
Points are not correctly identified
One point is correctly identified
Both points are correctly identitfied
5 Equation in vertex form is computed correctly
No equation is computed
Equation is computed with error
Equation is done correctly
6 Vertex of partner’s equation is calculated correctly
Vertex is not found Vertex is found but incorrect
Correct vertex is found
7 Transformations are done correctly
Transformations are not done
Transformations are done but incorrectly
Transformations are done correctly
8 Worksheet is completed Worksheet is not completed
Worksheet is completed with error
Worksheet is correctly completed
9 Presentation is made and findings are explained.
Presentation is not made
Presentations is made without all of the information
Presentation is made with complete findings

18
Benchmarks
Dimensions of the Gateway Arch:
630 feet tall and 630 feet wide
Your graph:
Vertex: (3.81, 7.74)
Point: (0.64, 3.08)
Equation in vertex form: y = -0.4637(x-3.81)2 +7.74
Your partner’s equation in standard form:
Vertex of your partner’s equation:
Transformations of your function:
What would happen to the equation if we multiplied the a-value by 12? Changes to -0.23185
How does this affect the item in your picture? the arch would be wider because the absolute value is smaller
If you picked up your parabola and moved it to the left 4 and down 2, how does this affect your equation? y = -0.4637(x-7.81)2 + 5.74

19
Homework
Use the graph provided to write an equation for a parabola in vertex form and standard form.
1) Vertex: __________________
Standard: ________________
2) Vertex: __________________
Standard: ________________
3) Vertex: __________________
Standard: ________________
4) Vertex: __________________
Standard: ________________
5) vertex (-3, 6); point (1, -2) Vertex: __________________
Standard: ________________

20

21
Name ______________________
Activity: The Real Quadratics of the United States
1. Find an example of a real world parabolic curve and its dimensions. (You cannot use the Gateway Arch!) 2. Open Geogebra and insert the picture into the file. Include the axis and adjust the scale to correspond to the actual size. 2. Insert a point for the vertex of your picture. 3. Find an additional point that your graph passes through. 4. Calculate the equation in vertex form for the curve using the vertex and the point. 5. Expand your equation into standard form and then pair up. Each partner gives their standard form equation to the other and then attempts to calculate the vertex of their partner's parabola. 6. Perform the requested transformations on each.
Attach a printout of your Geogebra sketches and the figures dimensions.
Your equation:
Vertex: ____________
Point: _____________
Equation in vertex form: _____________________________
Your partner’s equation in standard form: ______________________
Vertex of your partner’s equation: _____________________
Transformations of your function:
What would happen to the equation if we multiplied the a-value by 12? ____________________
What does this do to your parabola? How would this change affect the surroundings?
How does this affect the item in your picture? ________________________________________
______________________________________________________________________________
If you picked up your parabola and moved it to the left 4 and down 2, how does this affect your equation? _____________________________________________________________________