Performance-Based Financing in Healthcare
30
Performance-Based Financing in Healthcare: A Magic Bullet? September 2013 MSc International Development Development Economics Thesis code: DEC-80424 Jan Duchoslav Francesco Cecchi (Supervisor) Prof. Erwin Bulte (Co-examiner)
Transcript of Performance-Based Financing in Healthcare

Performance-Based Financing in Healthcare:
A Magic Bullet?
September 2013
MSc International Development
Development Economics
Thesis code: DEC-80424
Jan Duchoslav
Francesco Cecchi (Supervisor)
Prof. Erwin Bulte (Co-examiner)

1
ABSTRACT
Using a unique panel of output and expenditure data from small private not-for-profit
healthcare facilities in Uganda in combination with a patient survey focused on the perceived
quality of healthcare, I estimate the effect of introducing performance-based financing (PBF)
on the cost-effectiveness and quality of healthcare provision. In the observed facilities, PBF
increased output and cost-effectiveness by more than 30%. However, the increase was highly
heterogeneous across different types of output, suggesting that the PBF incentives have been
misdesigned. Moreover, better cost-effectiveness came at the cost of a 6% point decrease in
the quality of services as perceived by the patients. I suggest that grater care be taken when
designing the PBF incentive structure and that quality indicators be included in it in order to
avoid these shortcomings.
Keywords: performance-based financing, healthcare cost-effectiveness, healthcare
quality, impact evaluation, Uganda

2
AKNOWLEDGEMENTS
The research for this paper was part of a larger impact evaluation effort headed by Erwin
Bulte of Wageningen University, to whom I am grateful for giving me great independence to
pursue my ideas. I am also grateful for the tireless work of Elena Degli Innocenti and Vuk
Pavicevic, who did an outstanding job assisting with the preparations for and supervising the
execution of the fieldwork in Uganda. Eria Hisali, Joan Kirabo, Sandra Basamera and Aisha
Nanyiti of Makerere University were also helpful in various stages of the work, as were all
my enumerators. Last but not least, this work would not have been finished without the ideas
and advice of Francesco Cecchi – both in the office and in the field.

3
TABLE OF CONTENTS
ABSTRACT ............................................................................................................................... 1
AKNOWLEDGEMENTS .......................................................................................................... 2
TABLE OF CONTENTS ........................................................................................................... 3
LIST OF TABLES ..................................................................................................................... 3
1. INTRODUCTION .................................................................................................................. 4
2. BACKGROUND .................................................................................................................... 5
(a) PBF: a policy to improve healthcare provision ................................................................ 5
(b) PBF in Uganda .................................................................................................................. 7
3. DATA AND ANALYTICAL APPROACH .......................................................................... 8
(a) Cost-effectiveness ............................................................................................................. 8
(b) Quality .............................................................................................................................. 9
4. ANALYSIS AND RESULTS .............................................................................................. 11
(a) Cost-effectiveness ........................................................................................................... 11
(b) Quality ............................................................................................................................ 20
5. CONCLUSIONS .................................................................................................................. 23
REFERENCES ......................................................................................................................... 26
APPENDICES .......................................................................................................................... 29
LIST OF TABLES
Table 1: Panel descriptive statistics ........................................................................................... 9 Table 2: Sample balance – facility characteristics ................................................................... 10 Table 3: Sample balance – individual characteristics and MQP .............................................. 11 Table 4: Cost-effectiveness – static models ............................................................................. 14 Table 5: Nijman-Verbeek tests for balanced panel .................................................................. 15 Table 6: Cost-effectiveness – dynamic models ........................................................................ 17 Table 7: Cost-effectiveness – robustness checks ..................................................................... 18 Table 8: Perceived quality ........................................................................................................ 22

4
1. INTRODUCTION
Performance-based financing (PBF) has lately been gaining popularity as a measure to
improve the quality and efficiency of healthcare provision (Eldridge & Palmer, 2009; Hecht,
Batson, & Brenzel, 2004; Kinoti, 2011; Sekabaraga, Diop, & Soucat, 2011). As the term
suggests, PBF makes the amount of funding a healthcare provider receives conditional on its
performance, most commonly defined in terms of output. Predictably, it seems that healthcare
providers tend to respond positively to such incentive schemes by increasing their output,
presumably as long as the marginal revenue offsets the marginal costs associated with
increased output (Rusa, Schneidman, Fritsche, & Musango, 2009).
Increased output is, however, scarcely the sole goal of policies aimed at improving the
provision of healthcare, even in developing countries. In fact, the World Bank sees PBF as a
means to achieve greater efficiency and quality of healthcare delivery as well as better access
to and higher utilization of healthcare (Brenzel, 2009). While it is crystal clear how PBF
schemes based on output targets can (and often do) lead to actual increases in output, its
contribution to achieving better quality of healthcare services has so far been subject to little
research.1
This paper aims at filling in this gap by utilizing a unique dataset from private not-for-profit
health centers in Uganda. In particular, I estimate the effects of introducing PBF on the cost-
effectiveness of healthcare service delivery, which is extremely important especially in the
under-funded and ineffective healthcare systems of many developing countries. I also
estimate the effects of PBF on the perceived quality of healthcare services, which, besides
being a function of the objective quality of the services (Baltussen, Yé, Haddad, & Sauerborn,
2002), is an important determinant of their utilization (Duong, Binns, & Lee, 2004).
1 A notable exceptions are Soeters et al. (2011) and Basinga et al. (2010).

5
The rest of the paper is organized as follows: In Chapter 2, I provide the background for the
study, focusing on the latest literature on PBF and on the current state of the healthcare
system in Uganda. In Chapter 3, I describe the data and outline the methodological approach
of the study, presenting the results in Chapter 4. The results are then summarized in chapter
two where I also conclude with suggestions for further research and some policy implications.
2. BACKGROUND
(a) PBF: a policy to improve healthcare provision
The growing evidence that the health of its population is an important determinant of a
country’s economic growth (Bloom & Canning, 2000) has provided an additional argument –
besides the ethical ones – for the need for functional and accessible healthcare provision. This
in turn is essentially a function of structural inputs (including people, infrastructure,
knowledge, drugs, technology, etc.) and the processes transforming these inputs into outputs
(Eichler, 2006). Though usually thought off as complementary, the right processes can – to an
extent – make up for a lack of inputs (Peabody, Tozija, Muñoz, Nordyke, & Luck, 2004),
which is important especially in developing countries with often underfunded healthcare
systems. By improving the transforming processes, more output of higher quality can be
produced using the same limited inputs.
Performance-based financing (PBF)2 has, over the years, become one of the favorite ways to
stimulate such improvements (Eldridge & Palmer, 2009; Hecht et al., 2004; Kinoti, 2011;
Sekabaraga et al., 2011). The basic idea behind PBF – reducing the principal-agent problem
by conditioning funding on performance – is simple, and has in fact been extensively used in
other contexts for a long time. Perhaps the best-known example are commission payments to
2 Depending on the author and the institutional context, PBF is also sometimes referred to as results-based financing (RBF) or pay-for-performance (P4P). The terms are largely interchangeable.

6
sales representatives. In order to condition payment on performance, however, one must first
be able to measure performance in a consistent manner. This is relatively straight forward in
the case of a salesman who can report a simple dollar figure which easily captures his success,
but considerably more complicated in the case of a healthcare facility whose output is much
more multi-dimensional and the quality of whose work can hardly be monetized. Even if
performance is understood in its most limited sense as output, the many different types of
output produced by a healthcare provider have to be taken into account when assessing its
performance: either individually or according to some conversion logic. The former can lead
to an overly complex set of performance targets, the latter runs a danger of over- or
underestimating some types of output at the expense of others. Expanding the notion of
performance to include the quality of the output produced naturally complicates the matter
even more, and though some PBF schemes have made attempts to condition funding on
performance in quality indicators (Basinga, Gertler, & Vermeersch, 2010; Perrot, de
Roodenbeke, Musango, & Fritsche, 2010), most seem to limit themselves to assessing output.
Besides the various ways in which they define and measure performance, PBF schemes differ
along three major lines: the performance targets and associated payments can apply to
individual employees or to entire facilities, the conditional payments may make up the entire
funding of the facility (or salary of the individual) or there may be a fixed component, and the
payments may be conditional on fixed targets or incremental (Perrot et al., 2010). Each PBF is
therefore quite unique (and operates in a unique setting), and it is therefore hard – if not
impossible – to proclaim any combination of approaches as best practice. There is,
nonetheless, growing evidence that the policy in general can have some positive effects.
Several studies show how PBF has helped achieve specific – mostly output – targets (Eichler,
2006; Hecht et al., 2004; Meessen, Kashala, & Musango, 2007; Meessen, Musango, Kashala,
& Lemlin, 2006; Soeters, Habineza, & Bob, 2006), while accounts of unsuccessful

7
implementation are much rarer (Banerjee, Glennerster, & Duflo, 2008; Morgan, 2010).
Although the success of PBF could be overstated due to a publication bias, it certainly seems
to merit further investigation.
(b) PBF in Uganda
The health sector in Uganda is characterized by a high degree of fragmentation with a mixture
of public, private not-for-profit and private for-profit healthcare providers. Although the
Ugandan Ministry of Health takes non-governmental providers into account in its planning
and provides partial funding to some of them, private health facilities and practices, which
account for half of Uganda’s reported healthcare output, operate largely independently of
public ones (“Health Sector Strategic Plan III: 2010/11-2014/15,” 2010). The policies
governing healthcare services in the country are thus logically as diverse as the service
providers. In this complex situation, the Ugandan Ministry of Health piloted a large-scale PBF
program for non-for-profit healthcare providers, which unfortunately turned out to be a failure
(Morgan, 2010).
In this paper, I focus on one of the largest not-for-profit private healthcare providers in the
country – the Uganda Catholic Medical Bureau (UCMB). The UCMB runs an extensive
country-wide network of hospitals and health centers accounting for over a third of private
healthcare facilities in Uganda (“Health Sector Strategic Plan III: 2010/11-2014/15,” 2010). In
2009, it introduced a pilot PBF scheme in 6 of its health centers to test the practical feasibility
of this new approach before possibly extending the scheme for all its health units.
Under the PBF scheme, the funding of the facilities is supplemented by a bonus paid out
partially or in full depending on the level of achievement of preset output targets. The targets
are defined in terms of Standard Units of Output (SUO) – a unit that standardizes various
types of output to the equivalent of an outpatient visit. The maximum possible bonuses can

8
make up only up to about 5% of the total income of the health centers,3 and cannot be used for
individual salary bonuses. The potential financial incentives of the bonus are therefore rather
limited. On the other hand, the impact that they may have can be achieved relatively cheaply.
I take advantage of this framework to estimate the effect of PBF on the cost-effectiveness of
healthcare provision and on the perceived quality of provided health services.
3. DATA AND ANALYTICAL APPROACH
(a) Cost-effectiveness
To gauge the effect of PBF on the cost-effectiveness of healthcare delivery, I use a range of
output and expenditure measurements collected by the UCMB from all its health units, which
amount to a panel spanning up to 206 small-sized health centers over a period of 10 years (FY
2001/2002 – FY 2010/2011), three of which follow the introduction of PBF financing.
Output is measured using the Standard Unit of Output (SUO) – a unit in which the PBF
targets are defined. The SUO is constructed from common services typically provided by
small health facilities, taking into account their relative input requirements in terms of cost
and time:
(1) ��� = ��� + 5 ∗ �� + 2 ∗ � � + 0.3 ∗ ��� + 0.2 ∗ ��
where OPD are outpatient visits, IPA inpatient admissions, DEL deliveries, ANC ante-natal
care visits (including family planning) and IMM immunizations. Total expenditures (EXP) are
measured in millions of 2010 Ugandan Shillings (USh.). Cost-effectiveness (EFF) is
consequently expressed in SUO per million (2010) Ush. The panel descriptive statistics for
3 About three quarters of the income of the facilities is derived from user fees (comparable to the “unofficial” fees often charged in public facilities). Circa one fifth comes from UCMB and its donors, with the remainder made up of government grants.
9
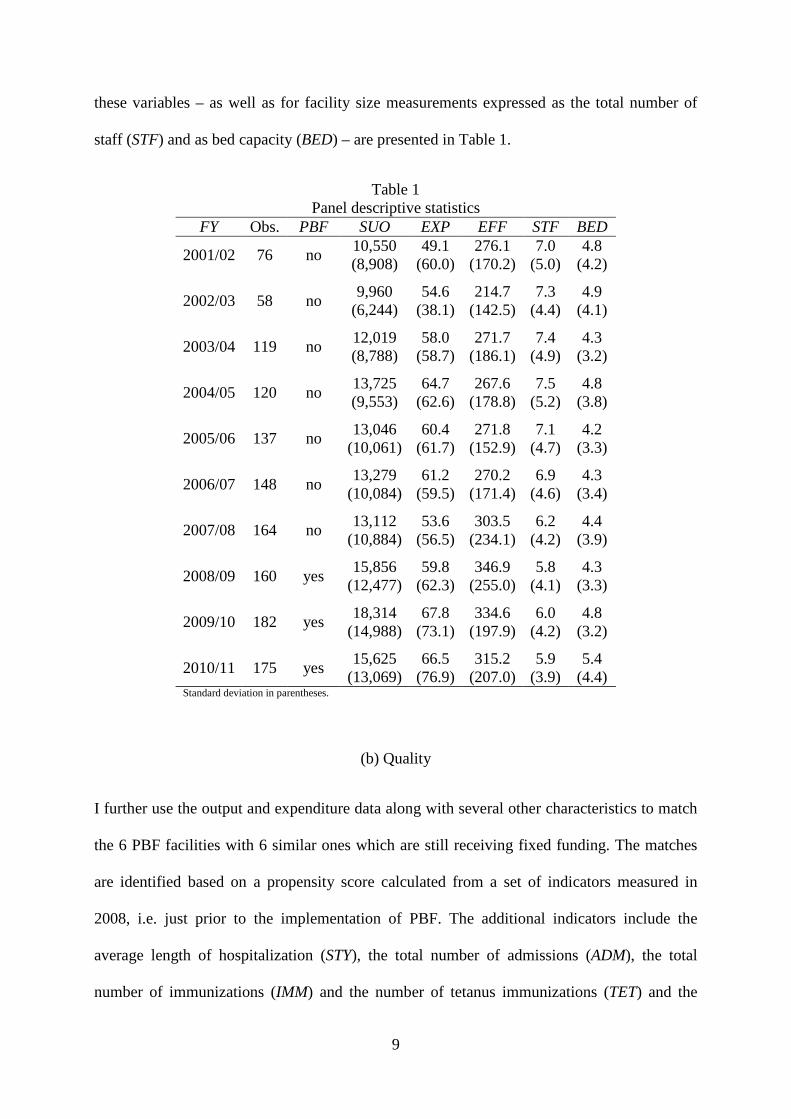
these variables – as well as for facility size measurements expressed as the total number of
staff (STF) and as bed capacity (BED) – are presented in Table 1.
Table 1 Panel descriptive statistics
FY Obs. PBF SUO EXP EFF STF BED
2001/02 76 no 10,550 (8,908)
49.1 (60.0)
276.1 (170.2)
7.0 (5.0)
4.8 (4.2)
2002/03 58 no 9,960
(6,244) 54.6
(38.1) 214.7
(142.5) 7.3
(4.4) 4.9
(4.1)
2003/04 119 no 12,019 (8,788)
58.0 (58.7)
271.7 (186.1)
7.4 (4.9)
4.3 (3.2)
2004/05 120 no 13,725 (9,553)
64.7 (62.6)
267.6 (178.8)
7.5 (5.2)
4.8 (3.8)
2005/06 137 no 13,046
(10,061) 60.4
(61.7) 271.8
(152.9) 7.1
(4.7) 4.2
(3.3)
2006/07 148 no 13,279
(10,084) 61.2
(59.5) 270.2
(171.4) 6.9
(4.6) 4.3
(3.4)
2007/08 164 no 13,112
(10,884) 53.6
(56.5) 303.5
(234.1) 6.2
(4.2) 4.4
(3.9)
2008/09 160 yes 15,856
(12,477) 59.8
(62.3) 346.9
(255.0) 5.8
(4.1) 4.3
(3.3)
2009/10 182 yes 18,314
(14,988) 67.8
(73.1) 334.6
(197.9) 6.0
(4.2) 4.8
(3.2)
2010/11 175 yes 15,625
(13,069) 66.5
(76.9) 315.2
(207.0) 5.9
(3.9) 5.4
(4.4) Standard deviation in parentheses.
(b) Quality
I further use the output and expenditure data along with several other characteristics to match
the 6 PBF facilities with 6 similar ones which are still receiving fixed funding. The matches
are identified based on a propensity score calculated from a set of indicators measured in
2008, i.e. just prior to the implementation of PBF. The additional indicators include the
average length of hospitalization (STY), the total number of admissions (ADM), the total
number of immunizations (IMM) and the number of tetanus immunizations (TET) and the

10
catchment population (POP). This results in two statistically similar groups of six facilities,
balanced across a range of indicators (see Table 2).
Table 2 Sample balance – facility characteristics Control PBF
Mean Std. dev. Mean Std. dev. Diff. t EXP 110 180 85 150 -29 0.770 STY 1.52 1.34 1.38 1.22 0 0.898 IPD 1,418 1,647 1,148 1,910 -270 0.850 ADM 496 530 1,123 703 627 0.208 BED 13 10 19 8 7 0.362 IMM 3,726 2,118 8,334 7,089 4,607 0.179 TET 814 645 1,469 1,242 656 0.286 STF 8 7 9 6 1 0.805 POP 6,795 3,639 10,000 3,246 3,223 0.137 SUO 7,374 6,411 9,673 9,147 2,299 0.629
Each of the resulting 12 units was further matched with the nearest similarly-sized public
facility,4 and with a village half-way between the public-private pair. This makes it possible to
account for relative differences in perceived quality vis-à-vis available alternative providers.
In 2012, a customer satisfaction survey was conducted in these 24 facilities – as well as in
villages on the border of the catchment area of each private-public pair – to gauge the
perceived quality of their service. In total, 384 interviews were carried out, which – excluding
respondents who had not visited the catholic facilities in the three years prior to the interview
– resulted in 204 not incidentally truncated interviews. From answers to a set of Likert-type
questions regarding various aspects of quality of service (see Appendix 1 for a list of the
questions), I factor out an index of perceived quality (PQ). Other personal-level confounding
characteristics measured through the survey include a physical health index5 (PHI), an asset
4 The Ugandan Ministry of Health uses five categories for small healthcare facilities ranging from the smallest Health Centres I (HC I) to the largest Health Centres V (HC V). All the PBF facilities are either HC II or HC III, and were always matched with the nearest public facility of the same category. 5 The physical health index is based on the SF-12 Health Survey as proposed by Ware, Kosinski and Keller (1996).

11
index6 (ASI) approximating wealth, functional literacy (LIT) – a dummy equal to one if the
respondent reads a newspaper on a regular basis, sex (MAL) – a dummy equal to one if the
respondent is male, and age (AGE). Finally, MQP is the mean perceived quality of the
matched public facility measured in the same way as PQ.7 As can be seen in Table 3, the
sample is well balanced across all the confounding characteristics.
Table 3 Sample balance – individual characteristics and MQP
Control PBF Mean Std. dev. Mean Std. dev. Diff. t
PHI 0.534 0.296 0.472 0.304 -0.063 0.1388 ASI 0.270 0.186 0.274 0.199 0.004 0.8860 LIT 0.442 0.500 0.402 0.493 -0.040 0.6008 MAL 0.287 0.455 0.282 0.452 -0.005 0.9323 AGE 37.438 19.008 35.857 14.685 -1.581 0.5145 MQP 0.335 0.030 0.365 0.023 0.030 0.5438
Combining the results of the survey with the results of the panel analysis, I can estimate not
only the effect of PBF on the cost-efficiency, but also on the (perceived) quality of healthcare
services.
4. ANALYSIS AND RESULTS
(a) Cost-effectiveness
The basic model used to estimate the effect of PBF on cost-effectiveness is derived from a
simplified Cobb-Douglass production function where inputs are measured by total
expenditures (EXP), total number of staff (STF) and capacity (BED), with the addition of a
dummy variable representing the introduction of performance base financing (PBF) (see
6 The asset index is obtained by principal factor analysis from a list of assets owned by the respondent’s household following Sahn and Stifel (2003). 7 Since not all respondent visited both the private and the public facility recently, I use the mean perceived quality of the main public competitor rather than the quality perceived by each particular respondent as a control.

12
equation (2)). Although using an indicator from which the dependent variable was constructed
as a regressor can plague a model with endogeneity, including EXP on the right hand side is
not a problem in this case thanks to its low correlation with EFF (-0.291).8
(2) �� ���� = �� + ������� + �� �� ���� + � �� �!��� + �" �� � ��� + #� + $��
In a pooled least squares model (OLS), ηi is assumed to be equal zero. It is assumed to be
independent both of the regressor matrix of Xit and the residuals εit for all t=1,…,10 in the
random-effects model (RE), or only of εit in the fixed-effects model (FE). I will verify if these
assumptions hold using a series of tests. The existence of the fixed effects ηi can be tested
through a joint F-test with H0: ηi=0 for all i, applied on a least squares dummy variable
regression (LSDV) with i–1 individual dummies. Stata produces a similar test in its output of
FE. In this case, the value of F(210, 1165)=4.19, which is significant at the 1% level, clearly
indicates the presence of fixed effects, rendering the pooled OLS model biased. A fixed- or
random-effects model is therefore preferable. The Hausman specification test, resulting in a
statistically insignificant value of Χ2(4)=6.69, then reveals that the RE model, which is more
efficient than the FE model, is consistent, and therefore preferable to FE.
I further run a likelihood-ratio (LR) test on the maximum-likelihood parameter estimates of
generalized least squares (GLS) specifications of the model with and without
heteroskedasticity (Wiggins & Poi, 2001) to verify that the assumption of homoskedasticity
(implicit in all three previous estimations) holds. The resulting LR Χ2(210)=491.83 is
significant at the 1% level, rejecting the H0 of homoskedasticity. To correct for this, I apply
cluster-robust standard errors in all three estimations (presented in Table 4). All the
estimations suggest an enormously positive effect of the introduction of PBF on cost-
effectiveness of service provision.
8 This is corroborated by the fact that in the OLS estimation below, the residuals have zero correlation with each of the regressors.

13
Although the RE model is clearly superior to OLS and FE, it could potentially be improved by
the addition of time effects λt. I run the random-effects model adding 1-T restrictions (9
dummies) and then perform a Wald test under the null that they are jointly equal to zero. The
resulting Χ2(9)=127.28 is significant at the 1% level, indicating that time effects are jointly
significant and λt should be included in the model:
(3) �� ���� = �� + ������� + �� �� ���� + � �� �!��� + �" �� � ��� + #� + %� + $��
Similarly, I test for a presence of jointly significant space effects. Instead of using a dummy
for each facility (which would effectively amount to reverting back to an FE model), I use a
set of larger special dummies: one for each of the 19 dioceses. The corresponding test,
resulting in Χ2(18)=86.44, is again significant at the 1% level, warranting the inclusion of the
spatial dummies in the model and thus producing a mixed-effects (ME) model where DIO is a
vector of diocese dummies:
(4) �� ���� = �� + ������� + �� �� ���� + � �� �!��� + �" �� � ��� + &'()* + #� +
%� + $��
All four estimations so far implicitly assume stationarity and no autocorrelation. I run a series
of tests to verify the assumption of stationarity by checking for the presence of a unit root:
first through a series of regressions of ∆lnEFFit on lnEFFit-1, then through more formal
augmented Dickey-Fuller (ADF) tests such as the Fisher-type test suggested by Choi (2001)
and that of Im, Pesaran and Shim (2003).9 Both tests lead to reject the null of non-stationarity
at the 1% level, which is in line with the result of lagged regressions (in which the coefficient
of the lagged variable, δ=ρ-1, is significantly different from zero using the DF distribution).
On the other hand, when testing for first order autocorrelation in panel data (Wooldridge,
2002), I must reject the null of no first-order autocorrelation with F(1, 175)=34.330
9 The Im-Pesaran-shim test requires a balanced panel. In this case, stationarity can therefore only be tested on a balanced sub-panel.

14
significant at the 1% level. The model must therefore be able to correct for the auto-regressive
AR(1) process. FGLS fits a three-step feasible generalized least squares estimation with
heteroskedasticity across panels and an AR(1) process common to all panels (see Table 4 for
results).
Table 4 Cost-effectiveness – static models
(I) (II) (III) (IV) (V) OLS FE RE ME FGLS Dep. var. lnEFF lnEFF lnEFF lnEFF lnEFF PBF 0.800*** 0.673*** 0.682*** 0.393** 0.421*** (0.0901) (0.157) (0.132) (0.165) (0.151)
lnEXP -0.608*** -0.624*** -0.613*** -0.670*** -0.679*** (0.0357) (0.0386) (0.0345) (0.0314) (0.0183)
lnSTF 0.270*** 0.163** 0.204*** 0.244*** 0.248*** (0.0521) (0.0672) (0.0515) (0.0488) (0.0282)
lnBED 0.186*** 0.254*** 0.218*** 0.183*** 0.199*** (0.0335) (0.0469) (0.0320) (0.0305) (0.0183)
_cons 6.710*** 6.829*** 6.802*** 6.893*** 6.885*** (0.117) (0.196) (0.112) (0.154) (0.111)
FY dummies no no no yes yes
DIO dummies no no no yes yes
Robust errors yes yes yes yes no N 1380 1380 1380 1380 1372 R2 0.357 0.308 0.355 0.499 - Marginal effects; (Cluster-robust) standard errors in parentheses (d) for discrete change of dummy variable from 0 to 1 * p < 0.10, ** p < 0.05, *** p < 0.01
The static models developed so far seem to produce quite consistent results, with PBF having
a large, statistically significant, positive effect on cost-efficiency of service delivery.
However, 44% of observations are missing, making the panel extremely unbalanced. This is
mostly the result of the expansion of the dataset through time (there are only 76 observations
in 2001 but 175 in 2010), and to a lesser extent to attrition. Nevertheless it is important to
verify the possibility of non-random censoring. To do so, I apply the procedure proposed by
Nijman and Verbeek (1992) to test for non-random attrition in unbalanced panels. I separately

15
include three distinct variables in the estimation: a dummy considering the availability of
clinic i at t–1 (inlastfy), one that at t+1 (innextfy) and a count variable of the number of years
clinic i is present in the dataset (IN). While innextfy is statistically insignificant, inlastfy and
IN are significant at the 5% and 1% level respectively ( see Table 5), suggesting that the
censoring of the data is likely not completely random. This is not entirely surprising, as one
can easily imagine that facilities with better overall performance would also be the first ones
to report their results. Nonetheless, the non-random censoring makes it important to estimate
the model as a dynamic one in order to avoid biasedness.
Table 5 Nijman-Verbeek tests for balanced panel
(VI) (VII) (VIII) FGLS FGLS FGLS Dep. var. lnEFF lnEFF lnEFF PBF 0.426*** 0.286* 0.400*** (0.145) (0.155) (0.151)
lnEXP -0.680*** -0.695*** -0.679*** (0.0175) (0.0200) (0.0180)
lnSTF 0.246*** 0.264*** 0.236*** (0.0279) (0.0305) (0.0283)
lnBED 0.189*** 0.202*** 0.188*** (0.0164) (0.0192) (0.0186)
inlastfy 0.0429** (0.0170)
innextfy -0.0283 (0.0242)
IN 0.0146*** (0.00480)
_cons 7.316*** 6.898*** 6.852*** (0.108) (0.110) (0.112)
FY dummies yes yes yes
DIO dummies yes yes yes
Robust errors no no no N 1294 1184 1372 Marginal effects; Standard errors in parentheses (d) for discrete change of dummy variable from 0 to 1 * p < 0.10, ** p < 0.05, *** p < 0.01

16
Dynamic panel data models such as the GMM Arellano-Bond (1991) estimator, take first-
differences of the model to net out the fixed effects, and instrument the lagged dependent
variable with previous history. This procedure however suffers from the weak instrument
capacity of lagged levels with respect to first differences. Blundell and Bond (1998) add the
original equation in levels to the system, creating additional instruments: variables in levels
are instrumented with suitable lags of their own first differences. Also, Arellano and Bover
(1995) use the forward orthogonal-deviations (subtracting the average of all available future
observations), rather than first-differences, avoiding the explosive effect of differencing on
data gaps. Following Roodman (2009), I use a (panel-robust) two-step Blundel-Bond system
GMM estimator with forward orthogonal-deviations, both first differences and levels of the
independent variables as standard instruments (taking first differences as instruments in the
levels equation and levels as instruments for the transformed equation), and a GMM-style
instrument that collapses all available lags of the lagged dependent variable for each time
period into one moment (see Table 6). This model is clearly successful in eliminating serial
correlation (AR(2)), and the Nijman-Verbeek tests show no evidence of selection-bias.
17
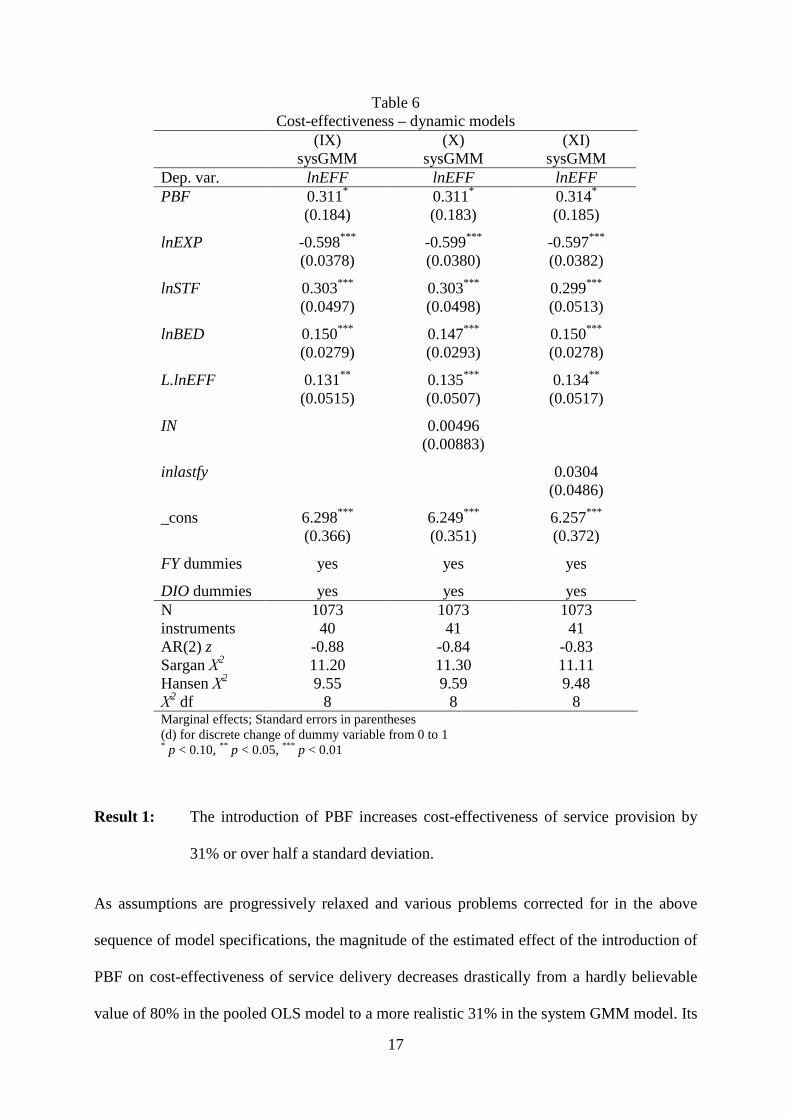
Table 6 Cost-effectiveness – dynamic models
(IX) (X) (XI) sysGMM sysGMM sysGMM Dep. var. lnEFF lnEFF lnEFF PBF 0.311* 0.311* 0.314* (0.184) (0.183) (0.185)
lnEXP -0.598*** -0.599*** -0.597*** (0.0378) (0.0380) (0.0382)
lnSTF 0.303*** 0.303*** 0.299*** (0.0497) (0.0498) (0.0513)
lnBED 0.150*** 0.147*** 0.150*** (0.0279) (0.0293) (0.0278)
L.lnEFF 0.131** 0.135*** 0.134** (0.0515) (0.0507) (0.0517)
IN 0.00496 (0.00883)
inlastfy 0.0304 (0.0486)
_cons 6.298*** 6.249*** 6.257*** (0.366) (0.351) (0.372)
FY dummies yes yes yes
DIO dummies yes yes yes N 1073 1073 1073 instruments 40 41 41 AR(2) z -0.88 -0.84 -0.83 Sargan Χ2 11.20 11.30 11.11 Hansen Χ2 9.55 9.59 9.48 Χ
2 df 8 8 8 Marginal effects; Standard errors in parentheses (d) for discrete change of dummy variable from 0 to 1 * p < 0.10, ** p < 0.05, *** p < 0.01
Result 1: The introduction of PBF increases cost-effectiveness of service provision by
31% or over half a standard deviation.
As assumptions are progressively relaxed and various problems corrected for in the above
sequence of model specifications, the magnitude of the estimated effect of the introduction of
PBF on cost-effectiveness of service delivery decreases drastically from a hardly believable
value of 80% in the pooled OLS model to a more realistic 31% in the system GMM model. Its

18
statistical significance also decreases in the process, but always remains safely below the10%
level. The result thus seems to be quite robust. To further check its robustness, I run six
alternative specifications of the system GMM model (see Table 7).
Table 7 Cost-effectiveness – robustness checks
(XII) (XIII) (XIV) (XV) (XVI) (XVII) sysGMM sysGMM sysGMM sysGMM sysGMM sysGMM Dep. var. lnEFF lnSUO lnOPD lnIPA lnOPS lnAPS PBF 0.378* 0.330* 0.305** 0.520*** 0.295 0.479*** (0.223) (0.172) (0.153) (0.151) (0.186) (0.129)
lnEXP 0.283*** 0.262*** 0.364*** -0.598*** -0.556*** (0.0375) (0.0338) (0.0677) (0.0341) (0.0635)
lnSTF -0.208*** 0.184*** 0.168*** 0.303*** 0.284*** 0.372*** (0.0471) (0.0446) (0.0429) (0.0912) (0.0470) (0.0967)
lnBED 0.0308 0.0984*** -0.0317 0.480*** -0.00433 0.494*** (0.0299) (0.0254) (0.0244) (0.0721) (0.0272) (0.0728)
_cons 5.330*** 4.705*** 4.326*** 2.132*** 2.325*** 5.851*** (0.428) (0.484) (0.373) (0.360) (0.288) (0.250)
L. dep. var. yes*** yes*** yes*** yes** yes*** yes**
FY dummies yes yes yes yes yes yes
DIO dummies yes yes yes yes yes yes N 1073 1081 1618 1596 1596 1217 instruments 39 40 40 40 40 40 AR(2) z -0.14 -0.28 -0.22 0.42 -0.93 0.44 Sargan Χ2 8.08 8.11 9.29 7.68 6.69 12.55 Hansen Χ2 6.25 6.21 5.57 6.80 5.73 10.30 Χ
2 df 8 8 8 8 8 9 Marginal effects; Standard errors in parentheses (d) for discrete change of dummy variable from 0 to 1 * p < 0.10, ** p < 0.05, *** p < 0.01
Result 2: The introduction of PBF increases the output of healthcare facilities, but the
effects are heterogeneous across different output types. Output of services with
high weights in the SUO increase the most.
In the first two specifications, I exclude expenditures (lnEXP) from to model (XII), and
estimate the effect of PBF introduction on output (SUO) rather than on cost-effectiveness

19
(EFF) (XIII). Both estimations yield a similar coefficient of PBF (still significant at the 10%
level),10 confirming that the result is not driven by the inherent relationship between
expenditures and cost-effectiveness (EFF = SUO / EXP), but rather by an increase of output
disproportional to changes in expenditures.11
This increase, however, is not equal across all the constituent services of the SUO. The
introduction of PBF seems to have a much bigger impact on inpatient admissions (IPA, see
model XV) than on outpatient visits (OPD, see model XIV).12 While PBF financing leads to
an increase in OPD perfectly proportionate to the increase in overall output (around 30%), its
effect on IPA is much larger at more than 50%.
Such a dramatic increase in the number of inpatients seems technically feasible as the average
bed occupancy remains below 40%. It is therefore quite possible that the health centers are
simply trying to meet their PBF targets by improving the areas of service provision in which
they are most underperforming. However, another explanation is also conceivable: Making
improvements where there is the most space for them can be a perfectly rational strategy, but
making changes with the highest relative pay-off could also be a very rational choice. Should
the relative weights of inpatient admissions and outpatient visits in the SUO be
disproportionate to their relative costs (in terms of labor and expenditures), a rational
healthcare provider would give priority to increasing the number of inpatients over outpatient
visits. A health center manager could also encourage its staff to admit patients whose
condition would normally warrant only outpatient treatment, and a dishonest (but still
rationally behaving) manager might even simply record outpatients as inpatients to increase
his reported SUO output.
10 The increase in output resulting from the introduction of PBF comes on top of all changes due to rising expenditures. A mean annual increase of expenditures of 4.3% as observed in my sample translates into an annual increase of output of circa 1.2%. 11 This should not come as much of a surprise since there is only a -0.2912 correlation between EFF and EXP. 12 Outpatient visits and inpatient admissions together comprise on average around 90% of SUO output.

20
While my data do not allow me to investigate the causes of the disproportionate effect of PBF
on output, the results seem to indicate that healthcare providers respond to the incentives they
face quite precisely. If the incentives are not well aligned with the objectives of the PBF
scheme, the response of the healthcare providers will likely not be entirely in line with the
objectives either. It is therefore of the utmost importance that the PBF targets and other such
incentives be designed with a careful attention to the objectives of the PBF scheme.
Regardless of the source of the heterogeneity in output growth, when growing expenditures
are taken account, it translates into a statistically insignificant impact of PBF on the number
of outpatient visits per million USh. of expenditure (OPS, model XVI),13 compared to a very
significant and large impact on the number of inpatient admissions per million USh. of
expenditure (APS, model XVII). The effect on APS is in fact so large and significant, the
effect of PBF on the overall cost-effectiveness of service delivery seems to remain robustly
and consistently at circa 30%.
(b) Quality
A meaningful measure of perceived quality of the health facilities can only be obtained from
respondents who had recently received treatment there. This can potentially introduce a
serious self-selection bias into the data. Before proceeding to a full model specification for
estimating the effect of introducing PBF on the perceived quality of healthcare delivery, I
therefore first estimate a bivariate sample-selection model as proposed by Heckman (1979) to
check for such a bias. As the results in Table 8 show (see model XVIII), none of the observed
individual characteristics affect the likelihood of choosing the private facility over a public
one. In other words, there is no detectable self-selection bias in the sample, and it is therefore
safe to estimate the PBF effects using a simple OLS model with cluster-robust standard errors.
13 Despite the loss of its significance, the coefficient of PBF in model XVI retains a similar value to those in the previous cost-effectiveness estimations. This is should not be much of a surprise since the SUO essentially standardizes all other services to the value of an outpatient visit.

21
I first estimate a specification with only the PBF dummy as a regressor (see model XIX), and
then gradually include the individual-level confounding characteristics and MQP until
reaching the full specification:
(5) �+� = �� + ������ + ���,� + � ��� + �"�!� + �-���� + �.�/ � + �0�+�1 + $�
where PBF is a dummy equal to one if the catholic facility receives funding through the PBF
scheme, PHI is a physical health index of the respondent, ASI is an asset index of the
respondent approximating wealth, LIT is a dummy equal to one when if the respondent reads
a newspaper on a regular basis, MAL is a dummy equal to one if the respondent is male, AGE
is the age of the respondent and MQP is the mean perceived quality of the nearby public
health facility (see Table 4 for descriptives). The estimations results are presented in Table 8.

22
Table 8 Perceived quality
(XVIII) (XIX) (XX) (XXI) (XXII) (XXIII) Heckman OLS OLS OLS OLS ATT Dep. var. PRV14 PQ PQ PQ PQ PQ PQ PBF -0.0598*** -0.0574** -0.0611** -0.0585** -0.0570** -0.070*** (0.0191) (0.0258) (0.0265) (0.0269) (0.0274) (0.017)
PHI 0.0664 0.0157 0.0298 0.0324 (0.266) (0.0319) (0.0358) (0.0305)
ASI 0.417 -0.00723 -0.0168 -0.0210 (0.433) (0.0458) (0.0479) (0.0452)
LIT 0.0339 -0.0164 -0.0111 -0.0113 (0.164) (0.0279) (0.0290) (0.0291)
MAL -0.00333 0.0192 0.0181 (0.172) (0.0181) (0.0170)
AGE 0.00289 0.00146** 0.00150** (0.00508) (0.000644) (0.000624)
MQP -0.802 -0.0824 (0.967) (0.177)
_cons 0.125 0.938*** 0.864*** 0.862*** 0.796*** 0.823*** (0.431) (0.108) (0.0195) (0.0229) (0.0456) (0.0796) N 303 165 200 169 165 165 204 p 0.00170 0.00170 0.0259 0.0742 0.0003 0.0000 Mills λ -0.107 (0.149) R2 0.0494 0.0634 0.108 0.136 (Cluster-robust) standard errors in parentheses (d) for discrete change of dummy variable from 0 to 1 * p < 0.10, ** p < 0.05, *** p < 0.01
Result 3: The introduction of PBF leads to a decrease in perceived quality of services of
6 percentage points or almost half a standard deviation.
The estimation results in Table 8 reveal that the introduction of PBF seems to have decreased
the perceived quality of healthcare services by around 6% (i.e. almost half a standard
deviation). This result holds across all the specification controlling for various individual
characteristics (models XIX-XXI), the perceived quality of the main alternative healthcare
providers – the nearest similarly-sized public facilities (model XXII), and correcting for a
14 PRV is a dummy equal to one if the respondent had visited the private facility within 3 years prior to the interview.
23
potential self-selection bias (model XVIII). To further check the robustness of the result, I
also estimate the average treatment effect on the treated using individual-level kernel-based
matching based on a propensity score constructed from the individual confounding
characteristics (model XXIII), which suggests that the significantly negative effect might even
be underestimated.15 The dramatic increases of output and the associated improvements in the
cost-efficiency of service provision thus seem to go hand in hand with a decline in the quality
of provided services, at least as perceived by the patients. Given the incentive structure of the
PBF scheme with its emphasis on output targets, this should be of little surprise: the easiest
way of boosting output using the same resources is often to compromise on the quality of the
product.
5. CONCLUSIONS
Using a unique panel of output and expenditure data from small private not-for-profit
healthcare facilities in Uganda in combination with a patient survey focused on the perceived
quality of healthcare, I estimate the contribution of performance-based financing towards
achieving some of its proclaimed objectives. In particular, I study the effects of PBF
introduction on the cost-efficiency of service provision and on the perceived quality of the
services; the former being of high importance especially in the context of the underfunded
healthcare systems in developing countries, and the latter as a key determinant of service
utilization.
I find that healthcare providers respond strongly to output targets by increasing output. The
output growths is achieved primarily through greater cost-effectiveness of service provision,
15 I use kernel-based matching and bootstrapped standard errors to minimize the variance of the estimations. While low variance may come at a cost of an increased bias due to the inclusion of very imperfect matches (Caliendo & Kopeinig, 2008), this should not be an issue in my case as average treatment effects on the treated calculated using nearest neighbor matching (model XXIV) and stratification matching (model XXV), which ensure a better match – and thus smaller bias – at a cost of higher variance, are largely similar (see Appendix 2).

24
but the effects seem to considerably vary depending on the type of service with the strongest
impact on inpatient admissions. This could be due to a relatively low utilization of inpatient
facilities prior to the introduction of PBF which leaves ample space for potential
improvement. However, given the generally strong response of healthcare providers to
financial incentives, it could also be a result of inappropriate weights given to various
components of the SUO, i.e. a misdesigned incentive structure. Although my data cannot
provide a conclusive evidence for the source of this heterogeneity, it illustrates the importance
of a good alignment of the incentive structure with the objectives of the PBF scheme. This is
highlighted further by the finding that the improvements in output and cost-effectiveness
seem to come at the cost of lower service quality, at least as perceived by the patients. In
short, PBF demonstrates great potential and some limited success, but – at least as
implemented in the investigated case – it is hardly the magic bullet that many would like it to
be.
These results are based on a non-random experiment with a very small treatment group, and
should therefore be taken with a pinch of salt. Moreover, the positive effects of PBF on output
and efficiency could partially be due to a placebo effect (facility managers know that they are
part of a pilot and may try to make a good impression) or to more careful recording of output
in the PBF facilities – whose income depends on the records – than in the control ones – who
may see the records as an unnecessary administrative burden. Nonetheless, a clear pattern
seems to emerge from the analysis: The rationality of healthcare providers is such that only
the objectives that are directly reflected in the incentive structure of PBF schemes seem to be
met. When the incentives disproportionately favor – or are limited to – certain output targets,
the success of the PBF scheme will also likely be limited to increased output of a particular
kind, leaving other objectives unaffected, or possibly even undermined. With healthcare
improvements playing an instrumental role in global development efforts and PBF emerging

25
as one of the favorite tools for their achievement, these findings could have far-reaching
consequences.
It is therefore essential that these preliminary results be verified by further investigations
using more comprehensive and reliable data than the present study. If confirmed, they would
show a serious need for a revision of the way in which healthcare provision is often
incentivized. In order to avoid adverse effects, “performance” in PBF would have to be
defined in terms of measures directly and accurately related to all its objectives. A successful
PBF scheme would thus have to include not only carefully designed output targets, but also
ones for service quality or any other measure depending on the specific policy objectives at
hand.

26
REFERENCES
Arellano, M, & Bover, O. (1995). Another look at the instrumental variable estimation of error-components models. Journal of econometrics, 68(August 1990), 29–51.
Arellano, Manuel, & Bond, S. (1991). Some tests of specification for panel data: Monte Carlo evidence and an application to employment equations. The Review of Economic Studies, 58(2), 277–297.
Baltussen, R. M. P. M., Yé, Y., Haddad, S., & Sauerborn, R. S. (2002). Perceived quality of care of primary health care services in Burkina Faso. Health policy and planning, 17(1), 42–8.
Banerjee, A. V, Glennerster, R., & Duflo, E. (2008). Putting a Band-Aid on a Corpse: Incentives for Nurses in the Indian Public Health Care System. Journal of the European Economic Association, 6, 487–500.
Basinga, P., Gertler, P. J., & Vermeersch, C. M. J. (2010). Paying Primary Health Care Centers for Performance in Rwanda (World Bank Policy Research Working Paper No. 5190).
Bloom, D. E., & Canning, D. (2000). The Health and Wealth of Nations. Science, 287(5456), 1207–1209.
Blundell, R., & Bond, S. (1998). Initial conditions and moment restrictions in dynamic panel data models. Journal of Econometrics, 87(1), 115–143.
Brenzel, L. (2009). Taking Stock: World Bank Experience with Results-Based Financing for Health (World Bank Technical Brief).
Caliendo, M., & Kopeinig, S. (2008). Some practical guidance for the implementation of propensity score matching. Journal of economic surveys, 22(1), 31–72.
Choi, I. (2001). Unit root tests for panel data. Journal of International Money and Finance, 20(2), 249–272.
Duong, D. V, Binns, C. W., & Lee, A. H. (2004). Utilization of delivery services at the primary health care level in rural Vietnam. Social science & medicine (1982), 59(12), 2585–95.
Eichler, R. (2006). Can “pay for performance” increase utilization by the poor and improve the quality of health services (Discussion paper for the first meeting of the Working Group on Performance-Based Incentives at the Center for Global Development).
Eldridge, C., & Palmer, N. (2009). Performance-based payment: some reflections on the discourse, evidence and unanswered questions. Health Policy and Planning, 24(3), 160–6.
Health Sector Strategic Plan III: 2010/11-2014/15. (2010). Kampala: Government of Uganda.

27
Hecht, R., Batson, A., & Brenzel, L. (2004). Making Health Care Accountable. Finance & Development, (March), 16–19.
Heckman, J. (1979). Sample selection bias as a specification error. Econometrica, 47(1), 153–161.
Im, K. S., Pesaran, M. H., & Shin, Y. (2003). Testing for unit roots in heterogeneous panels. Journal of Econometrics, 115(1), 53–74.
Kinoti, S. (2011). Effects of Performance Based Financing on Maternal Care in Developing Countries: Access, Utilization, Coverage, and Health Impact Rapid Review of the Evidence (USAID Rapid Review of Evidence).
Meessen, B., Kashala, J.-P. I., & Musango, L. (2007). Output-based payment to boost staff productivity in public health centres: contracting in Kabutare district, Rwanda. Bulletin of the World Health Organization, 85(2), 108–115.
Meessen, B., Musango, L., Kashala, J.-P. I., & Lemlin, J. (2006). Reviewing institutions of rural health centres: the Performance Initiative in Butare, Rwanda. Tropical medicine & international health, 11(8), 1303–1317.
Morgan, L. (2010). Some days are better than others: lessons learned from Uganda’s first results-based financing pilot (World Bank Report No. 53985).
Nijman, T., & Verbeek, M. (1992). Nonresponse in panel data: The impact on estimates of a life cycle consumption function. Journal of Applied Econometrics, 7(3), 243–257.
Peabody, J. W., Tozija, F., Muñoz, J. a, Nordyke, R. J., & Luck, J. (2004). Using vignettes to compare the quality of clinical care variation in economically divergent countries. Health services research, 39(6), 1951–70.
Perrot, J., de Roodenbeke, E., Musango, L., & Fritsche, G. (2010). Performance Incentives for Health Care Providers (WHO/HSF/HSS Discussion Paper No. 1).
Roodman, D. (2009). How to do xtabond2: An introduction to difference and system GMM in Stata. The Stata Journal, 9(1), 86–136.
Rusa, L., Schneidman, M., Fritsche, G., & Musango, L. (2009). Rwanda: Performance-Based Financing in the Public Sector. In R. Eichler & R. Levine (Eds.), Performance Incentives for Global Health: Potential and Pitfalls (pp. 190–214). Washington, D.C.: Center for Global Development.
Sahn, D., & Stifel, D. (2003). Exploring alternative measures of welfare in the absence of expenditure data. Review of Income and Wealth, 49(4), 463–489.
Sekabaraga, C., Diop, F., & Soucat, A. (2011). Can innovative health financing policies increase access to MDG-related services? Evidence from Rwanda. Health Policy and Planning, 26, ii52–ii62.

28
Soeters, R., Habineza, C., & Bob, P. (2006). Performance-based financing and changing the district health system : experience from Rwanda. Bulletin of the World Health Organization, 84(11), 884–889.
Soeters, R., Peerenboom, P. B., Mushagalusa, P., & Kimanuka, C. (2011). Performance-Based Financing Experiment Improved Health Care in the Democratic Republic of Congo. Health Affairs, 30(8), 1518–1527.
Ware, J. E. J., Kosinski, M., & Keller, S. D. (1996). A 12-Item Short-Form Health Survey of Scales and Preliminary Construction Tests of Reliability and Validity. Medical Care, 34(3), 220–233.
Wiggins, V., & Poi, B. (2001). How do I test for panel-level heteroskedasticity and autocorrelation? Frequently Asked Questions on using Stata. Retrieved from http://www.stata.com/support/faqs/statistics/panel-level-heteroskedasticity-and-autocorrelation/
Wooldridge, J. M. (2002). Econometric analysis of cross section and panel data. Cambridge, MA: The MIT Press.

29
APPENDICES
Appendix 1 How satisfied were you with...
a. the way the health centre staff treated you?
b. the competence of the staff
c. the availability of treatment at the health centre?
d. the quality of treatment?
e. the waiting time at the health centre?
f. the cleanliness of the health centre’s facilities?
g. the way health centre staff listen to comments, complaints and suggestions?
└──┘
└──┘
└──┘
└──┘
└──┘
└──┘
└──┘
1. Completely satisfied 2. Quite satisfied 3. A little bit satisfied 4. A little bit dissatisfied 5. Quite dissatisfied 6. Completely dissatisfied
Appendix 2 Perceived quality – average treatment effects
(XXIV) (XXV) ATT
(nearest neighbor) ATT
(stratification) Dep. var. lnEFF lnEFF PBF -0.073*** -0.065*** (0.023) (0.022) N 163 169 Average treatment effect on the treated Bootstrapped standard errors in parentheses * p < 0.10, ** p < 0.05, *** p < 0.01