Performance-Based Communication Tools for Maintenance...
20
11th National Conference on Transportation Asset Management July 12th, 2016 Rob Zilay Performance-Based Communication Tools for Maintenance Budgets
Transcript of Performance-Based Communication Tools for Maintenance...
11th National Conference on Transportation Asset Management July 12th, 2016 Rob Zilay
Performance-Based Communication Tools for Maintenance Budgets

Presentation Outline
• Performance-based maintenance tools overview • Communicating needs
– Know your decision makers – Establish credibility – Maintain trust – Accountability

Overview
• Performance-based budgeting – A systematic way to allocate funds – Addresses gap between available resources and
maintenance needs – Quantifies and prioritizes work backlog – Provides compelling budget information – Effectively communicates impact of doing nothing – An approach for achieving near- and long-term asset
performance goals

Performance-Based Budget Model
Budgeting Process
Maintenance Accomplishment Data
Labor Equipment
Materials Productivity
Asset Inventory
Performance Guidelines
Asset Level of Service
Performance Targets
Customer Survey Data

Performance-Based Budget Model
Budget Model Output 2015 Statewide
Group Feature Current LOS
Target LOS
Target FY
Yrs to Target Activity Description LOE Qty Units % Distrib. Factor Annual Work
Quantity Units Labor Equipment Materials Expenditure Total
1505 ROUTINE FENCE MAINTENANCE 1,697,986 LIN FT 79.33 1.00 1,375,084 LIN FT 1,652,159$ 472,779$ 292,821$ 2,688$ 2,420,448$ 1510 ACCIDENT-CHAIN LINK FENCE REPAIR 1,697,986 LIN FT 2.58 1.00 31,610 LIN FT 118,999$ 48,185$ 57,775$ 477$ 225,436$ 1511 ACCIDENT BARBED WIRE FENCE REPAIR 1,697,986 LIN FT 4.37 1.00 53,557 LIN FT 90,520$ 26,482$ 14,373$ 75$ 131,450$ 9154 CONTRACT FENCE INSPECTION & MINOR REPA 1,697,986 LIN FT 0.13 1.00 2,324 LIN FT -$ -$ -$ 23,237$ 23,237$ 9156 CONTRACT NEW FENCE INSTALLATION 1,697,986 LIN FT 13.58 1.00 235,412 LIN FT 2,878$ 446$ -$ 975,297$ 978,621$
100.00 1,864,556$ 547,892$ 364,969$ 1,001,774$ 3,779,191$ 1503 ACCIDENT GUARDRAIL REPAIR 1,130,026 LIN FT 10.90 1.00 58,504 LIN FT 701,987$ 340,740$ 729,172$ 1,532$ 1,773,431$ 1512 ROUTINE GUARDRAIL REPAIR 1,130,026 LIN FT 85.33 1.00 1,026,129 LIN FT 354,242$ 100,945$ 128,903$ 161$ 584,251$ 9153 CONTR GR INSTAL & REPAIR-ADOT FURN MATL 1,130,026 LIN FT 2.59 1.00 31,172 LIN FT -$ -$ 336,198$ 682,493$ 1,018,691$ 9155 CONTR GR INSTAL/RPR-CONTRACT FURN MATL 1,130,026 LIN FT 1.18 1.00 14,221 LIN FT 253$ 112$ -$ 1,273,714$ 1,274,079$
100.00 1,056,482$ 441,797$ 1,194,273$ 1,957,900$ 4,650,452$ 1520 CRASH ATTENR. (GUARDR.) REPAIR-ACCIDENT 8,842 LIN FT 96.82 1.00 8,719 LIN FT 64,475$ 23,007$ 548,972$ 7,651$ 644,105$ 1590 OTHER ROADSIDE MAINTENANCE 8,842 LIN FT 3.18 2.00 247 LBR HRS 4,124$ 2,290$ 317$ 1,621$ 8,352$
100.00 68,599$ 25,297$ 549,289$ 9,272$ 652,457$ 1507 MECHANICAL SWEEPING 11,145 12-FT LM 48.84 1.00 5,444 12-FT LM 325,994$ 380,458$ 1,933$ 817$ 709,203$ 9157 CONTRACT MECHANICAL SWEEPING 11,145 12-FT LM 51.16 1.00 5,701 12-FT LM -$ -$ -$ 190,790$ 190,790$
100.00 325,994$ 380,458$ 1,933$ 191,607$ 899,992$ 1501 FULL-WIDTH LITTER PICK-UP 40,895 ACRES 16.01 1.00 6,548 ACRES 86,295$ 22,335$ 10,836$ 754$ 120,220$ 1502 SPOT LITTER & DEBRIS PICK-UP 40,895 ACRES 71.77 3.00 88,045 LBR HRS 2,073,061$ 670,001$ 9,754$ 51,166$ 2,803,982$ 1535 REMOVAL OF DEAD ANIMALS FROM RDWY{NE 40,895 ACRES 12.22 1.00 4,998 LBR HRS 137,766$ 35,716$ 1,284$ 11,412$ 186,178$
100.00 2,297,122$ 728,052$ 21,874$ 63,332$ 3,110,380$ 131 BLADE UNPAVED SHOULDERS 17,101 12-FT LM 93.67 1.45 23,299 - 77,356$ 92,029$ 7,432$ -$ 176,818$ 132 REPAIR / REMOVE SHOULDERS 17,101 12-FT LM 6.33 49.00 53,056 - 468,873$ 604,934$ 113,317$ -$ 1,187,123$
100.00 546,229$ 696,963$ 120,749$ -$ 1,363,941$ 1603 CLEAN CUTS/CHANNELS/DIKES/EMBANK CURB 2,473,952 LIN FT 84.32 1.00 2,085,997 LIN FT 837,056$ 928,530$ 120,221$ 6$ 1,885,813$ 1604 MINOR SLIDE REMOVAL 2,473,952 LIN FT 3.79 20.00 1,876,362 SQ FT 2,839,478$ 2,412,901$ -$ -$ 5,252,379$ 1690 OTHER DRAINAGE MAINTENANCE & REPAIR 2,473,952 LIN FT 11.89 0.02 5,883 LBR HRS 147,770$ 163,346$ 31,488$ 648$ 343,251$
100.00 3,824,303$ 3,504,777$ 151,709$ 654$ 7,481,443$
1603 CLEAN CUTS/CHANNELS/DIKES/EMBANK CURB 1,972,667 LIN FT 100.00 1 1,972,667 LIN FT 791,579$ 878,084$ 113,690$ 5$ 1,783,358$
100.00 791,579$ 878,084$ 113,690$ 5$ 1,783,358$ 1601 ROUTINE DRAINAGE MAINTENANCE 96,181 EACH 18.22 1 17,522 EACH 556,619$ 432,233$ 55,496$ 2,609$ 1,046,957$ 1602 EMERGENCY DRAINAGE MAINTENANCE 96,181 EACH 1.43 1 1,368 EACH 105,068$ 113,332$ 9,300$ -$ 227,700$ 1690 OTHER DRAINAGE MAINTENANCE & REPAIR 96,181 EACH 0.28 2 535 LBR HRS 13,433$ 14,849$ 2,862$ 59$ 31,204$ 9114 CONTRACT HYDRO VACUUM-ST PROV TRF CNT 96,181 EACH 80.08 1 77,024 EACH 14,551$ 21,734$ 13$ 117,749$ 154,047$
100.00 689,671$ 582,148$ 67,671$ 120,417$ 1,459,908$
B+
Guardrail
1B+C+Unpaved Ditches
Litter
Impact Attenuators
C+
LOS-BASED WORK PROGRAM AND BUDGET - MAINTENANCE
1Fence
B- A
Annual Budget (For LOS-Rated Assets Only)
A 1
A
B-
1
1
B+
B-
2016
Drai
nage
Road
side
1B+B
2020
2016
Pipes & Culverts
2016
2016
2016
2016
Channels
B+
Sweeping
Shoulders
2016
2016
1
C+
B- 1
1AA+

Overview
• Level of service (LOS) scorecard format is easily understood – Provides measured asset performance – Used as input for developing performance targets
Average Condition Ratings - 2014 Asset A B C D F
Roadside Fence C+ Roadside Guardrail B Roadside Impact Attenuators B Roadside Length Requiring Sweeping (CL Miles) C+ Roadside Length Requiring Litter Patrol (CL Miles) C- Drainage Ditch A Drainage Lined Channels (Miles) B- Drainage Pipes & Culverts (Each) B-
Paved Surfaces Alligator Cracks (Maintenance Lane Miles) B- Paved Surfaces Bleeding (Maintenance Lane Miles) A Paved Surfaces Cracks > 1/4" (Maintenance Lane Miles) B Paved Surfaces Potholes (Count) C- Paved Surfaces Raveling (Maintenance Lane Miles) A-

Overview
• Year-over-year LOS trends effectively communicate the impact of funding decisions
Statewide - All Routes - 2010 Condition Ratings
Asset A B C D F
Asphalt
Potholes B Stripping (Raveling) B+
Shoving D+
Concrete
Spalling C- Faulting C- Joint Sealing A+ Punchouts D Pumping B-
Paved Shoulder
Potholes B Edge Raveling B
Sweeping F
Unpaved Shoulder
Dropoff F High Shoulder D-
Statewide - All Routes - 2011 Condition Ratings
Asset A B C D F
Asphalt
Potholes B+ Stripping (Raveling) B
Shoving D+
Concrete
Spalling D- Faulting F Joint Sealing C- Punchouts F Pumping D+
Paved Shoulder
Potholes C+ Edge Raveling B-
Sweeping D
Unpaved Shoulder
Dropoff D+ High Shoulder C-

Communicating Needs
• Know your audience – Senior DOT management – Transportation commission – Budget director and staff – Strategic planning and staff – Governor's office and staff – Budget committees – Legislature
Communicating Needs
• Speak their language – It’s not what it is, it’s what it means to them! – Early buy-in – Focus on hot buttons
• Business-minded: ROI • Attorneys: Risk • Legislators: Customer satisfaction • Key issues unique to districts/divisions/regions

Communicating Needs
• Establish credibility – Good data – Transparent, formula-driven process – More analysis, less reliance on judgment
• Maintain trust – Data – Graphics – Simulations

Communicating Needs
Data
0 1.9 1.9 7.8 7.8 14.2 14.2 19.0
0.00 1.90 1.90 7.80 7.80 14.20 14.20 19.00
Distr.(%)0.8
99.20.00.0
100.0
LOE (Work Units / Inventory Unit) 0.098 0.059 0.000
C
-88,862 -9,8740 0
LOE CWork Program Adjust. Needed: LOE A LOE B
050,849 -9,874
7,676
Converted
LIN FT
LIN FT
7,676
LIN FTLIN FT
7,676
LIN FT
0.000 0.000 0.000
0.00 0.00
TargetLOE F
7,615
987,360
LOE D
7,676
7,676-65,166
F Conv. Factor>19 1.000
19.00
Maintenance Feature Name: Guardrail
UOM LOS A B CRange:
Midpoint: 19
D
0.95 4.85% Deficient
>1916.60
11.00
Average Annual Work Quantity:Activity UOM Avg. Quantity
100Applic. Quantity
4.85
Units
% Applicable
16.60Converted UOM Range:
11.00
% Deficient Midpoint: 0.95
Conv. UnitsLIN FT
Conv. Factor Conv. Quantity61 1.0000 611503 LIN FT 61
1512 LIN FT 7,615 100LIN FT 0 100
7,615 1.0000
9155 LIN FT 0 1000 1.0000 00 1.0000 0
9153
Total =
5,280
Current LOS = 10.000 10.000
Inventory: Guardrail Miles 187
Current Program 7,676 7,676
0.00 0.00LOE Factor 12.64 7.620
Difference 89,356Total Program 97,032 58,525
LOS

Communicating Needs
Graphics: Visual representation of LOS
LOS A: This pavement is in very good to perfect
condition. LOS C: This pavement is in fair condition with fair ride
quality.
LOS F: This pavement is impassable.
LOS B: This pavement is in good condition with good ride
quality.
LOS D: This pavement is in poor condition with poor ride
quality.

Communicating Needs
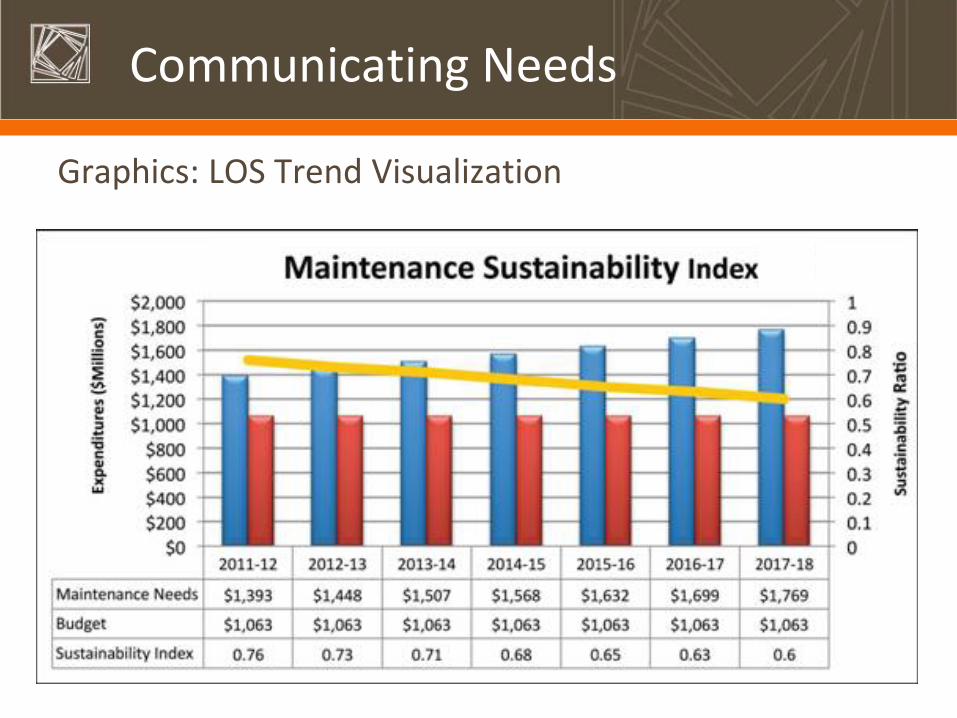
Graphics: LOS Trend Visualization Northwest North Central Olympic Southwest South Central Eastern
Targets4B1 Movable & Floating Bridges B B+ B+ D6B1 Signal Systems C D B C+ A C+ D5B1 Snow & Ice C+ C A- B- B A- B-4B2 Keller Ferry B B4B3 Urban Tunnels B- B4A2 Structrual Bridge C F+ A- C+ A- A- C6A4 Regulatory Signs C A- C D B B- C2A5 Slope Repair C+ A B A B+ B+ C+6B3 ITS C C B F A+ C+ A-2A3 Catch Basins C+ B- A- B+ B+ B- B+1A1 Pavement Patching & Repair B- B+ B+ A A A C+4A1 Bridge Decks C- B A A A B B-6A7 Guardrail B+ B+ A A A A A6A1 Striping B- C B B+ A- B C6A2 Raised/Recessed Markers C C A B C B- B3A4 Veg Obstructions C C- B C B+ A- C+1A2 Crack Sealing C- B D+ B B C+ C-7B1 Rest Areas B B- B B B+ B+ B1A4 Sweeping B A A+ B+ A A+ A+2A1 Ditches C C+ A A- A B+ B6B2 Hwy Lighting B A A- A B+ A A6A6 Guide Posts D+ D+ C C C- C- C1B1 Safety Patrol C A C- D C B B-2A2 Culverts D+ B- C+ C C+ C+ C-6B4 Permits B B B B C B B6A3 Pavement Marking D+ C B C C+ C+ C-3A2 Noxious Weeds B A A A A C+ A-1A3 Shoulder Maint C+ B B B+ C+ B B-6A5 Guide Signs B- A B+ D+ B+ A- B-2A4 Detention Basins C C C C C C C4A3 Bridge Cleaning C B+ A- B B+ A- B+3A3 Nuisance Weeds B- A- A A- B+ B- B+3A5 Landscape C- C- C C+ C C-3A1 Litter D+ F+ C D C D C-
Red = missed region targetBlue = missed state target State Targets Missed - 1 Region Targets Missed - 19
2004 Northwest North Central Olympic Southwest South Central EasternTargets
4B1 Movable & Floating Bridges B+ A+ A A+6B1 Signal Systems C+ B- C F+ D+ C- C-5B1 Snow & Ice A- A B+ A A A B+4B2 Keller Ferry B B4B3 Urban Tunnels B B4A2 Structrual Bridge C D A+ D+ F+ F F+6A4 Regulatory Signs C+ D C+ B+ C+ D D-2A5 Slope Repair B A- A A A+ A A6B3 ITS B- A A- A D A- C+2A3 Catch Basins B D+ C C C C+ F+1A1 Pavement Repair & Crack Seal B B- C A- B+ C C+4A1 Bridge Decks B- C- A- C B C- D 6A7 Guardrail A B B A B A+ B+6A1 Striping C+ C- C- C C- C- C6A2 Raised/Recessed Markers B C- A+ C+ F F+ C3A4 Veg Obstructions B- F- A D B A+ C-7B1 Rest Areas B B- B- B B B B1A4 Sweeping B+ A+ A+ A A- A A2A1 Ditches B B- B+ A B A+ B+6B2 Hwy Lighting B+ D D+ B D B A6A6 Guide Posts C- D+ D+ C D F D1B1 Safety Patrol C+ B C- C C C- C 2A2 Culverts C F+ F+ C D D F6B4 Permits6A3 Pavement Marking C- C- D+ D C C C3A2 Noxious Weeds B A A A+ A+ D+ D+1A3 Shoulder Maint B- A A B+ A C- B-6A5 Guide Signs B- C A- A B C+ B2A4 Detention Basins C4A3 Bridge Cleaning C B B B+ C B- B3A3 Nuisance Weeds B- A+ B+ B A+ D+ A-3A5 Landscape C- D C- D D+ C-3A1 Litter C- D D+ D D D B
Red = missed region target StateTargets Missed - 16 Region Targets Missed - 85Blue = missed state target
2008
State Targets Missed – 1 Region Targets Missed - 19 State Targets Missed – 16 Region Targets Missed - 85
Missed State Target
Missed Region Target Key:
Communicating Needs
Graphics: LOS Trend Visualization

Communicating Needs
F
D
C
B
A
LOS Scorecard- RADAR Chart
Communicating Needs
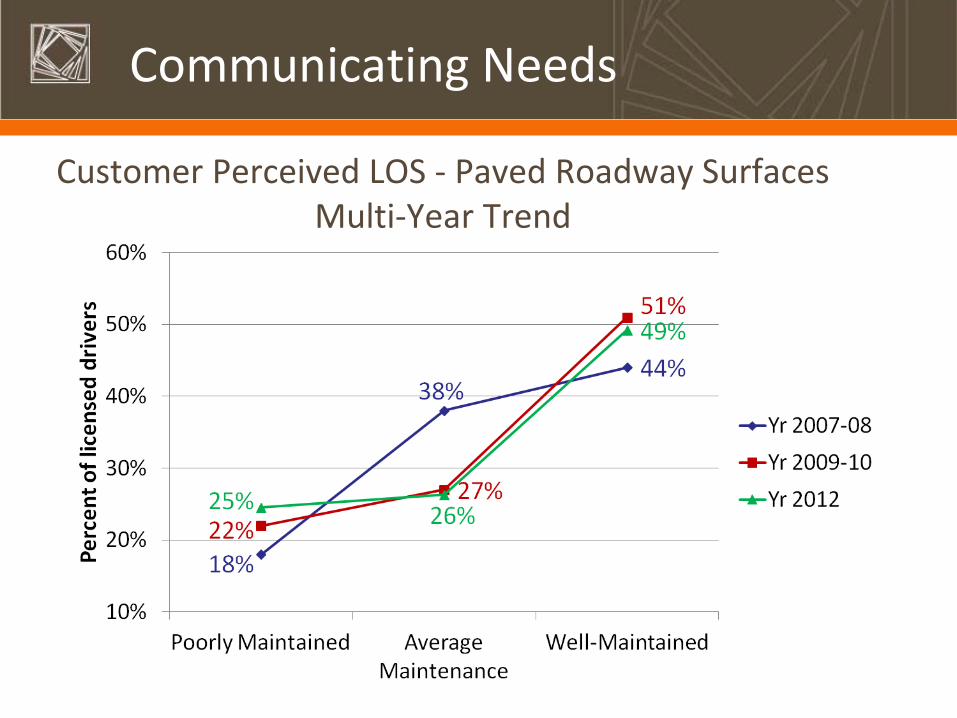
Customer Perceived LOS - Paved Roadway Surfaces Multi-Year Trend
Communicating Needs
• Simulations – Budget model “what if” analyses – May include decision makers in a budget workshop – Can be used to demonstrate impact of funding levels – Set expectations for actual budgeted funds

Communicating Needs
Current LOS Current Budget Target LOS Target Budget Target LOS Target Budget Target LOS Target BudgetTotal Budget 143,649,000$ 166,631,622$ 151,756,026$ 149,181,892$
Unallocated Funds 17,000,000$ 19,500,000$ 19,500,000$ 19,500,000$ Non-LOS Spending 72,465,373$ 72,465,373$ 72,465,373$ 72,465,373$
LOS Spending 54,183,627$ 74,666,249$ 59,790,653$ 57,216,519$
Length Requiring Litter Patrol (Phx) B- 312,928$ A 449,614$ A 358,489$ A 340,264$ Length Requiring Litter Patrol (non-Phx) A+ 1,377,521$ C- -$ C- 290,180$ C- 725,117$
5-Yr Goal
3,400,808$
1,631,882$
4,126,374$
1,783,358$
1,459,908$
1,478,879$
15,854,291$
3,814,785$
5,187,493$
A 661,265$
3,588,870$
B+ 2,975,445$
3-Yr Goal
B
B+
A
A
B+
B-
B+
B
A+
C-
1,335,915$
5,812,465$
Drainage
Ditch
Lined Channels
Pipes & Culverts
Paved Surfaces
Alligator Cracks
Bleeding
Cracks > 1/4"
Cracks < 1/4"
Potholes
Raveling
Group Feature
Roadside
Fence
Guardrail
Impact Attenuators
Length Requiring Sweeping
Shoulders
C+
B-
B-
C
D+
B+
B
B+
C+
A
C+
C
B+
B-
663,467$
689,602$
1,351,232$
338,893$
1,623,039$
1,455,676$
702,743$
463,416$
6,603,889$
2,177,664$
B+ 3,109,402$
A
A 759,803$
B+ 1,337,093$
B 1,955,093$
A 731,723$
B+ 1,342,749$
B 1,308,613$
A 3,376,554$
Current Data
A
2,774,508$
3,058,079$
3,779,191$
4,650,452$
B+
B-
A+ 652,457$
1-Yr Goal
900,206$
1,308,816$
A 659,797$
B+ 1,676,479$
B- 1,457,087$
B- 961,455$
B+ 5,593,708$
C 5,674,188$
C- 2,585,379$
A+ 1,434,571$
B 4,706,340$
B+ 1,655,103$
B- 1,456,522$
B- 857,970$
B+ 3,541,591$
C 6,046,068$
C- 2,422,293$
A+ 1,395,109$
B 4,822,333$

Communicating Needs
• Accountability – Evaluation phase – Planned vs. actual analysis – Did we achieve our targets based on budget?
• If not, why?
– Use results to improve next year’s performance-based budgeting process